

Pelin Ay
3.5k Жариялаулар

Pelin Ay
Хабарлау
Пайдаланушыны блоктау
Yazar/Analist/Trader

BTC ұстаушы
Жиі сауда жасайтын трейдер
5.9 жыл
31 Жазылым
5.5K+ Жазылушылар
7.3K+ лайк басылған
Жазбалар
Барлығы
Баға ұсыныстары
Видеолар
·
--
📈 $TRX · 1H
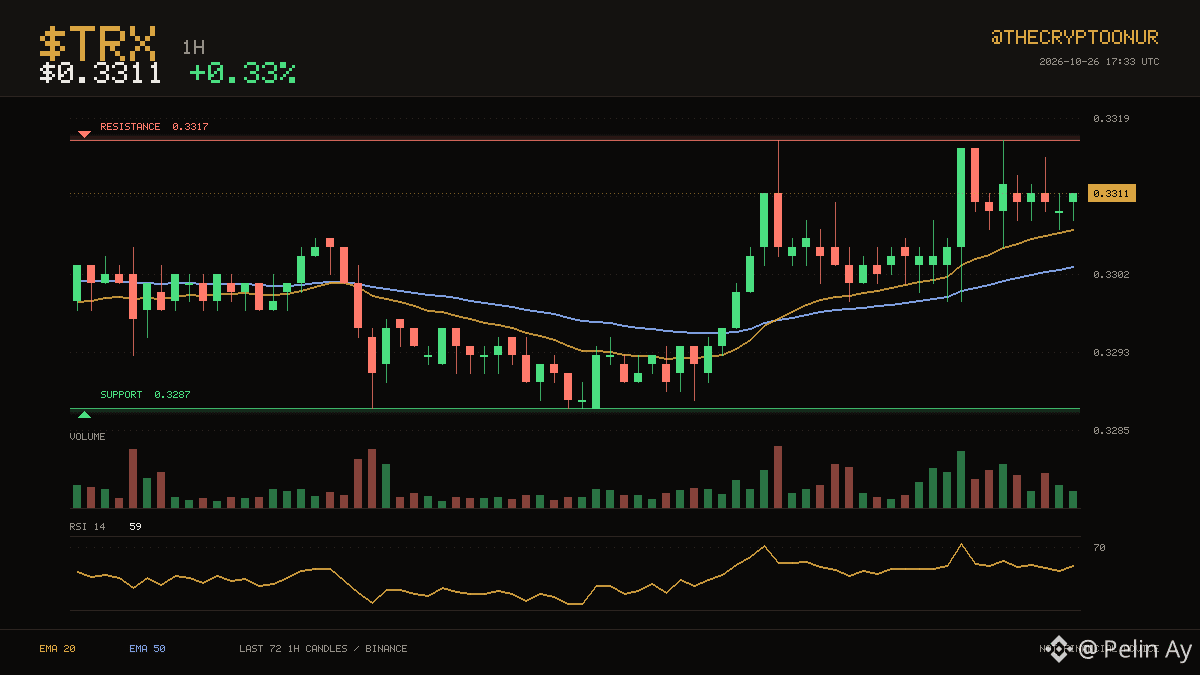
$TRX sits at $0.3311, with the 20 and 50 hourly averages both below price. The last three days topped out near $0.3317, and price is pressing that area again. It is trading in the top third of the range right now. Resistance is only 0.2% away, so there is not much room before it matters. Averages have been ordered the same way for 22 candles, with the 20 above the 50. Momentum is mid range with RSI at 59. The 24 hour range runs $0.3299 to $0.3317, and price is around the middle of it. Volume is close to normal at 1.1x the recent average. Up 0.3% over 24 hours.
DYOR
$TRX #Crypto
📈 $TRX · 1H
$TRX sits at $0.3311, with the 20 and 50 hourly averages both below price. The last three days topped out near $0.3317, and price is pressing that area again. It is trading in the top third of the range right now. Resistance is only 0.2% away, so there is not much room before it matters. Averages have been ordered the same way for 22 candles, with the 20 above the 50. Momentum is mid range with RSI at 59. The 24 hour range runs $0.3299 to $0.3317, and price is around the middle of it. Volume is close to normal at 1.1x the recent average. Up 0.3% over 24 hours.
DYOR
$TRX #Crypto
$TRX sits at $0.3311, with the 20 and 50 hourly averages both below price. The last three days topped out near $0.3317, and price is pressing that area again. It is trading in the top third of the range right now. Resistance is only 0.2% away, so there is not much room before it matters. Averages have been ordered the same way for 22 candles, with the 20 above the 50. Momentum is mid range with RSI at 59. The 24 hour range runs $0.3299 to $0.3317, and price is around the middle of it. Volume is close to normal at 1.1x the recent average. Up 0.3% over 24 hours.
DYOR
$TRX #Crypto
1
243
·
--
Төмен (кемімелі)
Ethereum Inflows to Binance May Be a Sign of Preparation for the FED Decision
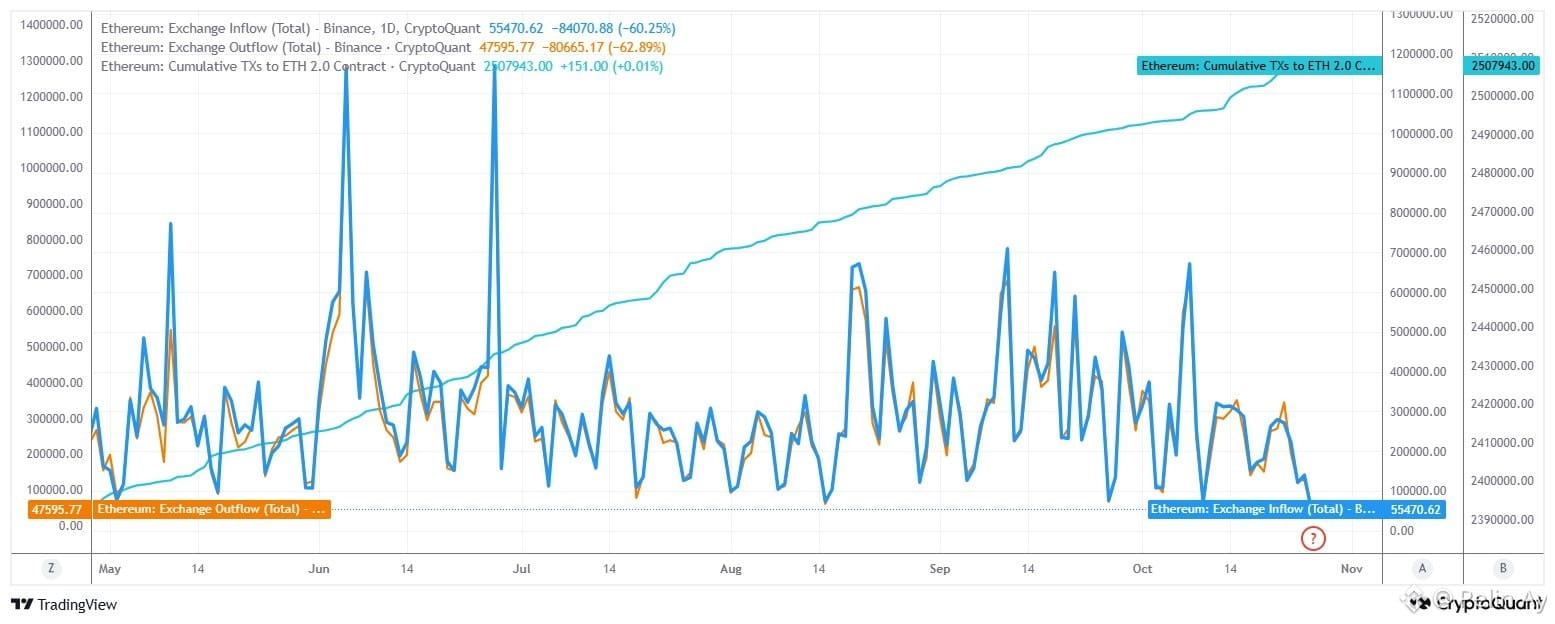
Recently, there have been approximately 55,471 ETH inflows and 47,596 ETH outflows to Binance. This shows a net inflow of 7,875 ETH, indicating a dominance of net inflows. This suggests an increase in the supply of tradable ETH on Binance for that day, and that short term selling pressure may have increased somewhat. The recent downward trend in price also supports this.
The recent decline in both flows suggests that transaction and transfer activity may have calmed down.
The cumulative number of transactions on the Ethereum 2.0 contract is steadily increasing. While this isn't a direct indicator of demand for the Ethereum price, the network's active use is promising.
On the macro side, the US 10 year Treasury yield is around 4.97%, and oil prices are high. High bond yields and inflation concerns may limit appetite for risky assets that don't generate yield. Furthermore, markets are cautious ahead of the Fed's October 28th decision; interest rate expectations and bond movements could increase volatility in liquidity-sensitive assets like cryptocurrencies.
Therefore, continued net inflows throughout the week, ongoing ETF outflows, and persistently high bond yields could strengthen selling pressure. The inability of the price to maintain the approximately $2,280–$2,300 region seen at the end of October increases this risk.
The net inflow at the end of the chart is slightly negative in the short term; while the cumulative ETH 2.0 line indicates positive long-term network activity, it doesn't save the day. Considering the price decline throughout October, ETF outflows, and the upcoming Fed decision, it seems more logical to take the downside risks more seriously for now and wait for confirmation in flows and price before assuming a recovery. $ETH #Ethereum #ETH
Ethereum Inflows to Binance May Be a Sign of Preparation for the FED Decision
Recently, there have been approximately 55,471 ETH inflows and 47,596 ETH outflows to Binance. This shows a net inflow of 7,875 ETH, indicating a dominance of net inflows. This suggests an increase in the supply of tradable ETH on Binance for that day, and that short term selling pressure may have increased somewhat. The recent downward trend in price also supports this.
The recent decline in both flows suggests that transaction and transfer activity may have calmed down.
The cumulative number of transactions on the Ethereum 2.0 contract is steadily increasing. While this isn't a direct indicator of demand for the Ethereum price, the network's active use is promising.
On the macro side, the US 10 year Treasury yield is around 4.97%, and oil prices are high. High bond yields and inflation concerns may limit appetite for risky assets that don't generate yield. Furthermore, markets are cautious ahead of the Fed's October 28th decision; interest rate expectations and bond movements could increase volatility in liquidity-sensitive assets like cryptocurrencies.
Therefore, continued net inflows throughout the week, ongoing ETF outflows, and persistently high bond yields could strengthen selling pressure. The inability of the price to maintain the approximately $2,280–$2,300 region seen at the end of October increases this risk.
The net inflow at the end of the chart is slightly negative in the short term; while the cumulative ETH 2.0 line indicates positive long-term network activity, it doesn't save the day. Considering the price decline throughout October, ETF outflows, and the upcoming Fed decision, it seems more logical to take the downside risks more seriously for now and wait for confirmation in flows and price before assuming a recovery. $ETH #Ethereum #ETH
Recently, there have been approximately 55,471 ETH inflows and 47,596 ETH outflows to Binance. This shows a net inflow of 7,875 ETH, indicating a dominance of net inflows. This suggests an increase in the supply of tradable ETH on Binance for that day, and that short term selling pressure may have increased somewhat. The recent downward trend in price also supports this.
The recent decline in both flows suggests that transaction and transfer activity may have calmed down.
The cumulative number of transactions on the Ethereum 2.0 contract is steadily increasing. While this isn't a direct indicator of demand for the Ethereum price, the network's active use is promising.
On the macro side, the US 10 year Treasury yield is around 4.97%, and oil prices are high. High bond yields and inflation concerns may limit appetite for risky assets that don't generate yield. Furthermore, markets are cautious ahead of the Fed's October 28th decision; interest rate expectations and bond movements could increase volatility in liquidity-sensitive assets like cryptocurrencies.
Therefore, continued net inflows throughout the week, ongoing ETF outflows, and persistently high bond yields could strengthen selling pressure. The inability of the price to maintain the approximately $2,280–$2,300 region seen at the end of October increases this risk.
The net inflow at the end of the chart is slightly negative in the short term; while the cumulative ETH 2.0 line indicates positive long-term network activity, it doesn't save the day. Considering the price decline throughout October, ETF outflows, and the upcoming Fed decision, it seems more logical to take the downside risks more seriously for now and wait for confirmation in flows and price before assuming a recovery. $ETH #Ethereum #ETH
388
·
--
📈 $BMT · 1H
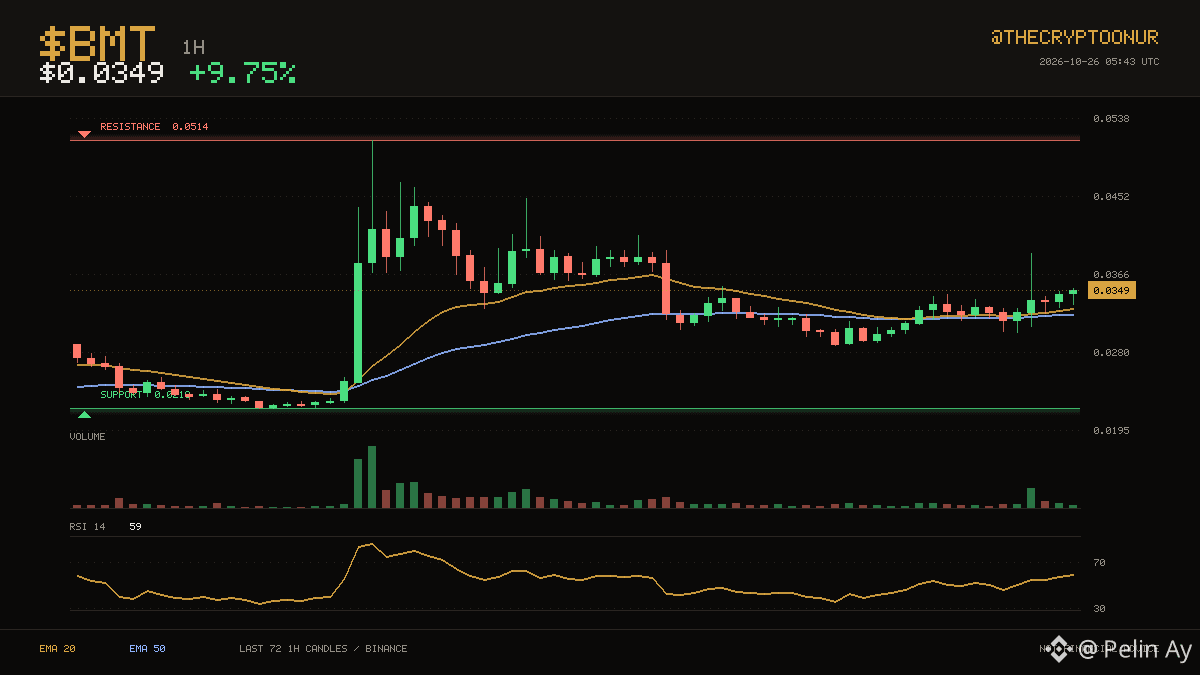
$BMT sits at $0.0349, with the 20 and 50 hourly averages both below price. The three day range runs from $0.0218 up to $0.0514. Price is roughly mid range here. Both edges of the range are far from here, so neither is in play yet. Averages have been ordered the same way for 52 candles, with the 20 above the 50. Momentum is mid range with RSI at 59. The 24 hour range runs $0.0289 to $0.0390, and price is around the middle of it. Volume is close to normal at 0.7x the recent average. Those averages sit at $0.0329 and $0.0323 respectively. Up 9.7% over 24 hours.
DYOR
$BMT #Crypto
📈 $BMT · 1H
$BMT sits at $0.0349, with the 20 and 50 hourly averages both below price. The three day range runs from $0.0218 up to $0.0514. Price is roughly mid range here. Both edges of the range are far from here, so neither is in play yet. Averages have been ordered the same way for 52 candles, with the 20 above the 50. Momentum is mid range with RSI at 59. The 24 hour range runs $0.0289 to $0.0390, and price is around the middle of it. Volume is close to normal at 0.7x the recent average. Those averages sit at $0.0329 and $0.0323 respectively. Up 9.7% over 24 hours.
DYOR
$BMT #Crypto
$BMT sits at $0.0349, with the 20 and 50 hourly averages both below price. The three day range runs from $0.0218 up to $0.0514. Price is roughly mid range here. Both edges of the range are far from here, so neither is in play yet. Averages have been ordered the same way for 52 candles, with the 20 above the 50. Momentum is mid range with RSI at 59. The 24 hour range runs $0.0289 to $0.0390, and price is around the middle of it. Volume is close to normal at 0.7x the recent average. Those averages sit at $0.0329 and $0.0323 respectively. Up 9.7% over 24 hours.
DYOR
$BMT #Crypto
373
·
--
📈 $ADA · 1H
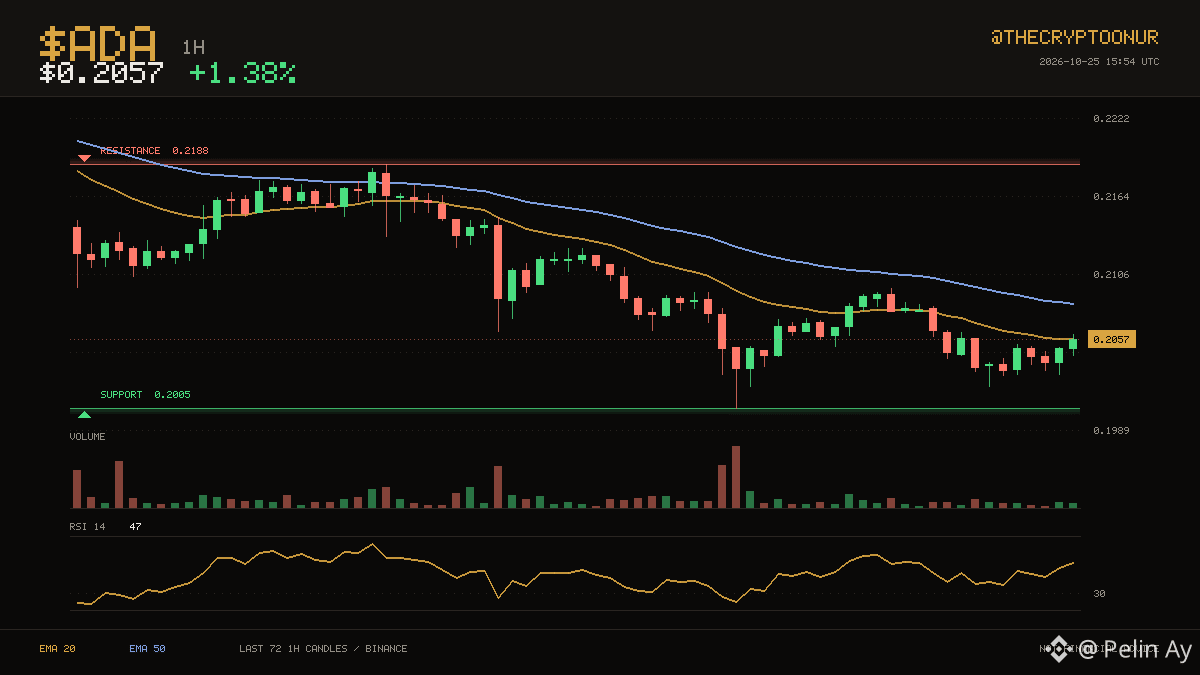
$ADA trades at $0.2057, still on the weak side of its hourly averages. The three day range runs from $0.2005 up to $0.2188. Price is down in the lower third of that range. That is 6.4% to the ceiling and 2.5% to the floor. The 20 has stayed below the 50 for a long stretch now. RSI at 47 is neutral, so momentum is not blocking a move either way. Over the past day it has traded between $0.2022 and $0.2095, sitting around the middle of it now. Participation is light at about 0.5x average volume. Up 1.4% over 24 hours.
DYOR
$ADA #Trading
📈 $ADA · 1H
$ADA trades at $0.2057, still on the weak side of its hourly averages. The three day range runs from $0.2005 up to $0.2188. Price is down in the lower third of that range. That is 6.4% to the ceiling and 2.5% to the floor. The 20 has stayed below the 50 for a long stretch now. RSI at 47 is neutral, so momentum is not blocking a move either way. Over the past day it has traded between $0.2022 and $0.2095, sitting around the middle of it now. Participation is light at about 0.5x average volume. Up 1.4% over 24 hours.
DYOR
$ADA #Trading
$ADA trades at $0.2057, still on the weak side of its hourly averages. The three day range runs from $0.2005 up to $0.2188. Price is down in the lower third of that range. That is 6.4% to the ceiling and 2.5% to the floor. The 20 has stayed below the 50 for a long stretch now. RSI at 47 is neutral, so momentum is not blocking a move either way. Over the past day it has traded between $0.2022 and $0.2095, sitting around the middle of it now. Participation is light at about 0.5x average volume. Up 1.4% over 24 hours.
DYOR
$ADA #Trading
1
419
·
--
How Will the US Midterm Elections Affect the Crypto Market?The US midterm elections on November 3, 2026, are significant events that could affect not only the country's political balance but also the future of the cryptocurrency market. Changes in the distribution of seats in Congress could be decisive in terms of regulations for digital assets, institutional investors' approach to the market, and the growth potential of the crypto sector. However, investors should remember that the election results do not guarantee a direct and lasting rise in crypto assets.
CLARITY Act and Regulatory Uncertainty
One of the most important aspects of the elections for the crypto market is the CLARITY Act, which aims to define the legal status and regulatory framework for digital assets. This regulation could contribute to a clearer definition of the boundaries of authority between the Securities and Exchange Commission (SEC) and the Commodity Futures Commission (CFTC) in the US.
However, disagreements during the Senate process indicate that the creation of the legal framework depends on political consensus. According to a Reuters analysis dated October 13, 2026, a Democratic majority in Congress could lead to increased oversight and investigations into crypto companies. This should be closely monitored, particularly for altcoins and decentralized finance (DeFi) projects, which are sensitive to regulatory decisions.
If Republicans retain their majority in Congress, expectations for progress on regulations supported by the crypto sector could strengthen. However, a political majority alone is not enough to pass legislation; the balance of votes in the Senate, bipartisan consensus, and the presidential process are also important.
Bitcoin and Altcoins May React Differently
Global liquidity, the trajectory of the US dollar, bond yields, and investor risk appetite continue to be key factors influencing Bitcoin's price movements. Therefore, positive political developments in the midterm elections do not automatically translate into a rise in Bitcoin. If macroeconomic conditions worsen, election-related optimism may be limited.
For altcoins, regulatory uncertainty could be a more significant risk factor. Issues such as the potential for cryptocurrency to be considered a security, staking activities, exchange regulations, and institutional access can directly impact investor demand for specific projects. A clearer legal framework may support institutional participation, while stricter regulations may make it difficult for some projects to operate.
Volatility may increase before and after elections
As the election date approaches, the pricing of expectations in the markets may increase short-term fluctuations. If the election results align with pre priced expectations, the price reaction may be limited. However, if the outcome deviates from expectations, sharp movements may be seen, especially in leveraged transactions.
During this process, #Bitcoin and #Ethereum , as well as the total cryptocurrency market capitalization, open interest, funding rates, and spot trading volumes should be monitored. An excessive increase in open interest while the price is rising may indicate leverage accumulation in the market. Conversely, increases supported by spot demand may be more meaningful in evaluating the nature of the movement.
The Direction Will Not Be Determined Solely By Elections
The US midterm elections may have an impact on the cryptocurrency market, particularly through regulatory expectations. However, to determine the medium- and long-term direction of Bitcoin and altcoins, in addition to election results, Fed policy, global liquidity, institutional capital flows, and on-chain data should also be evaluated.
For investors, the healthiest approach would be to evaluate different possibilities and monitor price movements using volume, volatility, and leverage indicators, rather than taking positions based on a single scenario before the elections. While political developments are a significant catalyst, a lasting change in the crypto market requires price behavior to support these expectations. $BTC $ETH #Altcoins
How Will the US Midterm Elections Affect the Crypto Market?
The US midterm elections on November 3, 2026, are significant events that could affect not only the country's political balance but also the future of the cryptocurrency market. Changes in the distribution of seats in Congress could be decisive in terms of regulations for digital assets, institutional investors' approach to the market, and the growth potential of the crypto sector. However, investors should remember that the election results do not guarantee a direct and lasting rise in crypto assets.
CLARITY Act and Regulatory Uncertainty
One of the most important aspects of the elections for the crypto market is the CLARITY Act, which aims to define the legal status and regulatory framework for digital assets. This regulation could contribute to a clearer definition of the boundaries of authority between the Securities and Exchange Commission (SEC) and the Commodity Futures Commission (CFTC) in the US.
However, disagreements during the Senate process indicate that the creation of the legal framework depends on political consensus. According to a Reuters analysis dated October 13, 2026, a Democratic majority in Congress could lead to increased oversight and investigations into crypto companies. This should be closely monitored, particularly for altcoins and decentralized finance (DeFi) projects, which are sensitive to regulatory decisions.
If Republicans retain their majority in Congress, expectations for progress on regulations supported by the crypto sector could strengthen. However, a political majority alone is not enough to pass legislation; the balance of votes in the Senate, bipartisan consensus, and the presidential process are also important.
Bitcoin and Altcoins May React Differently
Global liquidity, the trajectory of the US dollar, bond yields, and investor risk appetite continue to be key factors influencing Bitcoin's price movements. Therefore, positive political developments in the midterm elections do not automatically translate into a rise in Bitcoin. If macroeconomic conditions worsen, election-related optimism may be limited.
For altcoins, regulatory uncertainty could be a more significant risk factor. Issues such as the potential for cryptocurrency to be considered a security, staking activities, exchange regulations, and institutional access can directly impact investor demand for specific projects. A clearer legal framework may support institutional participation, while stricter regulations may make it difficult for some projects to operate.
Volatility may increase before and after elections
As the election date approaches, the pricing of expectations in the markets may increase short-term fluctuations. If the election results align with pre priced expectations, the price reaction may be limited. However, if the outcome deviates from expectations, sharp movements may be seen, especially in leveraged transactions.
During this process, #Bitcoin and #Ethereum , as well as the total cryptocurrency market capitalization, open interest, funding rates, and spot trading volumes should be monitored. An excessive increase in open interest while the price is rising may indicate leverage accumulation in the market. Conversely, increases supported by spot demand may be more meaningful in evaluating the nature of the movement.
The Direction Will Not Be Determined Solely By Elections
The US midterm elections may have an impact on the cryptocurrency market, particularly through regulatory expectations. However, to determine the medium- and long-term direction of Bitcoin and altcoins, in addition to election results, Fed policy, global liquidity, institutional capital flows, and on-chain data should also be evaluated.
For investors, the healthiest approach would be to evaluate different possibilities and monitor price movements using volume, volatility, and leverage indicators, rather than taking positions based on a single scenario before the elections. While political developments are a significant catalyst, a lasting change in the crypto market requires price behavior to support these expectations. $BTC $ETH #Altcoins
CLARITY Act and Regulatory Uncertainty
One of the most important aspects of the elections for the crypto market is the CLARITY Act, which aims to define the legal status and regulatory framework for digital assets. This regulation could contribute to a clearer definition of the boundaries of authority between the Securities and Exchange Commission (SEC) and the Commodity Futures Commission (CFTC) in the US.
However, disagreements during the Senate process indicate that the creation of the legal framework depends on political consensus. According to a Reuters analysis dated October 13, 2026, a Democratic majority in Congress could lead to increased oversight and investigations into crypto companies. This should be closely monitored, particularly for altcoins and decentralized finance (DeFi) projects, which are sensitive to regulatory decisions.
If Republicans retain their majority in Congress, expectations for progress on regulations supported by the crypto sector could strengthen. However, a political majority alone is not enough to pass legislation; the balance of votes in the Senate, bipartisan consensus, and the presidential process are also important.
Bitcoin and Altcoins May React Differently
Global liquidity, the trajectory of the US dollar, bond yields, and investor risk appetite continue to be key factors influencing Bitcoin's price movements. Therefore, positive political developments in the midterm elections do not automatically translate into a rise in Bitcoin. If macroeconomic conditions worsen, election-related optimism may be limited.
For altcoins, regulatory uncertainty could be a more significant risk factor. Issues such as the potential for cryptocurrency to be considered a security, staking activities, exchange regulations, and institutional access can directly impact investor demand for specific projects. A clearer legal framework may support institutional participation, while stricter regulations may make it difficult for some projects to operate.
Volatility may increase before and after elections
As the election date approaches, the pricing of expectations in the markets may increase short-term fluctuations. If the election results align with pre priced expectations, the price reaction may be limited. However, if the outcome deviates from expectations, sharp movements may be seen, especially in leveraged transactions.
During this process, #Bitcoin and #Ethereum , as well as the total cryptocurrency market capitalization, open interest, funding rates, and spot trading volumes should be monitored. An excessive increase in open interest while the price is rising may indicate leverage accumulation in the market. Conversely, increases supported by spot demand may be more meaningful in evaluating the nature of the movement.
The Direction Will Not Be Determined Solely By Elections
The US midterm elections may have an impact on the cryptocurrency market, particularly through regulatory expectations. However, to determine the medium- and long-term direction of Bitcoin and altcoins, in addition to election results, Fed policy, global liquidity, institutional capital flows, and on-chain data should also be evaluated.
For investors, the healthiest approach would be to evaluate different possibilities and monitor price movements using volume, volatility, and leverage indicators, rather than taking positions based on a single scenario before the elections. While political developments are a significant catalyst, a lasting change in the crypto market requires price behavior to support these expectations. $BTC $ETH #Altcoins
1
743
·
--
Төмен (кемімелі)
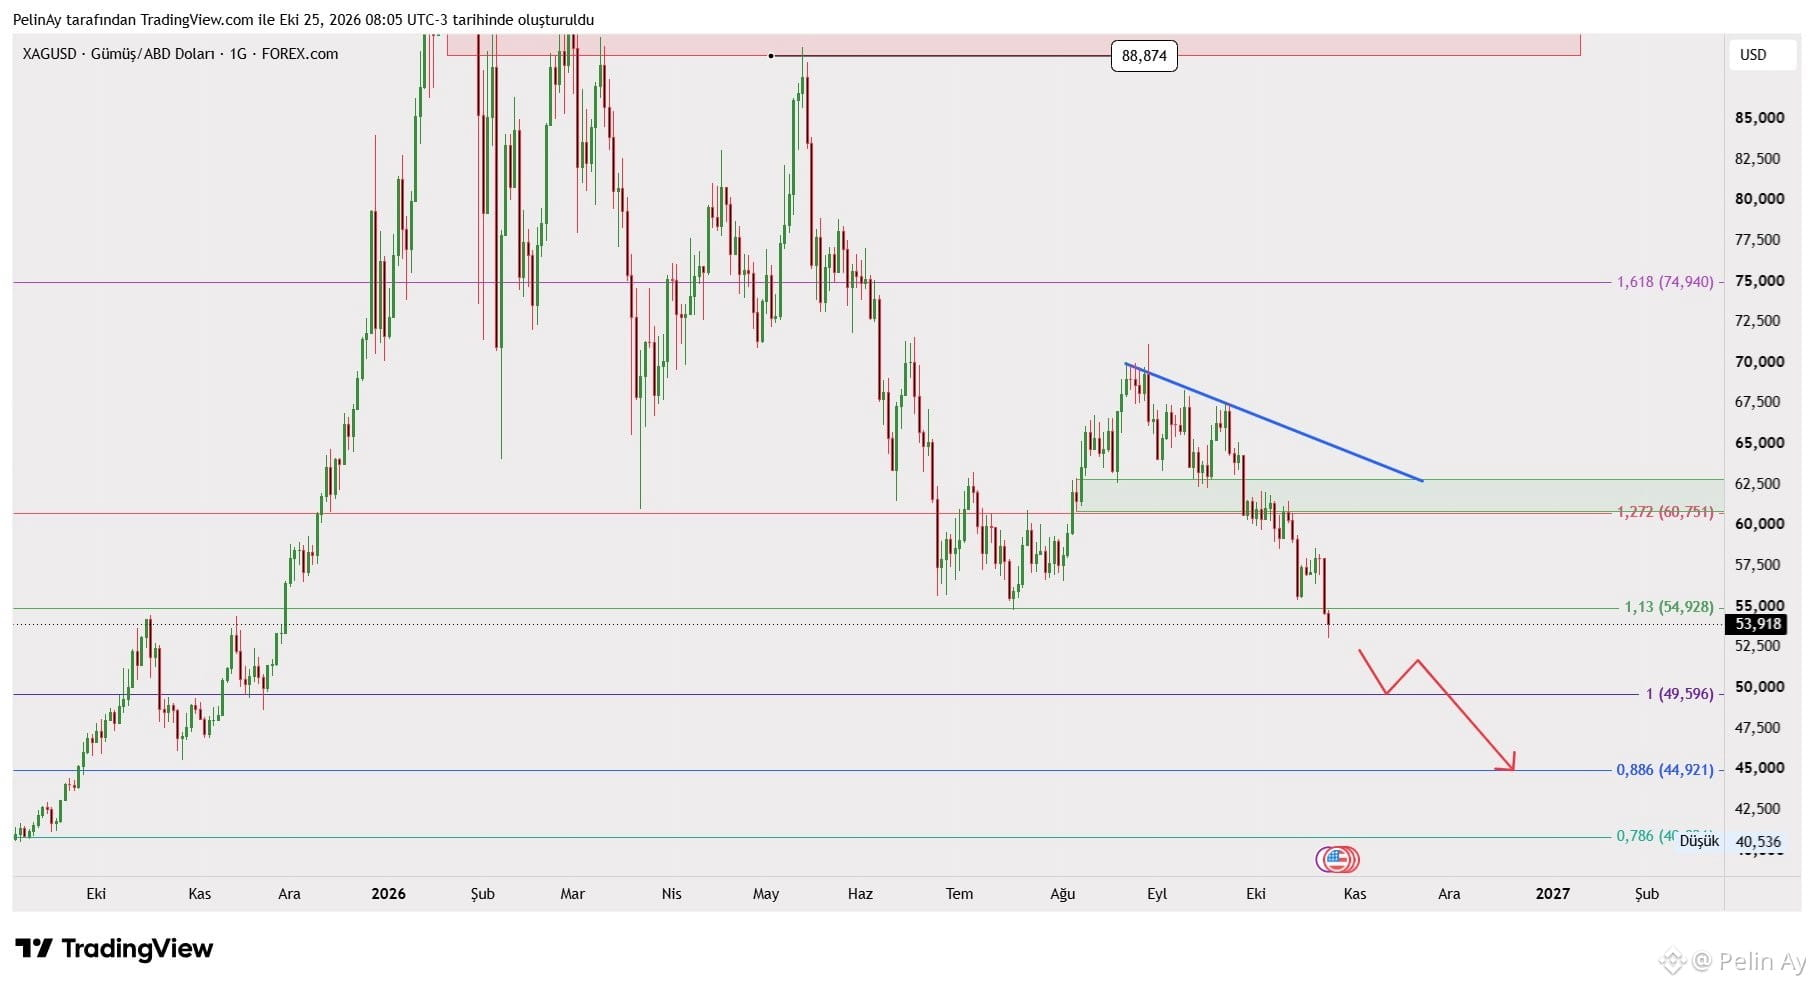
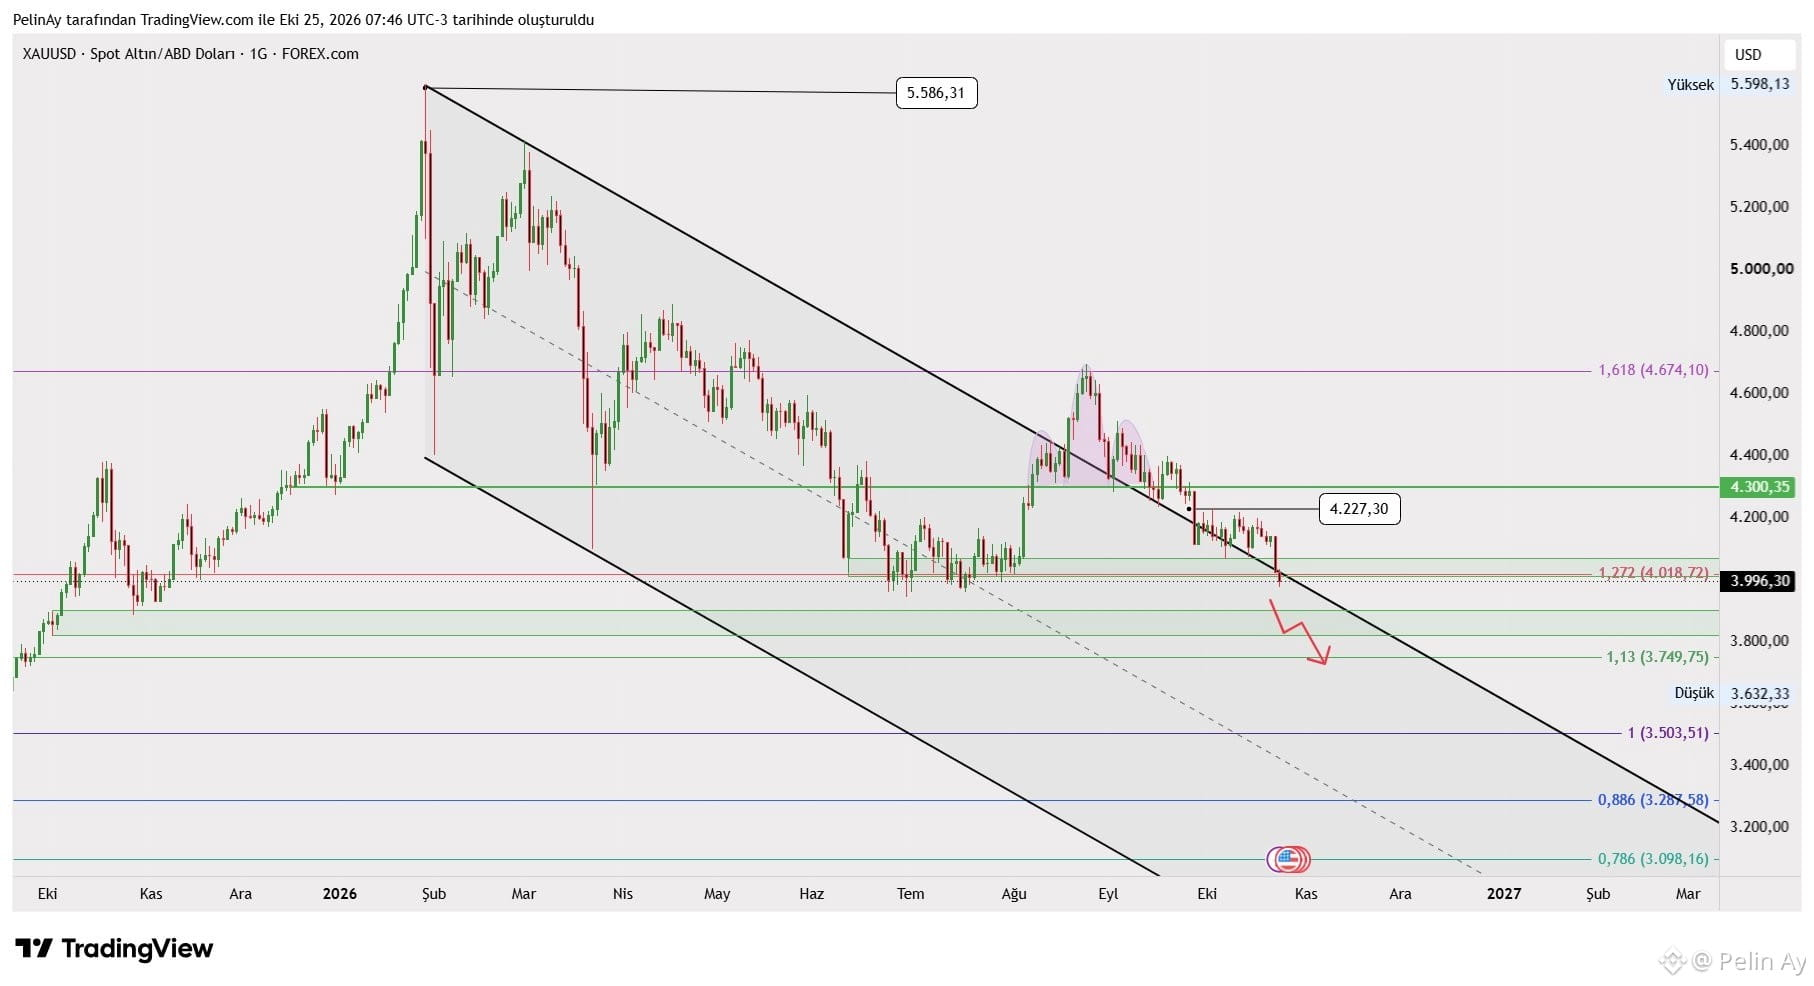
I'm very scared about silver per ounce. Because it could fall as low as $45. #If this drop happens in silver, then you should consider gold, cryptocurrencies, and stocks. I don't see anything positive on the chart. If anyone does, please tell me. #XAG $XAG
I'm very scared about silver per ounce. Because it could fall as low as $45. #If this drop happens in silver, then you should consider gold, cryptocurrencies, and stocks. I don't see anything positive on the chart. If anyone does, please tell me. #XAG $XAG
1
695
·
--
📉 $DOGE · 1H
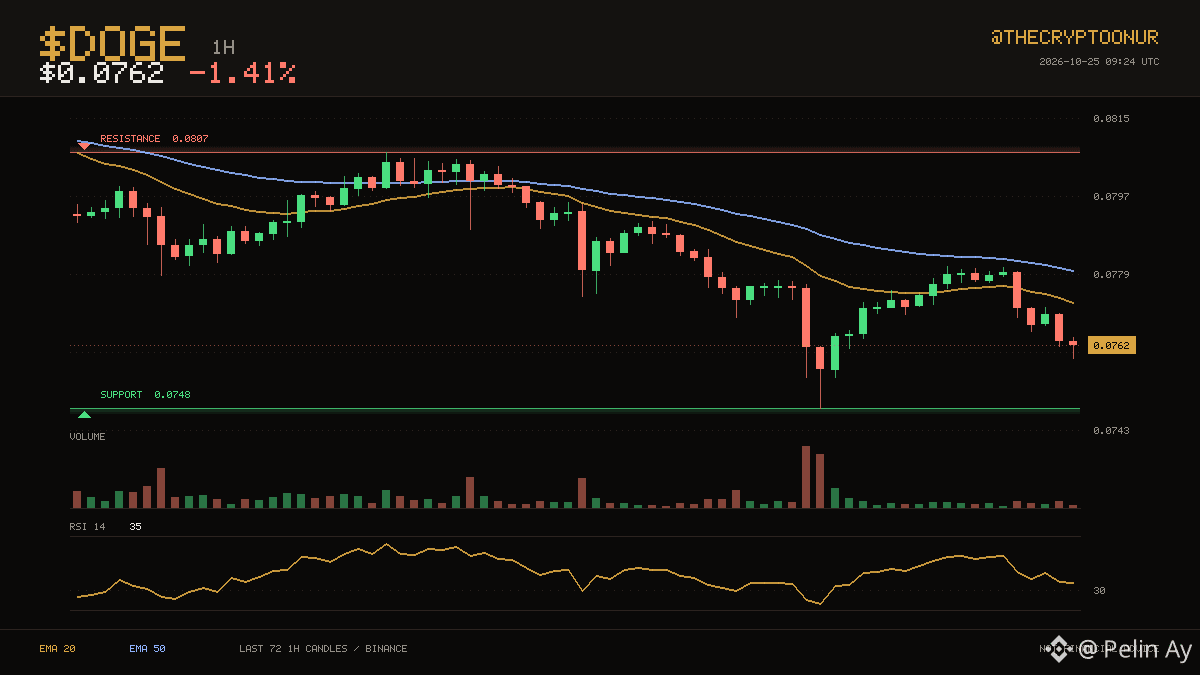
$DOGE trades at $0.0762, still on the weak side of its hourly averages. The three day range runs from $0.0748 up to $0.0807. It is sitting in the bottom third of the range. Resistance sits 5.8% above and support 1.9% below. Averages have been ordered the same way for a long stretch now, with the 20 below the 50. Momentum is mid range with RSI at 35. The 24 hour range runs $0.0748 to $0.0781, and price is around the middle of it. Volume is close to normal at 1.0x the recent average. Those averages sit at $0.0772 and $0.0780 respectively. Down 1.4% over 24 hours.
DYOR
$DOGE #Crypto
📉 $DOGE · 1H
$DOGE trades at $0.0762, still on the weak side of its hourly averages. The three day range runs from $0.0748 up to $0.0807. It is sitting in the bottom third of the range. Resistance sits 5.8% above and support 1.9% below. Averages have been ordered the same way for a long stretch now, with the 20 below the 50. Momentum is mid range with RSI at 35. The 24 hour range runs $0.0748 to $0.0781, and price is around the middle of it. Volume is close to normal at 1.0x the recent average. Those averages sit at $0.0772 and $0.0780 respectively. Down 1.4% over 24 hours.
DYOR
$DOGE #Crypto
$DOGE trades at $0.0762, still on the weak side of its hourly averages. The three day range runs from $0.0748 up to $0.0807. It is sitting in the bottom third of the range. Resistance sits 5.8% above and support 1.9% below. Averages have been ordered the same way for a long stretch now, with the 20 below the 50. Momentum is mid range with RSI at 35. The 24 hour range runs $0.0748 to $0.0781, and price is around the middle of it. Volume is close to normal at 1.0x the recent average. Those averages sit at $0.0772 and $0.0780 respectively. Down 1.4% over 24 hours.
DYOR
$DOGE #Crypto
348
·
--
📉 $PEPE · 1H
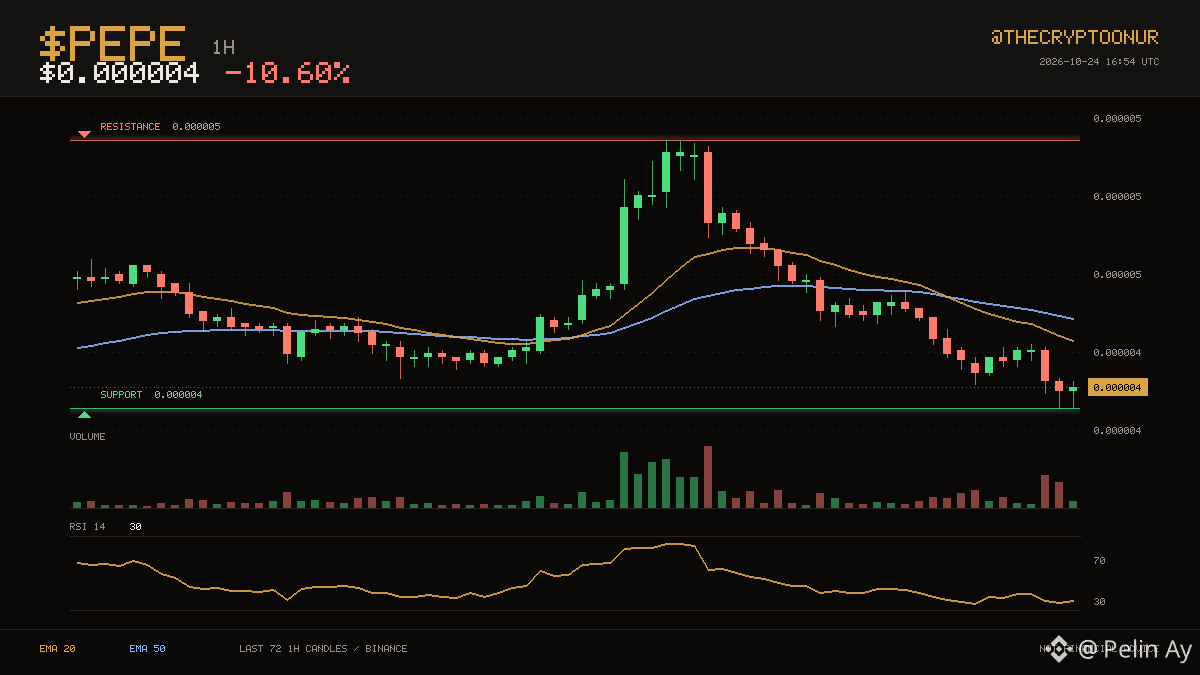
The $0.000004 area held twice over the last three days and is being tested again. $PEPE is at $0.000004, under both its 20 and 50 hourly averages. Price is down in the lower third of that range. The floor is 1.6% away and the ceiling is nowhere close. The 20 crossed below the 50 recently, for only 10 candles, so this leg is still young. RSI at 30 is deep in oversold territory. Over the past day it has traded between $0.000004 and $0.000005, sitting near the bottom of it now. Turnover is unremarkable, running 1.1x the recent average. Down 10.6% over 24 hours.
DYOR
$PEPE #Binance
📉 $PEPE · 1H
The $0.000004 area held twice over the last three days and is being tested again. $PEPE is at $0.000004, under both its 20 and 50 hourly averages. Price is down in the lower third of that range. The floor is 1.6% away and the ceiling is nowhere close. The 20 crossed below the 50 recently, for only 10 candles, so this leg is still young. RSI at 30 is deep in oversold territory. Over the past day it has traded between $0.000004 and $0.000005, sitting near the bottom of it now. Turnover is unremarkable, running 1.1x the recent average. Down 10.6% over 24 hours.
DYOR
$PEPE #Binance
The $0.000004 area held twice over the last three days and is being tested again. $PEPE is at $0.000004, under both its 20 and 50 hourly averages. Price is down in the lower third of that range. The floor is 1.6% away and the ceiling is nowhere close. The 20 crossed below the 50 recently, for only 10 candles, so this leg is still young. RSI at 30 is deep in oversold territory. Over the past day it has traded between $0.000004 and $0.000005, sitting near the bottom of it now. Turnover is unremarkable, running 1.1x the recent average. Down 10.6% over 24 hours.
DYOR
$PEPE #Binance
5
1.4k
·
--
🔴 $XLM · 1H
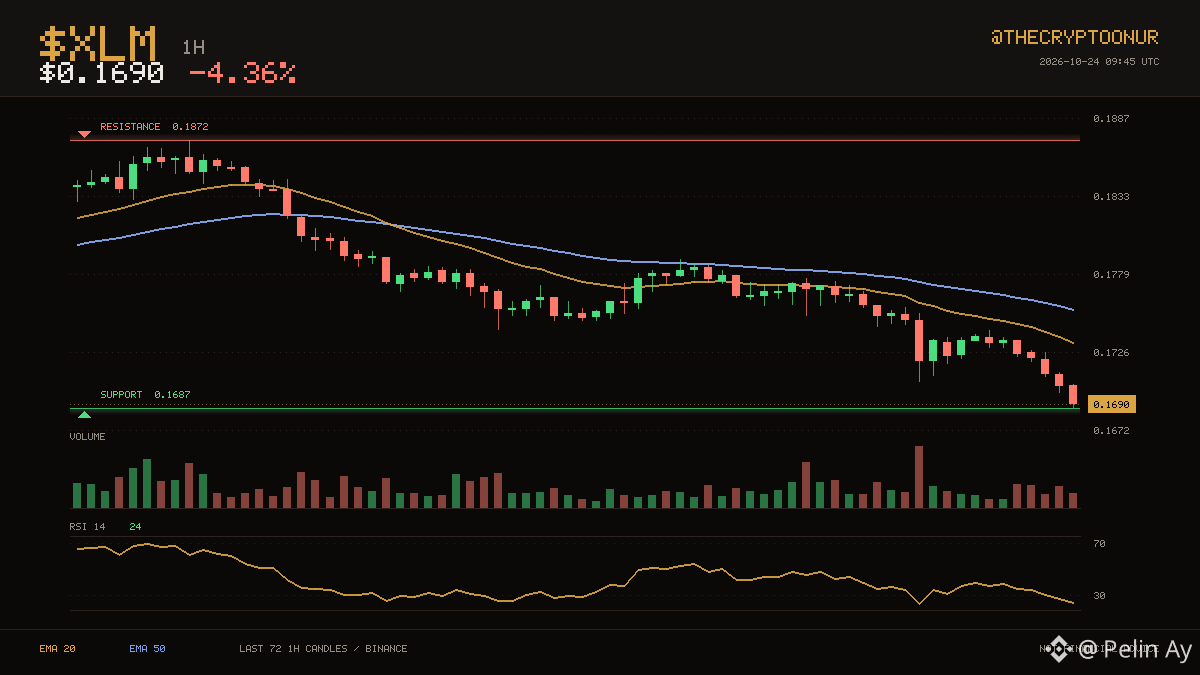
Price is $0.1690 and $XLM remains below the averages that capped it earlier. Buyers have been showing up around $0.1687, which is where price is sitting now. It is sitting in the bottom third of the range. Support is 0.2% below, which is close enough to be tested quickly. Averages have been ordered the same way for 49 candles, with the 20 below the 50. RSI has dropped to 24, the kind of reading that usually comes with a bounce attempt. The 24 hour range runs $0.1687 to $0.1777, and price is near the bottom of it. Volume is close to normal at 1.0x the recent average. Down 4.4% over 24 hours.
⚠️ DYOR
$XLM #Crypto
🔴 $XLM · 1H
Price is $0.1690 and $XLM remains below the averages that capped it earlier. Buyers have been showing up around $0.1687, which is where price is sitting now. It is sitting in the bottom third of the range. Support is 0.2% below, which is close enough to be tested quickly. Averages have been ordered the same way for 49 candles, with the 20 below the 50. RSI has dropped to 24, the kind of reading that usually comes with a bounce attempt. The 24 hour range runs $0.1687 to $0.1777, and price is near the bottom of it. Volume is close to normal at 1.0x the recent average. Down 4.4% over 24 hours.
⚠️ DYOR
$XLM #Crypto
Price is $0.1690 and $XLM remains below the averages that capped it earlier. Buyers have been showing up around $0.1687, which is where price is sitting now. It is sitting in the bottom third of the range. Support is 0.2% below, which is close enough to be tested quickly. Averages have been ordered the same way for 49 candles, with the 20 below the 50. RSI has dropped to 24, the kind of reading that usually comes with a bounce attempt. The 24 hour range runs $0.1687 to $0.1777, and price is near the bottom of it. Volume is close to normal at 1.0x the recent average. Down 4.4% over 24 hours.
⚠️ DYOR
$XLM #Crypto
3
928
·
--
📈 $PEPE · 1H
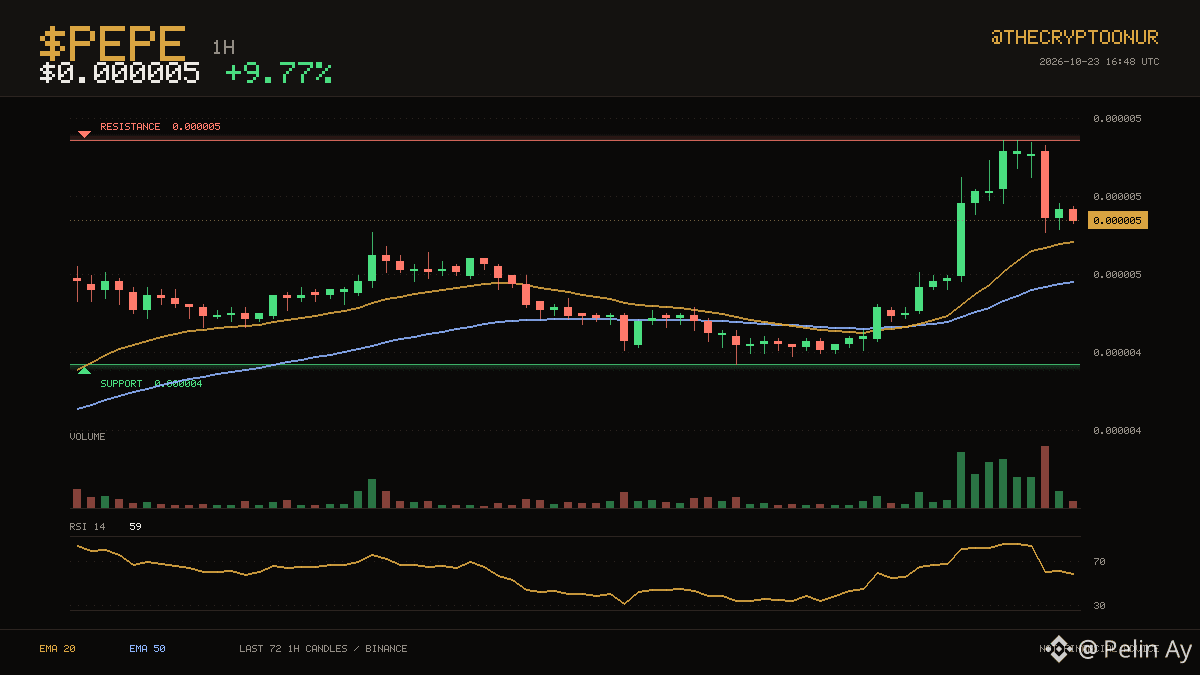
The action has stayed between $0.000004 and $0.000005 over the last three days. $PEPE is trading at $0.000005, above both its 20 and 50 hourly averages. That puts price in the middle of the range. That is 5.8% to the ceiling and 10.4% to the floor. The 20 has stayed above the 50 for only 12 candles. RSI at 59 is neutral, so momentum is not blocking a move either way. Over the past day it has traded between $0.000004 and $0.000005, sitting around the middle of it now. The last 24 hours carried roughly 2.8x normal volume. Up 9.8% over 24 hours.
DYOR
$PEPE #Binance
📈 $PEPE · 1H
The action has stayed between $0.000004 and $0.000005 over the last three days. $PEPE is trading at $0.000005, above both its 20 and 50 hourly averages. That puts price in the middle of the range. That is 5.8% to the ceiling and 10.4% to the floor. The 20 has stayed above the 50 for only 12 candles. RSI at 59 is neutral, so momentum is not blocking a move either way. Over the past day it has traded between $0.000004 and $0.000005, sitting around the middle of it now. The last 24 hours carried roughly 2.8x normal volume. Up 9.8% over 24 hours.
DYOR
$PEPE #Binance
The action has stayed between $0.000004 and $0.000005 over the last three days. $PEPE is trading at $0.000005, above both its 20 and 50 hourly averages. That puts price in the middle of the range. That is 5.8% to the ceiling and 10.4% to the floor. The 20 has stayed above the 50 for only 12 candles. RSI at 59 is neutral, so momentum is not blocking a move either way. Over the past day it has traded between $0.000004 and $0.000005, sitting around the middle of it now. The last 24 hours carried roughly 2.8x normal volume. Up 9.8% over 24 hours.
DYOR
$PEPE #Binance
2
525
·
--
🟢 $ARB · 1H
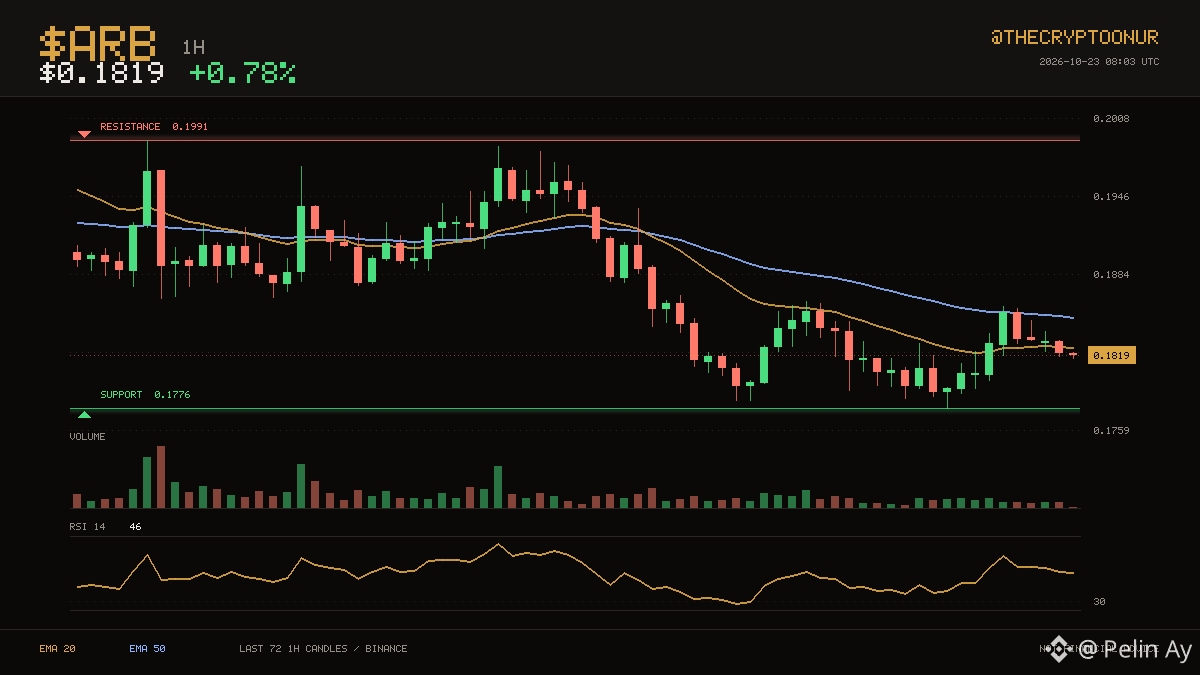
Price is $0.1819 and $ARB remains below the averages that capped it earlier. Buyers have been showing up around $0.1776, which is where price is sitting now. It is sitting in the bottom third of the range. Resistance sits 9.5% above and support 2.4% below. Averages have been ordered the same way for 31 candles, with the 20 below the 50. Momentum is mid range with RSI at 46. The 24 hour range runs $0.1776 to $0.1862, and price is around the middle of it. Volume is thin, around 0.6x the recent average, so moves here are easier to fade. Up 0.8% over 24 hours.
DYOR
$ARB #Crypto
🟢 $ARB · 1H
Price is $0.1819 and $ARB remains below the averages that capped it earlier. Buyers have been showing up around $0.1776, which is where price is sitting now. It is sitting in the bottom third of the range. Resistance sits 9.5% above and support 2.4% below. Averages have been ordered the same way for 31 candles, with the 20 below the 50. Momentum is mid range with RSI at 46. The 24 hour range runs $0.1776 to $0.1862, and price is around the middle of it. Volume is thin, around 0.6x the recent average, so moves here are easier to fade. Up 0.8% over 24 hours.
DYOR
$ARB #Crypto
Price is $0.1819 and $ARB remains below the averages that capped it earlier. Buyers have been showing up around $0.1776, which is where price is sitting now. It is sitting in the bottom third of the range. Resistance sits 9.5% above and support 2.4% below. Averages have been ordered the same way for 31 candles, with the 20 below the 50. Momentum is mid range with RSI at 46. The 24 hour range runs $0.1776 to $0.1862, and price is around the middle of it. Volume is thin, around 0.6x the recent average, so moves here are easier to fade. Up 0.8% over 24 hours.
DYOR
$ARB #Crypto
1
1
4
1.3k
·
--
📈 $GTC · 1H
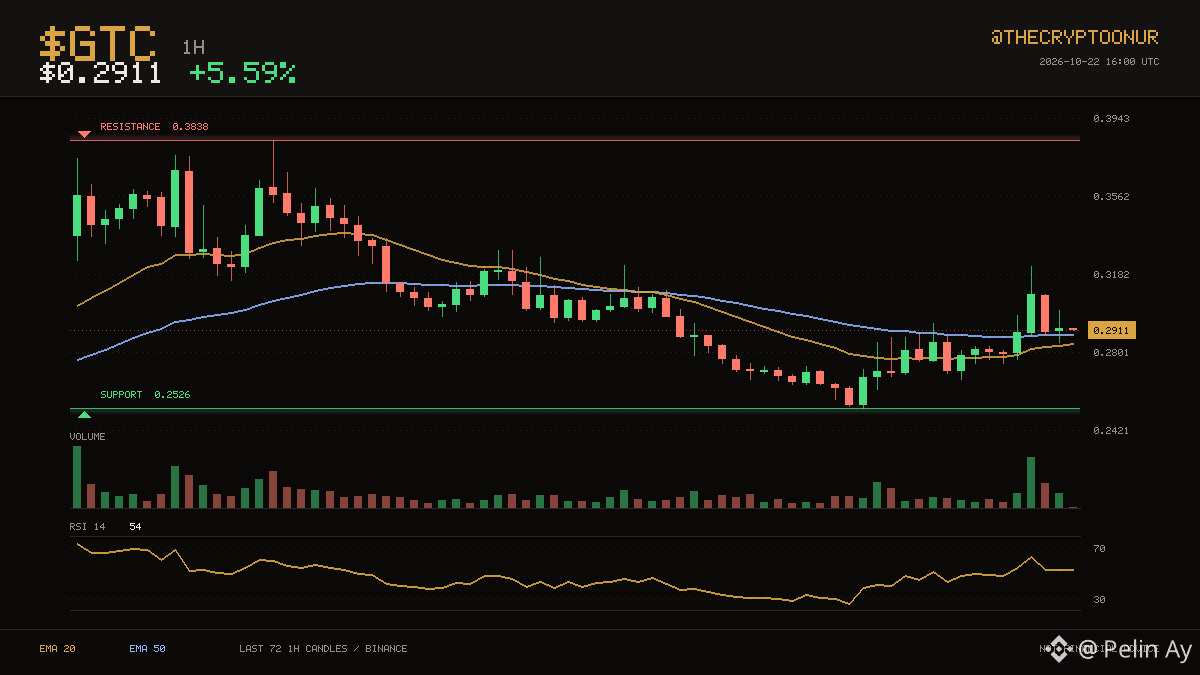
The action has stayed between $0.2526 and $0.3838 over the last three days. $GTC is trading at $0.2911, above both its 20 and 50 hourly averages. It is sitting in the bottom third of the range. Support is the near one at 13.2% below; the range high is far above. Averages have been ordered the same way for 32 candles, with the 20 below the 50. Momentum is mid range with RSI at 54. The 24 hour range runs $0.2526 to $0.3220, and price is around the middle of it. Volume is close to normal at 0.9x the recent average. Up 5.6% over 24 hours.
Binance spot data. DYOR
$GTC #Binance
📈 $GTC · 1H
The action has stayed between $0.2526 and $0.3838 over the last three days. $GTC is trading at $0.2911, above both its 20 and 50 hourly averages. It is sitting in the bottom third of the range. Support is the near one at 13.2% below; the range high is far above. Averages have been ordered the same way for 32 candles, with the 20 below the 50. Momentum is mid range with RSI at 54. The 24 hour range runs $0.2526 to $0.3220, and price is around the middle of it. Volume is close to normal at 0.9x the recent average. Up 5.6% over 24 hours.
Binance spot data. DYOR
$GTC #Binance
The action has stayed between $0.2526 and $0.3838 over the last three days. $GTC is trading at $0.2911, above both its 20 and 50 hourly averages. It is sitting in the bottom third of the range. Support is the near one at 13.2% below; the range high is far above. Averages have been ordered the same way for 32 candles, with the 20 below the 50. Momentum is mid range with RSI at 54. The 24 hour range runs $0.2526 to $0.3220, and price is around the middle of it. Volume is close to normal at 0.9x the recent average. Up 5.6% over 24 hours.
Binance spot data. DYOR
$GTC #Binance
440
·
--
📉 $FIL · 1H
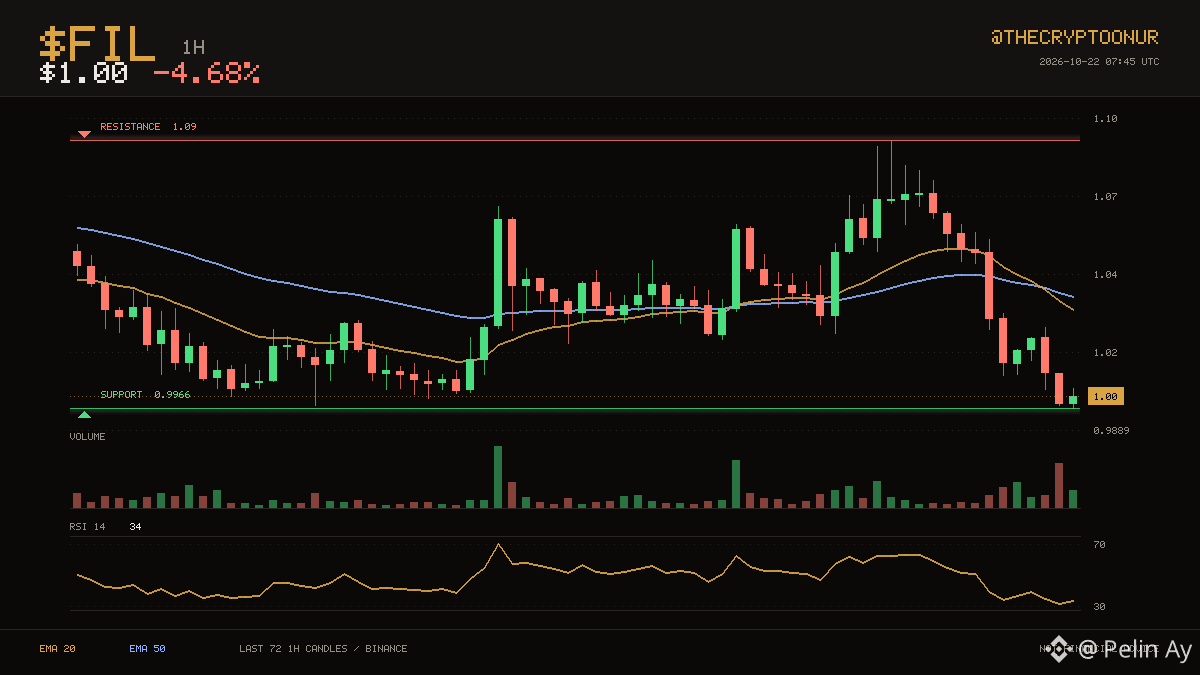
The $0.9966 area held twice over the last three days and is being tested again. $FIL is at $1.00, under both its 20 and 50 hourly averages. Price is down in the lower third of that range. There is only 0.4% between price and support. The 20 crossed below the 50 recently, for only 3 candles, so this leg is still young. RSI at 34 is neutral, so momentum is not blocking a move either way. Over the past day it has traded between $0.9966 and $1.09, sitting near the bottom of it now. Turnover is unremarkable, running 1.0x the recent average. Down 4.7% over 24 hours.
DYOR
$FIL #Binance
📉 $FIL · 1H
The $0.9966 area held twice over the last three days and is being tested again. $FIL is at $1.00, under both its 20 and 50 hourly averages. Price is down in the lower third of that range. There is only 0.4% between price and support. The 20 crossed below the 50 recently, for only 3 candles, so this leg is still young. RSI at 34 is neutral, so momentum is not blocking a move either way. Over the past day it has traded between $0.9966 and $1.09, sitting near the bottom of it now. Turnover is unremarkable, running 1.0x the recent average. Down 4.7% over 24 hours.
DYOR
$FIL #Binance
The $0.9966 area held twice over the last three days and is being tested again. $FIL is at $1.00, under both its 20 and 50 hourly averages. Price is down in the lower third of that range. There is only 0.4% between price and support. The 20 crossed below the 50 recently, for only 3 candles, so this leg is still young. RSI at 34 is neutral, so momentum is not blocking a move either way. Over the past day it has traded between $0.9966 and $1.09, sitting near the bottom of it now. Turnover is unremarkable, running 1.0x the recent average. Down 4.7% over 24 hours.
DYOR
$FIL #Binance
472
·
--
📈 $XLM · 1H
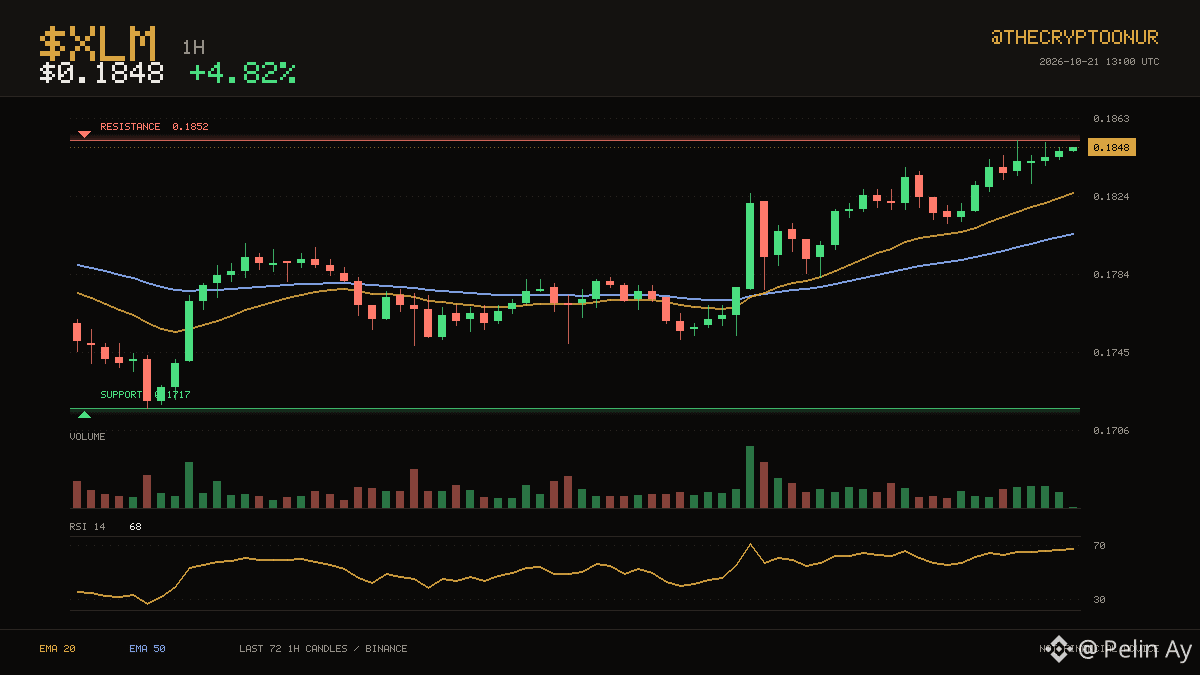
$XLM sits at $0.1848, with the 20 and 50 hourly averages both below price. The last three days topped out near $0.1852, and price is pressing that area again. It is trading in the top third of the range right now. Resistance is only 0.2% away, so there is not much room before it matters. Averages have been ordered the same way for 23 candles, with the 20 above the 50. Momentum is mid range with RSI at 68. The 24 hour range runs $0.1754 to $0.1852, and price is near the top of it. Volume is close to normal at 1.2x the recent average. Up 4.8% over 24 hours.
DYOR
$XLM #Crypto
📈 $XLM · 1H
$XLM sits at $0.1848, with the 20 and 50 hourly averages both below price. The last three days topped out near $0.1852, and price is pressing that area again. It is trading in the top third of the range right now. Resistance is only 0.2% away, so there is not much room before it matters. Averages have been ordered the same way for 23 candles, with the 20 above the 50. Momentum is mid range with RSI at 68. The 24 hour range runs $0.1754 to $0.1852, and price is near the top of it. Volume is close to normal at 1.2x the recent average. Up 4.8% over 24 hours.
DYOR
$XLM #Crypto
$XLM sits at $0.1848, with the 20 and 50 hourly averages both below price. The last three days topped out near $0.1852, and price is pressing that area again. It is trading in the top third of the range right now. Resistance is only 0.2% away, so there is not much room before it matters. Averages have been ordered the same way for 23 candles, with the 20 above the 50. Momentum is mid range with RSI at 68. The 24 hour range runs $0.1754 to $0.1852, and price is near the top of it. Volume is close to normal at 1.2x the recent average. Up 4.8% over 24 hours.
DYOR
$XLM #Crypto
536
·
--
📈 $COMP · 1H
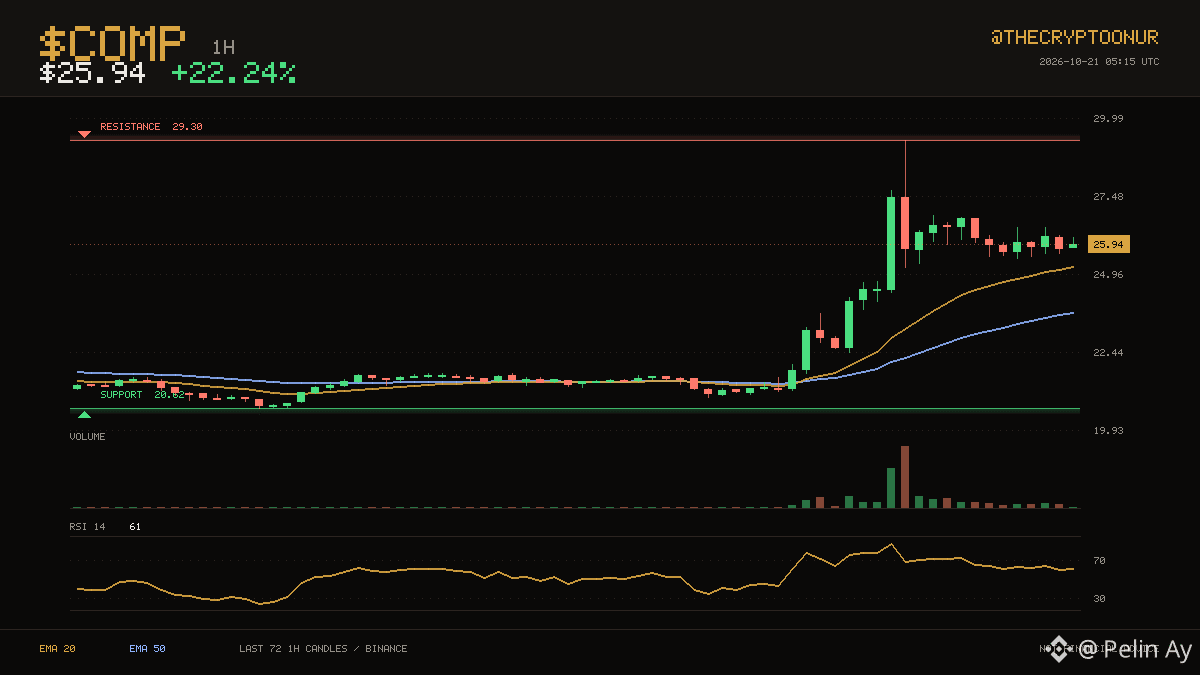
$COMP sits at $25.94, with the 20 and 50 hourly averages both below price. The three day range runs from $20.62 up to $29.30. That puts price in the middle of the range. The ceiling is 13.0% away while the floor sits well below current levels. The 20 has stayed above the 50 for 20 candles. RSI at 61 is neutral, so momentum is not blocking a move either way. Over the past day it has traded between $21.09 and $29.30, sitting around the middle of it now. The last 24 hours carried roughly 33.1x normal volume. Up 22.2% over 24 hours.
DYOR
$COMP #Trading
📈 $COMP · 1H
$COMP sits at $25.94, with the 20 and 50 hourly averages both below price. The three day range runs from $20.62 up to $29.30. That puts price in the middle of the range. The ceiling is 13.0% away while the floor sits well below current levels. The 20 has stayed above the 50 for 20 candles. RSI at 61 is neutral, so momentum is not blocking a move either way. Over the past day it has traded between $21.09 and $29.30, sitting around the middle of it now. The last 24 hours carried roughly 33.1x normal volume. Up 22.2% over 24 hours.
DYOR
$COMP #Trading
$COMP sits at $25.94, with the 20 and 50 hourly averages both below price. The three day range runs from $20.62 up to $29.30. That puts price in the middle of the range. The ceiling is 13.0% away while the floor sits well below current levels. The 20 has stayed above the 50 for 20 candles. RSI at 61 is neutral, so momentum is not blocking a move either way. Over the past day it has traded between $21.09 and $29.30, sitting around the middle of it now. The last 24 hours carried roughly 33.1x normal volume. Up 22.2% over 24 hours.
DYOR
$COMP #Trading
421
·
--
🔴 $NEAR · 1H
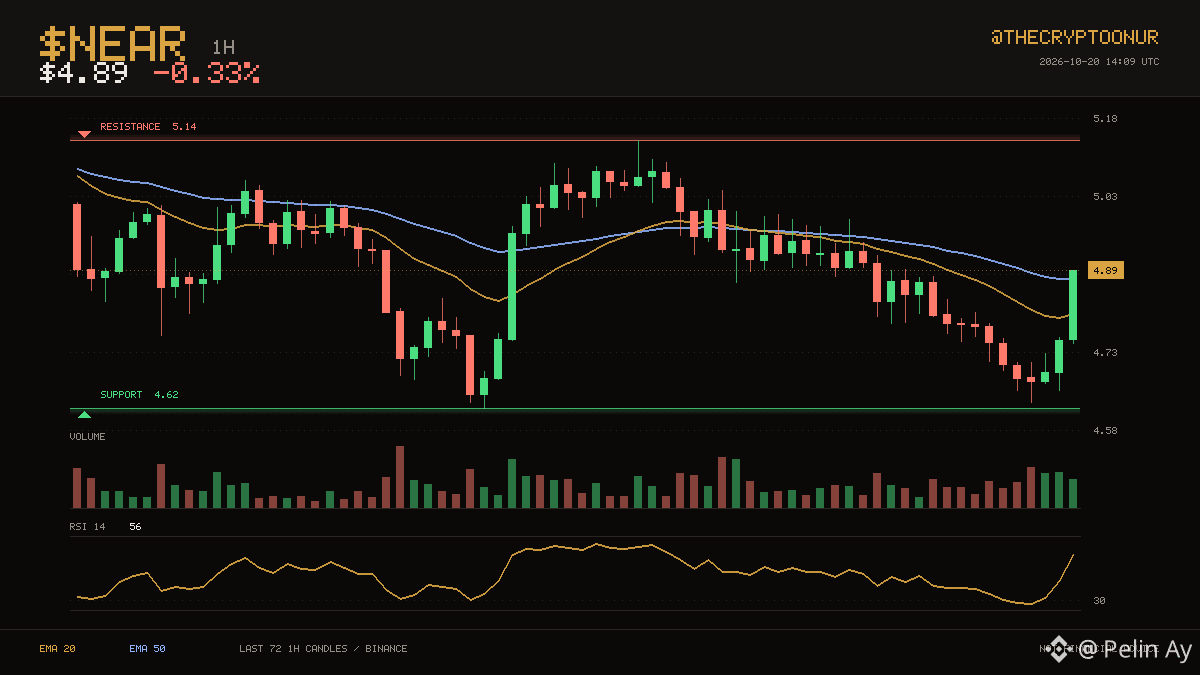
$4.89 keeps $NEAR on the stronger side of its hourly averages. $4.62 on the low side and $5.14 on the high side have contained the last three days. Price is roughly mid range here. Resistance sits 5.2% above and support 5.5% below. Averages have been ordered the same way for 23 candles, with the 20 below the 50. Momentum is mid range with RSI at 56. The 24 hour range runs $4.63 to $5.00, and price is around the middle of it. Volume is close to normal at 0.8x the recent average. Those averages sit at $4.81 and $4.87 respectively. Down 0.3% over 24 hours.
DYOR
$NEAR #Crypto
🔴 $NEAR · 1H
$4.89 keeps $NEAR on the stronger side of its hourly averages. $4.62 on the low side and $5.14 on the high side have contained the last three days. Price is roughly mid range here. Resistance sits 5.2% above and support 5.5% below. Averages have been ordered the same way for 23 candles, with the 20 below the 50. Momentum is mid range with RSI at 56. The 24 hour range runs $4.63 to $5.00, and price is around the middle of it. Volume is close to normal at 0.8x the recent average. Those averages sit at $4.81 and $4.87 respectively. Down 0.3% over 24 hours.
DYOR
$NEAR #Crypto
$4.89 keeps $NEAR on the stronger side of its hourly averages. $4.62 on the low side and $5.14 on the high side have contained the last three days. Price is roughly mid range here. Resistance sits 5.2% above and support 5.5% below. Averages have been ordered the same way for 23 candles, with the 20 below the 50. Momentum is mid range with RSI at 56. The 24 hour range runs $4.63 to $5.00, and price is around the middle of it. Volume is close to normal at 0.8x the recent average. Those averages sit at $4.81 and $4.87 respectively. Down 0.3% over 24 hours.
DYOR
$NEAR #Crypto
1
446
·
--
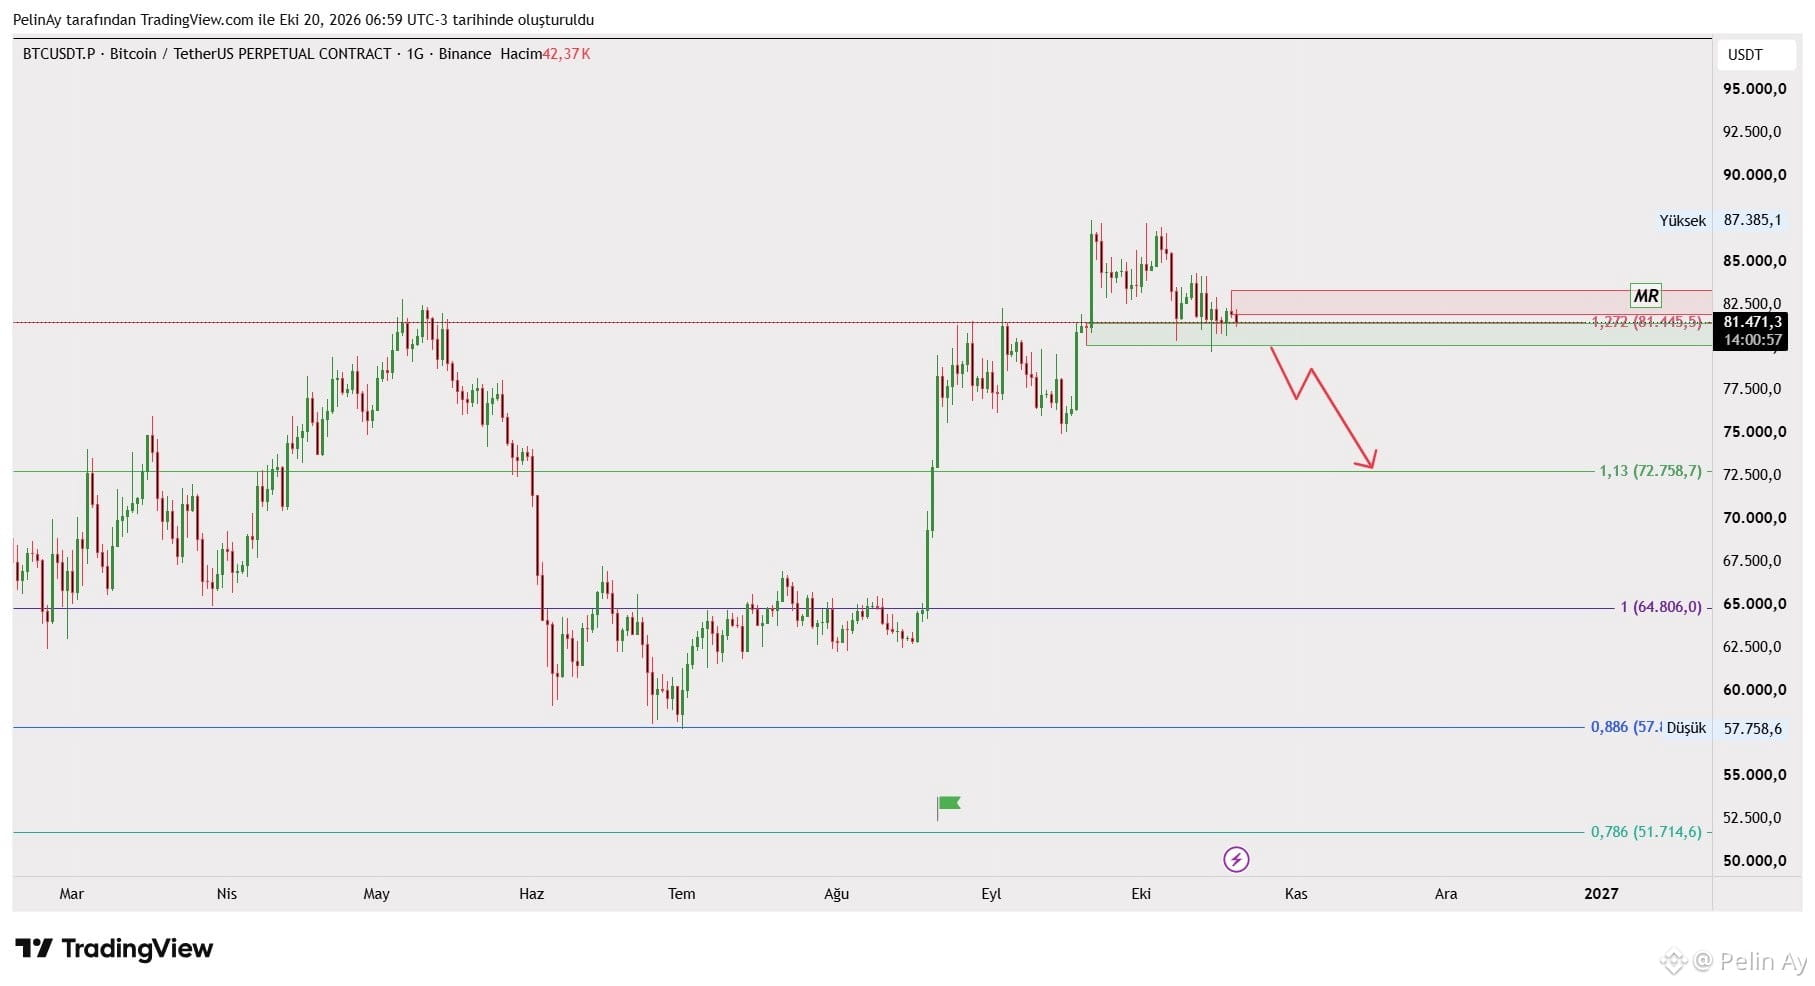
Bitcoin is trading below its Monday range. This indicates that sellers have been dominant this week. Investors are focused on the interest rate decision to be announced on Thursday. If the price loses the $81,500 support, the drop to $72,750 will be rapid. I'm still waiting to add more. My cost basis is around $59,000. #BTC #Bitcoin $BTC
Bitcoin is trading below its Monday range. This indicates that sellers have been dominant this week. Investors are focused on the interest rate decision to be announced on Thursday. If the price loses the $81,500 support, the drop to $72,750 will be rapid. I'm still waiting to add more. My cost basis is around $59,000. #BTC #Bitcoin $BTC
1
128
·
--
📉 $HBAR · 1H
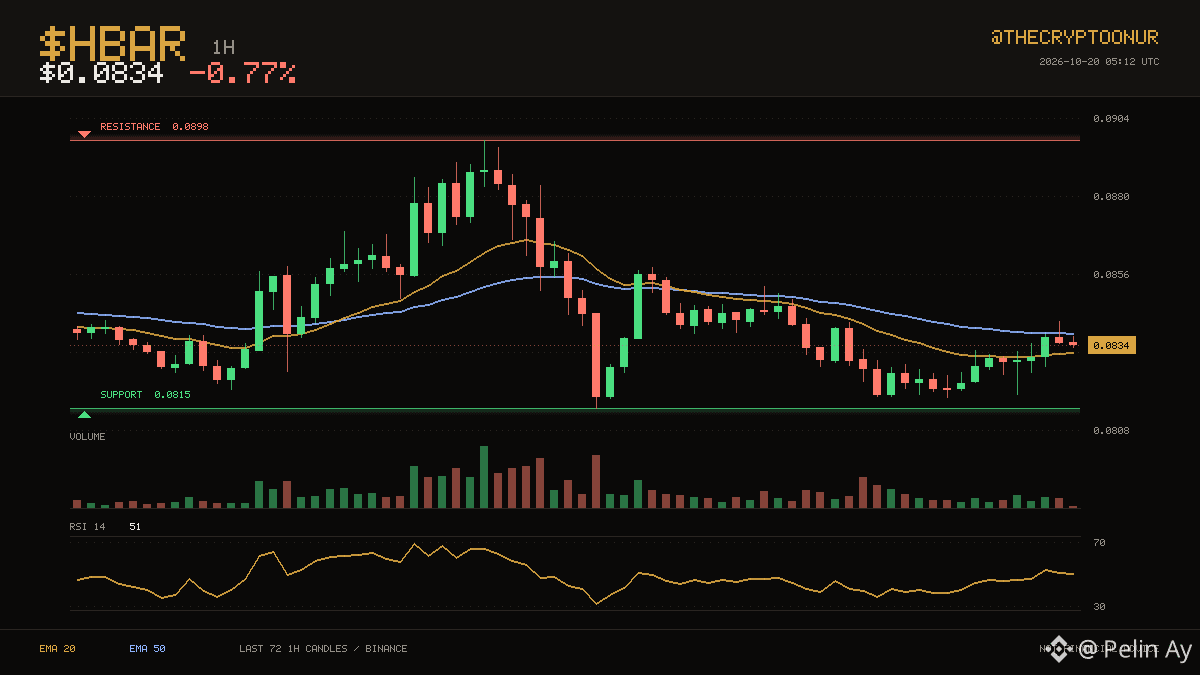
$HBAR is at $0.0834, with one average above price and one below. The three day range runs from $0.0815 up to $0.0898. It is sitting in the bottom third of the range. Resistance sits 7.6% above and support 2.3% below. Averages have been ordered the same way for 28 candles, with the 20 below the 50. Momentum is mid range with RSI at 51. The 24 hour range runs $0.0818 to $0.0853, and price is around the middle of it. Volume is close to normal at 0.7x the recent average. Those averages sit at $0.0832 and $0.0838 respectively. Down 0.8% over 24 hours.
DYOR
$HBAR #Crypto
📉 $HBAR · 1H
$HBAR is at $0.0834, with one average above price and one below. The three day range runs from $0.0815 up to $0.0898. It is sitting in the bottom third of the range. Resistance sits 7.6% above and support 2.3% below. Averages have been ordered the same way for 28 candles, with the 20 below the 50. Momentum is mid range with RSI at 51. The 24 hour range runs $0.0818 to $0.0853, and price is around the middle of it. Volume is close to normal at 0.7x the recent average. Those averages sit at $0.0832 and $0.0838 respectively. Down 0.8% over 24 hours.
DYOR
$HBAR #Crypto
$HBAR is at $0.0834, with one average above price and one below. The three day range runs from $0.0815 up to $0.0898. It is sitting in the bottom third of the range. Resistance sits 7.6% above and support 2.3% below. Averages have been ordered the same way for 28 candles, with the 20 below the 50. Momentum is mid range with RSI at 51. The 24 hour range runs $0.0818 to $0.0853, and price is around the middle of it. Volume is close to normal at 0.7x the recent average. Those averages sit at $0.0832 and $0.0838 respectively. Down 0.8% over 24 hours.
DYOR
$HBAR #Crypto
1.2k
·
--
🔴 $STRK · 1H
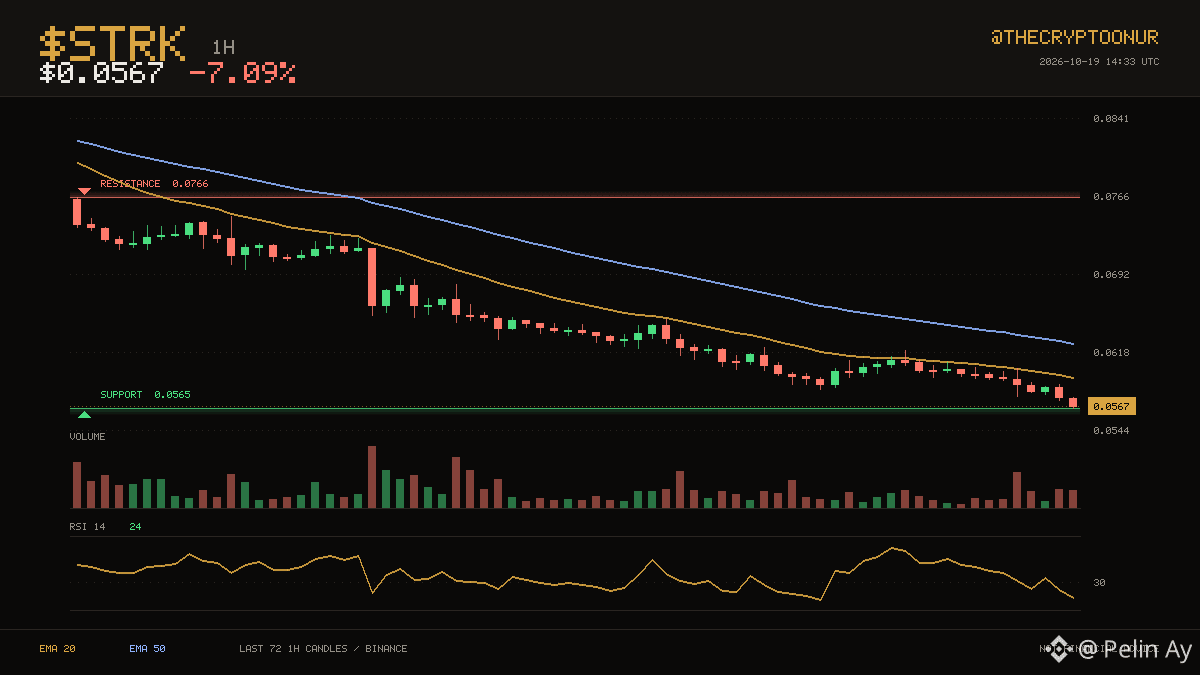
Price is $0.0567 and $STRK remains below the averages that capped it earlier. Buyers have been showing up around $0.0565, which is where price is sitting now. It is sitting in the bottom third of the range. Support is the near one at 0.4% below; the range high is far above. Averages have been ordered the same way for a long stretch now, with the 20 below the 50. RSI has dropped to 24, the kind of reading that usually comes with a bounce attempt. The 24 hour range runs $0.0565 to $0.0623, and price is near the bottom of it. Volume is thin, around 0.4x the recent average, so moves here are easier to fade. Down 7.1% over 24 hours.
⚠️ DYOR
$STRK #Crypto
🔴 $STRK · 1H
Price is $0.0567 and $STRK remains below the averages that capped it earlier. Buyers have been showing up around $0.0565, which is where price is sitting now. It is sitting in the bottom third of the range. Support is the near one at 0.4% below; the range high is far above. Averages have been ordered the same way for a long stretch now, with the 20 below the 50. RSI has dropped to 24, the kind of reading that usually comes with a bounce attempt. The 24 hour range runs $0.0565 to $0.0623, and price is near the bottom of it. Volume is thin, around 0.4x the recent average, so moves here are easier to fade. Down 7.1% over 24 hours.
⚠️ DYOR
$STRK #Crypto
Price is $0.0567 and $STRK remains below the averages that capped it earlier. Buyers have been showing up around $0.0565, which is where price is sitting now. It is sitting in the bottom third of the range. Support is the near one at 0.4% below; the range high is far above. Averages have been ordered the same way for a long stretch now, with the 20 below the 50. RSI has dropped to 24, the kind of reading that usually comes with a bounce attempt. The 24 hour range runs $0.0565 to $0.0623, and price is near the bottom of it. Volume is thin, around 0.4x the recent average, so moves here are easier to fade. Down 7.1% over 24 hours.
⚠️ DYOR
$STRK #Crypto
3
419
Көбірек контент көру үшін кіріңіз
Binance Square платформасында әлемдік криптоқоғамдастыққа қосылыңыз
⚡️ Криптовалюта туралы ең соңғы және пайдалы ақпаратты алыңыз.
💬 Әлемдегі ең ірі криптобиржаның сеніміне ие.
👍 Расталған авторлардың нақты пікірлерін табыңыз.
Электрондық пошта/телефон нөмірі
Трендтегі тақырыптар
BinancePick
3M рет көрілді
151,548 адам талқылап жатыр
Join #EarningsSeason: Predict Earnings on Binance Pick, Share Your Take on Binance Square!
Binance Square Official
·408 лайк
·342.3k рет көрілді
EarningsSeason
5.2M рет көрілді
25,772 адам талқылап жатыр
AnthropicTTMRevenueGrewAbout1200%
18,112 рет көрілді
329 адам талқылап жатыр