

MrMidan
82 Жариялаулар

MrMidan
Хабарлау
Пайдаланушыны блоктау
26 Жазылым
139 Жазылушылар
99 лайк басылған
Жазбалар
Барлығы
Баға ұсыныстары
·
--
Мақала
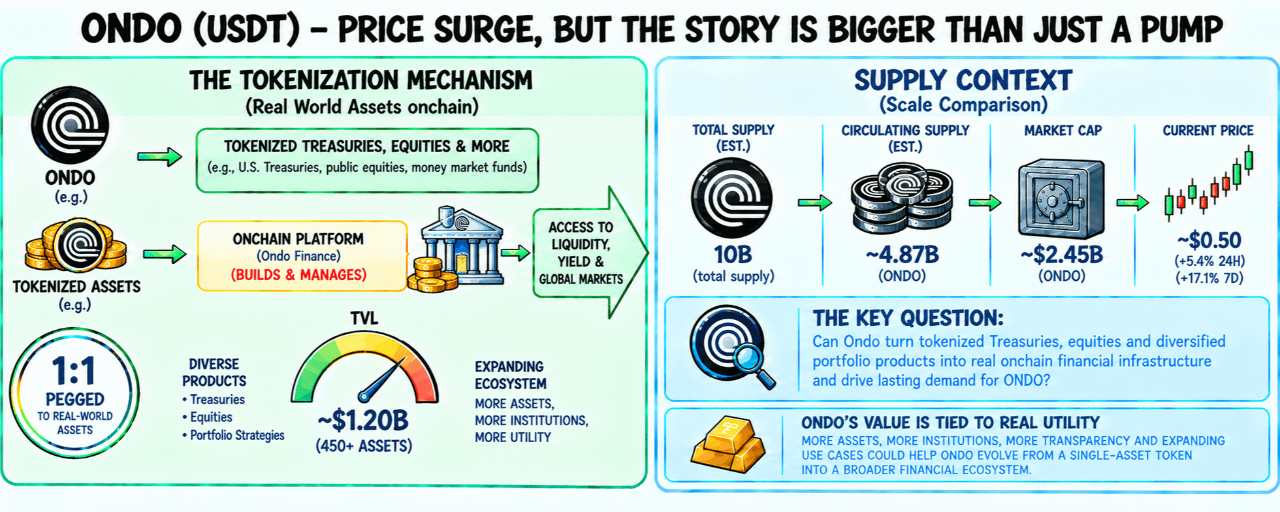
ONDO is showing why the tokenization narrative is becoming much bigger than just another RWA tradeI’m watching the $0.48–$0.52 zone closely because ONDO is currently trading around $0.50, with roughly $366M in 24H volume and a market cap near $2.45B. The token is still well below its $2.14 all-time high, while the circulating supply is around 4.87B ONDO out of a 10B total supply.
The part that really stands out to me is what Ondo is building underneath the token
Ondo currently reports around $1.20B in TVL across more than 450 assets, while its product ecosystem covers tokenized Treasuries, equities and other onchain financial products.
The latest development makes that story even more interesting
On September 24, Ondo launched Intelligent Portfolios, offering three onchain portfolio products based on strategies developed by BlackRock for Ondo. The products package diversified investment exposure into single transferable tokens for eligible investors outside the U.S.
That creates a very different growth angle for ONDO
Ondo is not simply trying to put one traditional asset on a blockchain. The platform is moving toward an infrastructure layer where Treasuries, equities and diversified portfolio strategies can exist as transferable onchain assets
There is also another important piece developing around Ondo Stocks
In September, Ondo introduced an in-kind conversion route that allows eligible institutions to contribute existing equity holdings and receive corresponding tokenized shares, rather than selling those shares for cash before tokenization. That can reduce friction between traditional securities and their onchain versions.
The U.S. side is also becoming more concrete
In July, Ondo announced tokenized versions of BlackRock’s iShares Core S&P 500 ETF and Micron shares using a custodial structure where the underlying securities remain within the traditional regulated custody chain. The structure also includes shareholder communications and proxy voting through Broadridge.
That matters because the long-term question for ONDO is not simply how many people trade the token
It is whether Ondo can keep expanding the amount of real financial value that moves through its tokenization infrastructure
From the chart, I’d keep the levels simple
Bullish confirmation: ONDO holds the $0.48–$0.50 area and reclaims $0.52 with expanding spot volume. Acceptance above that zone would show buyers are absorbing the recent volatility rather than simply producing another short-term bounce
Bearish confirmation: losing $0.48 and failing to reclaim it would weaken the current structure and put the recent recovery under pressure
The bigger story here is not just price
It is whether tokenized Treasuries, equities and portfolio products can develop into a genuine onchain financial market, with Ondo providing the infrastructure underneath it
That is the part I’m watching now because the protocol is expanding from individual tokenized assets toward a broader financial ecosystem, while ONDO itself remains a governance token whose value does not automatically move one-for-one with the growth of those products.$ONDO #ONDO
ONDO is showing why the tokenization narrative is becoming much bigger than just another RWA trade
I’m watching the $0.48–$0.52 zone closely because ONDO is currently trading around $0.50, with roughly $366M in 24H volume and a market cap near $2.45B. The token is still well below its $2.14 all-time high, while the circulating supply is around 4.87B ONDO out of a 10B total supply.
The part that really stands out to me is what Ondo is building underneath the token
Ondo currently reports around $1.20B in TVL across more than 450 assets, while its product ecosystem covers tokenized Treasuries, equities and other onchain financial products.
The latest development makes that story even more interesting
On September 24, Ondo launched Intelligent Portfolios, offering three onchain portfolio products based on strategies developed by BlackRock for Ondo. The products package diversified investment exposure into single transferable tokens for eligible investors outside the U.S.
That creates a very different growth angle for ONDO
Ondo is not simply trying to put one traditional asset on a blockchain. The platform is moving toward an infrastructure layer where Treasuries, equities and diversified portfolio strategies can exist as transferable onchain assets
There is also another important piece developing around Ondo Stocks
In September, Ondo introduced an in-kind conversion route that allows eligible institutions to contribute existing equity holdings and receive corresponding tokenized shares, rather than selling those shares for cash before tokenization. That can reduce friction between traditional securities and their onchain versions.
The U.S. side is also becoming more concrete
In July, Ondo announced tokenized versions of BlackRock’s iShares Core S&P 500 ETF and Micron shares using a custodial structure where the underlying securities remain within the traditional regulated custody chain. The structure also includes shareholder communications and proxy voting through Broadridge.
That matters because the long-term question for ONDO is not simply how many people trade the token
It is whether Ondo can keep expanding the amount of real financial value that moves through its tokenization infrastructure
From the chart, I’d keep the levels simple
Bullish confirmation: ONDO holds the $0.48–$0.50 area and reclaims $0.52 with expanding spot volume. Acceptance above that zone would show buyers are absorbing the recent volatility rather than simply producing another short-term bounce
Bearish confirmation: losing $0.48 and failing to reclaim it would weaken the current structure and put the recent recovery under pressure
The bigger story here is not just price
It is whether tokenized Treasuries, equities and portfolio products can develop into a genuine onchain financial market, with Ondo providing the infrastructure underneath it
That is the part I’m watching now because the protocol is expanding from individual tokenized assets toward a broader financial ecosystem, while ONDO itself remains a governance token whose value does not automatically move one-for-one with the growth of those products.$ONDO #ONDO
The part that really stands out to me is what Ondo is building underneath the token
Ondo currently reports around $1.20B in TVL across more than 450 assets, while its product ecosystem covers tokenized Treasuries, equities and other onchain financial products.
The latest development makes that story even more interesting
On September 24, Ondo launched Intelligent Portfolios, offering three onchain portfolio products based on strategies developed by BlackRock for Ondo. The products package diversified investment exposure into single transferable tokens for eligible investors outside the U.S.
That creates a very different growth angle for ONDO
Ondo is not simply trying to put one traditional asset on a blockchain. The platform is moving toward an infrastructure layer where Treasuries, equities and diversified portfolio strategies can exist as transferable onchain assets
There is also another important piece developing around Ondo Stocks
In September, Ondo introduced an in-kind conversion route that allows eligible institutions to contribute existing equity holdings and receive corresponding tokenized shares, rather than selling those shares for cash before tokenization. That can reduce friction between traditional securities and their onchain versions.
The U.S. side is also becoming more concrete
In July, Ondo announced tokenized versions of BlackRock’s iShares Core S&P 500 ETF and Micron shares using a custodial structure where the underlying securities remain within the traditional regulated custody chain. The structure also includes shareholder communications and proxy voting through Broadridge.
That matters because the long-term question for ONDO is not simply how many people trade the token
It is whether Ondo can keep expanding the amount of real financial value that moves through its tokenization infrastructure
From the chart, I’d keep the levels simple
Bullish confirmation: ONDO holds the $0.48–$0.50 area and reclaims $0.52 with expanding spot volume. Acceptance above that zone would show buyers are absorbing the recent volatility rather than simply producing another short-term bounce
Bearish confirmation: losing $0.48 and failing to reclaim it would weaken the current structure and put the recent recovery under pressure
The bigger story here is not just price
It is whether tokenized Treasuries, equities and portfolio products can develop into a genuine onchain financial market, with Ondo providing the infrastructure underneath it
That is the part I’m watching now because the protocol is expanding from individual tokenized assets toward a broader financial ecosystem, while ONDO itself remains a governance token whose value does not automatically move one-for-one with the growth of those products.$ONDO #ONDO
140
·
--
Мақала
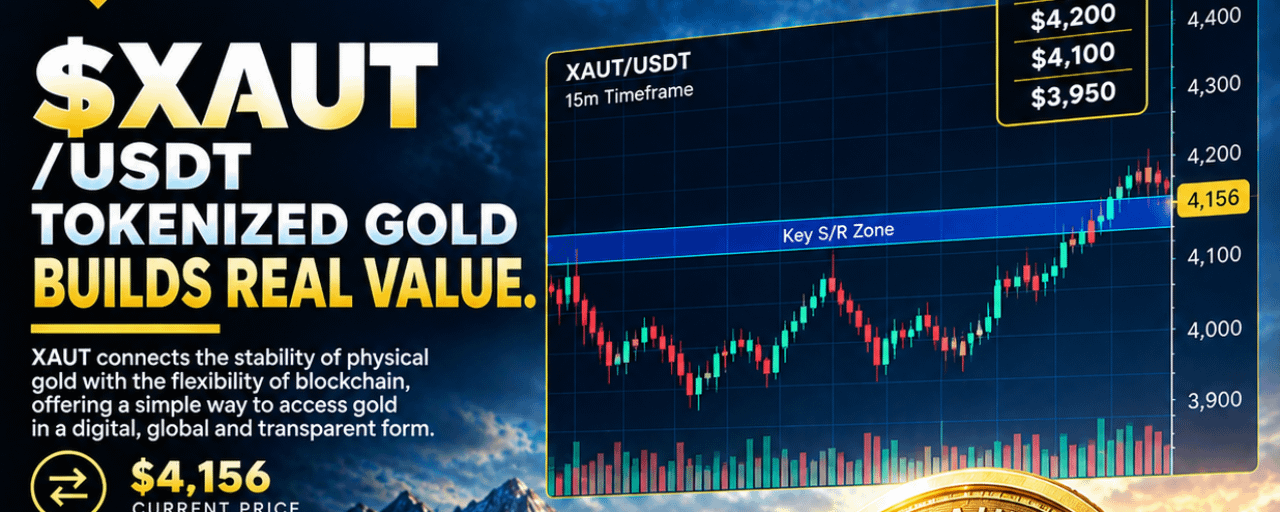
XAUT is showing why tokenized gold is becoming more than just a crypto version of holding bullionI’m watching the $4,100–$4,200 zone closely because XAUT recently pulled back with gold, closing around $4,156 on September 30 after trading near $4,375 earlier in the month. Daily trading volume has remained active, with roughly $192M recorded on October 1, while XAUT’s market cap is around $3.36B.
The part that really stands out to me is what is happening underneath the token
XAUT represents one fine troy ounce of physical gold held in allocated form, with the underlying bullion stored in Switzerland. Tether reported that XAUT holdings increased 9.5% during Q2 2026 even while gold prices fell 14.1% during the quarter, showing that demand for tokenized gold continued during a correction.
That creates a different setup from a normal crypto asset
XAUT is directly tied to the gold market, so its next move depends heavily on macro conditions rather than crypto momentum alone. Recent gold weakness has been linked to rising U.S. Treasury yields and expectations for additional Federal Reserve rate hikes, with spot gold falling as low as $4,111 on September 28.
There is also an interesting adoption angle
Tether recently announced a collaboration with Shiga to support self-custodial financial products across Africa and the GCC using USD₮, Bitcoin and XAU₮. The products are designed to let individuals, businesses and institutions hold and transfer XAU₮ directly, while financial institutions can build payment and treasury services around the infrastructure.
That matters because XAUT is increasingly being positioned as usable financial infrastructure rather than simply a digital representation of gold
Tether’s latest finance data shows about 22,168.9 kg of gold associated with XAU₮, while the token’s market cap is listed around $2.95B on its finance page.
From the chart, I’d keep the levels simple
Bullish confirmation: XAUT holds the $4,100–$4,150 area and then reclaims $4,200 with stronger buying volume. Acceptance above that zone would suggest the recent gold correction is finding demand rather than turning into a deeper breakdown
Bearish confirmation: losing $4,100 and failing to reclaim it would keep the short-term structure under pressure and expose the next downside area around $4,000
The bigger story here is not just whether XAUT moves higher or lower
It is whether tokenized gold can continue gaining real utility while physical gold remains an important macro asset. XAUT already combines blockchain transferability with allocated physical gold, and expanding self-custodial and institutional use could make that structure increasingly relevant
For now, I’m watching the $4,100 support and $4,200 reclaim more closely than the headline price because that should tell us whether buyers are actually returning or simply defending the recent correction
$XAUT #XAUT #GOLD
XAUT is showing why tokenized gold is becoming more than just a crypto version of holding bullion
I’m watching the $4,100–$4,200 zone closely because XAUT recently pulled back with gold, closing around $4,156 on September 30 after trading near $4,375 earlier in the month. Daily trading volume has remained active, with roughly $192M recorded on October 1, while XAUT’s market cap is around $3.36B.
The part that really stands out to me is what is happening underneath the token
XAUT represents one fine troy ounce of physical gold held in allocated form, with the underlying bullion stored in Switzerland. Tether reported that XAUT holdings increased 9.5% during Q2 2026 even while gold prices fell 14.1% during the quarter, showing that demand for tokenized gold continued during a correction.
That creates a different setup from a normal crypto asset
XAUT is directly tied to the gold market, so its next move depends heavily on macro conditions rather than crypto momentum alone. Recent gold weakness has been linked to rising U.S. Treasury yields and expectations for additional Federal Reserve rate hikes, with spot gold falling as low as $4,111 on September 28.
There is also an interesting adoption angle
Tether recently announced a collaboration with Shiga to support self-custodial financial products across Africa and the GCC using USD₮, Bitcoin and XAU₮. The products are designed to let individuals, businesses and institutions hold and transfer XAU₮ directly, while financial institutions can build payment and treasury services around the infrastructure.
That matters because XAUT is increasingly being positioned as usable financial infrastructure rather than simply a digital representation of gold
Tether’s latest finance data shows about 22,168.9 kg of gold associated with XAU₮, while the token’s market cap is listed around $2.95B on its finance page.
From the chart, I’d keep the levels simple
Bullish confirmation: XAUT holds the $4,100–$4,150 area and then reclaims $4,200 with stronger buying volume. Acceptance above that zone would suggest the recent gold correction is finding demand rather than turning into a deeper breakdown
Bearish confirmation: losing $4,100 and failing to reclaim it would keep the short-term structure under pressure and expose the next downside area around $4,000
The bigger story here is not just whether XAUT moves higher or lower
It is whether tokenized gold can continue gaining real utility while physical gold remains an important macro asset. XAUT already combines blockchain transferability with allocated physical gold, and expanding self-custodial and institutional use could make that structure increasingly relevant
For now, I’m watching the $4,100 support and $4,200 reclaim more closely than the headline price because that should tell us whether buyers are actually returning or simply defending the recent correction
$XAUT #XAUT #GOLD
The part that really stands out to me is what is happening underneath the token
XAUT represents one fine troy ounce of physical gold held in allocated form, with the underlying bullion stored in Switzerland. Tether reported that XAUT holdings increased 9.5% during Q2 2026 even while gold prices fell 14.1% during the quarter, showing that demand for tokenized gold continued during a correction.
That creates a different setup from a normal crypto asset
XAUT is directly tied to the gold market, so its next move depends heavily on macro conditions rather than crypto momentum alone. Recent gold weakness has been linked to rising U.S. Treasury yields and expectations for additional Federal Reserve rate hikes, with spot gold falling as low as $4,111 on September 28.
There is also an interesting adoption angle
Tether recently announced a collaboration with Shiga to support self-custodial financial products across Africa and the GCC using USD₮, Bitcoin and XAU₮. The products are designed to let individuals, businesses and institutions hold and transfer XAU₮ directly, while financial institutions can build payment and treasury services around the infrastructure.
That matters because XAUT is increasingly being positioned as usable financial infrastructure rather than simply a digital representation of gold
Tether’s latest finance data shows about 22,168.9 kg of gold associated with XAU₮, while the token’s market cap is listed around $2.95B on its finance page.
From the chart, I’d keep the levels simple
Bullish confirmation: XAUT holds the $4,100–$4,150 area and then reclaims $4,200 with stronger buying volume. Acceptance above that zone would suggest the recent gold correction is finding demand rather than turning into a deeper breakdown
Bearish confirmation: losing $4,100 and failing to reclaim it would keep the short-term structure under pressure and expose the next downside area around $4,000
The bigger story here is not just whether XAUT moves higher or lower
It is whether tokenized gold can continue gaining real utility while physical gold remains an important macro asset. XAUT already combines blockchain transferability with allocated physical gold, and expanding self-custodial and institutional use could make that structure increasingly relevant
For now, I’m watching the $4,100 support and $4,200 reclaim more closely than the headline price because that should tell us whether buyers are actually returning or simply defending the recent correction
$XAUT #XAUT #GOLD
63
·
--
Жоғары (өспелі)
ETHUSDT (Ethereum) — Market & Trading Update
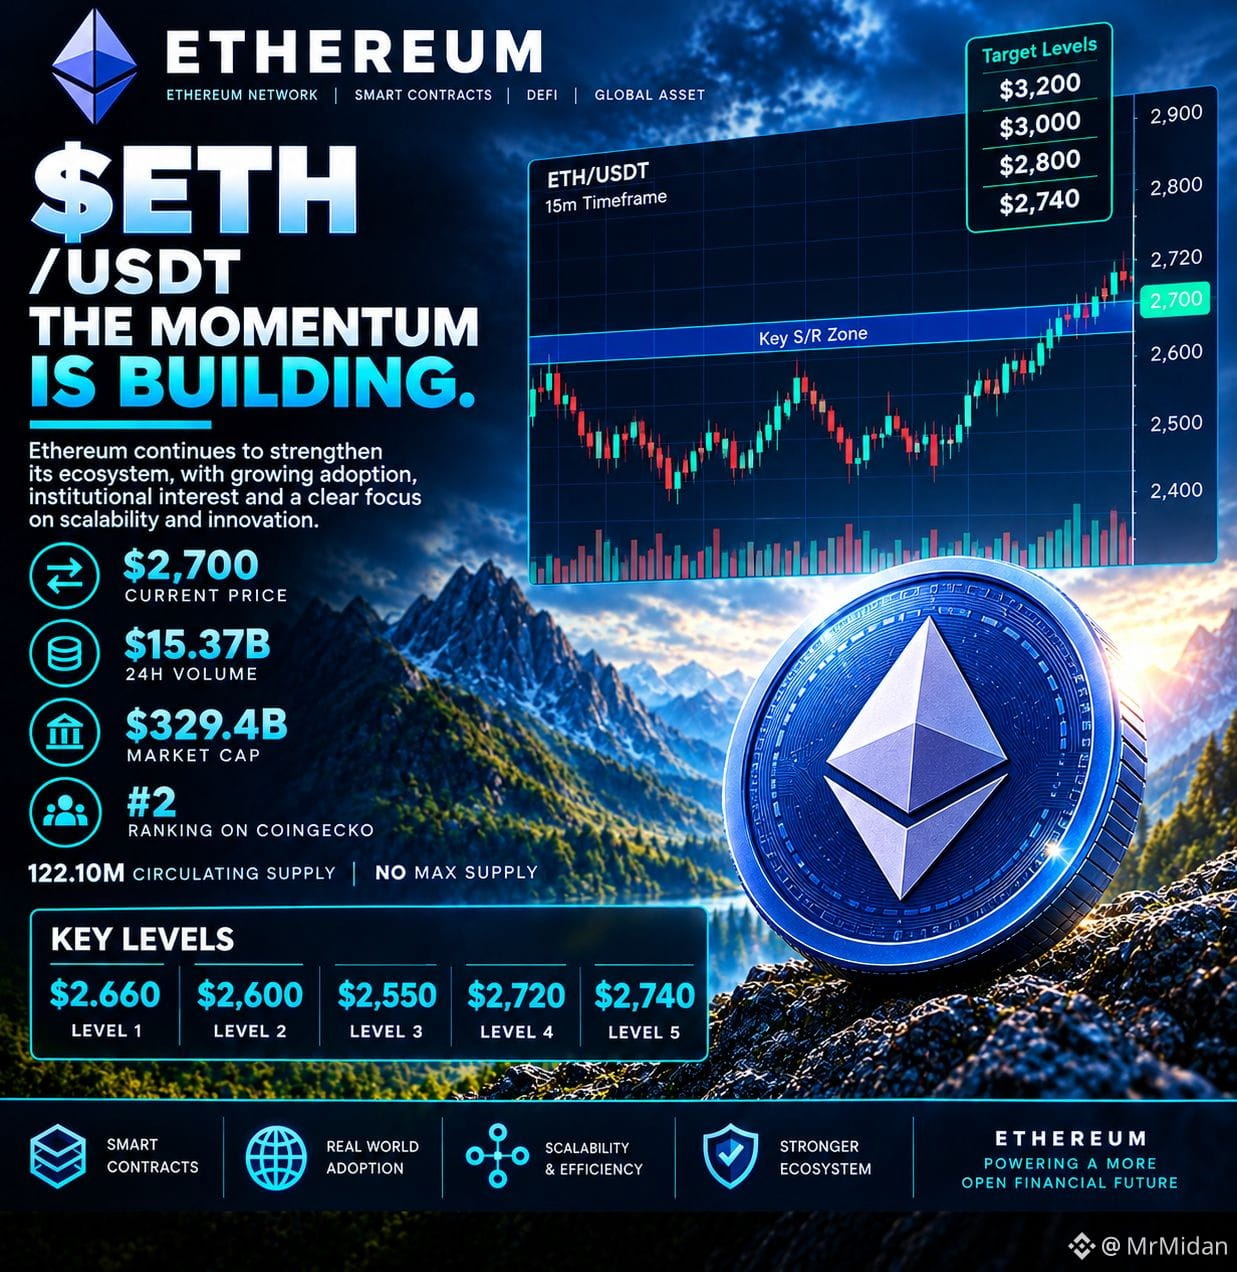
Live ETH trades around $2,700, up ~0.4% in 24h and ~2.2% over the past 7d. 24h volume is about $15.37B, market cap ~$329.4B, ranking #2, with 122.10M ETH circulating and no fixed maximum supply.
ETF flows: U.S. spot Ethereum ETFs attracted roughly $690M of net inflows during Sept. 21–25, reversing the previous week’s outflows. The latest available daily data showed a $59.6M net outflow on Sept. 30, so institutional demand remains active but has become less consistent in the short term.
Network development: Ethereum is approaching the Sepolia testnet activation of the Glamsterdam upgrade scheduled for Oct. 6. The upgrade work includes proposer-builder separation, block-level access lists and revised gas pricing, keeping scalability and network efficiency in focus.
Trading signals: ETH is holding around the $2,700 area after testing the recent $2,720–$2,740 region. The short-term structure remains range-bound until buyers reclaim the upper resistance zone or sellers take control below support. Support: $2,660, $2,600, $2,550. Resistance: $2,720–$2,740, $2,800, $3,000.
Buy plan: Consider longs only after a confirmed reclaim above $2,740 with strong follow-through, targeting $2,800 → $3,000 → $3,200. A successful retest of the $2,660–$2,680 area followed by renewed buying could also provide a continuation setup.
Sell/short plan: Rejection around $2,720–$2,740 or a clean break below $2,660 favors $2,600 → $2,550. A stronger downside move would require sellers to take control below the $2,550 support area.
Risk invalidation: For longs, sustained trading below the chosen support zone weakens the setup. For shorts, a confirmed reclaim above $2,740 invalidates the rejection idea.
The bigger story is that ETH is entering October with a stronger monthly backdrop, continued institutional interest and an upcoming network upgrade, but price still needs to clear the $2,720–$2,740 area to show that buyers are ready to push the next leg higher.
#EtherGains70.9%InQ3 #ETH🔥🔥🔥🔥🔥🔥 $ETH
ETHUSDT (Ethereum) — Market & Trading Update
Live ETH trades around $2,700, up ~0.4% in 24h and ~2.2% over the past 7d. 24h volume is about $15.37B, market cap ~$329.4B, ranking #2, with 122.10M ETH circulating and no fixed maximum supply.
ETF flows: U.S. spot Ethereum ETFs attracted roughly $690M of net inflows during Sept. 21–25, reversing the previous week’s outflows. The latest available daily data showed a $59.6M net outflow on Sept. 30, so institutional demand remains active but has become less consistent in the short term.
Network development: Ethereum is approaching the Sepolia testnet activation of the Glamsterdam upgrade scheduled for Oct. 6. The upgrade work includes proposer-builder separation, block-level access lists and revised gas pricing, keeping scalability and network efficiency in focus.
Trading signals: ETH is holding around the $2,700 area after testing the recent $2,720–$2,740 region. The short-term structure remains range-bound until buyers reclaim the upper resistance zone or sellers take control below support. Support: $2,660, $2,600, $2,550. Resistance: $2,720–$2,740, $2,800, $3,000.
Buy plan: Consider longs only after a confirmed reclaim above $2,740 with strong follow-through, targeting $2,800 → $3,000 → $3,200. A successful retest of the $2,660–$2,680 area followed by renewed buying could also provide a continuation setup.
Sell/short plan: Rejection around $2,720–$2,740 or a clean break below $2,660 favors $2,600 → $2,550. A stronger downside move would require sellers to take control below the $2,550 support area.
Risk invalidation: For longs, sustained trading below the chosen support zone weakens the setup. For shorts, a confirmed reclaim above $2,740 invalidates the rejection idea.
The bigger story is that ETH is entering October with a stronger monthly backdrop, continued institutional interest and an upcoming network upgrade, but price still needs to clear the $2,720–$2,740 area to show that buyers are ready to push the next leg higher.
#EtherGains70.9%InQ3 #ETH🔥🔥🔥🔥🔥🔥 $ETH
Live ETH trades around $2,700, up ~0.4% in 24h and ~2.2% over the past 7d. 24h volume is about $15.37B, market cap ~$329.4B, ranking #2, with 122.10M ETH circulating and no fixed maximum supply.
ETF flows: U.S. spot Ethereum ETFs attracted roughly $690M of net inflows during Sept. 21–25, reversing the previous week’s outflows. The latest available daily data showed a $59.6M net outflow on Sept. 30, so institutional demand remains active but has become less consistent in the short term.
Network development: Ethereum is approaching the Sepolia testnet activation of the Glamsterdam upgrade scheduled for Oct. 6. The upgrade work includes proposer-builder separation, block-level access lists and revised gas pricing, keeping scalability and network efficiency in focus.
Trading signals: ETH is holding around the $2,700 area after testing the recent $2,720–$2,740 region. The short-term structure remains range-bound until buyers reclaim the upper resistance zone or sellers take control below support. Support: $2,660, $2,600, $2,550. Resistance: $2,720–$2,740, $2,800, $3,000.
Buy plan: Consider longs only after a confirmed reclaim above $2,740 with strong follow-through, targeting $2,800 → $3,000 → $3,200. A successful retest of the $2,660–$2,680 area followed by renewed buying could also provide a continuation setup.
Sell/short plan: Rejection around $2,720–$2,740 or a clean break below $2,660 favors $2,600 → $2,550. A stronger downside move would require sellers to take control below the $2,550 support area.
Risk invalidation: For longs, sustained trading below the chosen support zone weakens the setup. For shorts, a confirmed reclaim above $2,740 invalidates the rejection idea.
The bigger story is that ETH is entering October with a stronger monthly backdrop, continued institutional interest and an upcoming network upgrade, but price still needs to clear the $2,720–$2,740 area to show that buyers are ready to push the next leg higher.
#EtherGains70.9%InQ3 #ETH🔥🔥🔥🔥🔥🔥 $ETH
30
·
--
BTCUSDT (Bitcoin) — Market & Trading Update
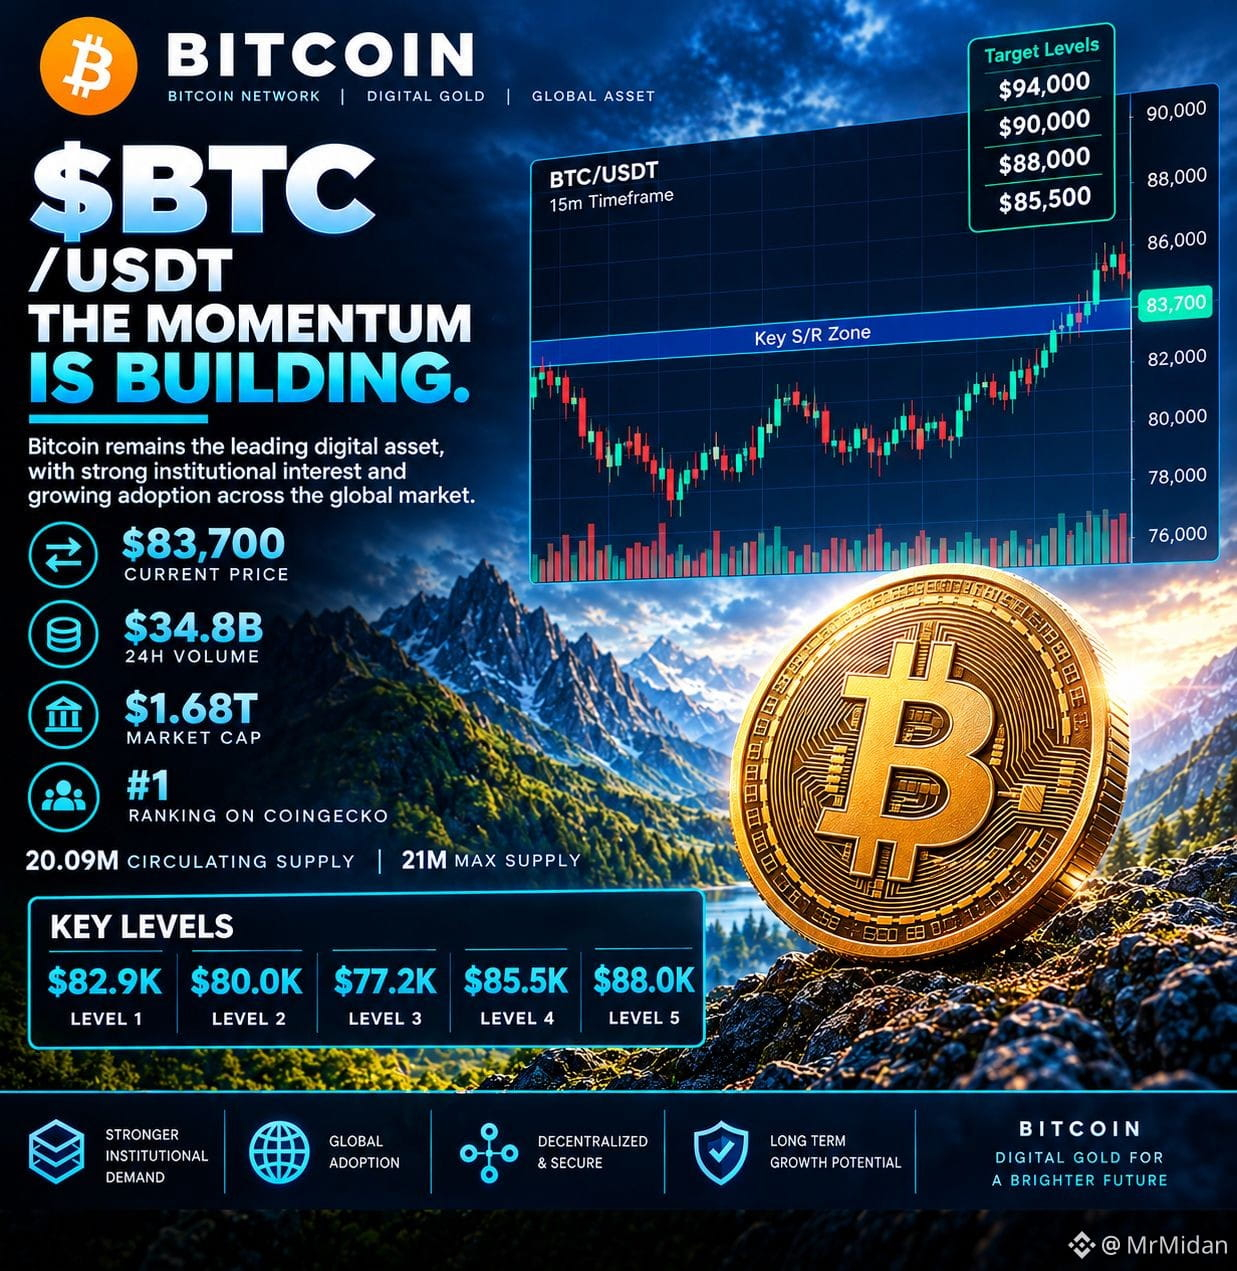
Live BTC trades around $83,700, up ~0.2% in 24h but down ~1.0% over the past 7d. 24h volume is about $34.8B, market cap ~$1.68T, ranking #1 on CoinGecko, with 20.09M BTC circulating versus a 21M maximum supply.
ETF flows: U.S. spot Bitcoin ETFs ended a nine-session inflow streak with about $148.7M in combined net outflows on Wednesday. The previous nine-day run had brought roughly $3.1B of net inflows, showing that institutional demand had strengthened before the latest pullback.
Market context: Bitcoin closed September up about 6.4% and is now trading around the $84K area. Softer inflation data has helped risk sentiment, but elevated Treasury yields and the latest ETF outflows are keeping the short-term structure mixed.
Trading signals: BTC is holding above the $82.9K area but remains below the recent $85.5K high, leaving the market in a range until either level breaks. Support: $82.9K, $80.0K, $77.2K. Resistance: $85.5K, $88.0K, $90.0K.
Buy plan: Consider longs only after a confirmed reclaim above $85.5K with strong follow-through, targeting $88K → $90K → $94K. A successful hold around $82.9K followed by renewed buying could also provide a continuation setup.
Sell/short plan: Rejection below $85.5K or a clean break under $82.9K favors $80K → $77.2K. A stronger downside move would require sellers to take control below the $80K support area.
Risk invalidation: For longs, sustained trading below the chosen support zone weakens the setup. For shorts, a confirmed reclaim above $85.5K invalidates the rejection idea.
The bigger story is that BTC has entered October after a strong September recovery, but the next move still depends on whether buyers can turn the $85.5K area into support while institutional ETF demand stabilizes again.#BTC $BTC
{future}(BTCUSDT)
BTCUSDT (Bitcoin) — Market & Trading Update
Live BTC trades around $83,700, up ~0.2% in 24h but down ~1.0% over the past 7d. 24h volume is about $34.8B, market cap ~$1.68T, ranking #1 on CoinGecko, with 20.09M BTC circulating versus a 21M maximum supply.
ETF flows: U.S. spot Bitcoin ETFs ended a nine-session inflow streak with about $148.7M in combined net outflows on Wednesday. The previous nine-day run had brought roughly $3.1B of net inflows, showing that institutional demand had strengthened before the latest pullback.
Market context: Bitcoin closed September up about 6.4% and is now trading around the $84K area. Softer inflation data has helped risk sentiment, but elevated Treasury yields and the latest ETF outflows are keeping the short-term structure mixed.
Trading signals: BTC is holding above the $82.9K area but remains below the recent $85.5K high, leaving the market in a range until either level breaks. Support: $82.9K, $80.0K, $77.2K. Resistance: $85.5K, $88.0K, $90.0K.
Buy plan: Consider longs only after a confirmed reclaim above $85.5K with strong follow-through, targeting $88K → $90K → $94K. A successful hold around $82.9K followed by renewed buying could also provide a continuation setup.
Sell/short plan: Rejection below $85.5K or a clean break under $82.9K favors $80K → $77.2K. A stronger downside move would require sellers to take control below the $80K support area.
Risk invalidation: For longs, sustained trading below the chosen support zone weakens the setup. For shorts, a confirmed reclaim above $85.5K invalidates the rejection idea.
The bigger story is that BTC has entered October after a strong September recovery, but the next move still depends on whether buyers can turn the $85.5K area into support while institutional ETF demand stabilizes again.#BTC $BTC
Live BTC trades around $83,700, up ~0.2% in 24h but down ~1.0% over the past 7d. 24h volume is about $34.8B, market cap ~$1.68T, ranking #1 on CoinGecko, with 20.09M BTC circulating versus a 21M maximum supply.
ETF flows: U.S. spot Bitcoin ETFs ended a nine-session inflow streak with about $148.7M in combined net outflows on Wednesday. The previous nine-day run had brought roughly $3.1B of net inflows, showing that institutional demand had strengthened before the latest pullback.
Market context: Bitcoin closed September up about 6.4% and is now trading around the $84K area. Softer inflation data has helped risk sentiment, but elevated Treasury yields and the latest ETF outflows are keeping the short-term structure mixed.
Trading signals: BTC is holding above the $82.9K area but remains below the recent $85.5K high, leaving the market in a range until either level breaks. Support: $82.9K, $80.0K, $77.2K. Resistance: $85.5K, $88.0K, $90.0K.
Buy plan: Consider longs only after a confirmed reclaim above $85.5K with strong follow-through, targeting $88K → $90K → $94K. A successful hold around $82.9K followed by renewed buying could also provide a continuation setup.
Sell/short plan: Rejection below $85.5K or a clean break under $82.9K favors $80K → $77.2K. A stronger downside move would require sellers to take control below the $80K support area.
Risk invalidation: For longs, sustained trading below the chosen support zone weakens the setup. For shorts, a confirmed reclaim above $85.5K invalidates the rejection idea.
The bigger story is that BTC has entered October after a strong September recovery, but the next move still depends on whether buyers can turn the $85.5K area into support while institutional ETF demand stabilizes again.#BTC $BTC
28
·
--
ADA/USDT — STRONG RECOVERY, BUT I’M NOT CHASING THE MOVE
ADA is trading around $0.249 after recovering from the recent $0.239 area. The important part is that buyers have pushed price back above $0.24, but ADA is still facing resistance around $0.256–$0.265. I’d rather wait for a clean retest than buy directly into that resistance.
The zone I’m watching is $0.242–$0.247. A return into this area, a clear buyer reaction, and then a candle close back above $0.250 would give me a cleaner long confirmation.
My plan
Interest zone: $0.242–$0.247
Confirmation: buyers defend the zone + close above $0.250
TP1: $0.256
TP2: $0.264
TP3: $0.280
Invalidation: below $0.235
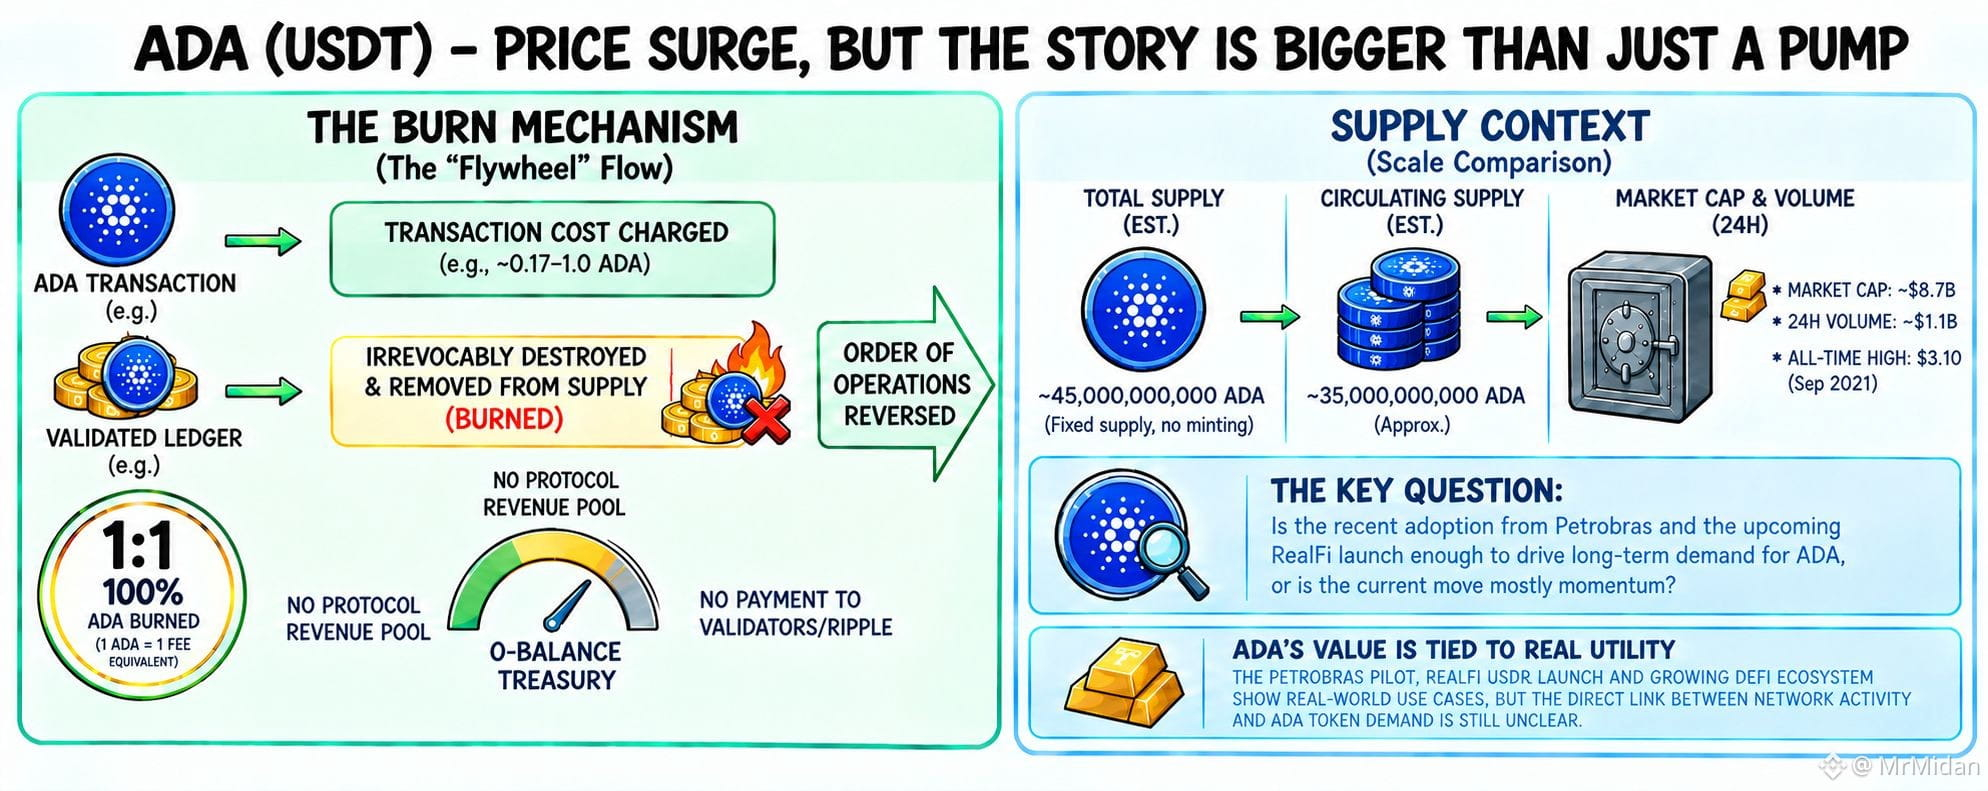
There is also a fresh fundamental catalyst behind the recovery. The Cardano Foundation announced that Petrobras is testing Cardano-based applications for tracking environmental claims related to sustainable aviation fuel and renewable diesel. That gives ADA a real-world adoption narrative, although the announcement itself does not guarantee direct token demand.
Another development to watch is Cardano’s RealFi launch on October 1, bringing the USDr stablecoin platform to mainnet. At the same time, ADA derivatives open interest has recently declined, so the price recovery still needs to prove that demand is sustainable rather than purely momentum-driven.
✔️ My plan now is WAITING: I want ADA to return toward $0.242–$0.247, show buyers stepping in, and reclaim $0.250 before considering the long.
If $0.235 breaks and price cannot reclaim it, I’m abandoning this recovery setup and waiting for a new structure. #MetaMaskExitsLidoValidatorsAfterSecurityIncident $ADA #ADA
{future}(ADAUSDT)
ADA/USDT — STRONG RECOVERY, BUT I’M NOT CHASING THE MOVE
ADA is trading around $0.249 after recovering from the recent $0.239 area. The important part is that buyers have pushed price back above $0.24, but ADA is still facing resistance around $0.256–$0.265. I’d rather wait for a clean retest than buy directly into that resistance.
The zone I’m watching is $0.242–$0.247. A return into this area, a clear buyer reaction, and then a candle close back above $0.250 would give me a cleaner long confirmation.
My plan
Interest zone: $0.242–$0.247
Confirmation: buyers defend the zone + close above $0.250
TP1: $0.256
TP2: $0.264
TP3: $0.280
Invalidation: below $0.235
There is also a fresh fundamental catalyst behind the recovery. The Cardano Foundation announced that Petrobras is testing Cardano-based applications for tracking environmental claims related to sustainable aviation fuel and renewable diesel. That gives ADA a real-world adoption narrative, although the announcement itself does not guarantee direct token demand.
Another development to watch is Cardano’s RealFi launch on October 1, bringing the USDr stablecoin platform to mainnet. At the same time, ADA derivatives open interest has recently declined, so the price recovery still needs to prove that demand is sustainable rather than purely momentum-driven.
✔️ My plan now is WAITING: I want ADA to return toward $0.242–$0.247, show buyers stepping in, and reclaim $0.250 before considering the long.
If $0.235 breaks and price cannot reclaim it, I’m abandoning this recovery setup and waiting for a new structure. #MetaMaskExitsLidoValidatorsAfterSecurityIncident $ADA #ADA
ADA is trading around $0.249 after recovering from the recent $0.239 area. The important part is that buyers have pushed price back above $0.24, but ADA is still facing resistance around $0.256–$0.265. I’d rather wait for a clean retest than buy directly into that resistance.
The zone I’m watching is $0.242–$0.247. A return into this area, a clear buyer reaction, and then a candle close back above $0.250 would give me a cleaner long confirmation.
My plan
Interest zone: $0.242–$0.247
Confirmation: buyers defend the zone + close above $0.250
TP1: $0.256
TP2: $0.264
TP3: $0.280
Invalidation: below $0.235
There is also a fresh fundamental catalyst behind the recovery. The Cardano Foundation announced that Petrobras is testing Cardano-based applications for tracking environmental claims related to sustainable aviation fuel and renewable diesel. That gives ADA a real-world adoption narrative, although the announcement itself does not guarantee direct token demand.
Another development to watch is Cardano’s RealFi launch on October 1, bringing the USDr stablecoin platform to mainnet. At the same time, ADA derivatives open interest has recently declined, so the price recovery still needs to prove that demand is sustainable rather than purely momentum-driven.
✔️ My plan now is WAITING: I want ADA to return toward $0.242–$0.247, show buyers stepping in, and reclaim $0.250 before considering the long.
If $0.235 breaks and price cannot reclaim it, I’m abandoning this recovery setup and waiting for a new structure. #MetaMaskExitsLidoValidatorsAfterSecurityIncident $ADA #ADA
1
139
·
--
Жоғары (өспелі)
QNT/USDT — THE SURGE IS REAL, BUT I'M NOT CHASING THE LAST CANDLE
QNT is trading around $296–$300 after an explosive September move that took price from the $60s to a recent high near $373. The current structure is still strong, but the daily RSI is around 81, so the move is extremely stretched. For me, this is a zone where waiting for a proper retest makes more sense than jumping into the top.
The zone I'm watching is $275–$285. A return into this area, a clear buyer reaction, and then a candle close back above $300 would give me a cleaner long confirmation.
My plan
Interest zone: $275–$285
Confirmation: buyers defend the zone + close above $300
TP1: $320
TP2: $350
TP3: $373
Invalidation: below $260
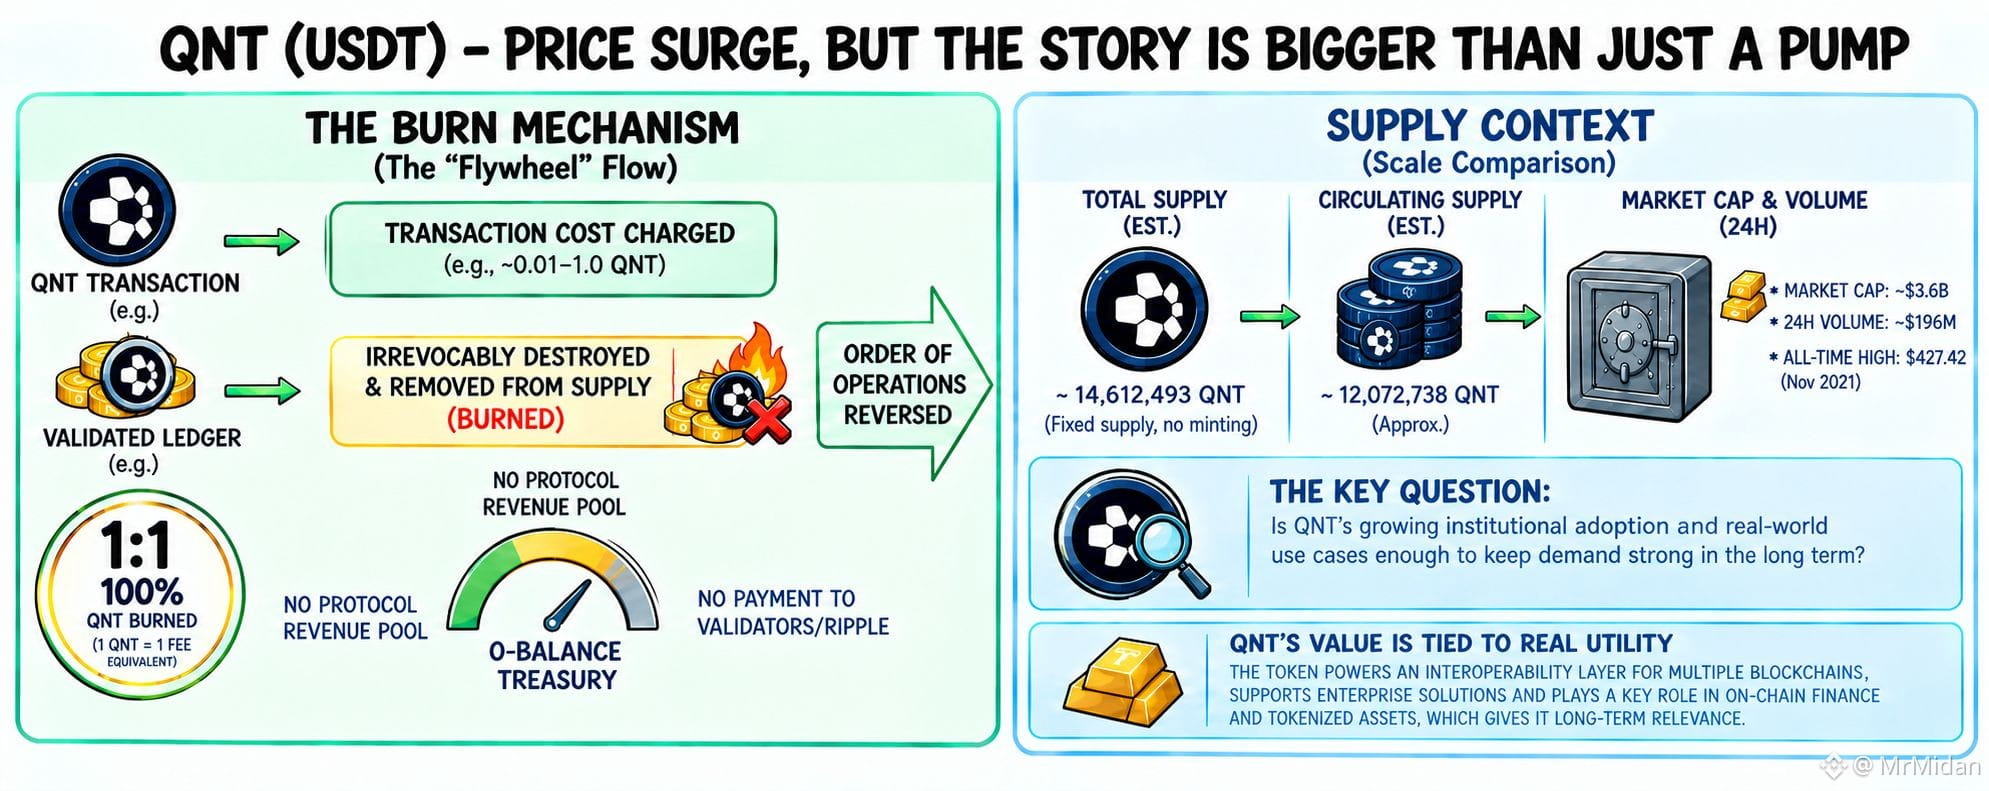
The fundamental catalyst is significant. On September 24, The Clearing House selected Quant to provide the interoperability, orchestration and transaction-management layer for its On-Chain Money Initiative, designed to help financial institutions clear and settle tokenized deposits. The network is expected to become available to participating institutions in the first half of 2027.
But there is an important distinction here: the announcement concerns Quant's technology, not a disclosed requirement for banks to buy or hold QNT. The direct connection between future network activity and QNT token demand has not been publicly specified.
✔️ My plan now is WAITING: I want QNT to return toward $275–$285, show buyers defending the zone, and reclaim $300 before considering the long.
If $260 breaks, I'm abandoning the current recovery setup and waiting for a new structure. After a move this large, protecting capital matters more than catching every candle.$QNT
{future}(QNTUSDT)
QNT/USDT — THE SURGE IS REAL, BUT I'M NOT CHASING THE LAST CANDLE
QNT is trading around $296–$300 after an explosive September move that took price from the $60s to a recent high near $373. The current structure is still strong, but the daily RSI is around 81, so the move is extremely stretched. For me, this is a zone where waiting for a proper retest makes more sense than jumping into the top.
The zone I'm watching is $275–$285. A return into this area, a clear buyer reaction, and then a candle close back above $300 would give me a cleaner long confirmation.
My plan
Interest zone: $275–$285
Confirmation: buyers defend the zone + close above $300
TP1: $320
TP2: $350
TP3: $373
Invalidation: below $260
The fundamental catalyst is significant. On September 24, The Clearing House selected Quant to provide the interoperability, orchestration and transaction-management layer for its On-Chain Money Initiative, designed to help financial institutions clear and settle tokenized deposits. The network is expected to become available to participating institutions in the first half of 2027.
But there is an important distinction here: the announcement concerns Quant's technology, not a disclosed requirement for banks to buy or hold QNT. The direct connection between future network activity and QNT token demand has not been publicly specified.
✔️ My plan now is WAITING: I want QNT to return toward $275–$285, show buyers defending the zone, and reclaim $300 before considering the long.
If $260 breaks, I'm abandoning the current recovery setup and waiting for a new structure. After a move this large, protecting capital matters more than catching every candle.$QNT
QNT is trading around $296–$300 after an explosive September move that took price from the $60s to a recent high near $373. The current structure is still strong, but the daily RSI is around 81, so the move is extremely stretched. For me, this is a zone where waiting for a proper retest makes more sense than jumping into the top.
The zone I'm watching is $275–$285. A return into this area, a clear buyer reaction, and then a candle close back above $300 would give me a cleaner long confirmation.
My plan
Interest zone: $275–$285
Confirmation: buyers defend the zone + close above $300
TP1: $320
TP2: $350
TP3: $373
Invalidation: below $260
The fundamental catalyst is significant. On September 24, The Clearing House selected Quant to provide the interoperability, orchestration and transaction-management layer for its On-Chain Money Initiative, designed to help financial institutions clear and settle tokenized deposits. The network is expected to become available to participating institutions in the first half of 2027.
But there is an important distinction here: the announcement concerns Quant's technology, not a disclosed requirement for banks to buy or hold QNT. The direct connection between future network activity and QNT token demand has not been publicly specified.
✔️ My plan now is WAITING: I want QNT to return toward $275–$285, show buyers defending the zone, and reclaim $300 before considering the long.
If $260 breaks, I'm abandoning the current recovery setup and waiting for a new structure. After a move this large, protecting capital matters more than catching every candle.$QNT
474
·
--
Жоғары (өспелі)
LINKUSDT (Chainlink) — Market & Trading Update
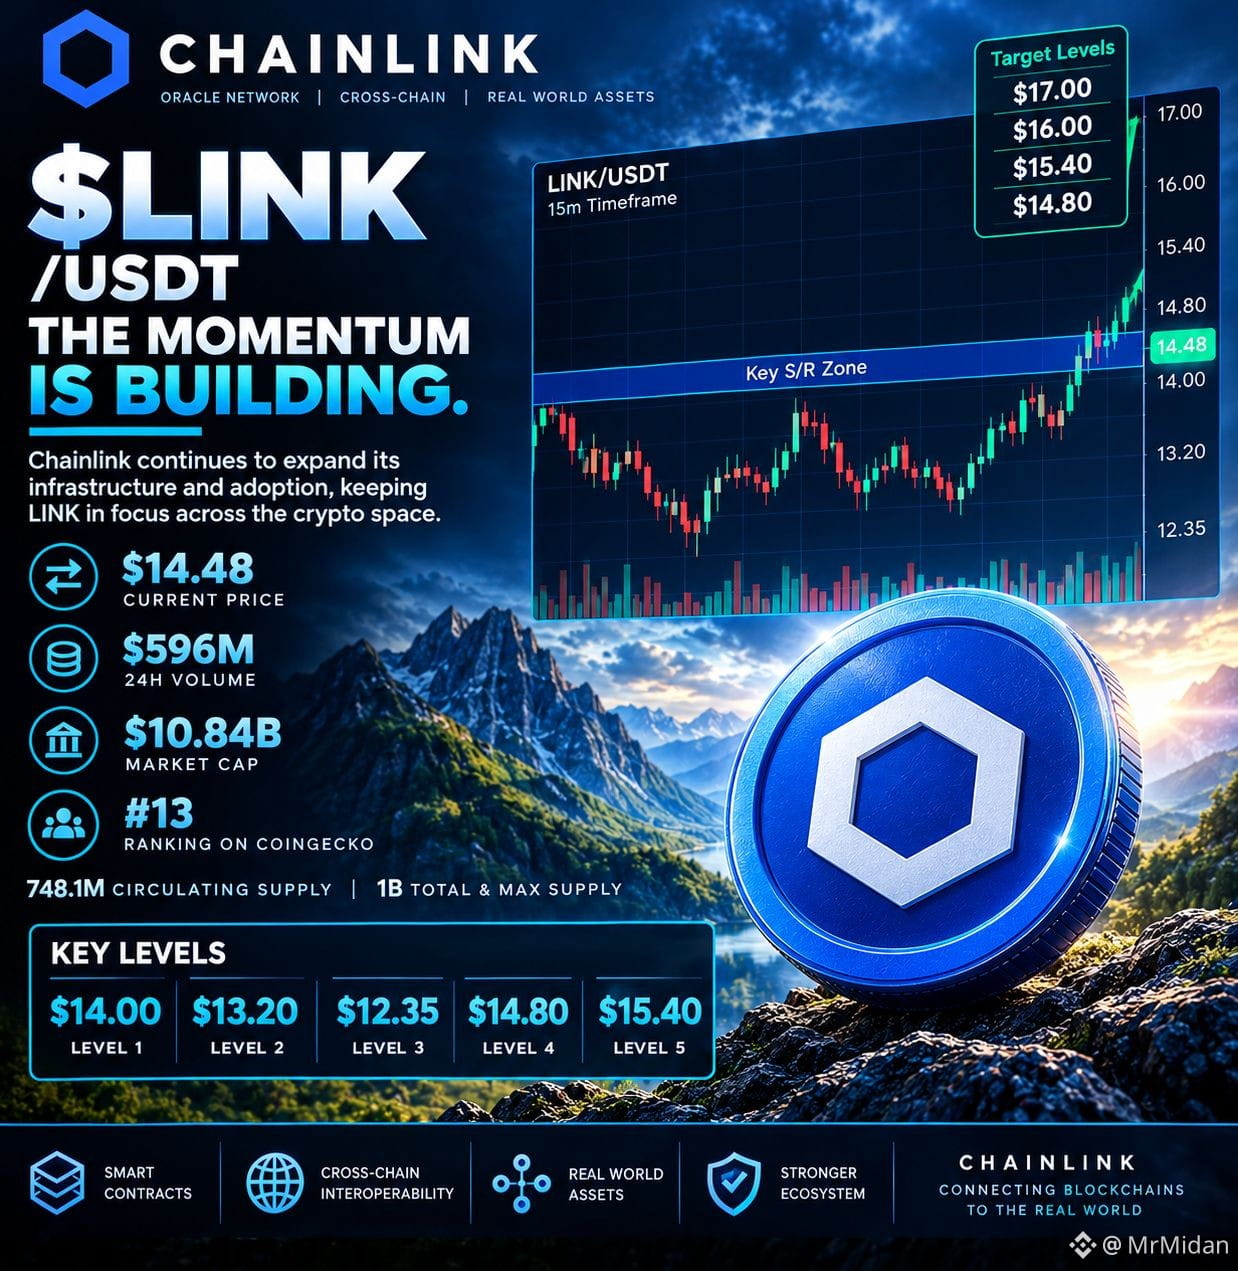
Live LINK trades around $14.48, up ~0.3% in 24h and around 17.3% over the past 7d. 24h volume is about $596M, market cap ~$10.84B, ranking #13 on CoinGecko, with 748.1M LINK circulating versus 1B total and maximum supply.
Fundamental development: Chainlink launched CCIP 2.0 on Sept. 28, adding features such as custom verification, built-in compliance controls and configurable finality speeds for institutions and digital-asset issuers. Chainlink says more than $84B in total cross-chain token value is now secured through CCIP, with over $15B migrating to the standard in the last four months.
Recent momentum: LINK moved from a Sept. 23 close near $12.35 to around $14.48 currently, while daily trading volume has remained elevated. The recent move keeps the broader short-term structure constructive, but price is now approaching the $14.80 area where a rejection could trigger a pullback.
Trading signals: Short-term structure remains positive while LINK holds above the recent $14.0 area. Support: $14.00, $13.20, $12.35. Resistance: $14.80, $15.40, $16.00.
Buy plan: Consider longs after a confirmed breakout and hold above $14.80, targeting $15.40 → $16.00 → $17.00. A successful retest of the $14.00–14.20 area followed by renewed buying could also provide a continuation setup.
Sell/short plan: Rejection around $14.80 or a clean break below $14.00 could favor a move toward $13.20 → $12.35. Stronger downside confirmation would come from losing the recent $13.20 support area.
Risk invalidation: For longs, losing the chosen support zone weakens the setup. For shorts, a sustained reclaim above $14.80 invalidates the rejection idea.
The bigger story is that LINK is moving with renewed momentum while Chainlink continues expanding its infrastructure toward institutional and tokenized-asset markets. The key question now is whether buyers can turn the $14.80 area into support rather than allowing the recent rally to retrace $LINK #US10YearYieldNears5.3% #EtherGains70.9%InQ3 #MetaMaskExitsLidoValidatorsAfterSecurityIncident
LINKUSDT (Chainlink) — Market & Trading Update
Live LINK trades around $14.48, up ~0.3% in 24h and around 17.3% over the past 7d. 24h volume is about $596M, market cap ~$10.84B, ranking #13 on CoinGecko, with 748.1M LINK circulating versus 1B total and maximum supply.
Fundamental development: Chainlink launched CCIP 2.0 on Sept. 28, adding features such as custom verification, built-in compliance controls and configurable finality speeds for institutions and digital-asset issuers. Chainlink says more than $84B in total cross-chain token value is now secured through CCIP, with over $15B migrating to the standard in the last four months.
Recent momentum: LINK moved from a Sept. 23 close near $12.35 to around $14.48 currently, while daily trading volume has remained elevated. The recent move keeps the broader short-term structure constructive, but price is now approaching the $14.80 area where a rejection could trigger a pullback.
Trading signals: Short-term structure remains positive while LINK holds above the recent $14.0 area. Support: $14.00, $13.20, $12.35. Resistance: $14.80, $15.40, $16.00.
Buy plan: Consider longs after a confirmed breakout and hold above $14.80, targeting $15.40 → $16.00 → $17.00. A successful retest of the $14.00–14.20 area followed by renewed buying could also provide a continuation setup.
Sell/short plan: Rejection around $14.80 or a clean break below $14.00 could favor a move toward $13.20 → $12.35. Stronger downside confirmation would come from losing the recent $13.20 support area.
Risk invalidation: For longs, losing the chosen support zone weakens the setup. For shorts, a sustained reclaim above $14.80 invalidates the rejection idea.
The bigger story is that LINK is moving with renewed momentum while Chainlink continues expanding its infrastructure toward institutional and tokenized-asset markets. The key question now is whether buyers can turn the $14.80 area into support rather than allowing the recent rally to retrace $LINK #US10YearYieldNears5.3% #EtherGains70.9%InQ3 #MetaMaskExitsLidoValidatorsAfterSecurityIncident
Live LINK trades around $14.48, up ~0.3% in 24h and around 17.3% over the past 7d. 24h volume is about $596M, market cap ~$10.84B, ranking #13 on CoinGecko, with 748.1M LINK circulating versus 1B total and maximum supply.
Fundamental development: Chainlink launched CCIP 2.0 on Sept. 28, adding features such as custom verification, built-in compliance controls and configurable finality speeds for institutions and digital-asset issuers. Chainlink says more than $84B in total cross-chain token value is now secured through CCIP, with over $15B migrating to the standard in the last four months.
Recent momentum: LINK moved from a Sept. 23 close near $12.35 to around $14.48 currently, while daily trading volume has remained elevated. The recent move keeps the broader short-term structure constructive, but price is now approaching the $14.80 area where a rejection could trigger a pullback.
Trading signals: Short-term structure remains positive while LINK holds above the recent $14.0 area. Support: $14.00, $13.20, $12.35. Resistance: $14.80, $15.40, $16.00.
Buy plan: Consider longs after a confirmed breakout and hold above $14.80, targeting $15.40 → $16.00 → $17.00. A successful retest of the $14.00–14.20 area followed by renewed buying could also provide a continuation setup.
Sell/short plan: Rejection around $14.80 or a clean break below $14.00 could favor a move toward $13.20 → $12.35. Stronger downside confirmation would come from losing the recent $13.20 support area.
Risk invalidation: For longs, losing the chosen support zone weakens the setup. For shorts, a sustained reclaim above $14.80 invalidates the rejection idea.
The bigger story is that LINK is moving with renewed momentum while Chainlink continues expanding its infrastructure toward institutional and tokenized-asset markets. The key question now is whether buyers can turn the $14.80 area into support rather than allowing the recent rally to retrace $LINK #US10YearYieldNears5.3% #EtherGains70.9%InQ3 #MetaMaskExitsLidoValidatorsAfterSecurityIncident
120
·
--
11
28
·
--
Жоғары (өспелі)
Gold is printing money again… and $XAUT is riding every single tick. 👀
Tether Gold (XAUT/USDT) currently sitting around $4,350 – $4,380 after that strong recovery from the $4,000–$4,050 zone. Still about 20% off the January ATH near $5,500, but the recent bounce has been clean.
Quick technical snapshot:
Support: Strong demand sitting at $4,290 – $4,320. Deeper floor still around $4,200–$4,220.
Resistance: First real ceiling is $4,400 – $4,420. Clean break + hold above that opens the path toward $4,500+.
Structure: Higher lows on the 4H and daily after the early August bottom. Momentum is improving.
RSI: Climbing through the mid-50s to low 60s — healthy, not overbought yet.
MACD: Histogram turning positive, MACD line trying to cross above signal. Short-term bias is shifting bullish.
Volume picked up nicely on the way up from $4,000, which is a good sign. Gold sentiment is clearly back in play and XAUT is tracking it almost 1:1 as expected.
Bull case: Hold above $4,320 and smash $4,400 → next stop $4,500–$4,600.
Bear case: Lose $4,290 and we could retest $4,200 pretty quick.
You stacking physical gold exposure on-chain or just watching this one? Drop your levels 👇
#XAUT #TetherGold #Gold #CryptoTA #RWA $XAUT
{future}(XAUTUSDT)
Gold is printing money again… and $XAUT is riding every single tick. 👀
Tether Gold (XAUT/USDT) currently sitting around $4,350 – $4,380 after that strong recovery from the $4,000–$4,050 zone. Still about 20% off the January ATH near $5,500, but the recent bounce has been clean.
Quick technical snapshot:
Support: Strong demand sitting at $4,290 – $4,320. Deeper floor still around $4,200–$4,220.
Resistance: First real ceiling is $4,400 – $4,420. Clean break + hold above that opens the path toward $4,500+.
Structure: Higher lows on the 4H and daily after the early August bottom. Momentum is improving.
RSI: Climbing through the mid-50s to low 60s — healthy, not overbought yet.
MACD: Histogram turning positive, MACD line trying to cross above signal. Short-term bias is shifting bullish.
Volume picked up nicely on the way up from $4,000, which is a good sign. Gold sentiment is clearly back in play and XAUT is tracking it almost 1:1 as expected.
Bull case: Hold above $4,320 and smash $4,400 → next stop $4,500–$4,600.
Bear case: Lose $4,290 and we could retest $4,200 pretty quick.
You stacking physical gold exposure on-chain or just watching this one? Drop your levels 👇
#XAUT #TetherGold #Gold #CryptoTA #RWA $XAUT
Tether Gold (XAUT/USDT) currently sitting around $4,350 – $4,380 after that strong recovery from the $4,000–$4,050 zone. Still about 20% off the January ATH near $5,500, but the recent bounce has been clean.
Quick technical snapshot:
Support: Strong demand sitting at $4,290 – $4,320. Deeper floor still around $4,200–$4,220.
Resistance: First real ceiling is $4,400 – $4,420. Clean break + hold above that opens the path toward $4,500+.
Structure: Higher lows on the 4H and daily after the early August bottom. Momentum is improving.
RSI: Climbing through the mid-50s to low 60s — healthy, not overbought yet.
MACD: Histogram turning positive, MACD line trying to cross above signal. Short-term bias is shifting bullish.
Volume picked up nicely on the way up from $4,000, which is a good sign. Gold sentiment is clearly back in play and XAUT is tracking it almost 1:1 as expected.
Bull case: Hold above $4,320 and smash $4,400 → next stop $4,500–$4,600.
Bear case: Lose $4,290 and we could retest $4,200 pretty quick.
You stacking physical gold exposure on-chain or just watching this one? Drop your levels 👇
#XAUT #TetherGold #Gold #CryptoTA #RWA $XAUT


104
·
--
Bitmine Hits 5.8 Million ETH
Tom Lee’s Bitmine just got an update.
The company added another 7,391 ETH to its Ethereum holdings this week, bringing its total supply to about 5.805 million ETH.
Key details:
• Bitmine is now the largest corporate Ethereum holder
• Is the second-largest crypto asset treasury company in the world (after Strategy)
• Owns about 4.8% of ETH’s total supply
• Has been accumulating ETH consistently on a weekly basis
• Has seen the majority of its ETH holdings staked
This is a strong sign of institutional confidence in Ethereum as one of the most popular cryptocurrencies.
Tom Lee and Bitmine have been accumulating ETH for a while now and are getting close to their “Alchemy of 5%” goal.
What do you think about this?
#ETH #Ethereum #Bitmine #TomLee #CryptoTreasury #BMNR $ETH
{future}(ETHUSDT)
Bitmine Hits 5.8 Million ETH
Tom Lee’s Bitmine just got an update.
The company added another 7,391 ETH to its Ethereum holdings this week, bringing its total supply to about 5.805 million ETH.
Key details:
• Bitmine is now the largest corporate Ethereum holder
• Is the second-largest crypto asset treasury company in the world (after Strategy)
• Owns about 4.8% of ETH’s total supply
• Has been accumulating ETH consistently on a weekly basis
• Has seen the majority of its ETH holdings staked
This is a strong sign of institutional confidence in Ethereum as one of the most popular cryptocurrencies.
Tom Lee and Bitmine have been accumulating ETH for a while now and are getting close to their “Alchemy of 5%” goal.
What do you think about this?
#ETH #Ethereum #Bitmine #TomLee #CryptoTreasury #BMNR $ETH
Tom Lee’s Bitmine just got an update.
The company added another 7,391 ETH to its Ethereum holdings this week, bringing its total supply to about 5.805 million ETH.
Key details:
• Bitmine is now the largest corporate Ethereum holder
• Is the second-largest crypto asset treasury company in the world (after Strategy)
• Owns about 4.8% of ETH’s total supply
• Has been accumulating ETH consistently on a weekly basis
• Has seen the majority of its ETH holdings staked
This is a strong sign of institutional confidence in Ethereum as one of the most popular cryptocurrencies.
Tom Lee and Bitmine have been accumulating ETH for a while now and are getting close to their “Alchemy of 5%” goal.
What do you think about this?
#ETH #Ethereum #Bitmine #TomLee #CryptoTreasury #BMNR $ETH
18
·
--
Жоғары (өспелі)
TENCENT/USDT Market Update
Tencent Holdings Limited (TENCENT/USDT), as of now, is trading at HKD 476 - 481.
After several days of consolidation and correction, the asset is slowly gaining strength and holds relatively stable now on the day. Meanwhile, it stays significantly undervalued compared to its 52-week peak near HKD 683.
Here are the main points regarding the largest Chinese technological conglomerate:
• One of the biggest Chinese tech companies (WeChat, gaming, cloud, fintech, AI, and major investment arm)
• TENCENT/USDT perpetual contracts are available at crypto exchanges
• 52-week range: HKD 411 – 683
• Recent price action: low-volatility range with occasional bullish attempts
The asset looks slightly positive and consolidates higher for the short term. Nevertheless, it remains in a broad correction from its peak. The main uncertainty for traders is whether Tencent will manage to move higher and break through the recent resistance or remain range-bound.
Are you bullish for now on Tencent’s long-term prospects? Do you think it will continue to consolidate or break out and head to new highs? #TENCENT #TENCENTUSDT #Tencent #ChineseTech #Trading $TENCENT
{future}(TENCENTUSDT)
TENCENT/USDT Market Update
Tencent Holdings Limited (TENCENT/USDT), as of now, is trading at HKD 476 - 481.
After several days of consolidation and correction, the asset is slowly gaining strength and holds relatively stable now on the day. Meanwhile, it stays significantly undervalued compared to its 52-week peak near HKD 683.
Here are the main points regarding the largest Chinese technological conglomerate:
• One of the biggest Chinese tech companies (WeChat, gaming, cloud, fintech, AI, and major investment arm)
• TENCENT/USDT perpetual contracts are available at crypto exchanges
• 52-week range: HKD 411 – 683
• Recent price action: low-volatility range with occasional bullish attempts
The asset looks slightly positive and consolidates higher for the short term. Nevertheless, it remains in a broad correction from its peak. The main uncertainty for traders is whether Tencent will manage to move higher and break through the recent resistance or remain range-bound.
Are you bullish for now on Tencent’s long-term prospects? Do you think it will continue to consolidate or break out and head to new highs? #TENCENT #TENCENTUSDT #Tencent #ChineseTech #Trading $TENCENT
Tencent Holdings Limited (TENCENT/USDT), as of now, is trading at HKD 476 - 481.
After several days of consolidation and correction, the asset is slowly gaining strength and holds relatively stable now on the day. Meanwhile, it stays significantly undervalued compared to its 52-week peak near HKD 683.
Here are the main points regarding the largest Chinese technological conglomerate:
• One of the biggest Chinese tech companies (WeChat, gaming, cloud, fintech, AI, and major investment arm)
• TENCENT/USDT perpetual contracts are available at crypto exchanges
• 52-week range: HKD 411 – 683
• Recent price action: low-volatility range with occasional bullish attempts
The asset looks slightly positive and consolidates higher for the short term. Nevertheless, it remains in a broad correction from its peak. The main uncertainty for traders is whether Tencent will manage to move higher and break through the recent resistance or remain range-bound.
Are you bullish for now on Tencent’s long-term prospects? Do you think it will continue to consolidate or break out and head to new highs? #TENCENT #TENCENTUSDT #Tencent #ChineseTech #Trading $TENCENT
59
·
--
XAU/USD Market Update
Gold is currently trading around the level of $4,320 – $4,340.
Having risen sharply at the beginning of the week and approaching the level of $4,350 – $4,370, gold is facing resistance and consolidation at the moment. The price holds well above the key level of $4,300.
Some observations:
• A powerful rally began from the lower levels of August, namely from the area of $4,050 – $4,100
• Gold reached a local peak at the level of $4,350 – $4,370
• The price consolidates now in the context of a short-term correction
• The overall trend remains bullish in the broader time frame
The current correction/downward correction/downward impulse is viewed by traders as a pause for consolidation after a powerful rally, rather than the beginning of a significant decline.
Gold needs to close above the level of $4,300 in order to resume its growth and begin a new wave of the uptrend. On the other hand, there is a possibility of a more significant short covering.
What is your view on trading gold in the current environment? Would you consider buying dips or waiting for a stronger signal?
#XAUUSD #Gold #XAU #Commodities #trading $XAUT
{future}(XAUTUSDT)
XAU/USD Market Update
Gold is currently trading around the level of $4,320 – $4,340.
Having risen sharply at the beginning of the week and approaching the level of $4,350 – $4,370, gold is facing resistance and consolidation at the moment. The price holds well above the key level of $4,300.
Some observations:
• A powerful rally began from the lower levels of August, namely from the area of $4,050 – $4,100
• Gold reached a local peak at the level of $4,350 – $4,370
• The price consolidates now in the context of a short-term correction
• The overall trend remains bullish in the broader time frame
The current correction/downward correction/downward impulse is viewed by traders as a pause for consolidation after a powerful rally, rather than the beginning of a significant decline.
Gold needs to close above the level of $4,300 in order to resume its growth and begin a new wave of the uptrend. On the other hand, there is a possibility of a more significant short covering.
What is your view on trading gold in the current environment? Would you consider buying dips or waiting for a stronger signal?
#XAUUSD #Gold #XAU #Commodities #trading $XAUT
Gold is currently trading around the level of $4,320 – $4,340.
Having risen sharply at the beginning of the week and approaching the level of $4,350 – $4,370, gold is facing resistance and consolidation at the moment. The price holds well above the key level of $4,300.
Some observations:
• A powerful rally began from the lower levels of August, namely from the area of $4,050 – $4,100
• Gold reached a local peak at the level of $4,350 – $4,370
• The price consolidates now in the context of a short-term correction
• The overall trend remains bullish in the broader time frame
The current correction/downward correction/downward impulse is viewed by traders as a pause for consolidation after a powerful rally, rather than the beginning of a significant decline.
Gold needs to close above the level of $4,300 in order to resume its growth and begin a new wave of the uptrend. On the other hand, there is a possibility of a more significant short covering.
What is your view on trading gold in the current environment? Would you consider buying dips or waiting for a stronger signal?
#XAUUSD #Gold #XAU #Commodities #trading $XAUT
128
·
--
Жоғары (өспелі)
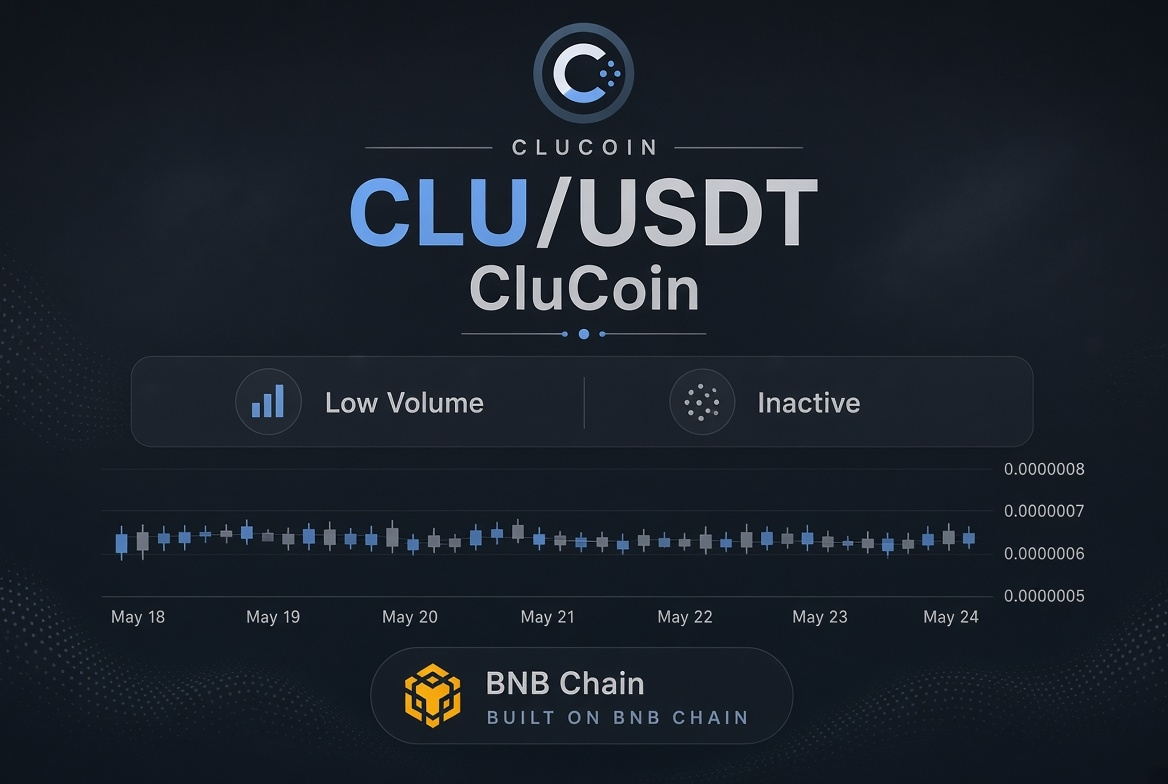
CLU/USDT Market Update
CluCoin (CLU) is absolutely dead.
The token is stuck at near-zero volume/ticker price with little to no liquidity.
Key points:
-Launched in May 2021 on BNB Chain (BEP-20)
-Community + charity focused with hyper-deflationary + reflection features
-Unbelievably high supply (quadtrillion+)
-Unimpressive market cap/rank
-Low trading activity on most exchanges
Overall, I’d say the token is in dead volume status. There is no buying pressure at the moment, and the trading pair does’t really have any volume comparable to meme or utility coins.
This is a high risk/slip asset with poor liquidity. Big price slippage may occur on any trade.
No obvious bullish catalysts either.
Any CLU holders left? Let me know below.
#CLU #CLUUSDT #CluCoin #BNBChain #Crypto $CL
{future}(CLUSDT)
CLU/USDT Market Update
CluCoin (CLU) is absolutely dead.
The token is stuck at near-zero volume/ticker price with little to no liquidity.
Key points:
-Launched in May 2021 on BNB Chain (BEP-20)
-Community + charity focused with hyper-deflationary + reflection features
-Unbelievably high supply (quadtrillion+)
-Unimpressive market cap/rank
-Low trading activity on most exchanges
Overall, I’d say the token is in dead volume status. There is no buying pressure at the moment, and the trading pair does’t really have any volume comparable to meme or utility coins.
This is a high risk/slip asset with poor liquidity. Big price slippage may occur on any trade.
No obvious bullish catalysts either.
Any CLU holders left? Let me know below.
#CLU #CLUUSDT #CluCoin #BNBChain #Crypto $CL
CluCoin (CLU) is absolutely dead.
The token is stuck at near-zero volume/ticker price with little to no liquidity.
Key points:
-Launched in May 2021 on BNB Chain (BEP-20)
-Community + charity focused with hyper-deflationary + reflection features
-Unbelievably high supply (quadtrillion+)
-Unimpressive market cap/rank
-Low trading activity on most exchanges
Overall, I’d say the token is in dead volume status. There is no buying pressure at the moment, and the trading pair does’t really have any volume comparable to meme or utility coins.
This is a high risk/slip asset with poor liquidity. Big price slippage may occur on any trade.
No obvious bullish catalysts either.
Any CLU holders left? Let me know below.
#CLU #CLUUSDT #CluCoin #BNBChain #Crypto $CL
96
·
--
Жоғары (өспелі)
BMT/USDT Market Report
Bubblemaps (BMT) is a bubble market
BMT broke out violently to the upside, had a very strong session, and is now ranging between $0.03 – $0.037. The asset recorded substantial gains over the last 24 hours on high volume.
Some interesting context on BMT:
• Native token of on-chain analytics platform, Bubblemaps – which allows you to visualize wallet positions and token concentrations in the form of “bubble maps”
• Offers utility + governance – to unlock pro analytics and power the Intel Desk investigation platform
• Multichain (BNB chain + Solana via layerzero)
• 1B total supply
• Listed on Binance (BMT/USDT)
While clearly an infrastructure play and not a traditional “meme coin”, BMT is extremely speculative in nature and at the moment extremely range bound and volatile.
So I ask you, are you long BMT for the trend to continue, or waiting for it to cool off?
#BMT #BMTUSDT #BubbleMaps #Crypto #OnChainAnalytics $BMT
{future}(BMTUSDT)
BMT/USDT Market Report
Bubblemaps (BMT) is a bubble market
BMT broke out violently to the upside, had a very strong session, and is now ranging between $0.03 – $0.037. The asset recorded substantial gains over the last 24 hours on high volume.
Some interesting context on BMT:
• Native token of on-chain analytics platform, Bubblemaps – which allows you to visualize wallet positions and token concentrations in the form of “bubble maps”
• Offers utility + governance – to unlock pro analytics and power the Intel Desk investigation platform
• Multichain (BNB chain + Solana via layerzero)
• 1B total supply
• Listed on Binance (BMT/USDT)
While clearly an infrastructure play and not a traditional “meme coin”, BMT is extremely speculative in nature and at the moment extremely range bound and volatile.
So I ask you, are you long BMT for the trend to continue, or waiting for it to cool off?
#BMT #BMTUSDT #BubbleMaps #Crypto #OnChainAnalytics $BMT
Bubblemaps (BMT) is a bubble market
BMT broke out violently to the upside, had a very strong session, and is now ranging between $0.03 – $0.037. The asset recorded substantial gains over the last 24 hours on high volume.
Some interesting context on BMT:
• Native token of on-chain analytics platform, Bubblemaps – which allows you to visualize wallet positions and token concentrations in the form of “bubble maps”
• Offers utility + governance – to unlock pro analytics and power the Intel Desk investigation platform
• Multichain (BNB chain + Solana via layerzero)
• 1B total supply
• Listed on Binance (BMT/USDT)
While clearly an infrastructure play and not a traditional “meme coin”, BMT is extremely speculative in nature and at the moment extremely range bound and volatile.
So I ask you, are you long BMT for the trend to continue, or waiting for it to cool off?
#BMT #BMTUSDT #BubbleMaps #Crypto #OnChainAnalytics $BMT

86
·
--
Жоғары (өспелі)
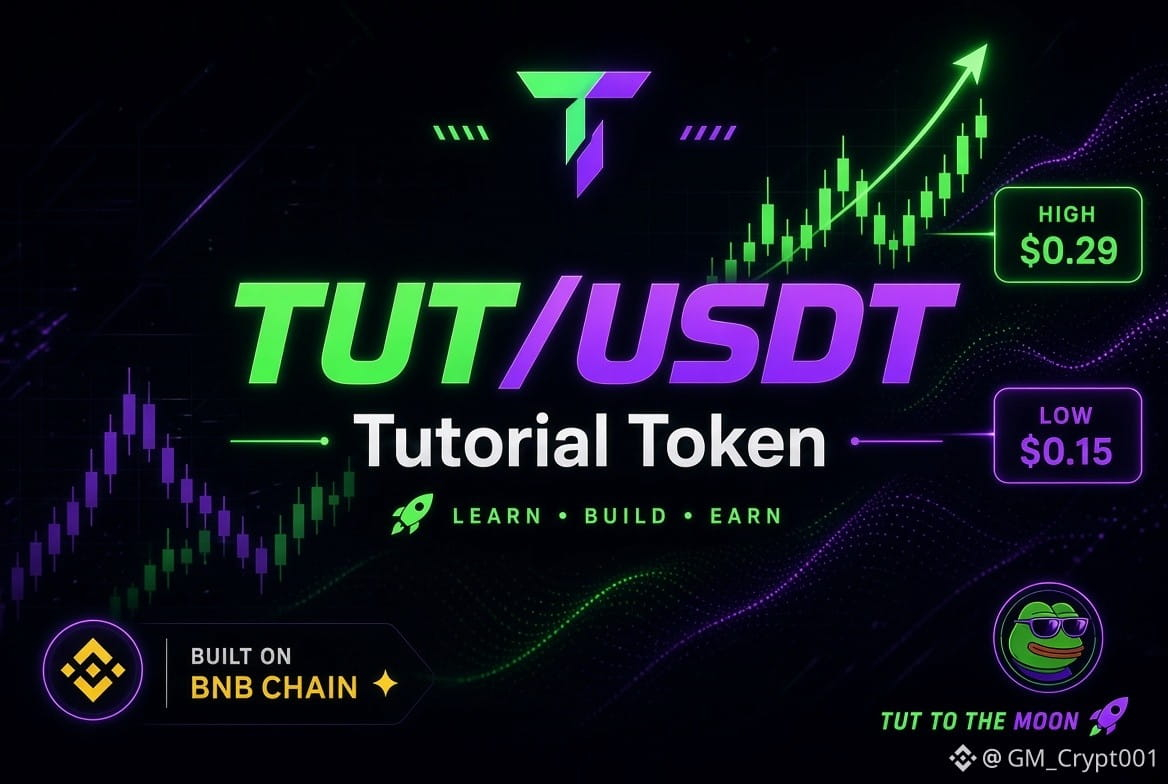
TUT/USDT Market Update
Tutorial (TUT) has had one volatile period recently!
It appears to have had a series of huge jumps of more than 100% during the past few days. It has been very ranging lately, recently spiking hard into the $0.15 – $0.29 region after being much lower.
Some key notes about this token include:
• Built on the BNB Chain
• Originally launched as an educational/AI tutorial token (Tutorial Agent)
• Has a circulating supply of around 833,000,000 of the 1,000,000,000 token supply
• Listed on major exchanges like Binance (TUT/USDT)
• Extremely high 24h volume from the recent pump
• Extremely high risk due to recent very strong moves in both directions
It is clearly momentum speculation right now as well. The price discovery is happening at a rapid pace, so the liquidity can be rather “fragile”. Overall, it has the potential to be a high risk/high reward scenario, so trade cautiously and only with money you are willing to lose.
Do you think Tutorial is a good trade right now?
#TUT #TUTUSDT #BNBChain #MemeCoin #Crypto $TUT
{future}(TUTUSDT)
TUT/USDT Market Update
Tutorial (TUT) has had one volatile period recently!
It appears to have had a series of huge jumps of more than 100% during the past few days. It has been very ranging lately, recently spiking hard into the $0.15 – $0.29 region after being much lower.
Some key notes about this token include:
• Built on the BNB Chain
• Originally launched as an educational/AI tutorial token (Tutorial Agent)
• Has a circulating supply of around 833,000,000 of the 1,000,000,000 token supply
• Listed on major exchanges like Binance (TUT/USDT)
• Extremely high 24h volume from the recent pump
• Extremely high risk due to recent very strong moves in both directions
It is clearly momentum speculation right now as well. The price discovery is happening at a rapid pace, so the liquidity can be rather “fragile”. Overall, it has the potential to be a high risk/high reward scenario, so trade cautiously and only with money you are willing to lose.
Do you think Tutorial is a good trade right now?
#TUT #TUTUSDT #BNBChain #MemeCoin #Crypto $TUT
Tutorial (TUT) has had one volatile period recently!
It appears to have had a series of huge jumps of more than 100% during the past few days. It has been very ranging lately, recently spiking hard into the $0.15 – $0.29 region after being much lower.
Some key notes about this token include:
• Built on the BNB Chain
• Originally launched as an educational/AI tutorial token (Tutorial Agent)
• Has a circulating supply of around 833,000,000 of the 1,000,000,000 token supply
• Listed on major exchanges like Binance (TUT/USDT)
• Extremely high 24h volume from the recent pump
• Extremely high risk due to recent very strong moves in both directions
It is clearly momentum speculation right now as well. The price discovery is happening at a rapid pace, so the liquidity can be rather “fragile”. Overall, it has the potential to be a high risk/high reward scenario, so trade cautiously and only with money you are willing to lose.
Do you think Tutorial is a good trade right now?
#TUT #TUTUSDT #BNBChain #MemeCoin #Crypto $TUT
296
·
--
Жоғары (өспелі)
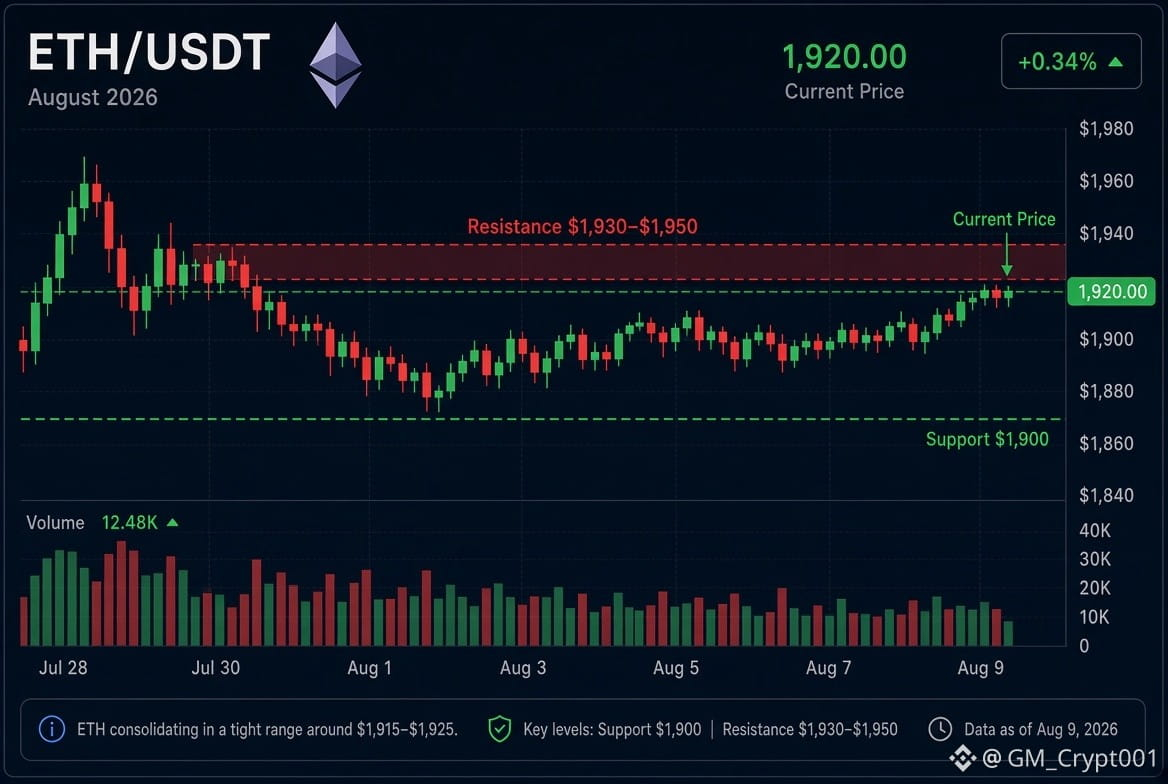
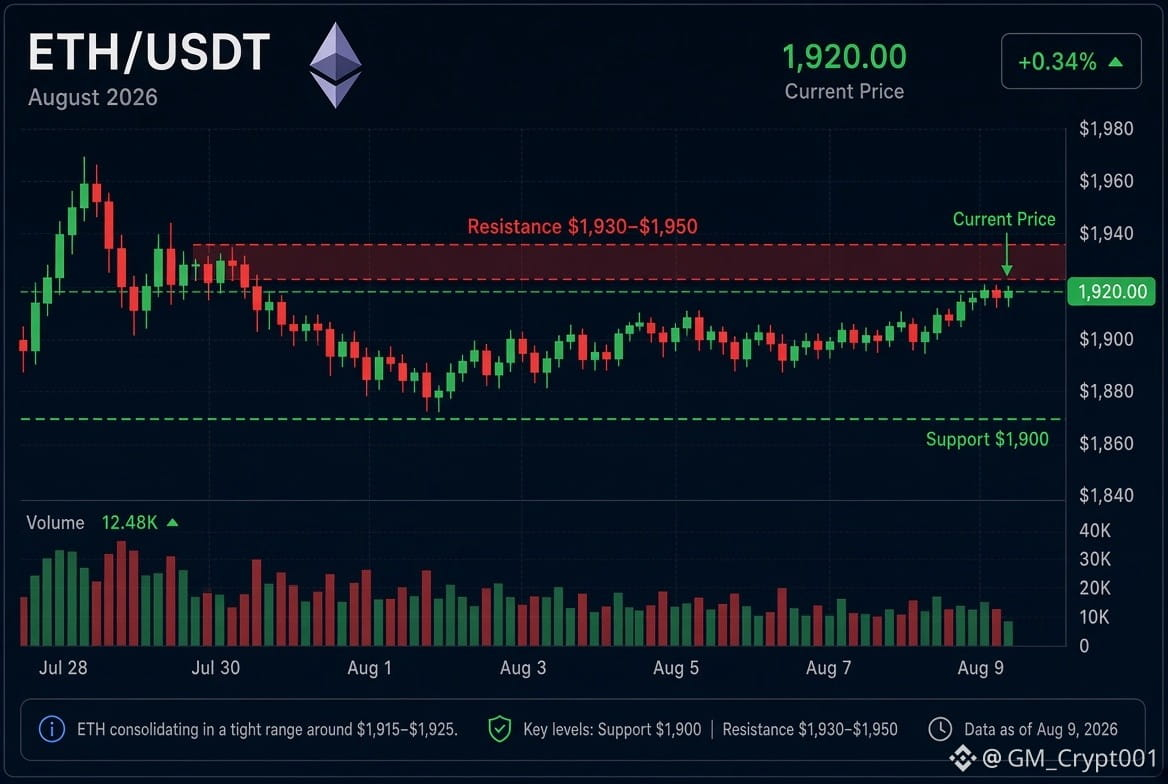
ETH/USDT Market Update
Ethereum is currently trading at the level of $1,915 – $1,925.
After an upward trend at the beginning of the month, ETH is consolidating around the critical level of $1,900 support level. Price action remains relatively tight, with buyers defending the $1,900, with sellers pressing hard at the level of $1,930 – $1,940. The following factors are noteworthy:
• The price holds above the crucial level of $1,900
• The short-term resistance is located at the level of $1,930 – $1,950
• In the last couple of sessions, ETH was consolidating within a narrow range
• The price remains far from the record-breaking level of almost $4,950.
ETH is following the broader market trend, exhibiting a resilient but range-bound performance so far. Are you considering buying the dips in ETH or waiting for the price to break out above the level of $1,950?
#ETH #Ethereum #ETHUSDT #Crypto #Trading $ETH
{future}(ETHUSDT)
ETH/USDT Market Update
Ethereum is currently trading at the level of $1,915 – $1,925.
After an upward trend at the beginning of the month, ETH is consolidating around the critical level of $1,900 support level. Price action remains relatively tight, with buyers defending the $1,900, with sellers pressing hard at the level of $1,930 – $1,940. The following factors are noteworthy:
• The price holds above the crucial level of $1,900
• The short-term resistance is located at the level of $1,930 – $1,950
• In the last couple of sessions, ETH was consolidating within a narrow range
• The price remains far from the record-breaking level of almost $4,950.
ETH is following the broader market trend, exhibiting a resilient but range-bound performance so far. Are you considering buying the dips in ETH or waiting for the price to break out above the level of $1,950?
#ETH #Ethereum #ETHUSDT #Crypto #Trading $ETH
Ethereum is currently trading at the level of $1,915 – $1,925.
After an upward trend at the beginning of the month, ETH is consolidating around the critical level of $1,900 support level. Price action remains relatively tight, with buyers defending the $1,900, with sellers pressing hard at the level of $1,930 – $1,940. The following factors are noteworthy:
• The price holds above the crucial level of $1,900
• The short-term resistance is located at the level of $1,930 – $1,950
• In the last couple of sessions, ETH was consolidating within a narrow range
• The price remains far from the record-breaking level of almost $4,950.
ETH is following the broader market trend, exhibiting a resilient but range-bound performance so far. Are you considering buying the dips in ETH or waiting for the price to break out above the level of $1,950?
#ETH #Ethereum #ETHUSDT #Crypto #Trading $ETH
91
·
--
Жоғары (өспелі)
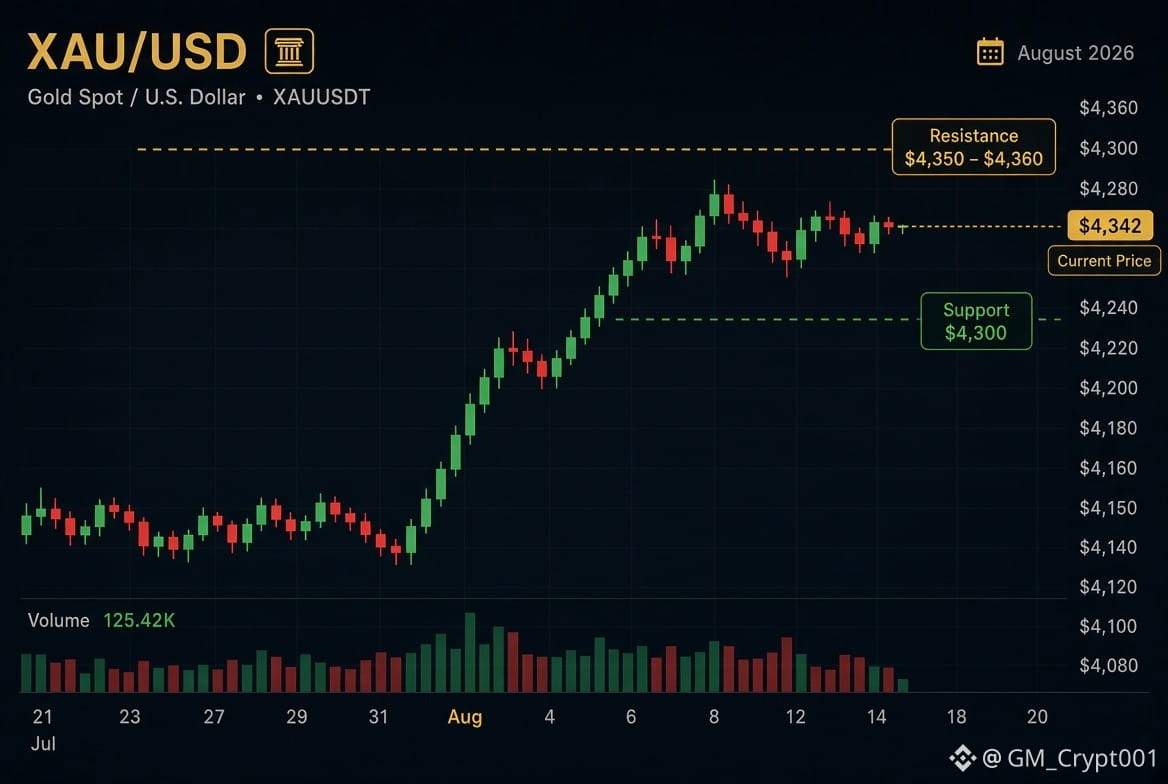
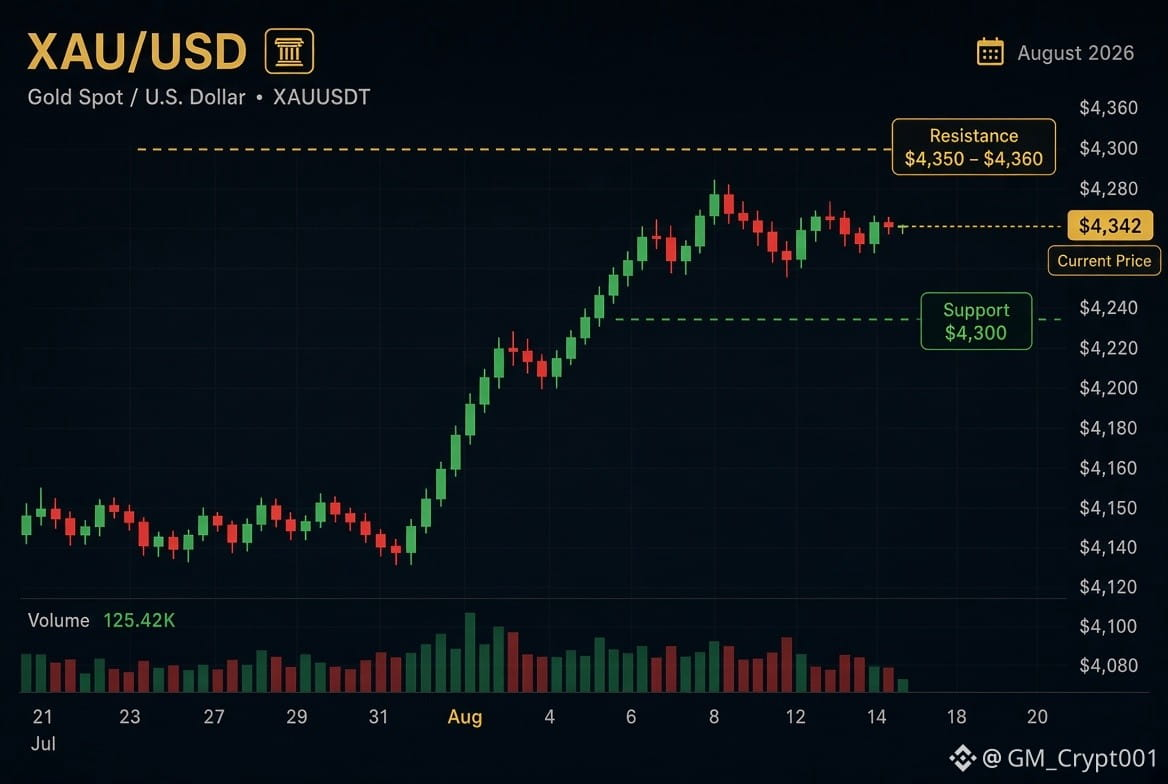
XAUUSDT Update – Gold Holding Strong
Gold (XAUUSDT) is currently trading around the $4,340 – $4,342 level.
After a sharp rally earlier this week (jumping from the low $4,000s into the mid-$4,300s), price is now consolidating near the recent highs. The move higher was one of the stronger short-term runs gold has seen in recent months.
Key points right now:
• Strong upward momentum from Aug 5–7
• Holding above the $4,300 psychological zone
• Short-term resistance sits near recent highs around $4,350–$4,360
• Support forming near $4,300–$4,280
Gold continues to attract interest as a safe-haven and inflation hedge while crypto markets remain range-bound.
Are you watching XAUUSDT for a breakout continuation or expecting a pullback first?
#XAUUSDT #Gold #XAU #Commodities #Trading $XAUT
{future}(XAUTUSDT)
XAUUSDT Update – Gold Holding Strong
Gold (XAUUSDT) is currently trading around the $4,340 – $4,342 level.
After a sharp rally earlier this week (jumping from the low $4,000s into the mid-$4,300s), price is now consolidating near the recent highs. The move higher was one of the stronger short-term runs gold has seen in recent months.
Key points right now:
• Strong upward momentum from Aug 5–7
• Holding above the $4,300 psychological zone
• Short-term resistance sits near recent highs around $4,350–$4,360
• Support forming near $4,300–$4,280
Gold continues to attract interest as a safe-haven and inflation hedge while crypto markets remain range-bound.
Are you watching XAUUSDT for a breakout continuation or expecting a pullback first?
#XAUUSDT #Gold #XAU #Commodities #Trading $XAUT
Gold (XAUUSDT) is currently trading around the $4,340 – $4,342 level.
After a sharp rally earlier this week (jumping from the low $4,000s into the mid-$4,300s), price is now consolidating near the recent highs. The move higher was one of the stronger short-term runs gold has seen in recent months.
Key points right now:
• Strong upward momentum from Aug 5–7
• Holding above the $4,300 psychological zone
• Short-term resistance sits near recent highs around $4,350–$4,360
• Support forming near $4,300–$4,280
Gold continues to attract interest as a safe-haven and inflation hedge while crypto markets remain range-bound.
Are you watching XAUUSDT for a breakout continuation or expecting a pullback first?
#XAUUSDT #Gold #XAU #Commodities #Trading $XAUT
1
353
·
--
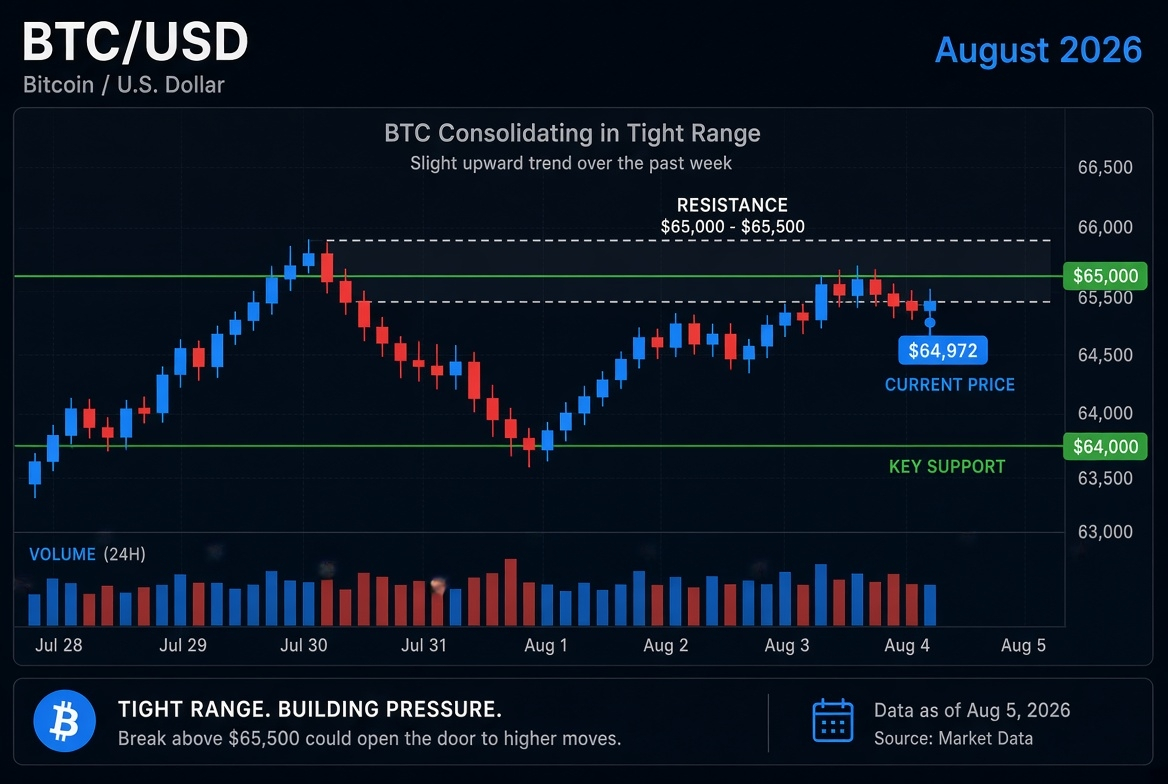
Bitcoin Market Snapshot – August 9
$BTC
is currently trading around the $64,800–$65,100 range, still sitting just below the key $65,000 resistance level.
Interesting facts right now:
• U.S. spot Bitcoin ETFs pulled in roughly $850–865 million last week — the strongest inflow week since April
• BlackRock’s IBIT alone accounted for around 80% of those inflows
• Combined BTC + ETH ETF inflows hit about $1.1 billion for the week
• Despite the heavy institutional buying, price has stayed relatively flat, suggesting some profit-taking or exchange selling is offsetting the demand
• Bitcoin remains significantly below its all-time high near $126,000
The market is in a classic consolidation phase — strong underlying demand from ETFs, but not enough momentum yet to clear resistance cleanly.
Are you accumulating here, waiting for a breakout above $65k, or staying on the sidelines?
#bitcoin #BTC #CryptoMarket #BitcoinETF #crypto
{future}(BTCUSDT)
Bitcoin Market Snapshot – August 9
$BTC
is currently trading around the $64,800–$65,100 range, still sitting just below the key $65,000 resistance level.
Interesting facts right now:
• U.S. spot Bitcoin ETFs pulled in roughly $850–865 million last week — the strongest inflow week since April
• BlackRock’s IBIT alone accounted for around 80% of those inflows
• Combined BTC + ETH ETF inflows hit about $1.1 billion for the week
• Despite the heavy institutional buying, price has stayed relatively flat, suggesting some profit-taking or exchange selling is offsetting the demand
• Bitcoin remains significantly below its all-time high near $126,000
The market is in a classic consolidation phase — strong underlying demand from ETFs, but not enough momentum yet to clear resistance cleanly.
Are you accumulating here, waiting for a breakout above $65k, or staying on the sidelines?
#bitcoin #BTC #CryptoMarket #BitcoinETF #crypto
$BTC
is currently trading around the $64,800–$65,100 range, still sitting just below the key $65,000 resistance level.
Interesting facts right now:
• U.S. spot Bitcoin ETFs pulled in roughly $850–865 million last week — the strongest inflow week since April
• BlackRock’s IBIT alone accounted for around 80% of those inflows
• Combined BTC + ETH ETF inflows hit about $1.1 billion for the week
• Despite the heavy institutional buying, price has stayed relatively flat, suggesting some profit-taking or exchange selling is offsetting the demand
• Bitcoin remains significantly below its all-time high near $126,000
The market is in a classic consolidation phase — strong underlying demand from ETFs, but not enough momentum yet to clear resistance cleanly.
Are you accumulating here, waiting for a breakout above $65k, or staying on the sidelines?
#bitcoin #BTC #CryptoMarket #BitcoinETF #crypto
93
·
--
🚀 Big update for Solana holders
Solana’s major “Alpenglow” network upgrade is now in testing. Developers say it could deliver much faster transactions and a clear boost in overall network performance.
$SOL has been showing solid bullish momentum lately, recovering near the mid-$90s while analysts watch for a potential breakout toward the $100 level.
Developer activity continues to climb, with more apps, DeFi protocols, and payment systems choosing to build on Solana. At the same time, institutional interest is picking up — reports point to growing ETF attention and larger financial firms expanding their activity around the network.
With its speed, low fees, and expanding ecosystem, many analysts stay optimistic about SOL’s longer-term outlook.
What do you think — is Alpenglow the next big catalyst for Solana?
#solana @Solana Official
🚀 Big update for Solana holders
Solana’s major “Alpenglow” network upgrade is now in testing. Developers say it could deliver much faster transactions and a clear boost in overall network performance.
$SOL has been showing solid bullish momentum lately, recovering near the mid-$90s while analysts watch for a potential breakout toward the $100 level.
Developer activity continues to climb, with more apps, DeFi protocols, and payment systems choosing to build on Solana. At the same time, institutional interest is picking up — reports point to growing ETF attention and larger financial firms expanding their activity around the network.
With its speed, low fees, and expanding ecosystem, many analysts stay optimistic about SOL’s longer-term outlook.
What do you think — is Alpenglow the next big catalyst for Solana?
#solana @Solana Official
Solana’s major “Alpenglow” network upgrade is now in testing. Developers say it could deliver much faster transactions and a clear boost in overall network performance.
$SOL has been showing solid bullish momentum lately, recovering near the mid-$90s while analysts watch for a potential breakout toward the $100 level.
Developer activity continues to climb, with more apps, DeFi protocols, and payment systems choosing to build on Solana. At the same time, institutional interest is picking up — reports point to growing ETF attention and larger financial firms expanding their activity around the network.
With its speed, low fees, and expanding ecosystem, many analysts stay optimistic about SOL’s longer-term outlook.
What do you think — is Alpenglow the next big catalyst for Solana?
#solana @Solana Official

40
·
--
Solana is heating up fast 🔥
More developers and projects are choosing Solana every day thanks to its blazing-fast transactions and ultra-low fees.
Meme coins and AI-powered projects are exploding on the network, while the ecosystem continues to expand with fresh DeFi apps, NFT collections, and gaming platforms.
If the broader crypto market stays bullish through 2026, many analysts believe $SOL could see serious attention.
Major exchanges and wallets are also rolling out better support for Solana tokens and apps, making it easier than ever to jump in.
The momentum is real.
@Solana Official #solana
Solana is heating up fast 🔥
More developers and projects are choosing Solana every day thanks to its blazing-fast transactions and ultra-low fees.
Meme coins and AI-powered projects are exploding on the network, while the ecosystem continues to expand with fresh DeFi apps, NFT collections, and gaming platforms.
If the broader crypto market stays bullish through 2026, many analysts believe $SOL could see serious attention.
Major exchanges and wallets are also rolling out better support for Solana tokens and apps, making it easier than ever to jump in.
The momentum is real.
@Solana Official #solana
More developers and projects are choosing Solana every day thanks to its blazing-fast transactions and ultra-low fees.
Meme coins and AI-powered projects are exploding on the network, while the ecosystem continues to expand with fresh DeFi apps, NFT collections, and gaming platforms.
If the broader crypto market stays bullish through 2026, many analysts believe $SOL could see serious attention.
Major exchanges and wallets are also rolling out better support for Solana tokens and apps, making it easier than ever to jump in.
The momentum is real.
@Solana Official #solana

44
Көбірек контент көру үшін кіріңіз
Binance Square платформасында әлемдік криптоқоғамдастыққа қосылыңыз
⚡️ Криптовалюта туралы ең соңғы және пайдалы ақпаратты алыңыз.
💬 Әлемдегі ең ірі криптобиржаның сеніміне ие.
👍 Расталған авторлардың нақты пікірлерін табыңыз.
Электрондық пошта/телефон нөмірі
Трендтегі тақырыптар
EtherGains70.9%InQ3
165,008 рет көрілді
1,167 адам талқылап жатыр
🧭🧭🧭 تحليل 🧭🧭🧭
💡 مؤشر موسم العملات البديلة 💡
🚨🚨🚨 لقد أغلق الربع الثالث (T3). ارتفع سعر ETH بنسبة 71% وBTC بنسبة 43%. 🚨🚨🚨
هل كان هذا بداية موسم العملات البديلة؟
من بين أفضل 100:
🌐🌐🌐 57 تفوقت على BTC خلال 90 يومًا
يبدأ موسم العملات البديلة عند 75، لذا ما زال
كما أنه يتقدم بـ 10 نقاط فقط من قمته السنوية عند 67 🌐🌐
💥💥💥 لكن مهلاً، قبل شهر كان المؤشر عند 23 فقط!
هل يمكن أن يدفعه أكتوبر إلى 75؟ 👀💥💥💥
متابعة من فضلكم
#EtherGains70.9%InQ3
$GRAM
Shamika Metting
·3 лайк
·1.1k рет көрілді
TreasuryLetsStatesFileStablecoinCertificationsEarly
10,221 рет көрілді
89 адам талқылап жатыр
US10YearYieldNears5.3%
155,340 рет көрілді
1,149 адам талқылап жатыр