
KAMI311
5 Жариялаулар

KAMI311
Хабарлау
Пайдаланушыны блоктау
🚀 Crypto News & Analysis 📊 BTC & Altcoins | Coin Research 💎 📈 Market Updates | Price Analysis Follow for Smart Crypto Insights
Ашық сауда
Кездейсоқ трейдер
3.5 жыл
32 Жазылым
7 Жазылушылар
0 лайк басылған
Жазбалар
Портфолио
Барлығы
Баға ұсыныстары

·
--
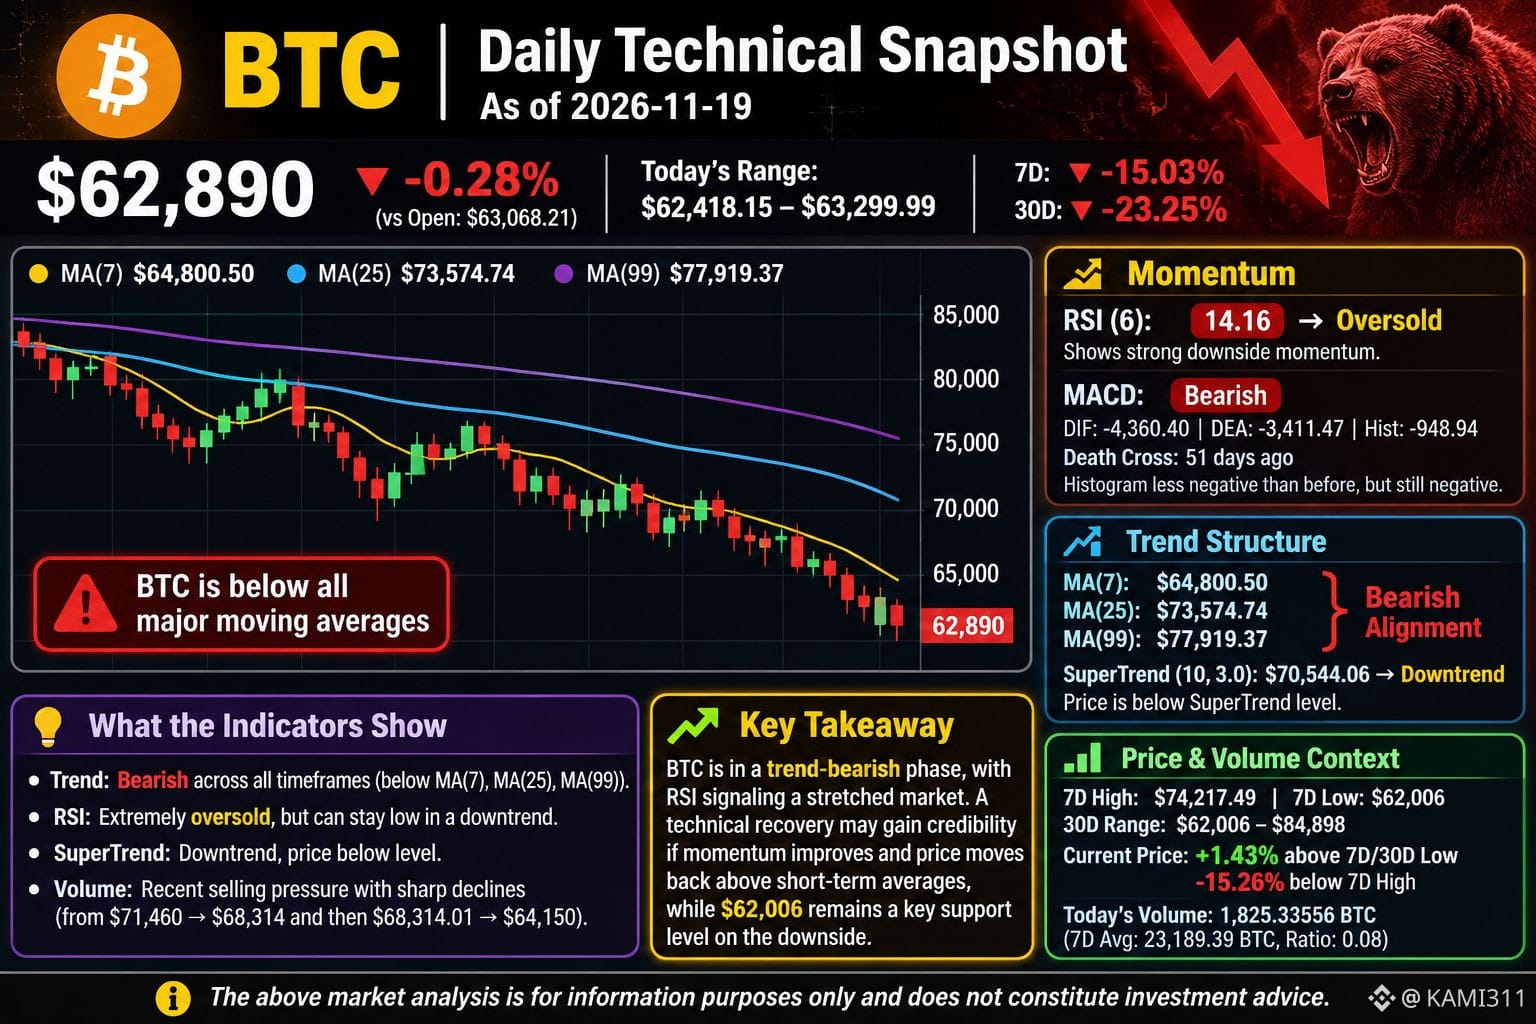
📊 BTC Daily Technical Analysis | Nov 19, 2026
$BTC
{spot}(BTCUSDT)
Price: $62,890 (-0.28%)
🔴 Market Trend: Bearish
• RSI (6): 14.16 — Oversold
• MACD: Bearish momentum
• BTC trading below MA(7), MA(25) & MA(99).
• SuperTrend: Downtrend at $70,544.
📉 Key Support: $62,006
📈 7-Day Change: -15.03%
📉 30-Day Change: -23.25%
Market Outlook: BTC remains under strong bearish pressure. RSI suggests an oversold market, but a confirmed recovery signal is still needed.
⚠️
#BTC走势分析 #BTC #CryptoAnalysis #BinanceSquareFamily #BinanceSquare
📊 BTC Daily Technical Analysis | Nov 19, 2026
$BTC
Price: $62,890 (-0.28%)
🔴 Market Trend: Bearish
• RSI (6): 14.16 — Oversold
• MACD: Bearish momentum
• BTC trading below MA(7), MA(25) & MA(99).
• SuperTrend: Downtrend at $70,544.
📉 Key Support: $62,006
📈 7-Day Change: -15.03%
📉 30-Day Change: -23.25%
Market Outlook: BTC remains under strong bearish pressure. RSI suggests an oversold market, but a confirmed recovery signal is still needed.
⚠️
#BTC走势分析 #BTC #CryptoAnalysis #BinanceSquareFamily #BinanceSquare
$BTC
Price: $62,890 (-0.28%)
🔴 Market Trend: Bearish
• RSI (6): 14.16 — Oversold
• MACD: Bearish momentum
• BTC trading below MA(7), MA(25) & MA(99).
• SuperTrend: Downtrend at $70,544.
📉 Key Support: $62,006
📈 7-Day Change: -15.03%
📉 30-Day Change: -23.25%
Market Outlook: BTC remains under strong bearish pressure. RSI suggests an oversold market, but a confirmed recovery signal is still needed.
⚠️
#BTC走势分析 #BTC #CryptoAnalysis #BinanceSquareFamily #BinanceSquare
88
·
--
Мақала
What Was LiquidatedDeep Dive
What Was Liquidated
Trading positions worth $211.5 million were forcibly closed across Binance, another exchange and another exchange in the 24 hours to 00:02 UTC on 19 Nov.
Longs totaled $166.2 million against $45.3 million in shorts, across 48,380 orders. Binance saw $137.4 million in liquidations, with another exchange at $48.3 million and another exchange at $25.8 million. By asset, $BTC accounted for $77.5 million and ETH for $49.2 million, with smaller totals in $SOLna(SOL), Zcash (ZEC) and metals-linked contracts.
A liquidation is a forced closure of a leveraged position when collateral no longer covers the required margin, which turns that trader into involuntary selling (for longs) or buying (for shorts).
Leverage And Market Context
Derivatives data show total perpetual open interest at about $325 billion, down roughly 0.5 percent over 24 hours, while total crypto market cap slipped about 1.7 percent to 2.15 trillion dollars. BTC specific liquidations over the day were about $138.52 million.
Other analytics recently recorded larger waves, including around $2 billion of crypto liquidations in a prior 24 hour window, mostly long positions in $BTC and $ETH So the latest 211.5 million event is significant but smaller than the most violent recent flushes.
Sentiment is already weak, with a fear and greed index reading in “extreme fear,” which tends to make markets more vulnerable to sharp moves when leverage is high.
Cascade Risk And Key Levels
Derivatives data mapped by others show notable clusters of BTC long liquidation levels around 63,500 and further down near 60,000, meaning a break through those zones can trigger concentrated forced selling. One highlighted BTC whale long worth about $129 million faces liquidation if price falls below 63,500.
Glassnode style analyses have warned that a daily close below about 62,000 could deepen losses and push BTC toward prior realized price levels near 53,700, especially if liquidation clusters at 60,000 start to trigger.
What this means: For both leveraged traders and spot holders, the main thing to watch is BTC’s behavior around the 63,500 to 62,000 band, plus changes in open interest and funding rates that signal leverage rebuilding or continuing to unwind.
Conclusion
A 211.5 million dollar liquidation wave, dominated by longs on BTC and ETH, has shaken out some leverage but not reset the system. Leverage remains high relative to market depth, so further downside near key BTC levels could turn today’s flush into a larger cascade. Monitoring price around 63,500 to 62,000 and how quickly leverage rebuilds will help gauge whether this is a brief shakeout or part of a longer deleveraging phase.
#BTCRemainsUnderPressureAfterHawkishFOMCMinutes #AnthropicToDebutAfter$83IPOPricing #NvidiaBeatsEstimatesWith$130BQ4Outlook #Binance #BinanceSquareFamily
What Was Liquidated
Deep Dive
What Was Liquidated
Trading positions worth $211.5 million were forcibly closed across Binance, another exchange and another exchange in the 24 hours to 00:02 UTC on 19 Nov.
Longs totaled $166.2 million against $45.3 million in shorts, across 48,380 orders. Binance saw $137.4 million in liquidations, with another exchange at $48.3 million and another exchange at $25.8 million. By asset, $BTC accounted for $77.5 million and ETH for $49.2 million, with smaller totals in $SOLna(SOL), Zcash (ZEC) and metals-linked contracts.
A liquidation is a forced closure of a leveraged position when collateral no longer covers the required margin, which turns that trader into involuntary selling (for longs) or buying (for shorts).
Leverage And Market Context
Derivatives data show total perpetual open interest at about $325 billion, down roughly 0.5 percent over 24 hours, while total crypto market cap slipped about 1.7 percent to 2.15 trillion dollars. BTC specific liquidations over the day were about $138.52 million.
Other analytics recently recorded larger waves, including around $2 billion of crypto liquidations in a prior 24 hour window, mostly long positions in $BTC and $ETH So the latest 211.5 million event is significant but smaller than the most violent recent flushes.
Sentiment is already weak, with a fear and greed index reading in “extreme fear,” which tends to make markets more vulnerable to sharp moves when leverage is high.
Cascade Risk And Key Levels
Derivatives data mapped by others show notable clusters of BTC long liquidation levels around 63,500 and further down near 60,000, meaning a break through those zones can trigger concentrated forced selling. One highlighted BTC whale long worth about $129 million faces liquidation if price falls below 63,500.
Glassnode style analyses have warned that a daily close below about 62,000 could deepen losses and push BTC toward prior realized price levels near 53,700, especially if liquidation clusters at 60,000 start to trigger.
What this means: For both leveraged traders and spot holders, the main thing to watch is BTC’s behavior around the 63,500 to 62,000 band, plus changes in open interest and funding rates that signal leverage rebuilding or continuing to unwind.
Conclusion
A 211.5 million dollar liquidation wave, dominated by longs on BTC and ETH, has shaken out some leverage but not reset the system. Leverage remains high relative to market depth, so further downside near key BTC levels could turn today’s flush into a larger cascade. Monitoring price around 63,500 to 62,000 and how quickly leverage rebuilds will help gauge whether this is a brief shakeout or part of a longer deleveraging phase.
#BTCRemainsUnderPressureAfterHawkishFOMCMinutes #AnthropicToDebutAfter$83IPOPricing #NvidiaBeatsEstimatesWith$130BQ4Outlook #Binance #BinanceSquareFamily
What Was Liquidated
Trading positions worth $211.5 million were forcibly closed across Binance, another exchange and another exchange in the 24 hours to 00:02 UTC on 19 Nov.
Longs totaled $166.2 million against $45.3 million in shorts, across 48,380 orders. Binance saw $137.4 million in liquidations, with another exchange at $48.3 million and another exchange at $25.8 million. By asset, $BTC accounted for $77.5 million and ETH for $49.2 million, with smaller totals in $SOLna(SOL), Zcash (ZEC) and metals-linked contracts.
A liquidation is a forced closure of a leveraged position when collateral no longer covers the required margin, which turns that trader into involuntary selling (for longs) or buying (for shorts).
Leverage And Market Context
Derivatives data show total perpetual open interest at about $325 billion, down roughly 0.5 percent over 24 hours, while total crypto market cap slipped about 1.7 percent to 2.15 trillion dollars. BTC specific liquidations over the day were about $138.52 million.
Other analytics recently recorded larger waves, including around $2 billion of crypto liquidations in a prior 24 hour window, mostly long positions in $BTC and $ETH So the latest 211.5 million event is significant but smaller than the most violent recent flushes.
Sentiment is already weak, with a fear and greed index reading in “extreme fear,” which tends to make markets more vulnerable to sharp moves when leverage is high.
Cascade Risk And Key Levels
Derivatives data mapped by others show notable clusters of BTC long liquidation levels around 63,500 and further down near 60,000, meaning a break through those zones can trigger concentrated forced selling. One highlighted BTC whale long worth about $129 million faces liquidation if price falls below 63,500.
Glassnode style analyses have warned that a daily close below about 62,000 could deepen losses and push BTC toward prior realized price levels near 53,700, especially if liquidation clusters at 60,000 start to trigger.
What this means: For both leveraged traders and spot holders, the main thing to watch is BTC’s behavior around the 63,500 to 62,000 band, plus changes in open interest and funding rates that signal leverage rebuilding or continuing to unwind.
Conclusion
A 211.5 million dollar liquidation wave, dominated by longs on BTC and ETH, has shaken out some leverage but not reset the system. Leverage remains high relative to market depth, so further downside near key BTC levels could turn today’s flush into a larger cascade. Monitoring price around 63,500 to 62,000 and how quickly leverage rebuilds will help gauge whether this is a brief shakeout or part of a longer deleveraging phase.
#BTCRemainsUnderPressureAfterHawkishFOMCMinutes #AnthropicToDebutAfter$83IPOPricing #NvidiaBeatsEstimatesWith$130BQ4Outlook #Binance #BinanceSquareFamily
126
·
--
Market situation
Breadth: The market is mixed rather than broadly directional: most liquid pairs are lower even though $BTC and ETH are only modestly negative. The Fear & Greed Index remains at 13, unchanged from the prior reading, which points to persistent defensive sentiment.
Major-asset split: SOL at $74.63 and XRP at $0.9855 are notable exceptions among larger assets. BNB is $590.5 (-0.5% 24h), reinforcing that relative strength is selective rather than market-wide.
Relative strength
SOL +1.7%: It is one of the stronger Layer 1 / Layer 2 names, with $201.6M in 24h quote volume. The sector itself held up best despite averaging -0.9%.
XRP +1.2%: Its move is supported by comparatively active trading, with $111.3M in 24h quote volume.
NEAR +1.2%: It is another resilient Layer 1 / Layer 2 name, trading $81.1M in 24h quote volume.
Weak area: DeFi is the weakest sector at -3.1%, with ENA -6.0% among its largest laggards. ZRO is the weakest mover overall at -9.0%.
Themes
Solana institutional-product activity: U.S. spot Solana ETFs recorded net inflows, ending a prolonged outflow streak. This sits alongside SOL’s relative resilience versus BTC and $ETH
Ethereum upgrade scrutiny: Audit findings have delayed progress around Ethereum’s Glamsterdam upgrade proposals, keeping protocol implementation risk in focus.
What to re-check
Whether market breadth improves from 8 advancing pairs versus 24 declining pairs.
Whether Layer 1 / Layer 2 continues to hold up better than DeFi.
Whether the Ethereum upgrade timeline receives further clarification after the reported audit findings.
Market analysis only, not investment advice.
Market situation
Breadth: The market is mixed rather than broadly directional: most liquid pairs are lower even though $BTC and ETH are only modestly negative. The Fear & Greed Index remains at 13, unchanged from the prior reading, which points to persistent defensive sentiment.
Major-asset split: SOL at $74.63 and XRP at $0.9855 are notable exceptions among larger assets. BNB is $590.5 (-0.5% 24h), reinforcing that relative strength is selective rather than market-wide.
Relative strength
SOL +1.7%: It is one of the stronger Layer 1 / Layer 2 names, with $201.6M in 24h quote volume. The sector itself held up best despite averaging -0.9%.
XRP +1.2%: Its move is supported by comparatively active trading, with $111.3M in 24h quote volume.
NEAR +1.2%: It is another resilient Layer 1 / Layer 2 name, trading $81.1M in 24h quote volume.
Weak area: DeFi is the weakest sector at -3.1%, with ENA -6.0% among its largest laggards. ZRO is the weakest mover overall at -9.0%.
Themes
Solana institutional-product activity: U.S. spot Solana ETFs recorded net inflows, ending a prolonged outflow streak. This sits alongside SOL’s relative resilience versus BTC and $ETH
Ethereum upgrade scrutiny: Audit findings have delayed progress around Ethereum’s Glamsterdam upgrade proposals, keeping protocol implementation risk in focus.
What to re-check
Whether market breadth improves from 8 advancing pairs versus 24 declining pairs.
Whether Layer 1 / Layer 2 continues to hold up better than DeFi.
Whether the Ethereum upgrade timeline receives further clarification after the reported audit findings.
Market analysis only, not investment advice.
Breadth: The market is mixed rather than broadly directional: most liquid pairs are lower even though $BTC and ETH are only modestly negative. The Fear & Greed Index remains at 13, unchanged from the prior reading, which points to persistent defensive sentiment.
Major-asset split: SOL at $74.63 and XRP at $0.9855 are notable exceptions among larger assets. BNB is $590.5 (-0.5% 24h), reinforcing that relative strength is selective rather than market-wide.
Relative strength
SOL +1.7%: It is one of the stronger Layer 1 / Layer 2 names, with $201.6M in 24h quote volume. The sector itself held up best despite averaging -0.9%.
XRP +1.2%: Its move is supported by comparatively active trading, with $111.3M in 24h quote volume.
NEAR +1.2%: It is another resilient Layer 1 / Layer 2 name, trading $81.1M in 24h quote volume.
Weak area: DeFi is the weakest sector at -3.1%, with ENA -6.0% among its largest laggards. ZRO is the weakest mover overall at -9.0%.
Themes
Solana institutional-product activity: U.S. spot Solana ETFs recorded net inflows, ending a prolonged outflow streak. This sits alongside SOL’s relative resilience versus BTC and $ETH
Ethereum upgrade scrutiny: Audit findings have delayed progress around Ethereum’s Glamsterdam upgrade proposals, keeping protocol implementation risk in focus.
What to re-check
Whether market breadth improves from 8 advancing pairs versus 24 declining pairs.
Whether Layer 1 / Layer 2 continues to hold up better than DeFi.
Whether the Ethereum upgrade timeline receives further clarification after the reported audit findings.
Market analysis only, not investment advice.
117
·
--
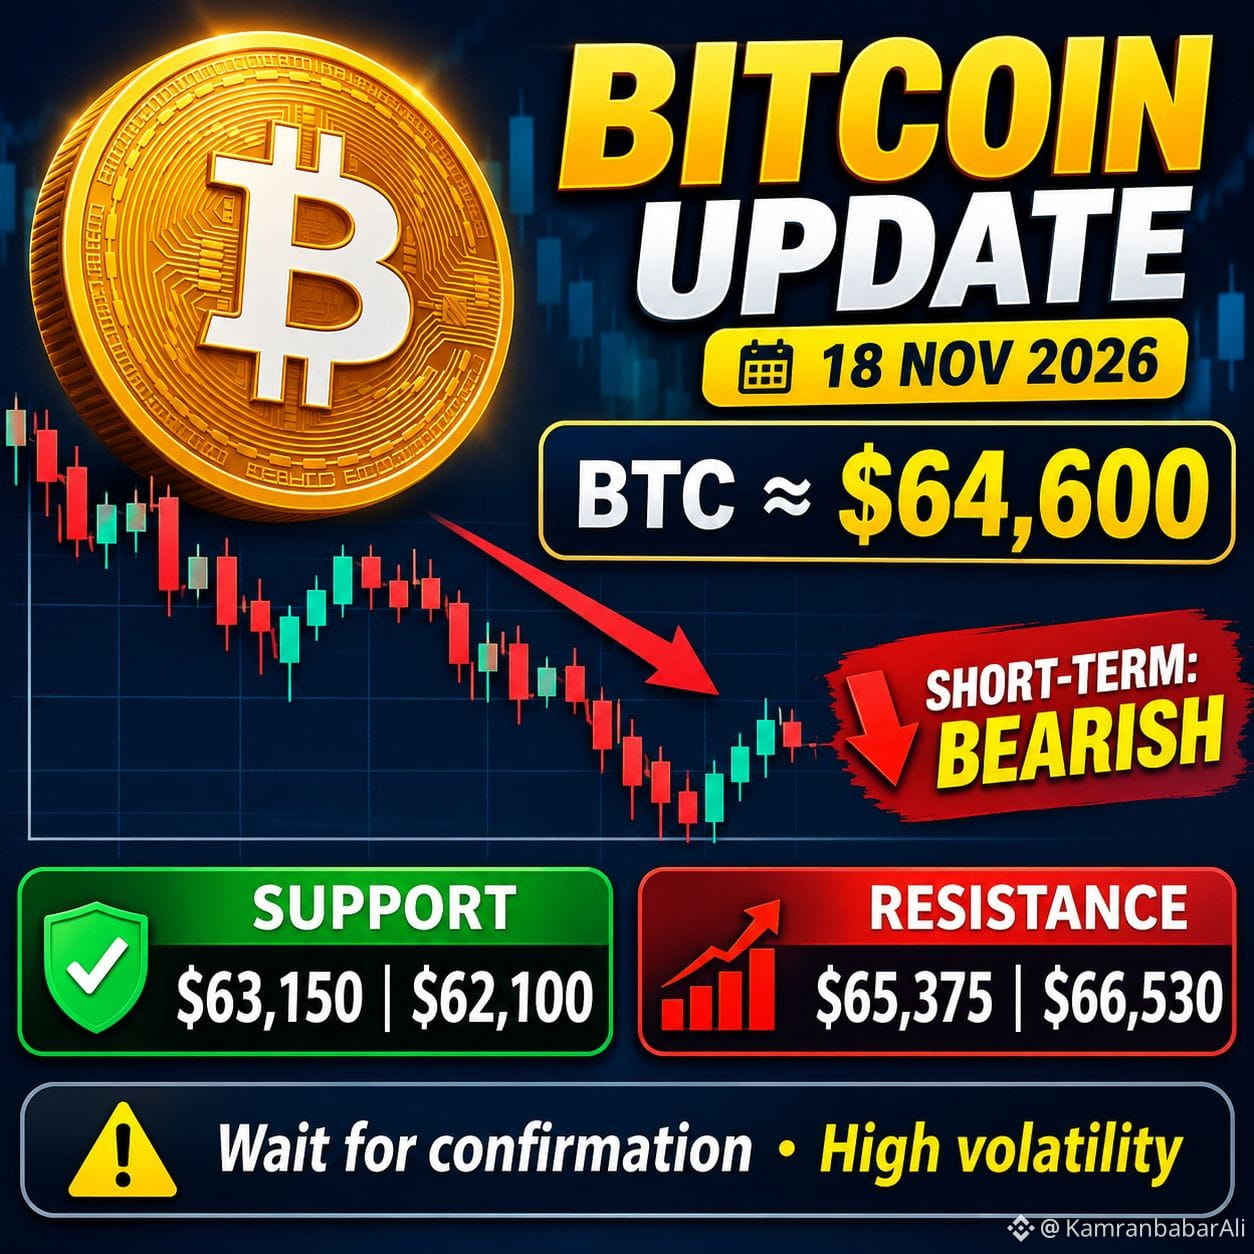
$BTC is showing short-term bearish momentum. 📉 Key support levels are $63,150 and $62,100. Resistance stands at $65,375 and $66,530. Traders should watch for a confirmed breakout or breakdown. ⚠️ Stay alert and manage your risk in this volatile market!
#CanNvidia’sDataCenterGrowthContinue? #LedgerHardwareImplantReportsExtendToDubai #NvidiaBoardNotConsideringHuang’sReturnasCEO #KOSPIFalls2.59%ToLowestCloseSinceFebruary #bitcoin
{spot}(BTCUSDT)
$BTC is showing short-term bearish momentum. 📉 Key support levels are $63,150 and $62,100. Resistance stands at $65,375 and $66,530. Traders should watch for a confirmed breakout or breakdown. ⚠️ Stay alert and manage your risk in this volatile market!
#CanNvidia’sDataCenterGrowthContinue? #LedgerHardwareImplantReportsExtendToDubai #NvidiaBoardNotConsideringHuang’sReturnasCEO #KOSPIFalls2.59%ToLowestCloseSinceFebruary #bitcoin
#CanNvidia’sDataCenterGrowthContinue? #LedgerHardwareImplantReportsExtendToDubai #NvidiaBoardNotConsideringHuang’sReturnasCEO #KOSPIFalls2.59%ToLowestCloseSinceFebruary #bitcoin
87
Көбірек контент көру үшін кіріңіз
Binance Square платформасында әлемдік криптоқоғамдастыққа қосылыңыз
⚡️ Криптовалюта туралы ең соңғы және пайдалы ақпаратты алыңыз.
💬 Әлемдегі ең ірі криптобиржаның сеніміне ие.
👍 Расталған авторлардың нақты пікірлерін табыңыз.
Электрондық пошта/телефон нөмірі
Трендтегі тақырыптар
BTCRemainsUnderPressureAfterHawkishFOMCMinutes
16,475 рет көрілді
254 адам талқылап жатыр
FOMC Minutes | Fed Minutes Show Almost All Officials Expect More Rate Hikes, With Some Open to a Larger December Move
Binance News
·35 лайк
·49.3k рет көрілді
AnthropicToDebutAfter$83IPOPricing
6,083 рет көрілді
32 адам талқылап жатыр
NvidiaBoardReportedlySplitOverHuang’sReturn
1,067 рет көрілді
41 адам талқылап жатыр