
#kospifalls2.59%tolowestclosesincefebruary
kospifalls2.59%tolowestclosesincefebruary
Hot
Latest


·
--
$HYPE USDC is showing serious strength with a massive +6.35% gain. Bulls are taking control, and momentum is heating up.
4. FRHCUSDT — Freedom Holding
#NvidiaEarningsTonight:AIStocks’NextMove? #AnthropicIPOTestsInvestorAppetiteForAI #KOSPIFalls2.59%ToLowestCloseSinceFebruary #AnthropicClearedToListOnNasdaqAsANT #WhatInvestmentSignalsDo13FFilingsReveal?
$HYPE USDC is showing serious strength with a massive +6.35% gain. Bulls are taking control, and momentum is heating up.
4. FRHCUSDT — Freedom Holding
#NvidiaEarningsTonight:AIStocks’NextMove? #AnthropicIPOTestsInvestorAppetiteForAI #KOSPIFalls2.59%ToLowestCloseSinceFebruary #AnthropicClearedToListOnNasdaqAsANT #WhatInvestmentSignalsDo13FFilingsReveal?
4. FRHCUSDT — Freedom Holding
#NvidiaEarningsTonight:AIStocks’NextMove? #AnthropicIPOTestsInvestorAppetiteForAI #KOSPIFalls2.59%ToLowestCloseSinceFebruary #AnthropicClearedToListOnNasdaqAsANT #WhatInvestmentSignalsDo13FFilingsReveal?
49

·
--
Bullish
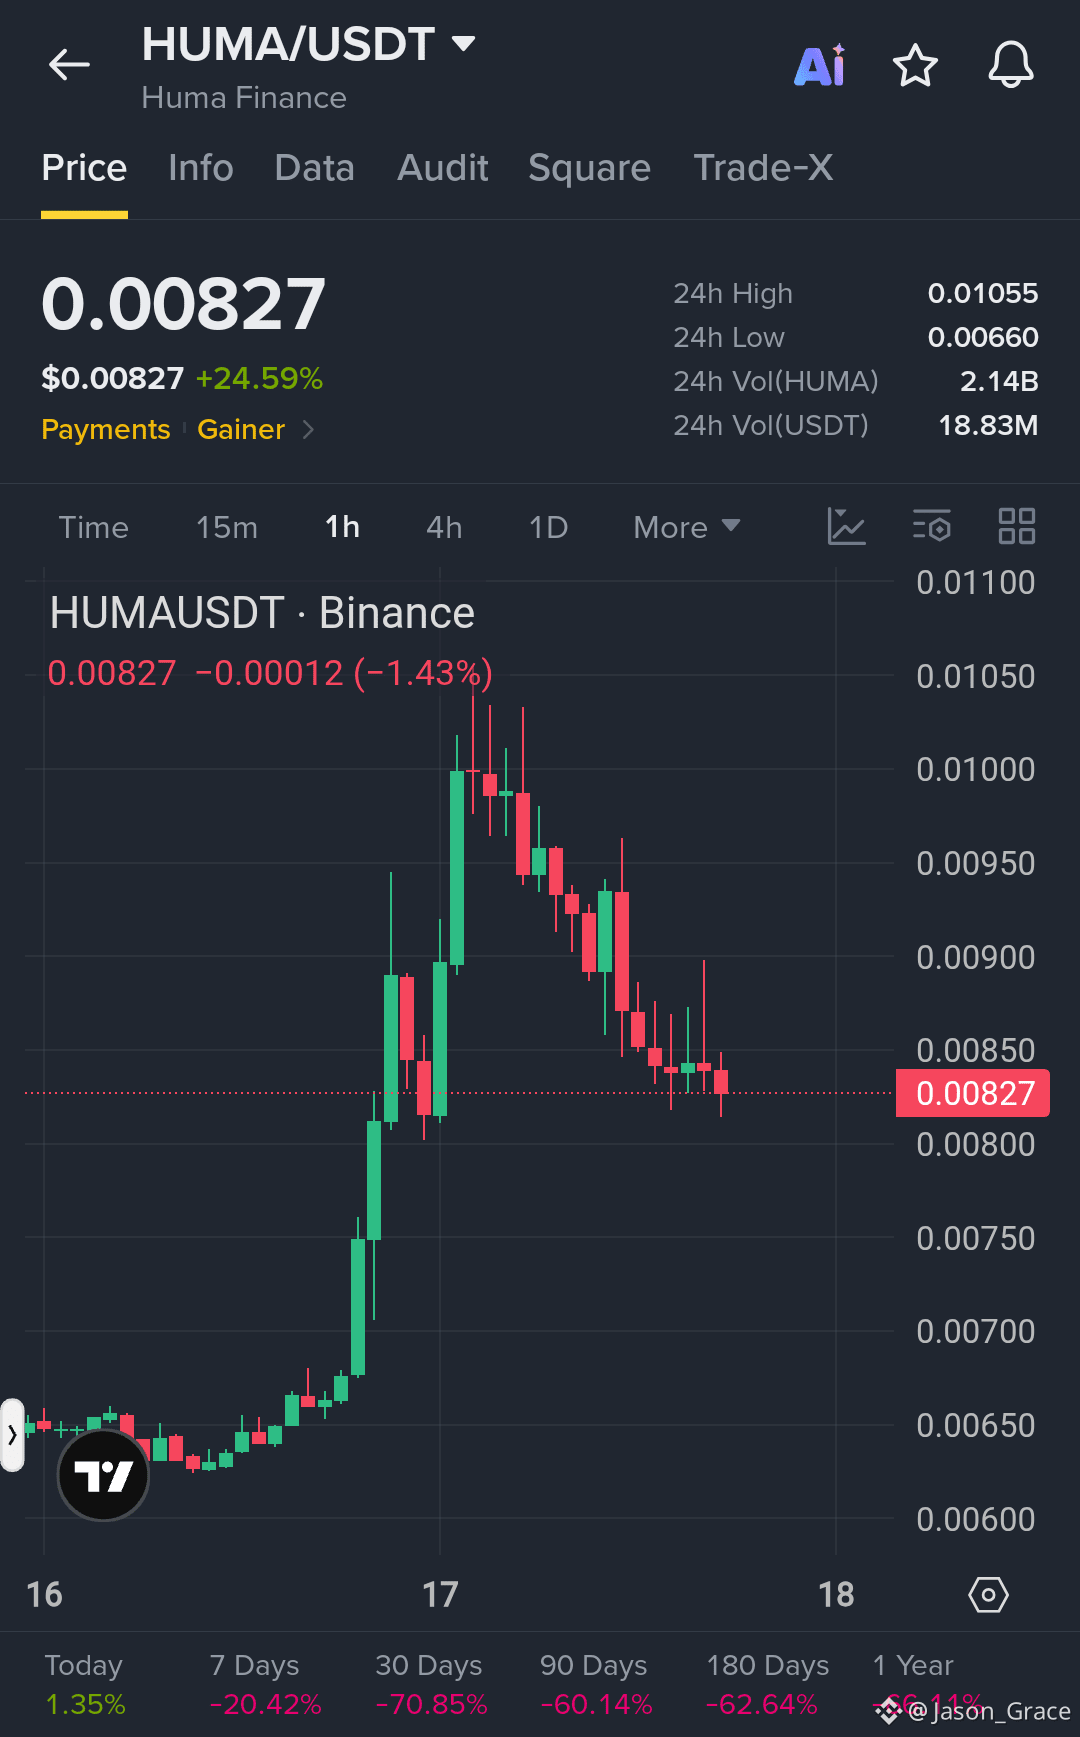
$HUMA is making a strong move, but the latest price action shows that the real battle is just beginning.
HUMA is trading around $0.00827, up 24.59% in 24 hours, with impressive trading activity of 2.14 billion HUMA in volume. Price recently surged from the $0.0063 area toward $0.0100 before facing strong selling pressure near the $0.01055 daily high.
Now, the market is cooling down after that sharp rally. I'm watching the $0.0080–$0.0081 zone as immediate support. Holding this area could give buyers another chance to push toward $0.0085, followed by $0.0090 and $0.0095. A stronger breakout could bring $0.0100–$0.01055 back into focus.
However, losing $0.0080 could open the door toward $0.0075.
My view: HUMA still has momentum, but buyers need to prove they can defend support. The next move could be important, so I would rather watch confirmation than chase the green candle.
Not financial advice. DYOR
#NvidiaEarningsTonight:AIStocks’NextMove?
#AnthropicIPOTestsInvestorAppetiteForAI
#KOSPIFalls2.59%ToLowestCloseSinceFebruary
#AnthropicClearedToListOnNasdaqAsANT
$HUMA is making a strong move, but the latest price action shows that the real battle is just beginning.
HUMA is trading around $0.00827, up 24.59% in 24 hours, with impressive trading activity of 2.14 billion HUMA in volume. Price recently surged from the $0.0063 area toward $0.0100 before facing strong selling pressure near the $0.01055 daily high.
Now, the market is cooling down after that sharp rally. I'm watching the $0.0080–$0.0081 zone as immediate support. Holding this area could give buyers another chance to push toward $0.0085, followed by $0.0090 and $0.0095. A stronger breakout could bring $0.0100–$0.01055 back into focus.
However, losing $0.0080 could open the door toward $0.0075.
My view: HUMA still has momentum, but buyers need to prove they can defend support. The next move could be important, so I would rather watch confirmation than chase the green candle.
Not financial advice. DYOR
#NvidiaEarningsTonight:AIStocks’NextMove?
#AnthropicIPOTestsInvestorAppetiteForAI
#KOSPIFalls2.59%ToLowestCloseSinceFebruary
#AnthropicClearedToListOnNasdaqAsANT
HUMA is trading around $0.00827, up 24.59% in 24 hours, with impressive trading activity of 2.14 billion HUMA in volume. Price recently surged from the $0.0063 area toward $0.0100 before facing strong selling pressure near the $0.01055 daily high.
Now, the market is cooling down after that sharp rally. I'm watching the $0.0080–$0.0081 zone as immediate support. Holding this area could give buyers another chance to push toward $0.0085, followed by $0.0090 and $0.0095. A stronger breakout could bring $0.0100–$0.01055 back into focus.
However, losing $0.0080 could open the door toward $0.0075.
My view: HUMA still has momentum, but buyers need to prove they can defend support. The next move could be important, so I would rather watch confirmation than chase the green candle.
Not financial advice. DYOR
#NvidiaEarningsTonight:AIStocks’NextMove?
#AnthropicIPOTestsInvestorAppetiteForAI
#KOSPIFalls2.59%ToLowestCloseSinceFebruary
#AnthropicClearedToListOnNasdaqAsANT
112
R$BTC bt
{spot}(BTCUSDT)
#NvidiaEarningsTonight:AIStocks’NextMove? #AnthropicIPOTestsInvestorAppetiteForAI #NvidiaBoardNotConsideringHuang’sReturnasCEO #KOSPIFalls2.59%ToLowestCloseSinceFebruary 😀😁😘🤪🤧esistance 1 $65,578
Resistance 2 $66,334
Resistance 3 $67,204
Support 1 $63,952
Support 2 $63,082
Support 3 $62,326
3. Technical Analysis
BTC remains under bearish pressure.
Market momentum is weak.
A recovery above $65,578 could improve market sentiment.
Losing $63,952 may increase downside pressure.
R$BTC bt
#NvidiaEarningsTonight:AIStocks’NextMove? #AnthropicIPOTestsInvestorAppetiteForAI #NvidiaBoardNotConsideringHuang’sReturnasCEO #KOSPIFalls2.59%ToLowestCloseSinceFebruary 😀😁😘🤪🤧esistance 1 $65,578
Resistance 2 $66,334
Resistance 3 $67,204
Support 1 $63,952
Support 2 $63,082
Support 3 $62,326
3. Technical Analysis
BTC remains under bearish pressure.
Market momentum is weak.
A recovery above $65,578 could improve market sentiment.
Losing $63,952 may increase downside pressure.
#NvidiaEarningsTonight:AIStocks’NextMove? #AnthropicIPOTestsInvestorAppetiteForAI #NvidiaBoardNotConsideringHuang’sReturnasCEO #KOSPIFalls2.59%ToLowestCloseSinceFebruary 😀😁😘🤪🤧esistance 1 $65,578
Resistance 2 $66,334
Resistance 3 $67,204
Support 1 $63,952
Support 2 $63,082
Support 3 $62,326
3. Technical Analysis
BTC remains under bearish pressure.
Market momentum is weak.
A recovery above $65,578 could improve market sentiment.
Losing $63,952 may increase downside pressure.

2
1
1
12
·
--
$PFE USDT is slipping 1.40% as sellers take control. Bearish momentum is building, putting the next support zone in focus.
#NvidiaEarningsTonight:AIStocks’NextMove? #AnthropicIPOTestsInvestorAppetiteForAI #KOSPIFalls2.59%ToLowestCloseSinceFebruary #AnthropicClearedToListOnNasdaqAsANT #WhatInvestmentSignalsDo13FFilingsReveal?
$PFE USDT is slipping 1.40% as sellers take control. Bearish momentum is building, putting the next support zone in focus.
#NvidiaEarningsTonight:AIStocks’NextMove? #AnthropicIPOTestsInvestorAppetiteForAI #KOSPIFalls2.59%ToLowestCloseSinceFebruary #AnthropicClearedToListOnNasdaqAsANT #WhatInvestmentSignalsDo13FFilingsReveal?
#NvidiaEarningsTonight:AIStocks’NextMove? #AnthropicIPOTestsInvestorAppetiteForAI #KOSPIFalls2.59%ToLowestCloseSinceFebruary #AnthropicClearedToListOnNasdaqAsANT #WhatInvestmentSignalsDo13FFilingsReveal?
37

·
--
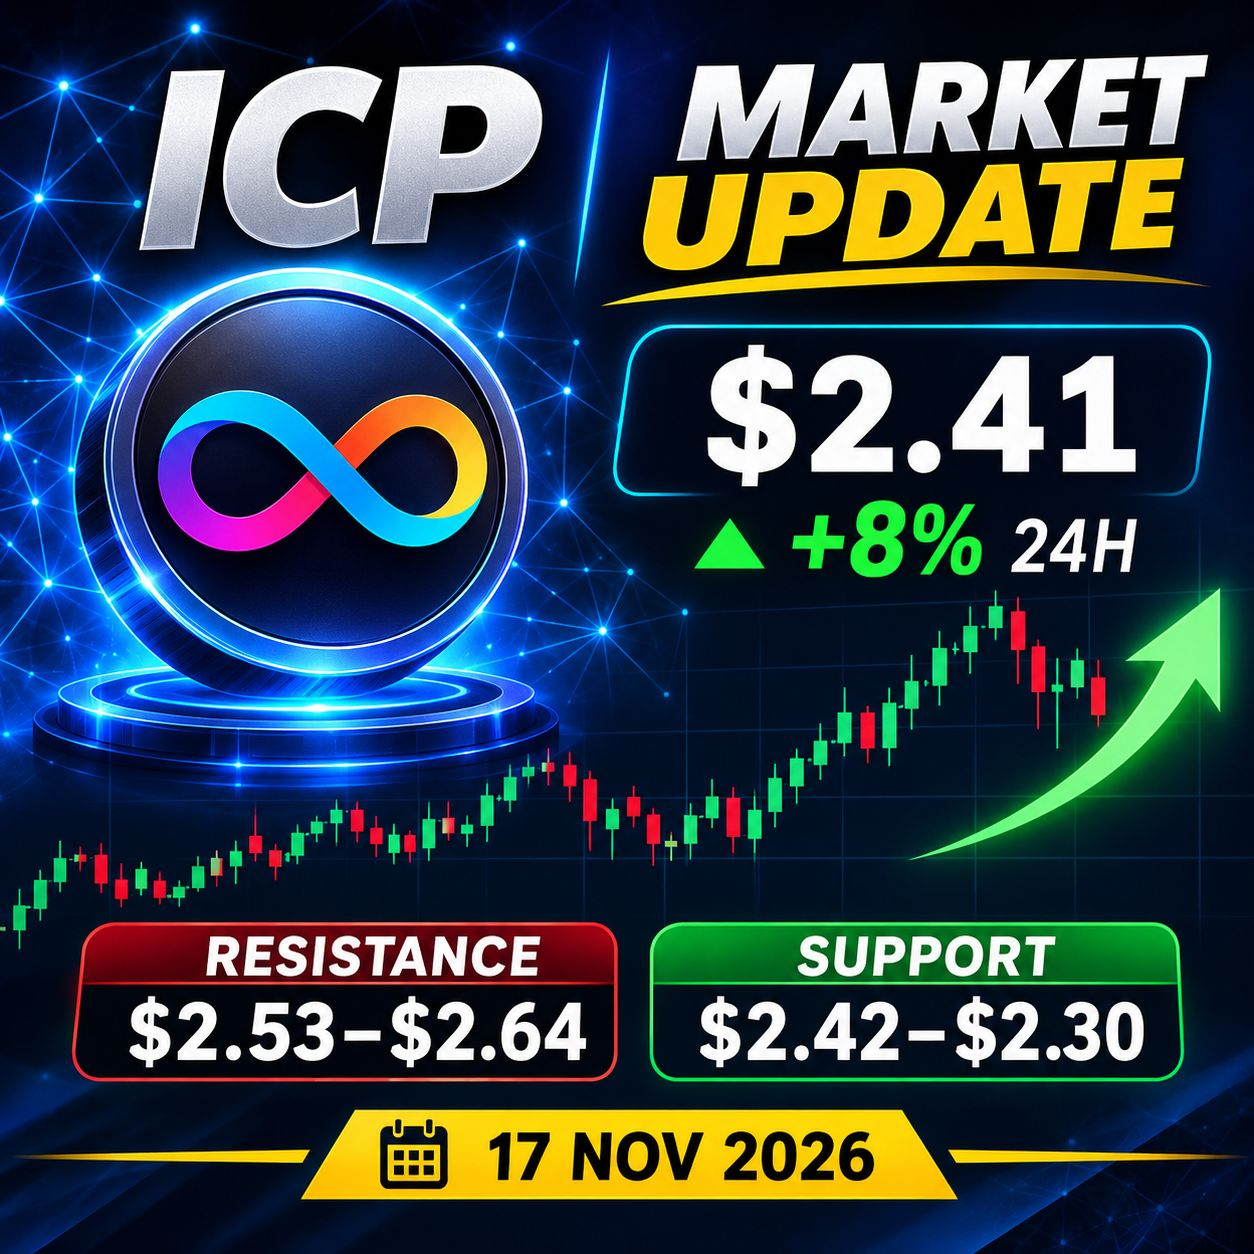
🚀 $ICP : (Internet Computer) – Latest Market Analysis
📊 Date: November 17, 2026
💰 Price: Around $2.41
📈 24H Change: +8%
Market Outlook: Bullish short-term momentum, but volatility remains high.
🎯 Resistance: $2.53 – $2.64
🛡️ Support: $2.42 – $2.30
A breakout above $2.53 could strengthen bullish momentum. Watch support carefully for a possible pullback.#AnthropicIPOTestsInvestorAppetiteForAI #NvidiaBoardNotConsideringHuang’sReturnasCEO #NvidiaEarningsTonight:AIStocks’NextMove? #KOSPIFalls2.59%ToLowestCloseSinceFebruary #WhatInvestmentSignalsDo13FFilingsReveal?
{spot}(ICPUSDT)
🚀 $ICP : (Internet Computer) – Latest Market Analysis
📊 Date: November 17, 2026
💰 Price: Around $2.41
📈 24H Change: +8%
Market Outlook: Bullish short-term momentum, but volatility remains high.
🎯 Resistance: $2.53 – $2.64
🛡️ Support: $2.42 – $2.30
A breakout above $2.53 could strengthen bullish momentum. Watch support carefully for a possible pullback.#AnthropicIPOTestsInvestorAppetiteForAI #NvidiaBoardNotConsideringHuang’sReturnasCEO #NvidiaEarningsTonight:AIStocks’NextMove? #KOSPIFalls2.59%ToLowestCloseSinceFebruary #WhatInvestmentSignalsDo13FFilingsReveal?
📊 Date: November 17, 2026
💰 Price: Around $2.41
📈 24H Change: +8%
Market Outlook: Bullish short-term momentum, but volatility remains high.
🎯 Resistance: $2.53 – $2.64
🛡️ Support: $2.42 – $2.30
A breakout above $2.53 could strengthen bullish momentum. Watch support carefully for a possible pullback.#AnthropicIPOTestsInvestorAppetiteForAI #NvidiaBoardNotConsideringHuang’sReturnasCEO #NvidiaEarningsTonight:AIStocks’NextMove? #KOSPIFalls2.59%ToLowestCloseSinceFebruary #WhatInvestmentSignalsDo13FFilingsReveal?
1
33

·
--
Bullish
$LIT — Bullish Trend Continuation Watch
LIT is trading around 3.0285, up 18.44% in 24 hours. Strong buying momentum is visible, but holding the breakout zone is essential for continuation.
EP: Await pullback confirmation
TP1: Pending chart confirmation
TP2: Pending chart confirmation
TP3: Pending chart confirmation
SL: Below confirmed support
If buyers maintain control above support, another move toward resistance could develop. Watch for liquidity sweeps before entering.
Let's go $LIT
{future}(LITUSDT)
#WhatInvestmentSignalsDo13FFilingsReveal? #KOSPIFalls2.59%ToLowestCloseSinceFebruary #NvidiaBoardNotConsideringHuang’sReturnasCEO #AnthropicIPOTestsInvestorAppetiteForAI #AnthropicIPOTestsInvestorAppetiteForAI
$LIT — Bullish Trend Continuation Watch
LIT is trading around 3.0285, up 18.44% in 24 hours. Strong buying momentum is visible, but holding the breakout zone is essential for continuation.
EP: Await pullback confirmation
TP1: Pending chart confirmation
TP2: Pending chart confirmation
TP3: Pending chart confirmation
SL: Below confirmed support
If buyers maintain control above support, another move toward resistance could develop. Watch for liquidity sweeps before entering.
Let's go $LIT
#WhatInvestmentSignalsDo13FFilingsReveal? #KOSPIFalls2.59%ToLowestCloseSinceFebruary #NvidiaBoardNotConsideringHuang’sReturnasCEO #AnthropicIPOTestsInvestorAppetiteForAI #AnthropicIPOTestsInvestorAppetiteForAI
LIT is trading around 3.0285, up 18.44% in 24 hours. Strong buying momentum is visible, but holding the breakout zone is essential for continuation.
EP: Await pullback confirmation
TP1: Pending chart confirmation
TP2: Pending chart confirmation
TP3: Pending chart confirmation
SL: Below confirmed support
If buyers maintain control above support, another move toward resistance could develop. Watch for liquidity sweeps before entering.
Let's go $LIT
#WhatInvestmentSignalsDo13FFilingsReveal? #KOSPIFalls2.59%ToLowestCloseSinceFebruary #NvidiaBoardNotConsideringHuang’sReturnasCEO #AnthropicIPOTestsInvestorAppetiteForAI #AnthropicIPOTestsInvestorAppetiteForAI
22

·
--
Learn how the stock market works.
Invest in established, financially strong companies.
Avoid buying stocks just because their prices are rising.
Never invest borrowed money.
Don't panic when the market falls.
Use stop-loss orders for short-term trades.
Practise with a demo account before real trading.
2. Stocks vs crypto
Stock market Crypto market
Company ownership Digital assets
Regulated exchanges Varying regulation
Often less volatile Often highly volatile
Long-term investing High-risk trading
3. A beginner's learning plan
Week 1: Learn stocks, shares, indices and exchanges.
Week 2: Learn support, resistance and candlestick charts.
Week 3: Practise technical and fundamental analysis.
4. If you want to invest in Pakistan
Start learning about the Pakistan Stock Exchange (PSX).
Official beginner guide: PSX – For New Investors
Account opening guide: How to open a PSX account
Free practice: Stock market learning and virtual trading#NvidiaEarningsTonight:AIStocks’NextMove? #AnthropicIPOTestsInvestorAppetiteForAI #KOSPIFalls2.59%ToLowestCloseSinceFebruary #WhatInvestmentSignalsDo13FFilingsReveal?
Week 4: Practise with virtual money and review your results
{future}(BTCUSDT)
.
Learn how the stock market works.
Invest in established, financially strong companies.
Avoid buying stocks just because their prices are rising.
Never invest borrowed money.
Don't panic when the market falls.
Use stop-loss orders for short-term trades.
Practise with a demo account before real trading.
2. Stocks vs crypto
Stock market Crypto market
Company ownership Digital assets
Regulated exchanges Varying regulation
Often less volatile Often highly volatile
Long-term investing High-risk trading
3. A beginner's learning plan
Week 1: Learn stocks, shares, indices and exchanges.
Week 2: Learn support, resistance and candlestick charts.
Week 3: Practise technical and fundamental analysis.
4. If you want to invest in Pakistan
Start learning about the Pakistan Stock Exchange (PSX).
Official beginner guide: PSX – For New Investors
Account opening guide: How to open a PSX account
Free practice: Stock market learning and virtual trading#NvidiaEarningsTonight:AIStocks’NextMove? #AnthropicIPOTestsInvestorAppetiteForAI #KOSPIFalls2.59%ToLowestCloseSinceFebruary #WhatInvestmentSignalsDo13FFilingsReveal?
Week 4: Practise with virtual money and review your results
.
Invest in established, financially strong companies.
Avoid buying stocks just because their prices are rising.
Never invest borrowed money.
Don't panic when the market falls.
Use stop-loss orders for short-term trades.
Practise with a demo account before real trading.
2. Stocks vs crypto
Stock market Crypto market
Company ownership Digital assets
Regulated exchanges Varying regulation
Often less volatile Often highly volatile
Long-term investing High-risk trading
3. A beginner's learning plan
Week 1: Learn stocks, shares, indices and exchanges.
Week 2: Learn support, resistance and candlestick charts.
Week 3: Practise technical and fundamental analysis.
4. If you want to invest in Pakistan
Start learning about the Pakistan Stock Exchange (PSX).
Official beginner guide: PSX – For New Investors
Account opening guide: How to open a PSX account
Free practice: Stock market learning and virtual trading#NvidiaEarningsTonight:AIStocks’NextMove? #AnthropicIPOTestsInvestorAppetiteForAI #KOSPIFalls2.59%ToLowestCloseSinceFebruary #WhatInvestmentSignalsDo13FFilingsReveal?
Week 4: Practise with virtual money and review your results
.
1
5
·
--
Bullish
$CYPH — Bullish Momentum Watch
CYPH is trading around 1.989, showing an 16.93% gain in 24 hours. Buyers currently have positive momentum, but confirmation above resistance is important before expecting further upside.
EP: Await breakout retest
TP1: Pending chart confirmation
TP2: Pending chart confirmation
TP3: Pending chart confirmation
SL: Below confirmed support
Watch resistance for a potential breakout and nearby liquidity for possible rejection. Sustained buyer control would strengthen the continuation setup.
Let's go $CYPH
{future}(CYPHUSDT)
#WhatInvestmentSignalsDo13FFilingsReveal? #AnthropicClearedToListOnNasdaqAsANT #KOSPIFalls2.59%ToLowestCloseSinceFebruary #AnthropicIPOTestsInvestorAppetiteForAI #NvidiaEarningsTonight:AIStocks’NextMove?
$CYPH — Bullish Momentum Watch
CYPH is trading around 1.989, showing an 16.93% gain in 24 hours. Buyers currently have positive momentum, but confirmation above resistance is important before expecting further upside.
EP: Await breakout retest
TP1: Pending chart confirmation
TP2: Pending chart confirmation
TP3: Pending chart confirmation
SL: Below confirmed support
Watch resistance for a potential breakout and nearby liquidity for possible rejection. Sustained buyer control would strengthen the continuation setup.
Let's go $CYPH
#WhatInvestmentSignalsDo13FFilingsReveal? #AnthropicClearedToListOnNasdaqAsANT #KOSPIFalls2.59%ToLowestCloseSinceFebruary #AnthropicIPOTestsInvestorAppetiteForAI #NvidiaEarningsTonight:AIStocks’NextMove?
CYPH is trading around 1.989, showing an 16.93% gain in 24 hours. Buyers currently have positive momentum, but confirmation above resistance is important before expecting further upside.
EP: Await breakout retest
TP1: Pending chart confirmation
TP2: Pending chart confirmation
TP3: Pending chart confirmation
SL: Below confirmed support
Watch resistance for a potential breakout and nearby liquidity for possible rejection. Sustained buyer control would strengthen the continuation setup.
Let's go $CYPH
#WhatInvestmentSignalsDo13FFilingsReveal? #AnthropicClearedToListOnNasdaqAsANT #KOSPIFalls2.59%ToLowestCloseSinceFebruary #AnthropicIPOTestsInvestorAppetiteForAI #NvidiaEarningsTonight:AIStocks’NextMove?
35
·
--
Bullish
$PREDICT — Bullish Momentum Watch
PREDICT is trading around 1.2107, up 16.78% over the last 24 hours. Positive momentum indicates buying interest, while the next resistance zone will be important for determining continuation.
EP: Await support confirmation
TP1: Pending chart confirmation
TP2: Pending chart confirmation
TP3: Pending chart confirmation
SL: Below confirmed support
A strong support hold could attract further buyers. Watch liquidity and resistance closely before taking a position.
Let's go $PREDICT
{future}(PREDICTUSDT)
#KOSPIFalls2.59%ToLowestCloseSinceFebruary #WhatInvestmentSignalsDo13FFilingsReveal? #NvidiaBoardNotConsideringHuang’sReturnasCEO
#WhatInvestmentSignalsDo13FFilingsReveal? #WhatInvestmentSignalsDo13FFilingsReveal?
$PREDICT — Bullish Momentum Watch
PREDICT is trading around 1.2107, up 16.78% over the last 24 hours. Positive momentum indicates buying interest, while the next resistance zone will be important for determining continuation.
EP: Await support confirmation
TP1: Pending chart confirmation
TP2: Pending chart confirmation
TP3: Pending chart confirmation
SL: Below confirmed support
A strong support hold could attract further buyers. Watch liquidity and resistance closely before taking a position.
Let's go $PREDICT
#KOSPIFalls2.59%ToLowestCloseSinceFebruary #WhatInvestmentSignalsDo13FFilingsReveal? #NvidiaBoardNotConsideringHuang’sReturnasCEO
#WhatInvestmentSignalsDo13FFilingsReveal? #WhatInvestmentSignalsDo13FFilingsReveal?
PREDICT is trading around 1.2107, up 16.78% over the last 24 hours. Positive momentum indicates buying interest, while the next resistance zone will be important for determining continuation.
EP: Await support confirmation
TP1: Pending chart confirmation
TP2: Pending chart confirmation
TP3: Pending chart confirmation
SL: Below confirmed support
A strong support hold could attract further buyers. Watch liquidity and resistance closely before taking a position.
Let's go $PREDICT
#KOSPIFalls2.59%ToLowestCloseSinceFebruary #WhatInvestmentSignalsDo13FFilingsReveal? #NvidiaBoardNotConsideringHuang’sReturnasCEO
#WhatInvestmentSignalsDo13FFilingsReveal? #WhatInvestmentSignalsDo13FFilingsReveal?
166

Some thing is Brewing on Market.
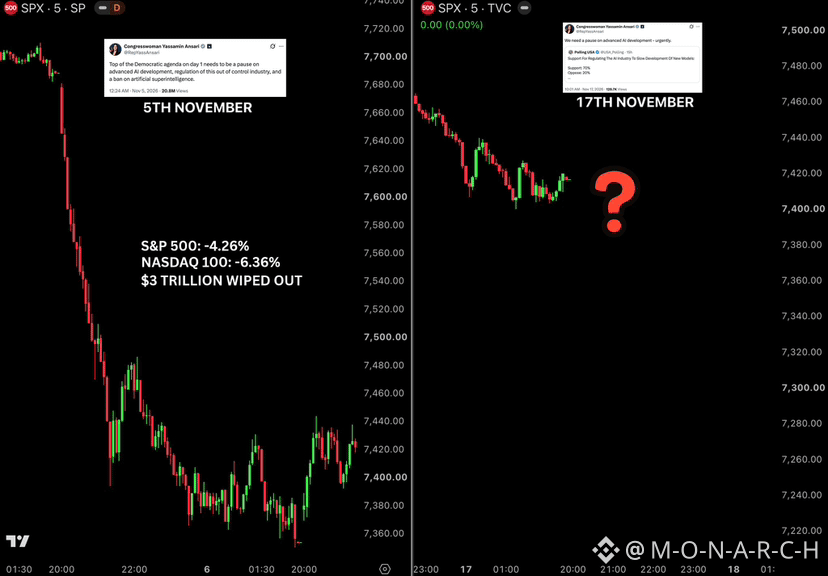
THIS SHOULD SCARE EVERY INVESTOR RIGHT NOW.
The last time this Congresswoman called for an AI pause, the S&P 500 crashed -4.26% and the Nasdaq 100 -6.36%.
$3 trillion was wiped out in a single day, the largest single day wipeout ever.
Now she's saying it again.
Imagine how Crypto Behaves.
#NvidiaEarningsTonight:AIStocks’NextMove? #A Packed Week of Earnings and Data Tests Markets #NvidiaBoardNotConsideringHuang’sReturnasCEO #KOSPIFalls2.59%ToLowestCloseSinceFebruary #WhatInvestmentSignalsDo13FFilingsReveal?
Some thing is Brewing on Market.
THIS SHOULD SCARE EVERY INVESTOR RIGHT NOW.
The last time this Congresswoman called for an AI pause, the S&P 500 crashed -4.26% and the Nasdaq 100 -6.36%.
$3 trillion was wiped out in a single day, the largest single day wipeout ever.
Now she's saying it again.
Imagine how Crypto Behaves.
#NvidiaEarningsTonight:AIStocks’NextMove? #A Packed Week of Earnings and Data Tests Markets #NvidiaBoardNotConsideringHuang’sReturnasCEO #KOSPIFalls2.59%ToLowestCloseSinceFebruary #WhatInvestmentSignalsDo13FFilingsReveal?
THIS SHOULD SCARE EVERY INVESTOR RIGHT NOW.
The last time this Congresswoman called for an AI pause, the S&P 500 crashed -4.26% and the Nasdaq 100 -6.36%.
$3 trillion was wiped out in a single day, the largest single day wipeout ever.
Now she's saying it again.
Imagine how Crypto Behaves.
#NvidiaEarningsTonight:AIStocks’NextMove? #A Packed Week of Earnings and Data Tests Markets #NvidiaBoardNotConsideringHuang’sReturnasCEO #KOSPIFalls2.59%ToLowestCloseSinceFebruary #WhatInvestmentSignalsDo13FFilingsReveal?
119

·
--
#$BTC Bitcoin Latest Market Analysis
17 November 2026 | BTC/USD
BEARISH TREND
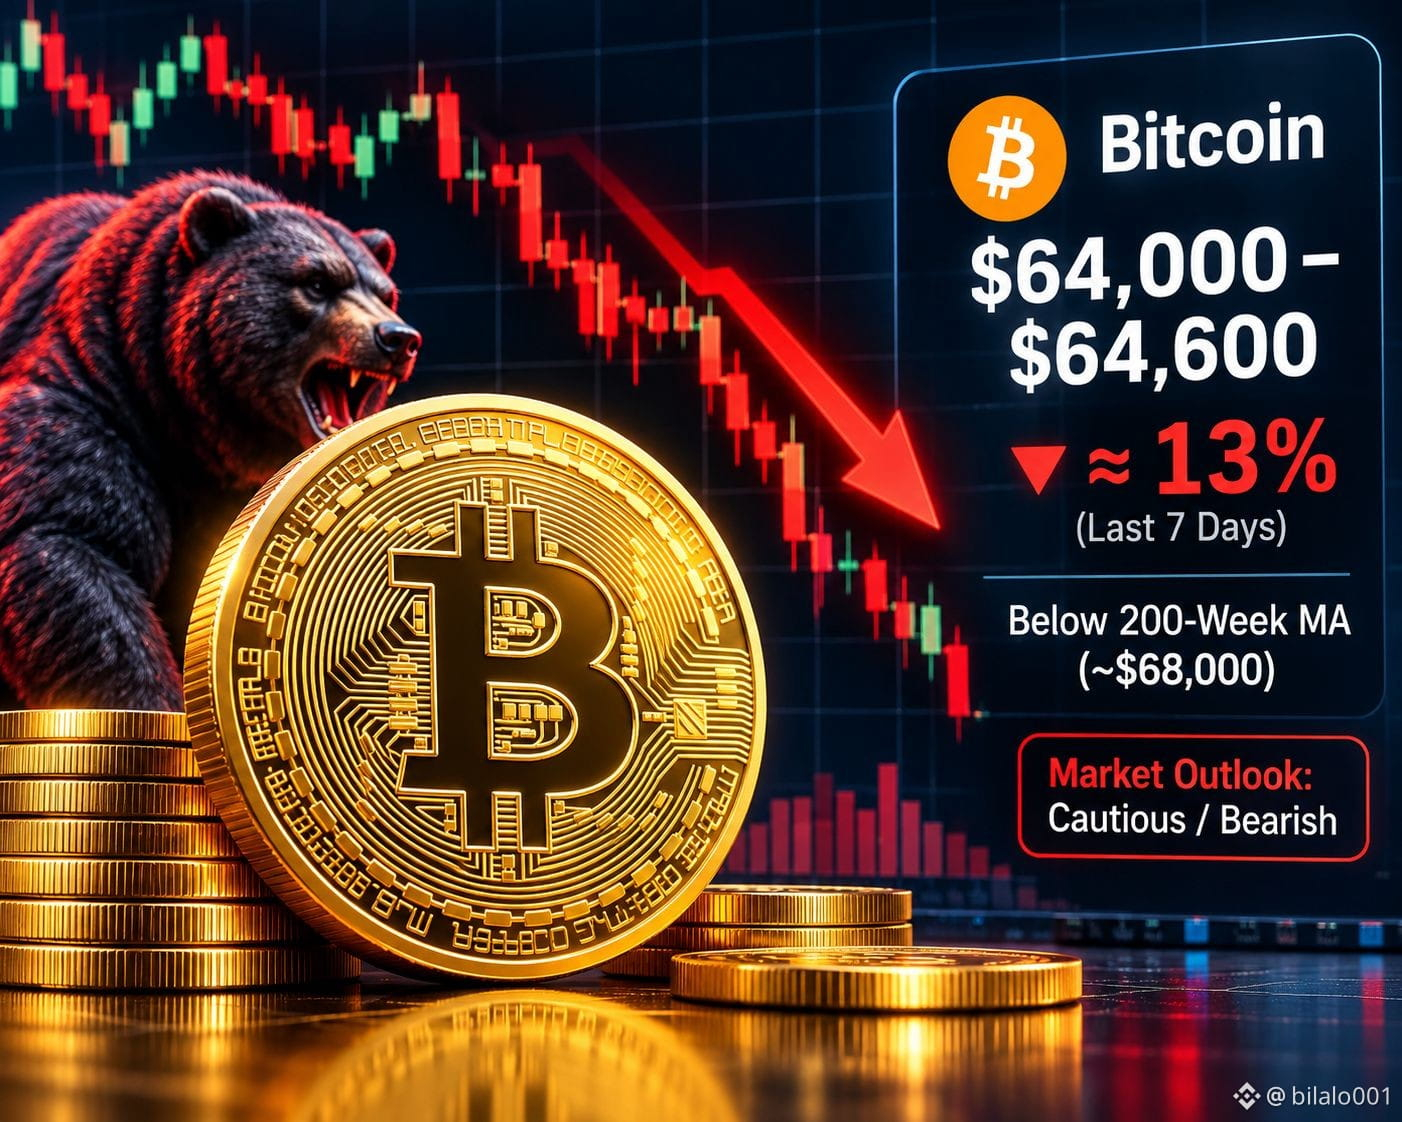
Current Bitcoin price: Approximately $64,000–$64,600 USD.
Bitcoin is facing strong selling pressure after falling around 13% over the last seven days. The price remains below its important 200-week moving average near $68,000. CoinDesk +1
### Key market levels
| Level | Price |
| ------------------ | ------- |
| Resistance 1 | $65,000 |
| Major resistance | $68,000 |
| Support 1 | $62,000 |
| Next downside zone | $60,000 |
CoinDesk +1
### Market outlook
* Bullish: A strong recovery above $68,000 could improve market sentiment.
* Bearish: Breaking below $62,000 could increase selling pressure.
* My view: Short-term trend remains bearish. Wait for confirmation before entering a trade.
Trading advice: Avoid buying just because the price is falling. Practise on a demo account first. No analysis guarantees profits.
Source: [CoinDesk – Bitcoin latest market update](https://www.coindesk.com/markets/2026/11/17/bitcoin-remains-penned-in-near-usd64-000-even-as-etf-outflow-streak-ends?utm_source=chatgpt.com).
#btc70k
#$BTC Bitcoin Latest Market Analysis
17 November 2026 | BTC/USD
BEARISH TREND
Current Bitcoin price: Approximately $64,000–$64,600 USD.
Bitcoin is facing strong selling pressure after falling around 13% over the last seven days. The price remains below its important 200-week moving average near $68,000. CoinDesk +1
### Key market levels
| Level | Price |
| ------------------ | ------- |
| Resistance 1 | $65,000 |
| Major resistance | $68,000 |
| Support 1 | $62,000 |
| Next downside zone | $60,000 |
CoinDesk +1
### Market outlook
* Bullish: A strong recovery above $68,000 could improve market sentiment.
* Bearish: Breaking below $62,000 could increase selling pressure.
* My view: Short-term trend remains bearish. Wait for confirmation before entering a trade.
Trading advice: Avoid buying just because the price is falling. Practise on a demo account first. No analysis guarantees profits.
Source: [CoinDesk – Bitcoin latest market update](https://www.coindesk.com/markets/2026/11/17/bitcoin-remains-penned-in-near-usd64-000-even-as-etf-outflow-streak-ends?utm_source=chatgpt.com).
#btc70k
17 November 2026 | BTC/USD
BEARISH TREND
Current Bitcoin price: Approximately $64,000–$64,600 USD.
Bitcoin is facing strong selling pressure after falling around 13% over the last seven days. The price remains below its important 200-week moving average near $68,000. CoinDesk +1
### Key market levels
| Level | Price |
| ------------------ | ------- |
| Resistance 1 | $65,000 |
| Major resistance | $68,000 |
| Support 1 | $62,000 |
| Next downside zone | $60,000 |
CoinDesk +1
### Market outlook
* Bullish: A strong recovery above $68,000 could improve market sentiment.
* Bearish: Breaking below $62,000 could increase selling pressure.
* My view: Short-term trend remains bearish. Wait for confirmation before entering a trade.
Trading advice: Avoid buying just because the price is falling. Practise on a demo account first. No analysis guarantees profits.
Source: [CoinDesk – Bitcoin latest market update](https://www.coindesk.com/markets/2026/11/17/bitcoin-remains-penned-in-near-usd64-000-even-as-etf-outflow-streak-ends?utm_source=chatgpt.com).
#btc70k
9

·
--
Bullish
#NvidiaEarningsTonight:AIStocks’NextMove? #KOSPIFalls2.59%ToLowestCloseSinceFebruary #AnthropicClearedToListOnNasdaqAsANT $METAB 🚀 GOLD (XAUUSD) BULLISH? 🔥 Trump News & Gold Market Update 🇺🇸📈
🟢 BUY Setup | Gold Price Analysis
📊 Bullish Movement
🤲 InshaAllah Gold Goes Up!
⚠️ This is my market outlook, not a guaranteed trading signal.
#NvidiaEarningsTonight:AIStocks’NextMove? #KOSPIFalls2.59%ToLowestCloseSinceFebruary #AnthropicClearedToListOnNasdaqAsANT $METAB 🚀 GOLD (XAUUSD) BULLISH? 🔥 Trump News & Gold Market Update 🇺🇸📈
🟢 BUY Setup | Gold Price Analysis
📊 Bullish Movement
🤲 InshaAllah Gold Goes Up!
⚠️ This is my market outlook, not a guaranteed trading signal.
🟢 BUY Setup | Gold Price Analysis
📊 Bullish Movement
🤲 InshaAllah Gold Goes Up!
⚠️ This is my market outlook, not a guaranteed trading signal.

66
·
--
$MELI USDT is facing bearish pressure with a 1.53% decline. Sellers remain active, and volatility could bring another sharp move.
#NvidiaEarningsTonight:AIStocks’NextMove? #WhatInvestmentSignalsDo13FFilingsReveal? #AnthropicClearedToListOnNasdaqAsANT #KOSPIFalls2.59%ToLowestCloseSinceFebruary #AnthropicIPOTestsInvestorAppetiteForAI
$MELI USDT is facing bearish pressure with a 1.53% decline. Sellers remain active, and volatility could bring another sharp move.
#NvidiaEarningsTonight:AIStocks’NextMove? #WhatInvestmentSignalsDo13FFilingsReveal? #AnthropicClearedToListOnNasdaqAsANT #KOSPIFalls2.59%ToLowestCloseSinceFebruary #AnthropicIPOTestsInvestorAppetiteForAI
#NvidiaEarningsTonight:AIStocks’NextMove? #WhatInvestmentSignalsDo13FFilingsReveal? #AnthropicClearedToListOnNasdaqAsANT #KOSPIFalls2.59%ToLowestCloseSinceFebruary #AnthropicIPOTestsInvestorAppetiteForAI
25
·
--
Bullish
$CROSS — Bullish Momentum Building
CROSS is trading around 0.14930, gaining 18.08% over the last 24 hours. The positive momentum suggests increasing buying interest, but resistance could trigger short-term profit-taking.
EP: Await confirmed support retest
TP1: Pending chart confirmation
TP2: Pending chart confirmation
TP3: Pending chart confirmation
SL: Below confirmed support
A successful support retest could favor trend continuation. Buyers need to maintain control and overcome nearby resistance.
Let's go $CROSS
{alpha}(560x6bf62ca91e397b5a7d1d6bce97d9092065d7a510)
#WhatInvestmentSignalsDo13FFilingsReveal? #KOSPIFalls2.59%ToLowestCloseSinceFebruary #NvidiaBoardNotConsideringHuang’sReturnasCEO #NvidiaEarningsTonight:AIStocks’NextMove? #WhatInvestmentSignalsDo13FFilingsReveal?
$CROSS — Bullish Momentum Building
CROSS is trading around 0.14930, gaining 18.08% over the last 24 hours. The positive momentum suggests increasing buying interest, but resistance could trigger short-term profit-taking.
EP: Await confirmed support retest
TP1: Pending chart confirmation
TP2: Pending chart confirmation
TP3: Pending chart confirmation
SL: Below confirmed support
A successful support retest could favor trend continuation. Buyers need to maintain control and overcome nearby resistance.
Let's go $CROSS
#WhatInvestmentSignalsDo13FFilingsReveal? #KOSPIFalls2.59%ToLowestCloseSinceFebruary #NvidiaBoardNotConsideringHuang’sReturnasCEO #NvidiaEarningsTonight:AIStocks’NextMove? #WhatInvestmentSignalsDo13FFilingsReveal?
CROSS is trading around 0.14930, gaining 18.08% over the last 24 hours. The positive momentum suggests increasing buying interest, but resistance could trigger short-term profit-taking.
EP: Await confirmed support retest
TP1: Pending chart confirmation
TP2: Pending chart confirmation
TP3: Pending chart confirmation
SL: Below confirmed support
A successful support retest could favor trend continuation. Buyers need to maintain control and overcome nearby resistance.
Let's go $CROSS
#WhatInvestmentSignalsDo13FFilingsReveal? #KOSPIFalls2.59%ToLowestCloseSinceFebruary #NvidiaBoardNotConsideringHuang’sReturnasCEO #NvidiaEarningsTonight:AIStocks’NextMove? #WhatInvestmentSignalsDo13FFilingsReveal?
74

$AGT 🚀 AGT/USDT TODAY MARKET ANALYSIS | November 17, 2026
Hello dear brothers! ❤️ Welcome back to my crypto channel.
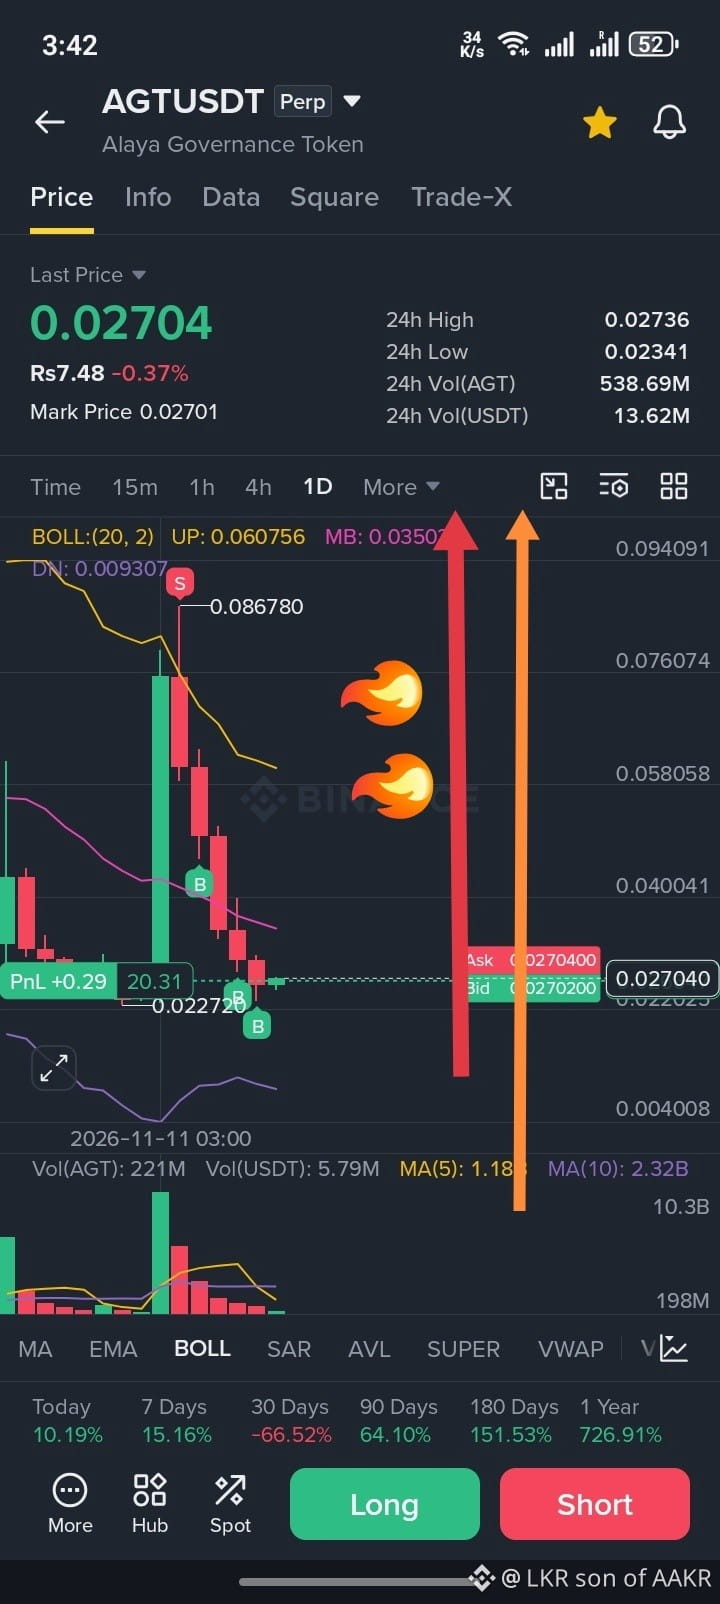
Today we are discussing AGT/USDT (Alaya Governance Token) and its latest market movement.
💰 Current Price: Around $0.0260–$0.0267
📊 Market Overview:
AGT is showing mixed signals. The short-term trend is bearish, while the daily trend is still bullish. Traders should watch important support and resistance levels before opening a position.
🟢 Support Levels:
- $0.0252
- $0.0234
- $0.0227
🔴 Resistance Levels:
- $0.0277
- $0.0307
- $0.0350
📈 Bullish Scenario:
If AGT breaks above $0.0277 with strong buying volume, we could see a recovery toward $0.0307.
📉 Bearish Scenario:
If AGT breaks below $0.0252, selling pressure may increase, with $0.0234 as the next support area.
🎯 My Trading Strategy:
Don't rush into LONG or SHORT positions. Wait for confirmation, monitor trading volume, and always use a stop-loss.
🔥 Stay patient, trade smart, and protect your investment.
❤️ Thank you, dear brothers, for supporting my channel!
💬 What is your prediction for AGT?
🟢 LONG or 🔴 SHORT?
#AGT #AGTUSDT #AlayaGovernanceToken #BinanceFutures #CryptoAnalysis #CryptoTrading #Altcoins #TechnicalAnalysis#AnthropicIPOTestsInvestorAppetiteForAI #KOSPIFalls2.59%ToLowestCloseSinceFebruary #NvidiaEarningsTonight:AIStocks’NextMove?
$AGT 🚀 AGT/USDT TODAY MARKET ANALYSIS | November 17, 2026
Hello dear brothers! ❤️ Welcome back to my crypto channel.
Today we are discussing AGT/USDT (Alaya Governance Token) and its latest market movement.
💰 Current Price: Around $0.0260–$0.0267
📊 Market Overview:
AGT is showing mixed signals. The short-term trend is bearish, while the daily trend is still bullish. Traders should watch important support and resistance levels before opening a position.
🟢 Support Levels:
- $0.0252
- $0.0234
- $0.0227
🔴 Resistance Levels:
- $0.0277
- $0.0307
- $0.0350
📈 Bullish Scenario:
If AGT breaks above $0.0277 with strong buying volume, we could see a recovery toward $0.0307.
📉 Bearish Scenario:
If AGT breaks below $0.0252, selling pressure may increase, with $0.0234 as the next support area.
🎯 My Trading Strategy:
Don't rush into LONG or SHORT positions. Wait for confirmation, monitor trading volume, and always use a stop-loss.
🔥 Stay patient, trade smart, and protect your investment.
❤️ Thank you, dear brothers, for supporting my channel!
💬 What is your prediction for AGT?
🟢 LONG or 🔴 SHORT?
#AGT #AGTUSDT #AlayaGovernanceToken #BinanceFutures #CryptoAnalysis #CryptoTrading #Altcoins #TechnicalAnalysis#AnthropicIPOTestsInvestorAppetiteForAI #KOSPIFalls2.59%ToLowestCloseSinceFebruary #NvidiaEarningsTonight:AIStocks’NextMove?
Hello dear brothers! ❤️ Welcome back to my crypto channel.
Today we are discussing AGT/USDT (Alaya Governance Token) and its latest market movement.
💰 Current Price: Around $0.0260–$0.0267
📊 Market Overview:
AGT is showing mixed signals. The short-term trend is bearish, while the daily trend is still bullish. Traders should watch important support and resistance levels before opening a position.
🟢 Support Levels:
- $0.0252
- $0.0234
- $0.0227
🔴 Resistance Levels:
- $0.0277
- $0.0307
- $0.0350
📈 Bullish Scenario:
If AGT breaks above $0.0277 with strong buying volume, we could see a recovery toward $0.0307.
📉 Bearish Scenario:
If AGT breaks below $0.0252, selling pressure may increase, with $0.0234 as the next support area.
🎯 My Trading Strategy:
Don't rush into LONG or SHORT positions. Wait for confirmation, monitor trading volume, and always use a stop-loss.
🔥 Stay patient, trade smart, and protect your investment.
❤️ Thank you, dear brothers, for supporting my channel!
💬 What is your prediction for AGT?
🟢 LONG or 🔴 SHORT?
#AGT #AGTUSDT #AlayaGovernanceToken #BinanceFutures #CryptoAnalysis #CryptoTrading #Altcoins #TechnicalAnalysis#AnthropicIPOTestsInvestorAppetiteForAI #KOSPIFalls2.59%ToLowestCloseSinceFebruary #NvidiaEarningsTonight:AIStocks’NextMove?
84
·
--
$BTTC : Latest Market Analysis 🚀
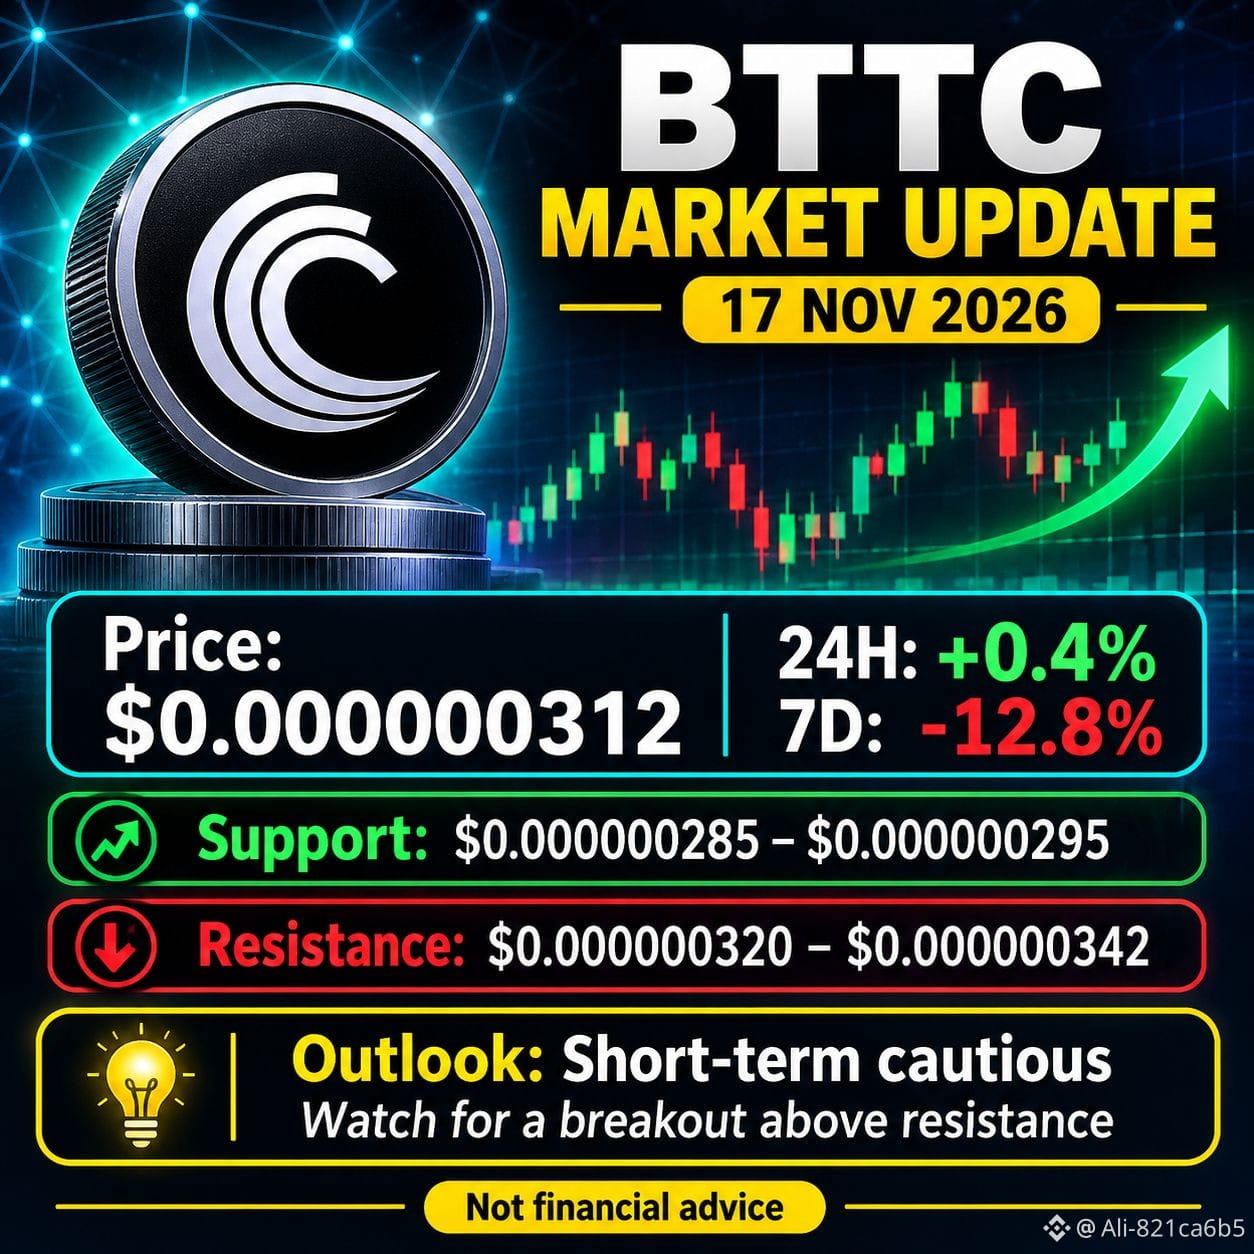
BTTC (BitTorrent) Update
Price: $0.000000312
24H Change: +0.4%
7D Change: -12.8%
Support: $0.000000285
Resistance: $0.000000342
Market Outlook: BTTC shows a small daily recovery, but the weekly trend remains bearish. A breakout above resistance could improve bullish momentum.
📊 Watch support and resistance before entering a trade.#AnthropicIPOTestsInvestorAppetiteForAI #WhatInvestmentSignalsDo13FFilingsReveal? #KOSPIFalls2.59%ToLowestCloseSinceFebruary #NvidiaBoardNotConsideringHuang’sReturnasCEO #AnthropicIPOTestsInvestorAppetiteForAI
{spot}(BTTCUSDT)
$BTTC : Latest Market Analysis 🚀
BTTC (BitTorrent) Update
Price: $0.000000312
24H Change: +0.4%
7D Change: -12.8%
Support: $0.000000285
Resistance: $0.000000342
Market Outlook: BTTC shows a small daily recovery, but the weekly trend remains bearish. A breakout above resistance could improve bullish momentum.
📊 Watch support and resistance before entering a trade.#AnthropicIPOTestsInvestorAppetiteForAI #WhatInvestmentSignalsDo13FFilingsReveal? #KOSPIFalls2.59%ToLowestCloseSinceFebruary #NvidiaBoardNotConsideringHuang’sReturnasCEO #AnthropicIPOTestsInvestorAppetiteForAI
BTTC (BitTorrent) Update
Price: $0.000000312
24H Change: +0.4%
7D Change: -12.8%
Support: $0.000000285
Resistance: $0.000000342
Market Outlook: BTTC shows a small daily recovery, but the weekly trend remains bearish. A breakout above resistance could improve bullish momentum.
📊 Watch support and resistance before entering a trade.#AnthropicIPOTestsInvestorAppetiteForAI #WhatInvestmentSignalsDo13FFilingsReveal? #KOSPIFalls2.59%ToLowestCloseSinceFebruary #NvidiaBoardNotConsideringHuang’sReturnasCEO #AnthropicIPOTestsInvestorAppetiteForAI
1
5
·
--
$OXY USDT is trading lower by 1.44%. Selling pressure is increasing, and the next move could determine market direction.
#WhatInvestmentSignalsDo13FFilingsReveal? #NvidiaEarningsTonight:AIStocks’NextMove? #KOSPIFalls2.59%ToLowestCloseSinceFebruary #WhatInvestmentSignalsDo13FFilingsReveal?
$OXY USDT is trading lower by 1.44%. Selling pressure is increasing, and the next move could determine market direction.
#WhatInvestmentSignalsDo13FFilingsReveal? #NvidiaEarningsTonight:AIStocks’NextMove? #KOSPIFalls2.59%ToLowestCloseSinceFebruary #WhatInvestmentSignalsDo13FFilingsReveal?
#WhatInvestmentSignalsDo13FFilingsReveal? #NvidiaEarningsTonight:AIStocks’NextMove? #KOSPIFalls2.59%ToLowestCloseSinceFebruary #WhatInvestmentSignalsDo13FFilingsReveal?
22
·
--
$AMGN USDT is losing ground with a 2.59% drop. Bears are pressing harder, and traders should watch for continued downside pressure.
#WhatInvestmentSignalsDo13FFilingsReveal? #AnthropicClearedToListOnNasdaqAsANT #NvidiaBoardNotConsideringHuang’sReturnasCEO #KOSPIFalls2.59%ToLowestCloseSinceFebruary #NvidiaEarningsTonight:AIStocks’NextMove?
$AMGN USDT is losing ground with a 2.59% drop. Bears are pressing harder, and traders should watch for continued downside pressure.
#WhatInvestmentSignalsDo13FFilingsReveal? #AnthropicClearedToListOnNasdaqAsANT #NvidiaBoardNotConsideringHuang’sReturnasCEO #KOSPIFalls2.59%ToLowestCloseSinceFebruary #NvidiaEarningsTonight:AIStocks’NextMove?
#WhatInvestmentSignalsDo13FFilingsReveal? #AnthropicClearedToListOnNasdaqAsANT #NvidiaBoardNotConsideringHuang’sReturnasCEO #KOSPIFalls2.59%ToLowestCloseSinceFebruary #NvidiaEarningsTonight:AIStocks’NextMove?
21
·
--
$NU USDT is under selling pressure, dropping 2.61%. Bears are gaining ground, and traders are watching for further downside.
#WhatInvestmentSignalsDo13FFilingsReveal? #AnthropicClearedToListOnNasdaqAsANT #KOSPIFalls2.59%ToLowestCloseSinceFebruary #NvidiaBoardNotConsideringHuang’sReturnasCEO #AnthropicIPOTestsInvestorAppetiteForAI
$NU USDT is under selling pressure, dropping 2.61%. Bears are gaining ground, and traders are watching for further downside.
#WhatInvestmentSignalsDo13FFilingsReveal? #AnthropicClearedToListOnNasdaqAsANT #KOSPIFalls2.59%ToLowestCloseSinceFebruary #NvidiaBoardNotConsideringHuang’sReturnasCEO #AnthropicIPOTestsInvestorAppetiteForAI
#WhatInvestmentSignalsDo13FFilingsReveal? #AnthropicClearedToListOnNasdaqAsANT #KOSPIFalls2.59%ToLowestCloseSinceFebruary #NvidiaBoardNotConsideringHuang’sReturnasCEO #AnthropicIPOTestsInvestorAppetiteForAI
27
·
--
$ANT USDT is holding green territory with a +0.28% gain. Buyers are stepping in, and the next move could bring fresh momentum.
#NvidiaEarningsTonight:AIStocks’NextMove? #NvidiaBoardNotConsideringHuang’sReturnasCEO #KOSPIFalls2.59%ToLowestCloseSinceFebruary #WhatInvestmentSignalsDo13FFilingsReveal? #
$ANT USDT is holding green territory with a +0.28% gain. Buyers are stepping in, and the next move could bring fresh momentum.
#NvidiaEarningsTonight:AIStocks’NextMove? #NvidiaBoardNotConsideringHuang’sReturnasCEO #KOSPIFalls2.59%ToLowestCloseSinceFebruary #WhatInvestmentSignalsDo13FFilingsReveal? #
#NvidiaEarningsTonight:AIStocks’NextMove? #NvidiaBoardNotConsideringHuang’sReturnasCEO #KOSPIFalls2.59%ToLowestCloseSinceFebruary #WhatInvestmentSignalsDo13FFilingsReveal? #
1
128
Log in to explore more content
Join global crypto users on Binance Square
⚡️ Get latest and useful information about crypto.
💬 Trusted by the world’s largest crypto exchange.
👍 Discover real insights from verified creators.
Email / Phone number
Trending Topics
1
#NvidiaEarningsTonight:AIStocks’NextMove?
28,455 views
495 Discussing
2
#A Packed Week of Earnings and Data Tests Markets
109,687 views
565 Discussing
3
#AnthropicIPOTestsInvestorAppetiteForAI
230,559 views
2,289 Discussing
4
#NvidiaBoardNotConsideringHuang’sReturnasCEO
53,543 views
588 Discussing
5
#KOSPIFalls2.59%ToLowestCloseSinceFebruary
544 views
33 Discussing
6
#AnthropicClearedToListOnNasdaqAsANT
1,869 views
61 Discussing
7
#WhatInvestmentSignalsDo13FFilingsReveal?
30,699 views
446 Discussing
8
#EvernorthRecords$505MImpairmentOnPreListingXRP
708 views
14 Discussing
9
#GoldmanSachsReports$1.22BInEtherETFHoldings
551 views
8 Discussing
10
#GoldmanSachsAndMillenniumEachHeldOver$1.2BInBitcoinETFs
4,936 views
13 Discussing