

DOODHI
88 Жариялаулар

DOODHI
Хабарлау
Пайдаланушыны блоктау
chart analysis and breakout expert spot trading and future trading
Ашық сауда
Жиі сауда жасайтын трейдер
4.9 жыл
49 Жазылым
38 Жазылушылар
59 лайк басылған
Жазбалар
Портфолио
Барлығы
Баға ұсыныстары
Тікелей эфир
·
--
Мақала
$STX USDT 8H chart analysisSTXUSDT 8H chart analysis
Short-term bullish recovery Major resistance overhead
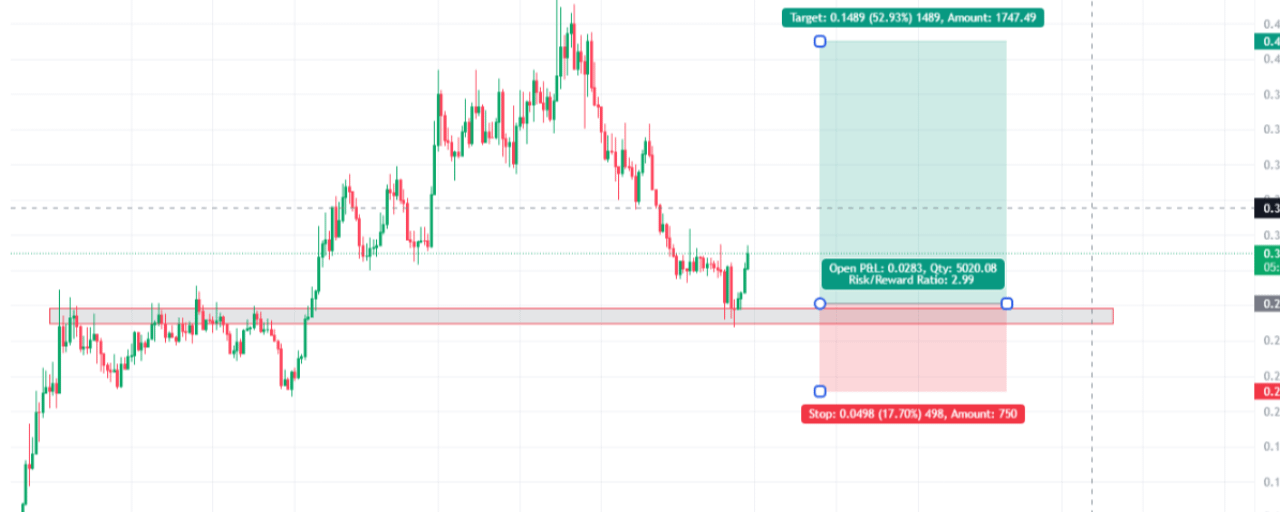
Based on your TradingView screenshot, STX is showing a potential bullish reversal from an important support zone. However, confirmation is still needed.
1. Market structure
Previous trend: Strong bullish rally from approximately $0.13 to $0.45.After the top: Clear bearish structure with lower highs and lower lows.Current situation: Price has reached the previous accumulation/support zone around $0.26–$0.27 and bounced.Current price: Approximately $0.3097.
The recent bounce is encouraging, but the 8H trend has not yet fully reversed.
2. Important price levels
Level
Price
Significance
Major resistance
$0.33–0.34
Breakout confirmation
Resistance 2
$0.36–0.37
Previous supply
Major target
$0.42–0.43
Your chart target
Current price
$0.3097
Current trading area
Support 1
$0.28–0.29
Short-term support
Strong support
$0.26–0.27
Demand zone
Stop-loss area
$0.23
Trade invalidation
3. Analysis of your long position
Your TradingView long-position tool shows:
Entry: approximately $0.281Target: approximately $0.430Stop-loss: approximately $0.231Risk/reward: 1:2.99Potential upside: 52.93%Potential downside: 17.70%
Risk/reward is attractive
Your entry is strategically positioned near the historical demand zone.
However, the main concern is that price is still below the $0.33–$0.34 resistance.
4. What I expect next
Scenario A — Bullish continuation
Preferred confirmation
Price holds above $0.28–$0.29.An 8H candle closes above $0.33–$0.34.Price retests that level successfully.Potential upside targets: $0.36, $0.39 and $0.42–$0.43.Scenario B — Bearish rejectionRisk scenarioPrice gets rejected around $0.33.Falls below $0.28.Retests $0.26–$0.27.Losing that demand zone could expose lower prices.
5. My trading opinion
I like the location of your entry because it is close to historical support. But I would not consider the bullish reversal confirmed yet.
My preferred confirmation would be an 8H candle close above $0.33–$0.34, followed by a successful retest.
One important point: Your stop at $0.231 is below the support zone, which gives the trade room to fluctuate, but the position size should be calculated according to your maximum acceptable account loss.
One question
Are you already holding this STX long position, or are you planning to enter around $0.28?
That changes whether I would focus on managing the existing trade or finding a better entry.
$BTC
$STX
{spot}(STXUSDT)
#STX #STX/USDT #STXBTC #BinanceReports80%Recoveryof$6.3BillioninLossesfromHackIncident
$STX USDT 8H chart analysis
STXUSDT 8H chart analysis
Short-term bullish recovery Major resistance overhead
Based on your TradingView screenshot, STX is showing a potential bullish reversal from an important support zone. However, confirmation is still needed.
1. Market structure
Previous trend: Strong bullish rally from approximately $0.13 to $0.45.After the top: Clear bearish structure with lower highs and lower lows.Current situation: Price has reached the previous accumulation/support zone around $0.26–$0.27 and bounced.Current price: Approximately $0.3097.
The recent bounce is encouraging, but the 8H trend has not yet fully reversed.
2. Important price levels
Level
Price
Significance
Major resistance
$0.33–0.34
Breakout confirmation
Resistance 2
$0.36–0.37
Previous supply
Major target
$0.42–0.43
Your chart target
Current price
$0.3097
Current trading area
Support 1
$0.28–0.29
Short-term support
Strong support
$0.26–0.27
Demand zone
Stop-loss area
$0.23
Trade invalidation
3. Analysis of your long position
Your TradingView long-position tool shows:
Entry: approximately $0.281Target: approximately $0.430Stop-loss: approximately $0.231Risk/reward: 1:2.99Potential upside: 52.93%Potential downside: 17.70%
Risk/reward is attractive
Your entry is strategically positioned near the historical demand zone.
However, the main concern is that price is still below the $0.33–$0.34 resistance.
4. What I expect next
Scenario A — Bullish continuation
Preferred confirmation
Price holds above $0.28–$0.29.An 8H candle closes above $0.33–$0.34.Price retests that level successfully.Potential upside targets: $0.36, $0.39 and $0.42–$0.43.Scenario B — Bearish rejectionRisk scenarioPrice gets rejected around $0.33.Falls below $0.28.Retests $0.26–$0.27.Losing that demand zone could expose lower prices.
5. My trading opinion
I like the location of your entry because it is close to historical support. But I would not consider the bullish reversal confirmed yet.
My preferred confirmation would be an 8H candle close above $0.33–$0.34, followed by a successful retest.
One important point: Your stop at $0.231 is below the support zone, which gives the trade room to fluctuate, but the position size should be calculated according to your maximum acceptable account loss.
One question
Are you already holding this STX long position, or are you planning to enter around $0.28?
That changes whether I would focus on managing the existing trade or finding a better entry.
$BTC
$STX
#STX #STX/USDT #STXBTC #BinanceReports80%Recoveryof$6.3BillioninLossesfromHackIncident
115
·
--
Төмен (кемімелі)
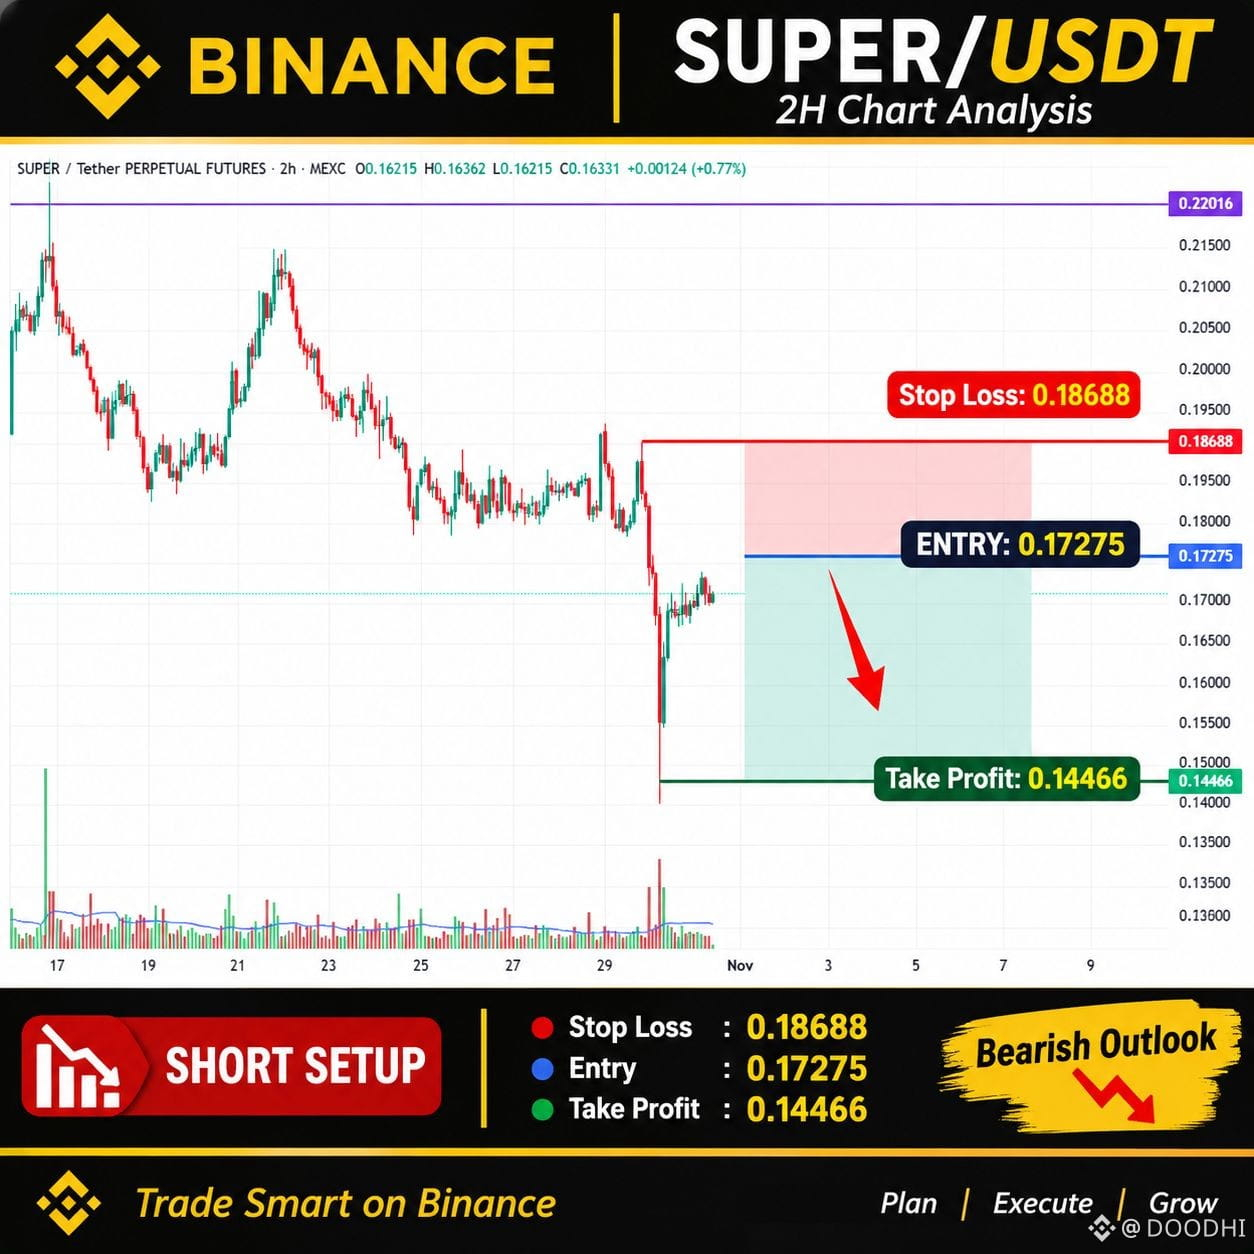
📉 SUPER/USDT – Bearish Setup | 2H Chart Analysis
SUPER/USDT is showing strong bearish momentum on the 2-hour chart after a sharp decline from the 0.1800–0.1900 resistance area.
The price is currently trading around 0.16331 USDT. A potential short setup is being considered, with a risk/reward ratio of approximately 1:2.
🔑 Trade Setup – SHORT
🔵 Entry: 0.17275 USDT
🔴 Stop Loss: 0.18688 USDT
🟢 Take Profit: 0.14466 USDT
📊 Risk/Reward Ratio: 1:1.99
Technical Analysis:
SUPER has experienced a significant sell-off, followed by a small recovery. The current price is below the planned entry level, making a potential pullback toward 0.17275 an area to watch for a short opportunity.
Bearish Scenario:
If the price reaches the entry zone and shows rejection, sellers may push it toward the 0.15500 support area and potentially the 0.14466 target.
Invalidation:
A move above 0.18688 would invalidate this short setup. A strong recovery above the 0.1800–0.1869 area could weaken the bearish outlook.
⚠️ Risk Management:
Wait for confirmation before entering. Do not risk more than you can afford to lose, and always use a stop loss.
$BTC
{future}(SUPERUSDT)
$SUPER
#SuperVerse
#SUPER/USDT
#SUPER
#BinanceReports80%Recoveryof$6.3BillioninLossesfromHackIncident #TRMCambodianCasinosReceived$1.07BInCrypto
📉 SUPER/USDT – Bearish Setup | 2H Chart Analysis
SUPER/USDT is showing strong bearish momentum on the 2-hour chart after a sharp decline from the 0.1800–0.1900 resistance area.
The price is currently trading around 0.16331 USDT. A potential short setup is being considered, with a risk/reward ratio of approximately 1:2.
🔑 Trade Setup – SHORT
🔵 Entry: 0.17275 USDT
🔴 Stop Loss: 0.18688 USDT
🟢 Take Profit: 0.14466 USDT
📊 Risk/Reward Ratio: 1:1.99
Technical Analysis:
SUPER has experienced a significant sell-off, followed by a small recovery. The current price is below the planned entry level, making a potential pullback toward 0.17275 an area to watch for a short opportunity.
Bearish Scenario:
If the price reaches the entry zone and shows rejection, sellers may push it toward the 0.15500 support area and potentially the 0.14466 target.
Invalidation:
A move above 0.18688 would invalidate this short setup. A strong recovery above the 0.1800–0.1869 area could weaken the bearish outlook.
⚠️ Risk Management:
Wait for confirmation before entering. Do not risk more than you can afford to lose, and always use a stop loss.
$BTC
$SUPER
#SuperVerse
#SUPER/USDT
#SUPER
#BinanceReports80%Recoveryof$6.3BillioninLossesfromHackIncident #TRMCambodianCasinosReceived$1.07BInCrypto
59
·
--
Төмен (кемімелі)
$BIRB
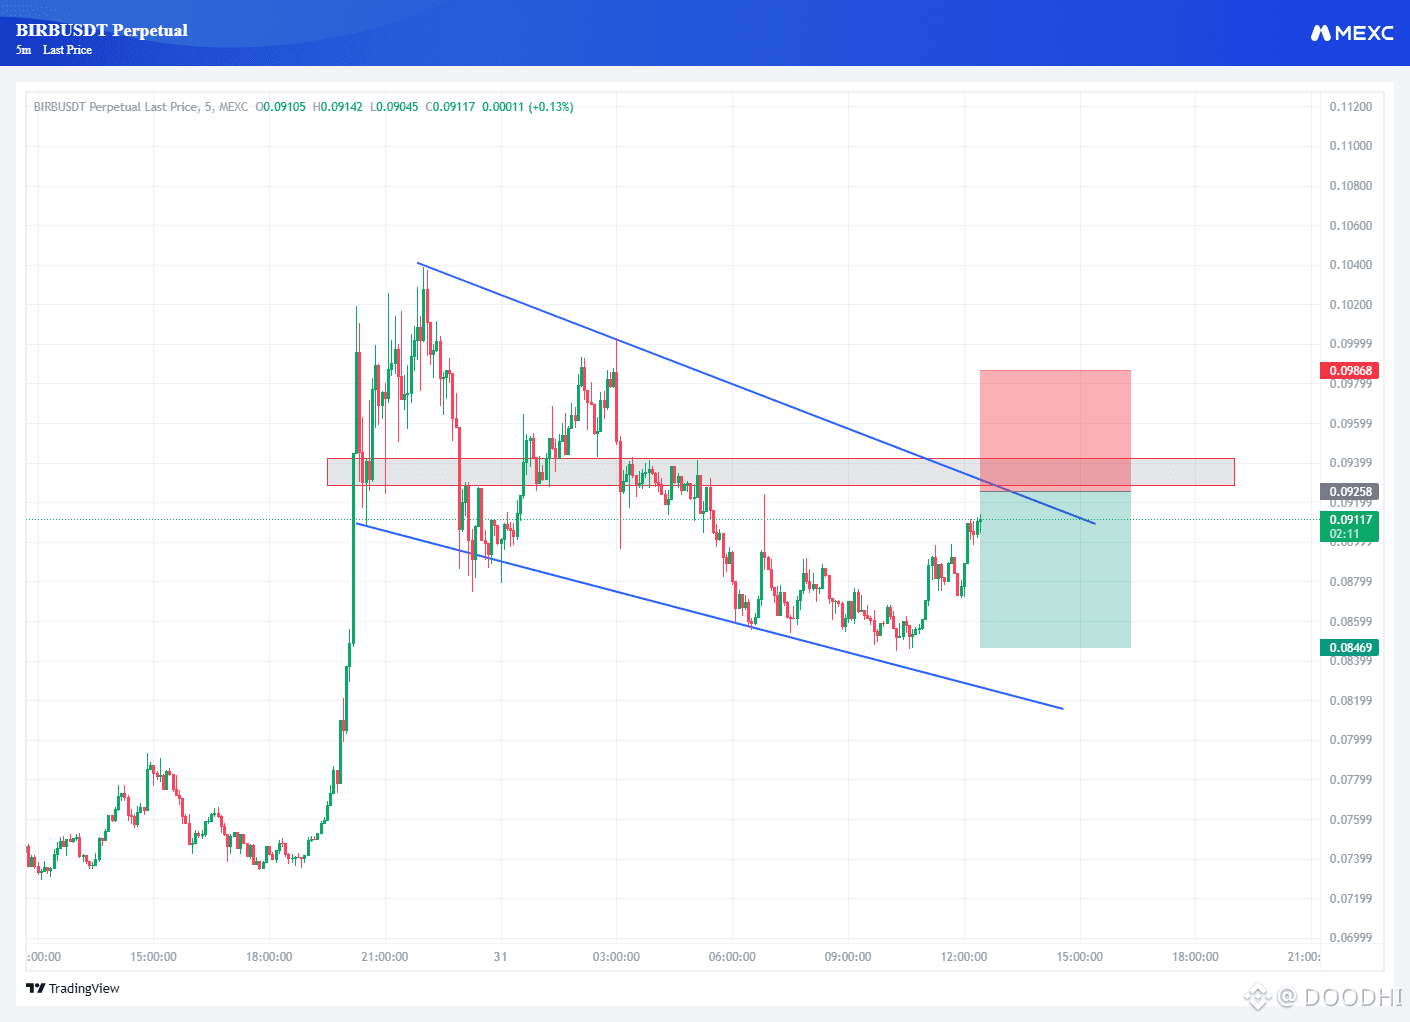
📉 BIRBUSDT – SHORT SETUP
🔴 Entry: 0.09258 USDT
🎯 Take Profit (TP): 0.08469 USDT
🛑 Stop Loss (SL): 0.09868 USDT
📊 Risk/Reward Ratio: 1:1.29
Trade Direction: SHORT
Wait for confirmation at the resistance zone before entering.
$BTC
$BIRB
{future}(BIRBUSDT)
#BIRB #BIRBUSDT #SuspectedNorthKoreaAttacksAccountForNearly89%OfCryptoHackLosses
$BIRB
📉 BIRBUSDT – SHORT SETUP
🔴 Entry: 0.09258 USDT
🎯 Take Profit (TP): 0.08469 USDT
🛑 Stop Loss (SL): 0.09868 USDT
📊 Risk/Reward Ratio: 1:1.29
Trade Direction: SHORT
Wait for confirmation at the resistance zone before entering.
$BTC
$BIRB
#BIRB #BIRBUSDT #SuspectedNorthKoreaAttacksAccountForNearly89%OfCryptoHackLosses
1
267
·
--
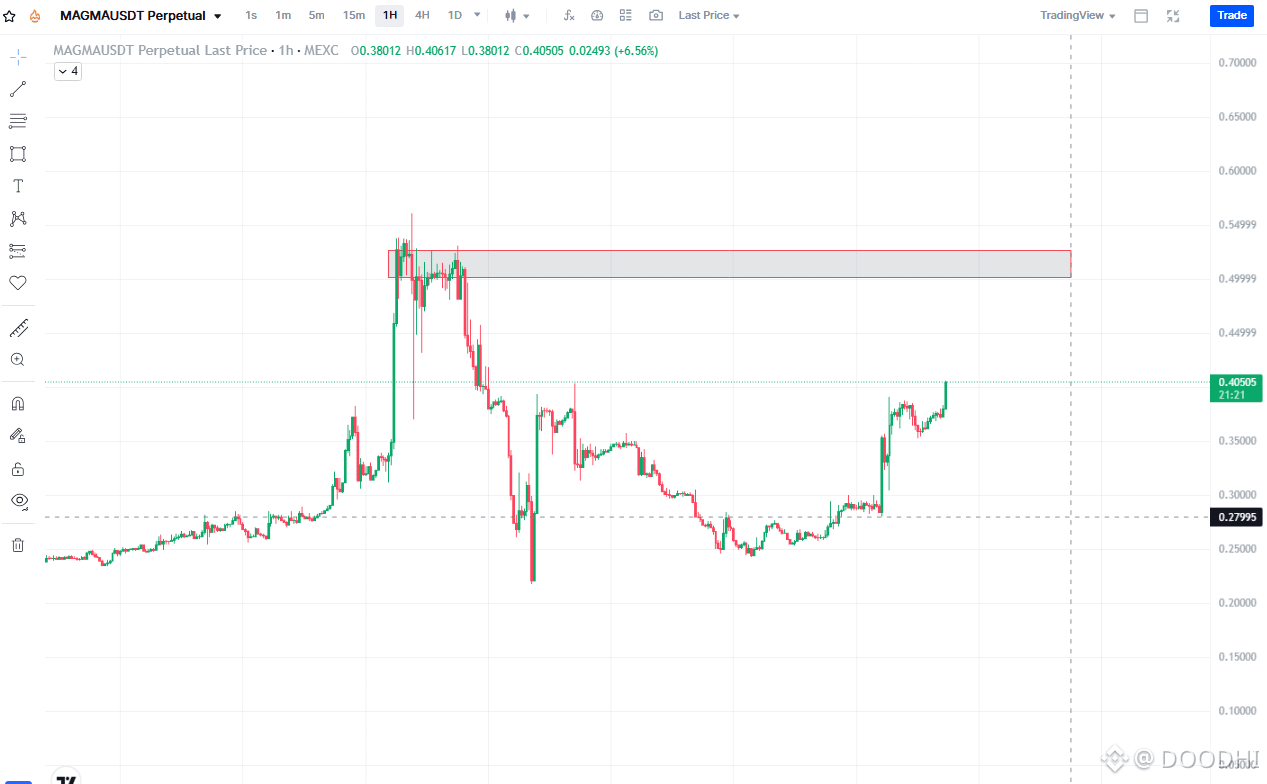
🚀 MAGMAUSDT – Bullish Momentum | 1H Chart Analysis
MAGMAUSDT is showing strong bullish momentum on the 1-hour chart, with price currently trading around 0.40505 USDT.
📊 Technical Analysis:
Price has recovered significantly from the 0.25–0.28 support area and is now approaching an important resistance zone. Buyers are showing strength, but confirmation is needed before expecting a major breakout.
🔑 Key Levels to Watch:
🟢 Current Price: 0.40505 USDT
🎯 Target 1: 0.4500 USDT
🎯 Target 2: 0.5000 USDT
🔴 Major Resistance Zone: 0.4990–0.5500 USDT
⚠️ Important Support: 0.3500 USDT
Bullish Scenario:
If MAGMAUSDT maintains its momentum and breaks above 0.4500, the next potential move could be toward 0.5000. A strong breakout above the resistance zone may open the door for further upside.
Bearish Scenario:
If price faces rejection and falls below 0.3500, bullish momentum could weaken, increasing the possibility of a deeper correction.
📌 My View: MAGMAUSDT is showing an interesting recovery, but the upcoming resistance zone will be crucial. Always wait for confirmation and manage your risk carefully.
💬 What do you think? Will MAGMAUSDT break above 0.5000, or will sellers take control?
DYOR – This is a technical analysis, not financial advice. Always trade with proper risk management.
$MAGMA
{future}(MAGMAUSDT)
#BinanceReports80%Recoveryof$6.3BillioninLossesfromHackIncident #TRMCambodianCasinosReceived$1.07BInCrypto #IolePlansToSellAll151.21Bitcoin #SuspectedNorthKoreaAttacksAccountForNearly89%OfCryptoHackLosses #MAGMAUSTD
🚀 MAGMAUSDT – Bullish Momentum | 1H Chart Analysis
MAGMAUSDT is showing strong bullish momentum on the 1-hour chart, with price currently trading around 0.40505 USDT.
📊 Technical Analysis:
Price has recovered significantly from the 0.25–0.28 support area and is now approaching an important resistance zone. Buyers are showing strength, but confirmation is needed before expecting a major breakout.
🔑 Key Levels to Watch:
🟢 Current Price: 0.40505 USDT
🎯 Target 1: 0.4500 USDT
🎯 Target 2: 0.5000 USDT
🔴 Major Resistance Zone: 0.4990–0.5500 USDT
⚠️ Important Support: 0.3500 USDT
Bullish Scenario:
If MAGMAUSDT maintains its momentum and breaks above 0.4500, the next potential move could be toward 0.5000. A strong breakout above the resistance zone may open the door for further upside.
Bearish Scenario:
If price faces rejection and falls below 0.3500, bullish momentum could weaken, increasing the possibility of a deeper correction.
📌 My View: MAGMAUSDT is showing an interesting recovery, but the upcoming resistance zone will be crucial. Always wait for confirmation and manage your risk carefully.
💬 What do you think? Will MAGMAUSDT break above 0.5000, or will sellers take control?
DYOR – This is a technical analysis, not financial advice. Always trade with proper risk management.
$MAGMA
#BinanceReports80%Recoveryof$6.3BillioninLossesfromHackIncident #TRMCambodianCasinosReceived$1.07BInCrypto #IolePlansToSellAll151.21Bitcoin #SuspectedNorthKoreaAttacksAccountForNearly89%OfCryptoHackLosses #MAGMAUSTD
1
1
204
·
--
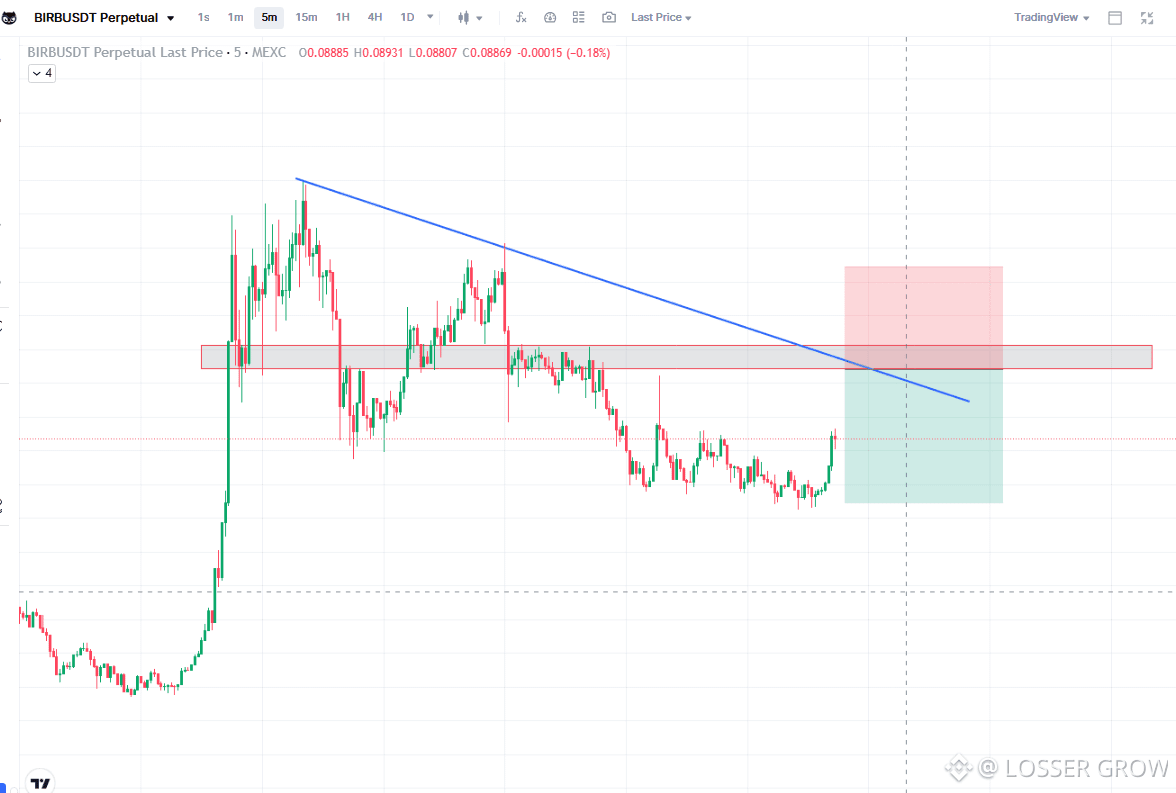
$BIRB
short sclaping
entry 0.0925
entry 0.0940
tp 0.0885
tp 0.0855
sl 0.0980
$BTC
$BIRB
{future}(BIRBUSDT)
#BinanceReports80%Recoveryof$6.3BillioninLossesfromHackIncident #BIRB #TRMCambodianCasinosReceived$1.07BInCrypto #IolePlansToSellAll151.21Bitcoin #SuspectedNorthKoreaAttacksAccountForNearly89%OfCryptoHackLosses
$BIRB
short sclaping
entry 0.0925
entry 0.0940
tp 0.0885
tp 0.0855
sl 0.0980
$BTC
$BIRB
#BinanceReports80%Recoveryof$6.3BillioninLossesfromHackIncident #BIRB #TRMCambodianCasinosReceived$1.07BInCrypto #IolePlansToSellAll151.21Bitcoin #SuspectedNorthKoreaAttacksAccountForNearly89%OfCryptoHackLosses
short sclaping
entry 0.0925
entry 0.0940
tp 0.0885
tp 0.0855
sl 0.0980
$BTC
$BIRB
#BinanceReports80%Recoveryof$6.3BillioninLossesfromHackIncident #BIRB #TRMCambodianCasinosReceived$1.07BInCrypto #IolePlansToSellAll151.21Bitcoin #SuspectedNorthKoreaAttacksAccountForNearly89%OfCryptoHackLosses
3
334
·
--
Жоғары (өспелі)
$IDOL
Long scalping
ENTRY 0.024
ENTRY 0.0235
TP 0.0255
TP 0.0265
SL 0.022
$BTC $IDOL
#ASICHasReceivedNoPredictionMarketApplications #IDOL #HKDollarStablecoinHKDAPToLaunchOnSolana
$IDOL
Long scalping
ENTRY 0.024
ENTRY 0.0235
TP 0.0255
TP 0.0265
SL 0.022
$BTC $IDOL
#ASICHasReceivedNoPredictionMarketApplications #IDOL #HKDollarStablecoinHKDAPToLaunchOnSolana
Long scalping
ENTRY 0.024
ENTRY 0.0235
TP 0.0255
TP 0.0265
SL 0.022
$BTC $IDOL
#ASICHasReceivedNoPredictionMarketApplications #IDOL #HKDollarStablecoinHKDAPToLaunchOnSolana
1
131
·
--
Төмен (кемімелі)
$AIN
Short scalping
ENTRY 0.285
ENTRY 0.293
TP 0.280
TP 0.270
TP 0.260
TP 0.250
SL 0.315$
$BTC $AIN
{future}(AINUSDT)
#AIN #AiNarratives #IolePlansToSellAll151.21Bitcoin
$AIN
Short scalping
ENTRY 0.285
ENTRY 0.293
TP 0.280
TP 0.270
TP 0.260
TP 0.250
SL 0.315$
$BTC $AIN
#AIN #AiNarratives #IolePlansToSellAll151.21Bitcoin
Short scalping
ENTRY 0.285
ENTRY 0.293
TP 0.280
TP 0.270
TP 0.260
TP 0.250
SL 0.315$
$BTC $AIN
#AIN #AiNarratives #IolePlansToSellAll151.21Bitcoin
1
366
·
--
Төмен (кемімелі)
$IDOL
Short here
entry 0.0253
TP 0.024
0.0235
SL 0.026$
#IolePlansToSellAll151.21Bitcoin #ASICHasReceivedNoPredictionMarketApplications #IDOL
$IDOL
Short here
entry 0.0253
TP 0.024
0.0235
SL 0.026$
#IolePlansToSellAll151.21Bitcoin #ASICHasReceivedNoPredictionMarketApplications #IDOL
Short here
entry 0.0253
TP 0.024
0.0235
SL 0.026$
#IolePlansToSellAll151.21Bitcoin #ASICHasReceivedNoPredictionMarketApplications #IDOL
5
2
204
·
--
Жоғары (өспелі)
BNB chain most undervalued meme token under 1M market cap BUILDER you're missing $BTC $ETH #memecoin🚀🚀🚀 #meme板块关注热点 #meme2027
BNB chain most undervalued meme token under 1M market cap BUILDER you're missing $BTC $ETH #memecoin🚀🚀🚀 #meme板块关注热点 #meme2027
20
·
--
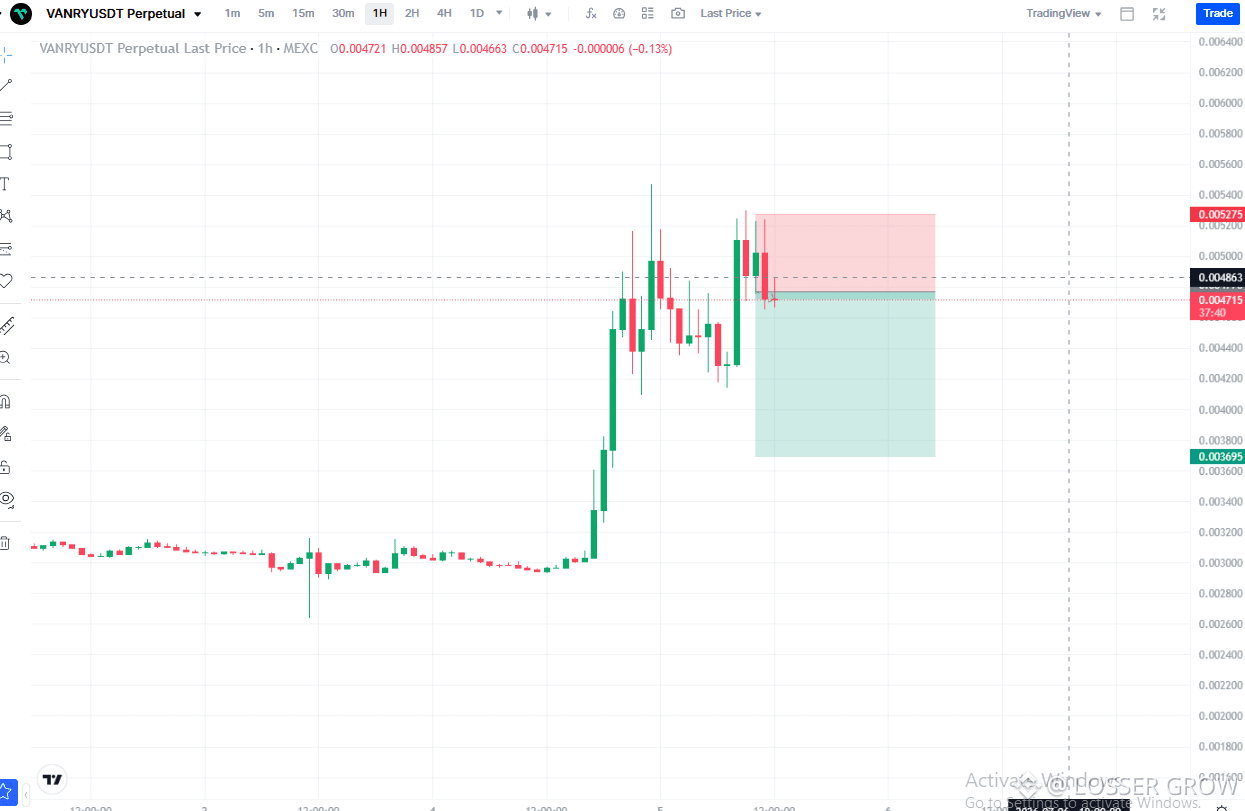
VANRYUSDT 1H chart:
$VANRY Update 📉
Price is testing a key resistance zone around 0.0048–0.0050 after a strong impulsive rally.
🔹 Rejection from resistance could trigger a pullback toward 0.0037–0.0038.
🔹 As long as price stays below 0.0050, sellers have the short-term advantage.
🔹 A clean breakout and close above 0.0050 would invalidate the bearish setup and could open the door for another leg higher.
Trade Idea:
✅ Short below resistance
🎯 Target: 0.0037
❌ Stop Loss: Above 0.00525
Patience is key—let the market confirm the move before entering.
#VANRY #Crypto #Altcoins #Trading #TechnicalAnalysis #MEXC #CryptoTrading
Or, if you want a shorter, more engaging version:
$VANRY looks interesting here. 👀
Rejected near 0.0050 after a massive pump.
📍 Resistance: 0.0049–0.0050
🎯 Bearish target: 0.0037
🛑 Invalidation: Above 0.00525
If buyers fail to reclaim resistance, this could be a solid short setup.
Always wait for confirmation. 📊
$VANRY $BTC
{future}(VANRYUSDT)
#VANRY #crypto #Trading #Altcoins
VANRYUSDT 1H chart:
$VANRY Update 📉
Price is testing a key resistance zone around 0.0048–0.0050 after a strong impulsive rally.
🔹 Rejection from resistance could trigger a pullback toward 0.0037–0.0038.
🔹 As long as price stays below 0.0050, sellers have the short-term advantage.
🔹 A clean breakout and close above 0.0050 would invalidate the bearish setup and could open the door for another leg higher.
Trade Idea:
✅ Short below resistance
🎯 Target: 0.0037
❌ Stop Loss: Above 0.00525
Patience is key—let the market confirm the move before entering.
#VANRY #Crypto #Altcoins #Trading #TechnicalAnalysis #MEXC #CryptoTrading
Or, if you want a shorter, more engaging version:
$VANRY looks interesting here. 👀
Rejected near 0.0050 after a massive pump.
📍 Resistance: 0.0049–0.0050
🎯 Bearish target: 0.0037
🛑 Invalidation: Above 0.00525
If buyers fail to reclaim resistance, this could be a solid short setup.
Always wait for confirmation. 📊
$VANRY $BTC
#VANRY #crypto #Trading #Altcoins
122
·
--
Жоғары (өспелі)
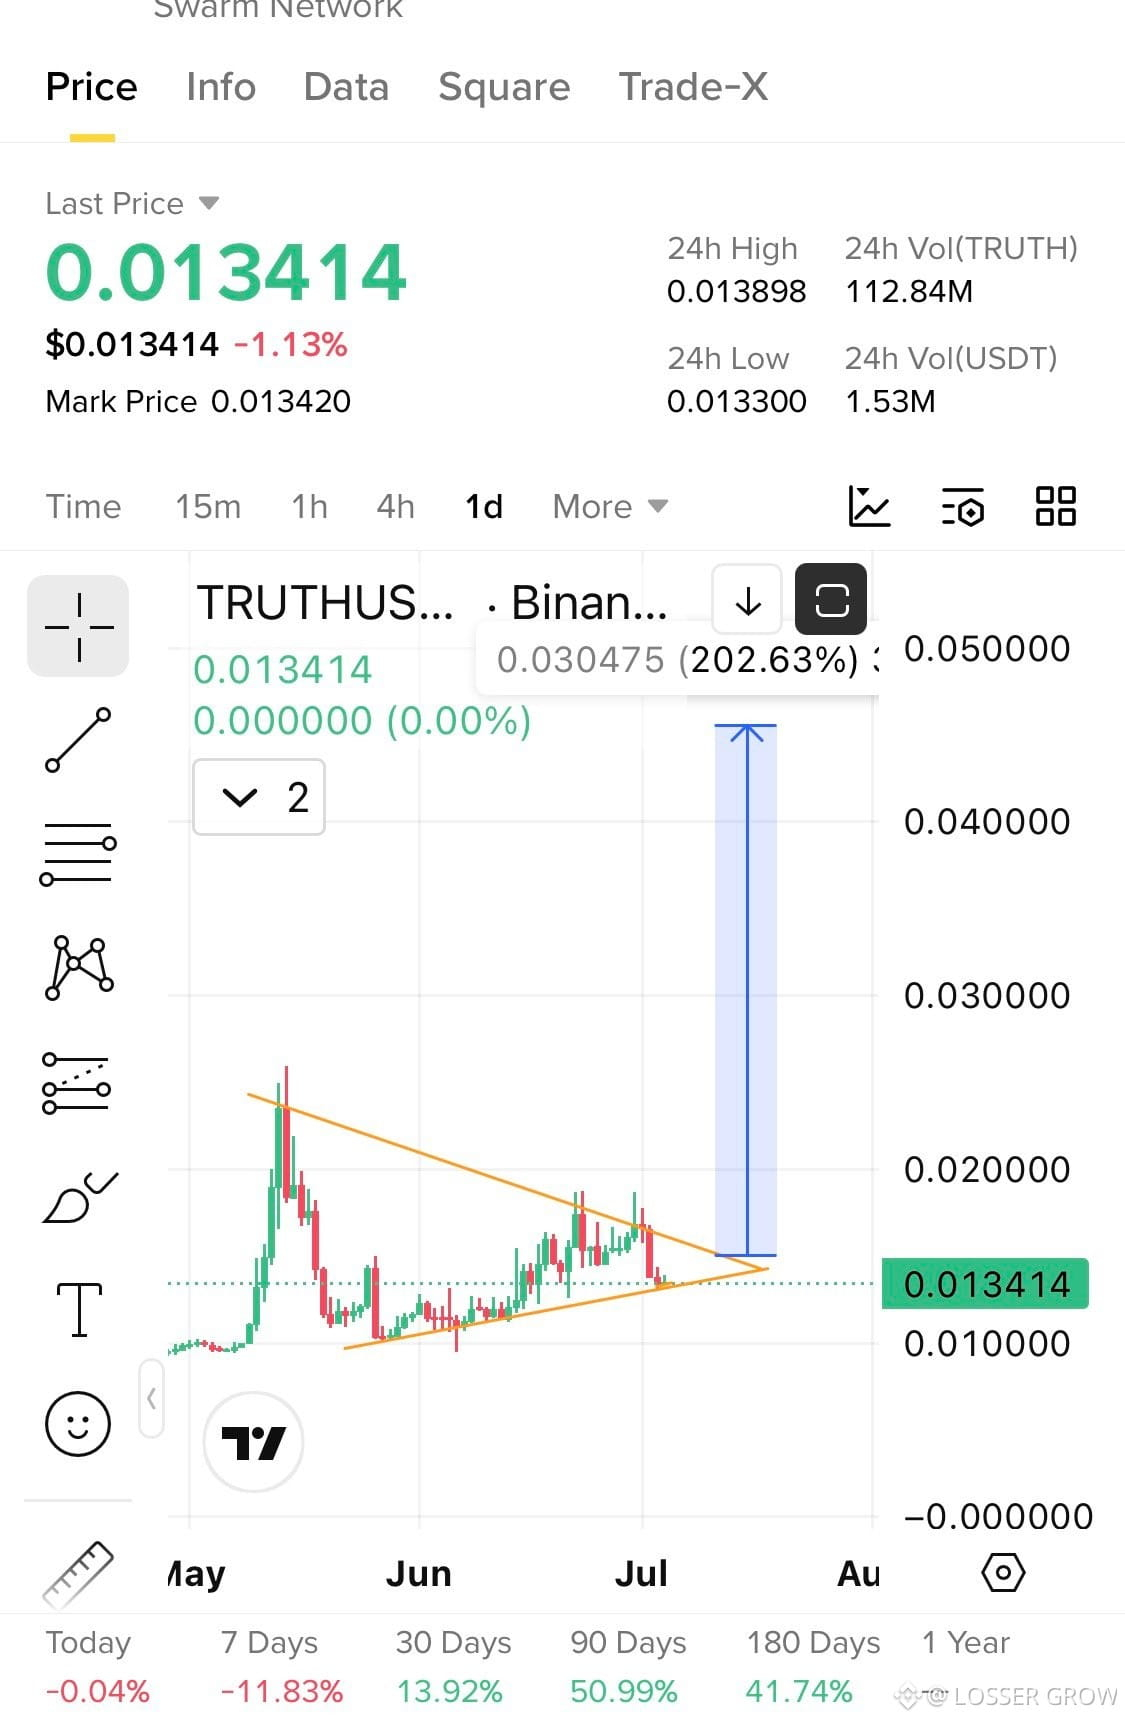
$TRUTH This month u will see this coin
Up more than 100%
Will come back to this tweet as i always do
$BTC
{future}(BTCUSDT)
$TRUTH
{future}(TRUTHUSDT)
#TruthSocial #BTC #VitalikOutlinesLeanEthereumRoadmap #BitcoinFallsOver50%FromOctoberHigh
$TRUTH This month u will see this coin
Up more than 100%
Will come back to this tweet as i always do
$BTC
$TRUTH
#TruthSocial #BTC #VitalikOutlinesLeanEthereumRoadmap #BitcoinFallsOver50%FromOctoberHigh
Up more than 100%
Will come back to this tweet as i always do
$BTC
$TRUTH
#TruthSocial #BTC #VitalikOutlinesLeanEthereumRoadmap #BitcoinFallsOver50%FromOctoberHigh
72

·
--
Жоғары (өспелі)
$EVAA
I think 🤔 50$ this month easy expert please 🥺 guide me #BinanceHODLerBREV #ETHWhaleWatch #BTCVSGOLD
$EVAA
I think 🤔 50$ this month easy expert please 🥺 guide me #BinanceHODLerBREV #ETHWhaleWatch #BTCVSGOLD
I think 🤔 50$ this month easy expert please 🥺 guide me #BinanceHODLerBREV #ETHWhaleWatch #BTCVSGOLD

4
397
·
--
💎Discover $B25M26 - Our Hidden Gem 🔍✨ x1000 Potential! 💰
Aped so hard into $B25M26, even my Ledger got nervous 👈
$B25M26 is going to MOON 🚀🚀🚀!
🔥 The goal is simple just HODL for $B25M26
Take advantage of this opportunity, And we're good 🔥
Prepare your bag from now
✅ BUY RIGHT NOW
✅ X : @B25M26
$BTC $EVAA
{future}(EVAAUSDT)
#BTC90kChristmas #StrategyBTCPurchase #WriteToEarnUpgrade #CPIWatch
💎Discover $B25M26 - Our Hidden Gem 🔍✨ x1000 Potential! 💰
Aped so hard into $B25M26, even my Ledger got nervous 👈
$B25M26 is going to MOON 🚀🚀🚀!
🔥 The goal is simple just HODL for $B25M26
Take advantage of this opportunity, And we're good 🔥
Prepare your bag from now
✅ BUY RIGHT NOW
✅ X : @B25M26
$BTC $EVAA
#BTC90kChristmas #StrategyBTCPurchase #WriteToEarnUpgrade #CPIWatch

23
Көбірек контент көру үшін кіріңіз
Binance Square платформасында әлемдік криптоқоғамдастыққа қосылыңыз
⚡️ Криптовалюта туралы ең соңғы және пайдалы ақпаратты алыңыз.
💬 Әлемдегі ең ірі криптобиржаның сеніміне ие.
👍 Расталған авторлардың нақты пікірлерін табыңыз.
Электрондық пошта/телефон нөмірі
Трендтегі тақырыптар
BinanceSAFUFundTransferCompleted7499BTC
13,212 рет көрілді
410 адам талқылап жатыр
BREAKING: Binance Recovers 90% of $6.3B - My Take
Guys, biggest recovery in crypto history just happened.
Binance just confirmed in its 3rd security update on Oct 31:
90% of the stolen assets have been replenished - up from 80% yesterday.
What happened?
Total breach: ∼$6.3B on Oct 29 (hot wallets)Binance set aside $6.34B from company funds to cover itSources used: Corporate Treasury + SAFU Fund ($1B fund) + Futures Insurance FundResult: 10 major tokens now 100% backed: $BTC, $ETH, $USDT, $BNB, $SOL, $USDC, $XRP, $USD1, $RLUSD, $ZECRemaining 10% are less liquid tokens, will take more time to sourceWithdrawals expected to resume Nov 1
My analysis: This is why Binance is still #1. No other exchange could cover $6.3B from its own pocket in 2 days. This shows SAFU actually works.
Is this enough to bring back trust? Or you are still worried?
Drop your opinion below - I will read all comments.
Binance #SAFU #CryptoRecovery #BinanceSecurity #BTC#binancesafufundtransfercompleted7499btc
True News
·23 лайк
·10.7k рет көрілді
BinanceRecovery90% of stolen assets
58,107 рет көрілді
117 адам талқылап жатыр
YiHe:ProofOfReserves:10TokensAt100%Backing
88,074 рет көрілді
542 адам талқылап жатыр