
CRYPTOVISION _BNB
5.7k Жариялаулар

CRYPTOVISION _BNB
Хабарлау
Пайдаланушыны блоктау
Perspectivas del mercado. Configuraciones de trading. Oportunidades en criptomonedas.
Ашық сауда
Жиі сауда жасайтын трейдер
2.8 жыл
17 Жазылым
3.7K+ Жазылушылар
6.7K+ лайк басылған
Жазбалар
Портфолио
Барлығы
Баға ұсыныстары
PINNED
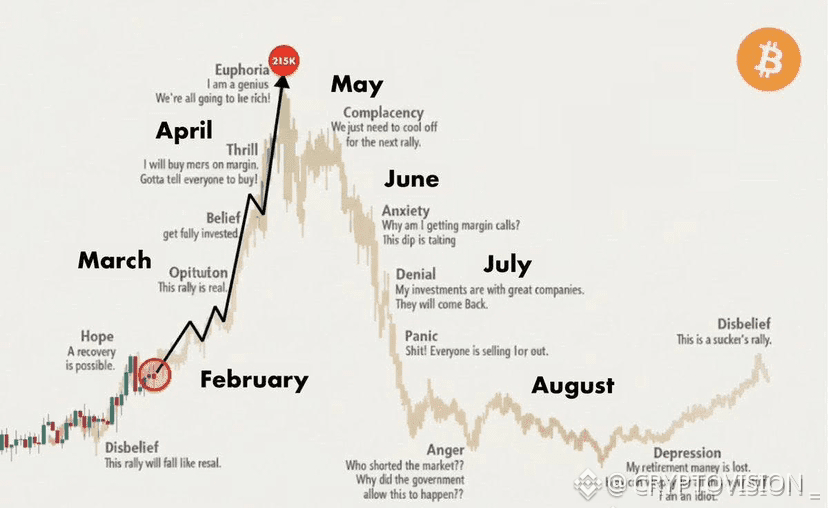
Predicciones sobre el Bull Run de $BTC en 2026: Una posible trayectoria🎢
- Febrero: Trampa para osos
- Marzo: Caída de oro/plata -> Bitcoin se dispara
- Abril: Temporada de Altcoins
- Mayo: Nuevo Máximo (ATH)
- Junio: Trampa para toros
- Julio: Liquidación masiva
- Agosto: Comienzo de mercado bajista
👉 Estas son predicciones especulativas y el mercado cambia rápido. ¿Estás de acuerdo con esta trayectoria? 😂
comercia aquí abajo ⬇️ con $BTC
{future}(BTCUSDT)
Predicciones sobre el Bull Run de $BTC en 2026: Una posible trayectoria🎢
- Febrero: Trampa para osos
- Marzo: Caída de oro/plata -> Bitcoin se dispara
- Abril: Temporada de Altcoins
- Mayo: Nuevo Máximo (ATH)
- Junio: Trampa para toros
- Julio: Liquidación masiva
- Agosto: Comienzo de mercado bajista
👉 Estas son predicciones especulativas y el mercado cambia rápido. ¿Estás de acuerdo con esta trayectoria? 😂
comercia aquí abajo ⬇️ con $BTC
- Febrero: Trampa para osos
- Marzo: Caída de oro/plata -> Bitcoin se dispara
- Abril: Temporada de Altcoins
- Mayo: Nuevo Máximo (ATH)
- Junio: Trampa para toros
- Julio: Liquidación masiva
- Agosto: Comienzo de mercado bajista
👉 Estas son predicciones especulativas y el mercado cambia rápido. ¿Estás de acuerdo con esta trayectoria? 😂
comercia aquí abajo ⬇️ con $BTC
4
1
12
20.5k
·
--
Төмен (кемімелі)
$BTC: $76K Was on the Radar. Is $68K the Next Test?
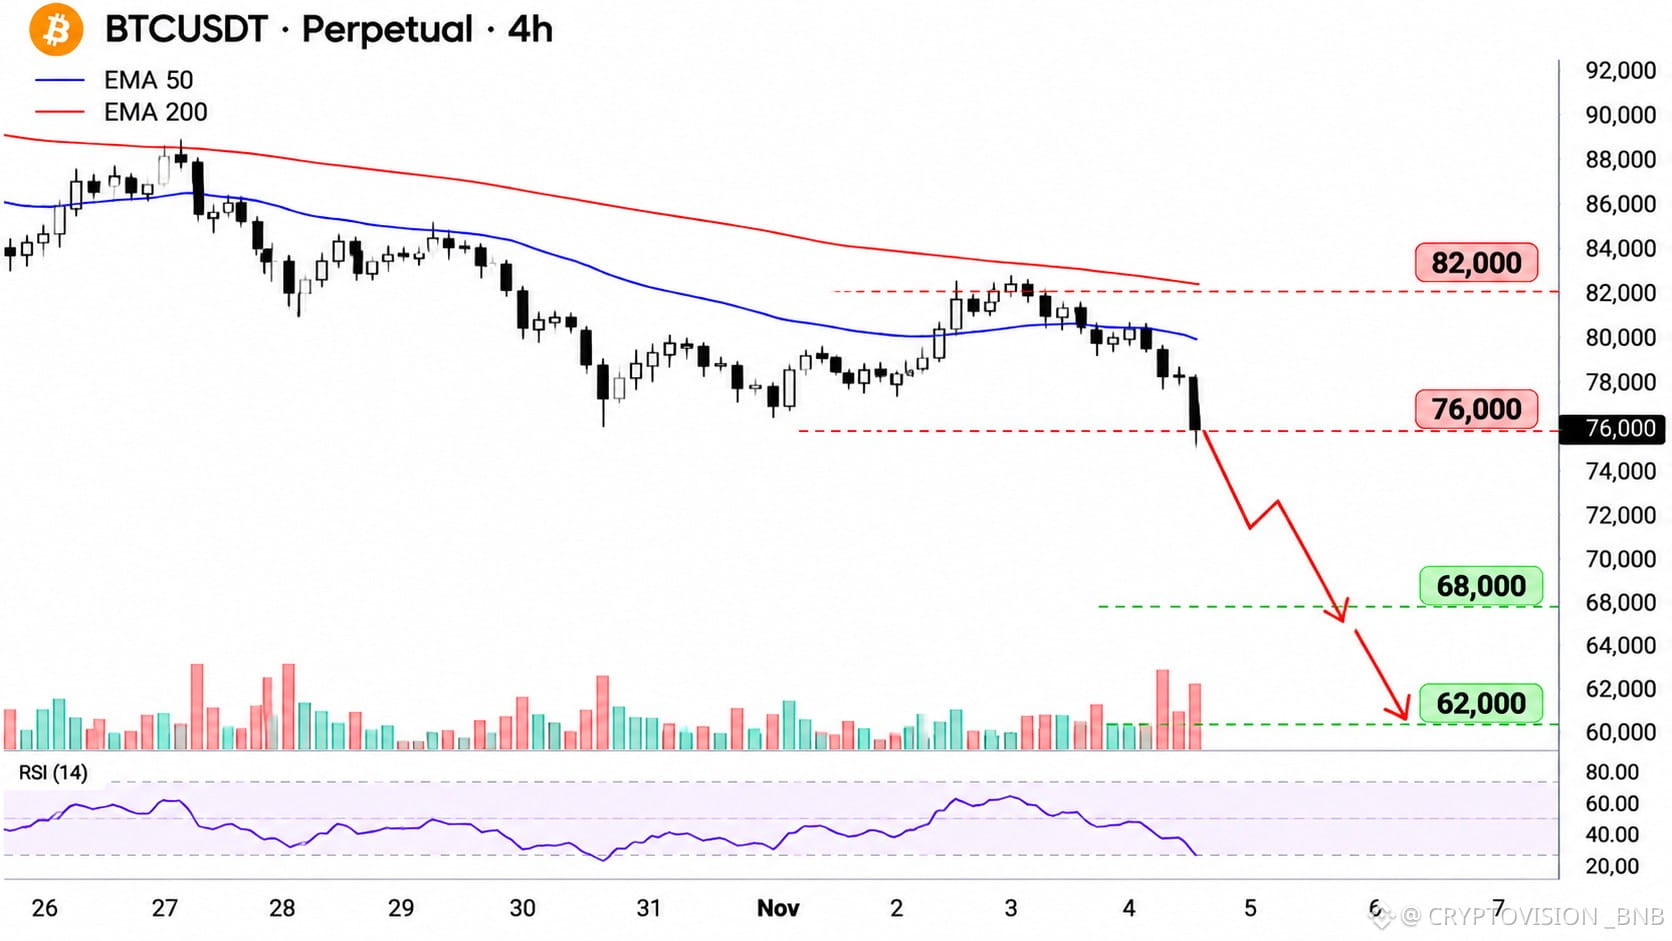
The bearish roadmap I've been following is simple:
$82K → $76K → $68K → $62K
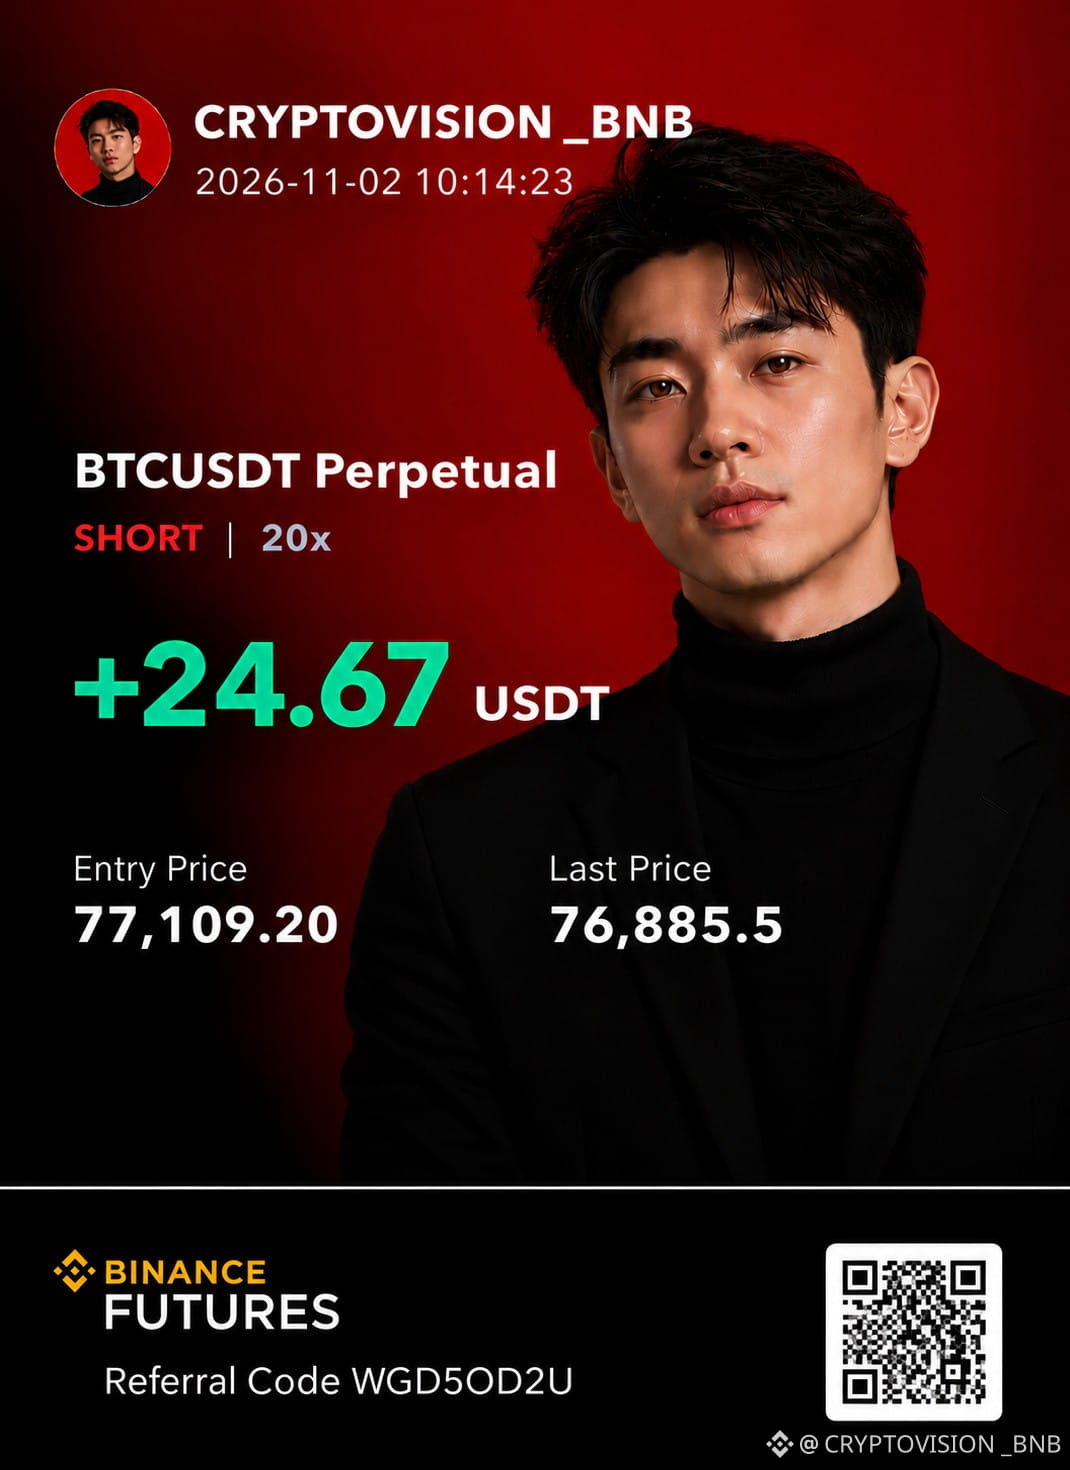
Bitcoin's reported move toward $76K puts the next support zone in focus, but reaching one level doesn't guarantee the rest of the scenario.
$68,000 is my next downside target. A decisive breakdown below $76K, followed by a failed recovery, would strengthen the bearish case.
Si los compradores recuperan los $76K con fuerza, podríamos ver un rebote antes de cualquier nueva caída.
And $62K? That remains an extended bearish scenario, not a confirmed destination.
I'm not interested in claiming victory before the market finishes moving. The next reaction around support matters more than any prediction.
Would you consider buying near $68K, or wait for a confirmed reversal?
$BTC
{spot}(BTCUSDT)
#bitcoin
$BTC : $76K Was on the Radar. Is $68K the Next Test?
The bearish roadmap I've been following is simple:
$82K → $76K → $68K → $62K
Bitcoin's reported move toward $76K puts the next support zone in focus, but reaching one level doesn't guarantee the rest of the scenario.
$68,000 is my next downside target. A decisive breakdown below $76K, followed by a failed recovery, would strengthen the bearish case.
Si los compradores recuperan los $76K con fuerza, podríamos ver un rebote antes de cualquier nueva caída.
And $62K? That remains an extended bearish scenario, not a confirmed destination.
I'm not interested in claiming victory before the market finishes moving. The next reaction around support matters more than any prediction.
Would you consider buying near $68K, or wait for a confirmed reversal?
$BTC
#bitcoin
The bearish roadmap I've been following is simple:
$82K → $76K → $68K → $62K
Bitcoin's reported move toward $76K puts the next support zone in focus, but reaching one level doesn't guarantee the rest of the scenario.
$68,000 is my next downside target. A decisive breakdown below $76K, followed by a failed recovery, would strengthen the bearish case.
Si los compradores recuperan los $76K con fuerza, podríamos ver un rebote antes de cualquier nueva caída.
And $62K? That remains an extended bearish scenario, not a confirmed destination.
I'm not interested in claiming victory before the market finishes moving. The next reaction around support matters more than any prediction.
Would you consider buying near $68K, or wait for a confirmed reversal?
$BTC
#bitcoin
1
87
·
--
Төмен (кемімелі)
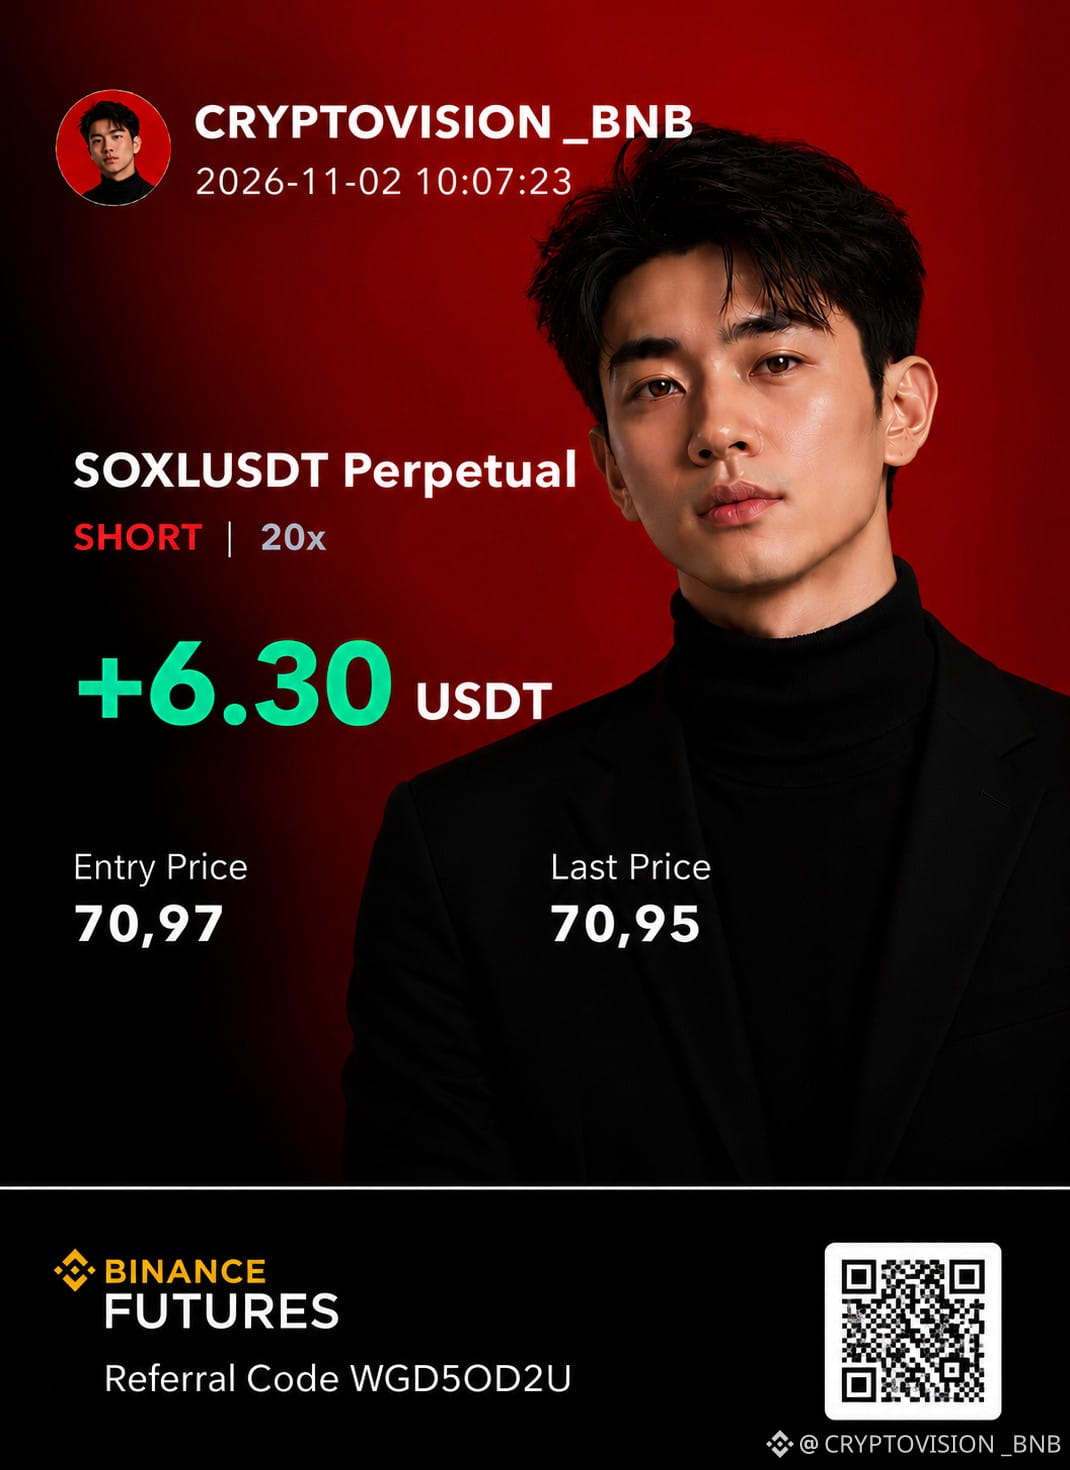
$SOXL : Another Short Opportunity? $60 Is Back on My Radar
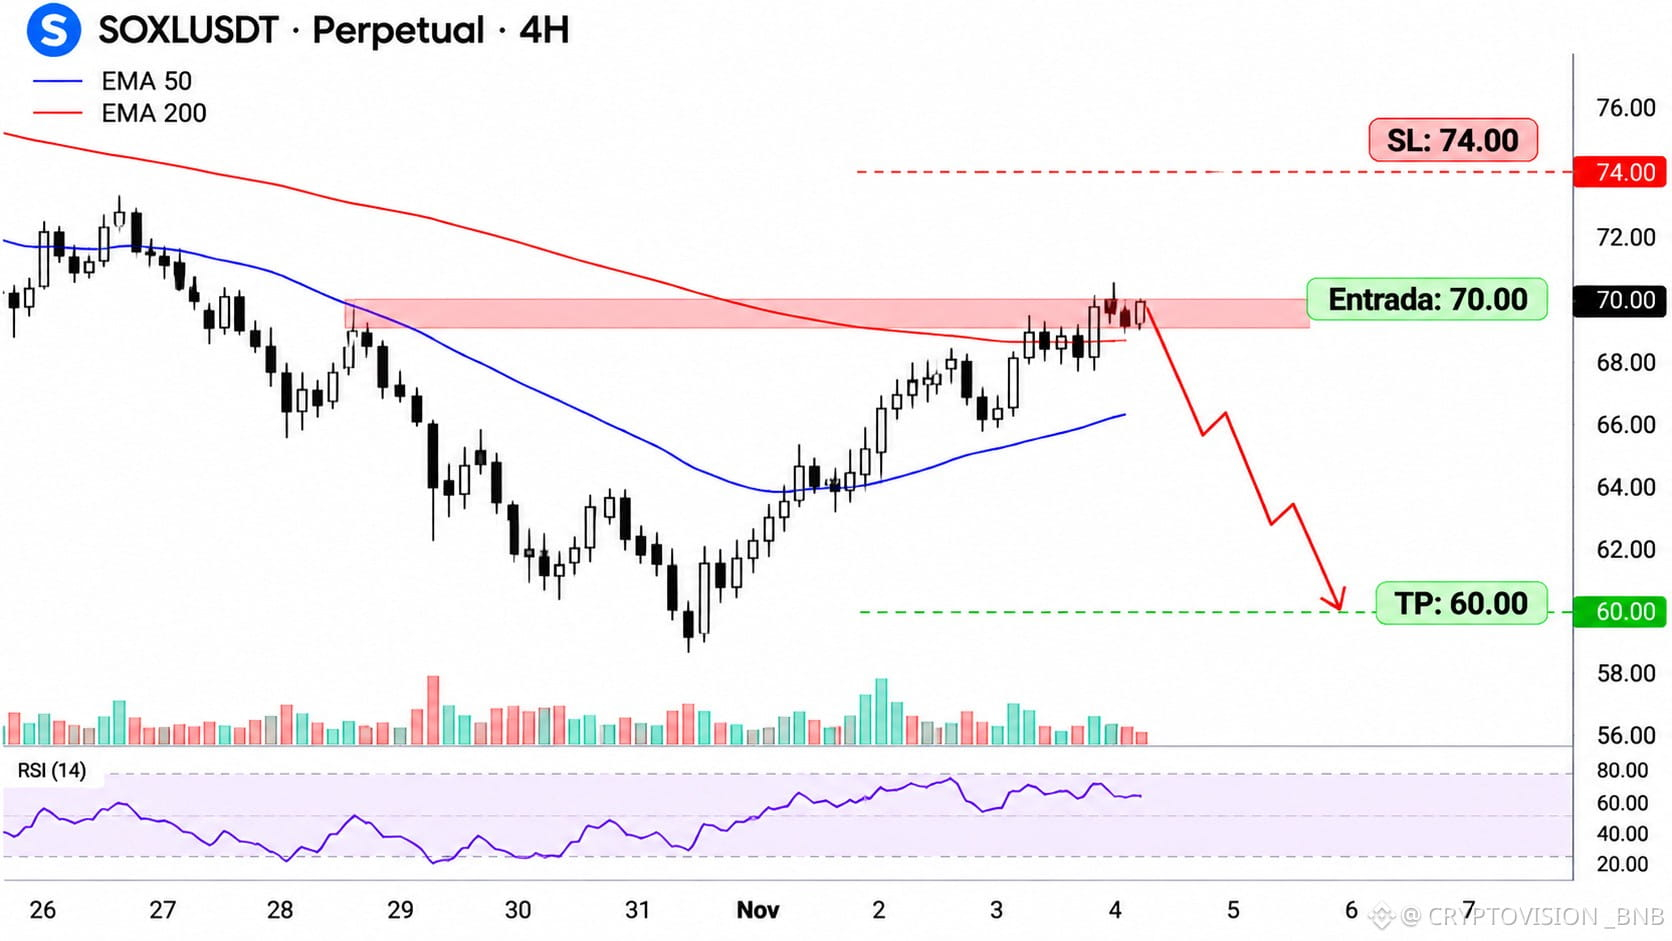
SOXL is back on my bearish watchlist, with a potential move toward $60 if selling pressure continues.
SHORT setup
Stop Loss: $74
Take Profit: $60
The setup is straightforward, but the entry matters.
No voy a perseguir una caída sin confirmación. Antes de abrir una posición, quiero ver un rechazo claro o una ruptura de soporte que favorezca a los vendedores.
A sustained move above $74 would invalidate this bearish scenario.
One important detail: without a confirmed entry price, the risk/reward ratio remains unknown.
SOXL is a leveraged semiconductor ETF, so volatility and sudden reversals deserve particular attention.
Would you short a failed rebound or wait for a confirmed breakdown?
$SOXL
{future}(SOXLUSDT)
#Trading #Semiconductors
$SOXL : Another Short Opportunity? $60 Is Back on My Radar
SOXL is back on my bearish watchlist, with a potential move toward $60 if selling pressure continues.
SHORT setup
Stop Loss: $74
Take Profit: $60
The setup is straightforward, but the entry matters.
No voy a perseguir una caída sin confirmación. Antes de abrir una posición, quiero ver un rechazo claro o una ruptura de soporte que favorezca a los vendedores.
A sustained move above $74 would invalidate this bearish scenario.
One important detail: without a confirmed entry price, the risk/reward ratio remains unknown.
SOXL is a leveraged semiconductor ETF, so volatility and sudden reversals deserve particular attention.
Would you short a failed rebound or wait for a confirmed breakdown?
$SOXL
#Trading #Semiconductors
SOXL is back on my bearish watchlist, with a potential move toward $60 if selling pressure continues.
SHORT setup
Stop Loss: $74
Take Profit: $60
The setup is straightforward, but the entry matters.
No voy a perseguir una caída sin confirmación. Antes de abrir una posición, quiero ver un rechazo claro o una ruptura de soporte que favorezca a los vendedores.
A sustained move above $74 would invalidate this bearish scenario.
One important detail: without a confirmed entry price, the risk/reward ratio remains unknown.
SOXL is a leveraged semiconductor ETF, so volatility and sudden reversals deserve particular attention.
Would you short a failed rebound or wait for a confirmed breakdown?
$SOXL
#Trading #Semiconductors
140
·
--
Төмен (кемімелі)
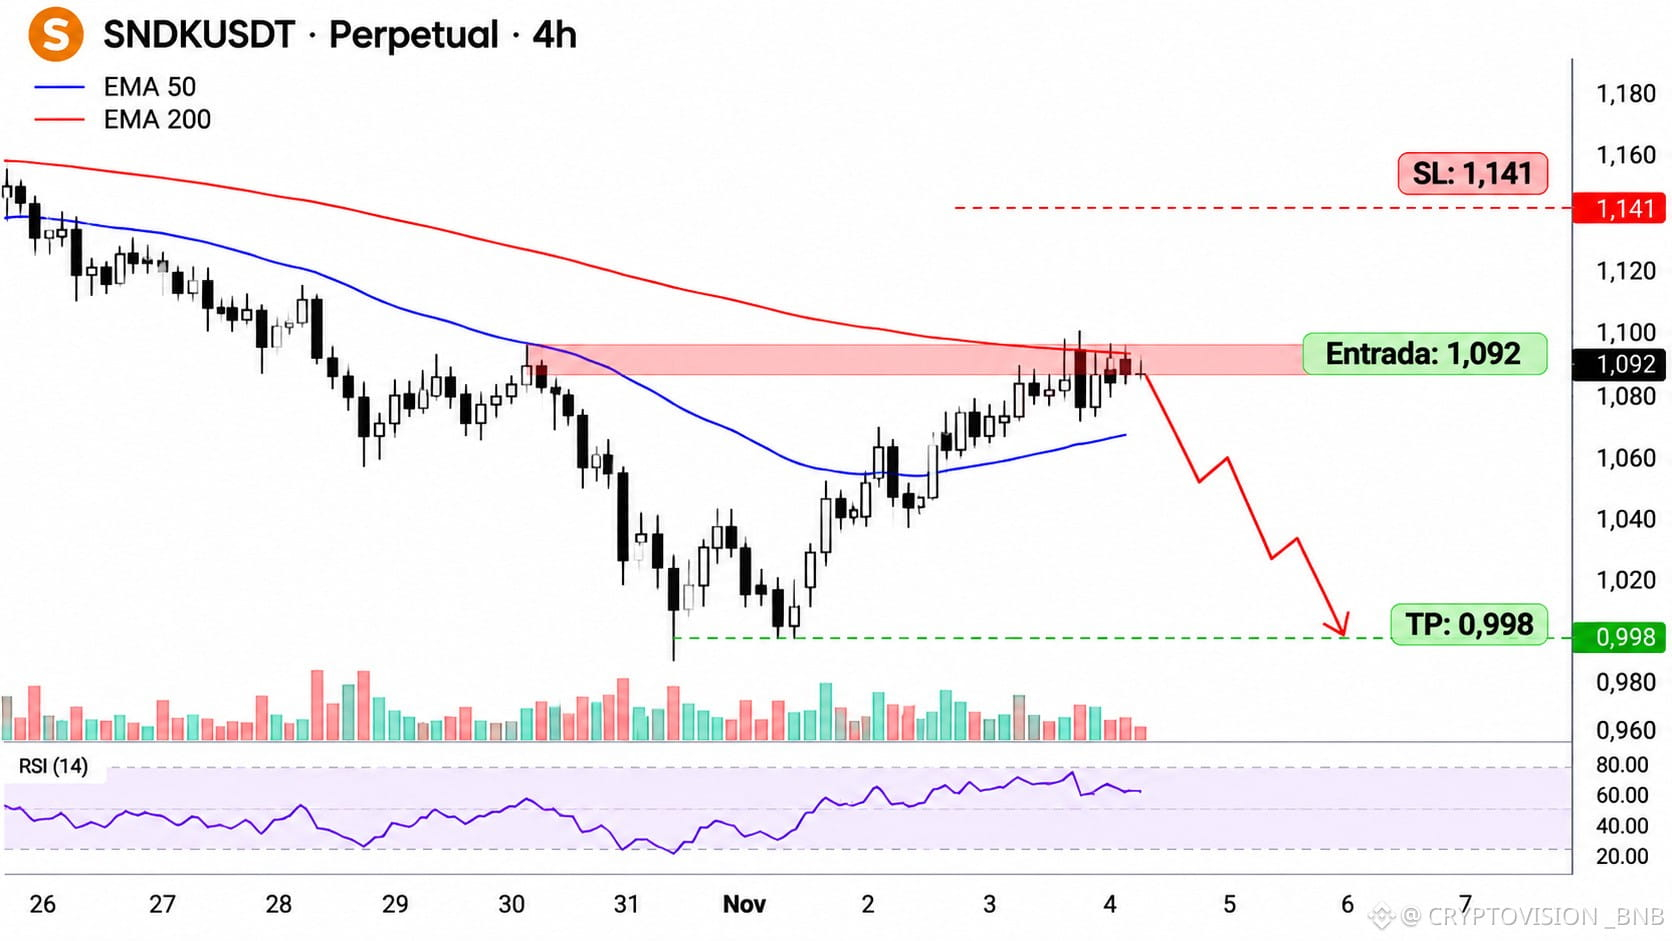
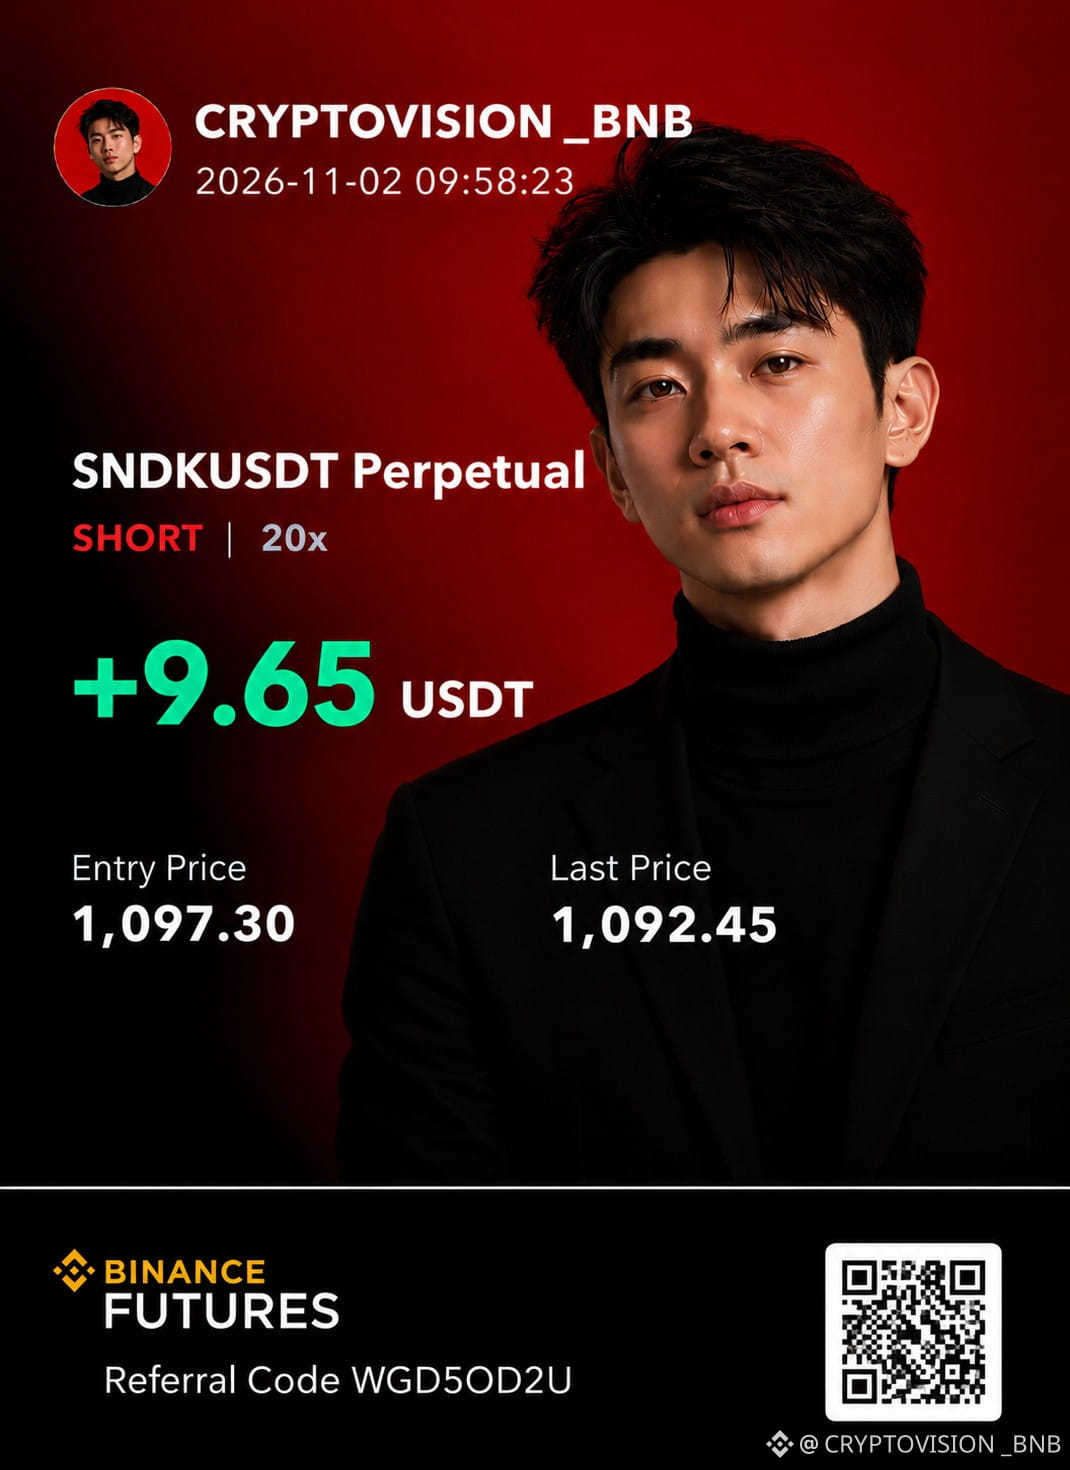
$SNDK: A Short Setup With $998 in Focus
SNDK is back on my bearish watchlist, and I'm looking for a potential continuation to the downside.
SHORT setup
Take Profit: $998
Stop Loss: $1,141
The bearish scenario depends on sellers maintaining control and price failing to reclaim nearby resistance.
La clave no es entrar por impulso, sino esperar una confirmación y encontrar una entrada que justifique el riesgo.
A sustained recovery above $1,141 would invalidate this setup.
No entry price has been confirmed yet, so the risk/reward ratio still needs to be evaluated before considering a position.
A good short isn't about predicting the next drop. It's about knowing exactly where the bearish thesis stops making sense.
$SNDK
{future}(SNDKUSDT)
#trading
$SNDK : A Short Setup With $998 in Focus
SNDK is back on my bearish watchlist, and I'm looking for a potential continuation to the downside.
SHORT setup
Take Profit: $998
Stop Loss: $1,141
The bearish scenario depends on sellers maintaining control and price failing to reclaim nearby resistance.
La clave no es entrar por impulso, sino esperar una confirmación y encontrar una entrada que justifique el riesgo.
A sustained recovery above $1,141 would invalidate this setup.
No entry price has been confirmed yet, so the risk/reward ratio still needs to be evaluated before considering a position.
A good short isn't about predicting the next drop. It's about knowing exactly where the bearish thesis stops making sense.
$SNDK
#trading
SNDK is back on my bearish watchlist, and I'm looking for a potential continuation to the downside.
SHORT setup
Take Profit: $998
Stop Loss: $1,141
The bearish scenario depends on sellers maintaining control and price failing to reclaim nearby resistance.
La clave no es entrar por impulso, sino esperar una confirmación y encontrar una entrada que justifique el riesgo.
A sustained recovery above $1,141 would invalidate this setup.
No entry price has been confirmed yet, so the risk/reward ratio still needs to be evaluated before considering a position.
A good short isn't about predicting the next drop. It's about knowing exactly where the bearish thesis stops making sense.
$SNDK
#trading
600
·
--
Төмен (кемімелі)
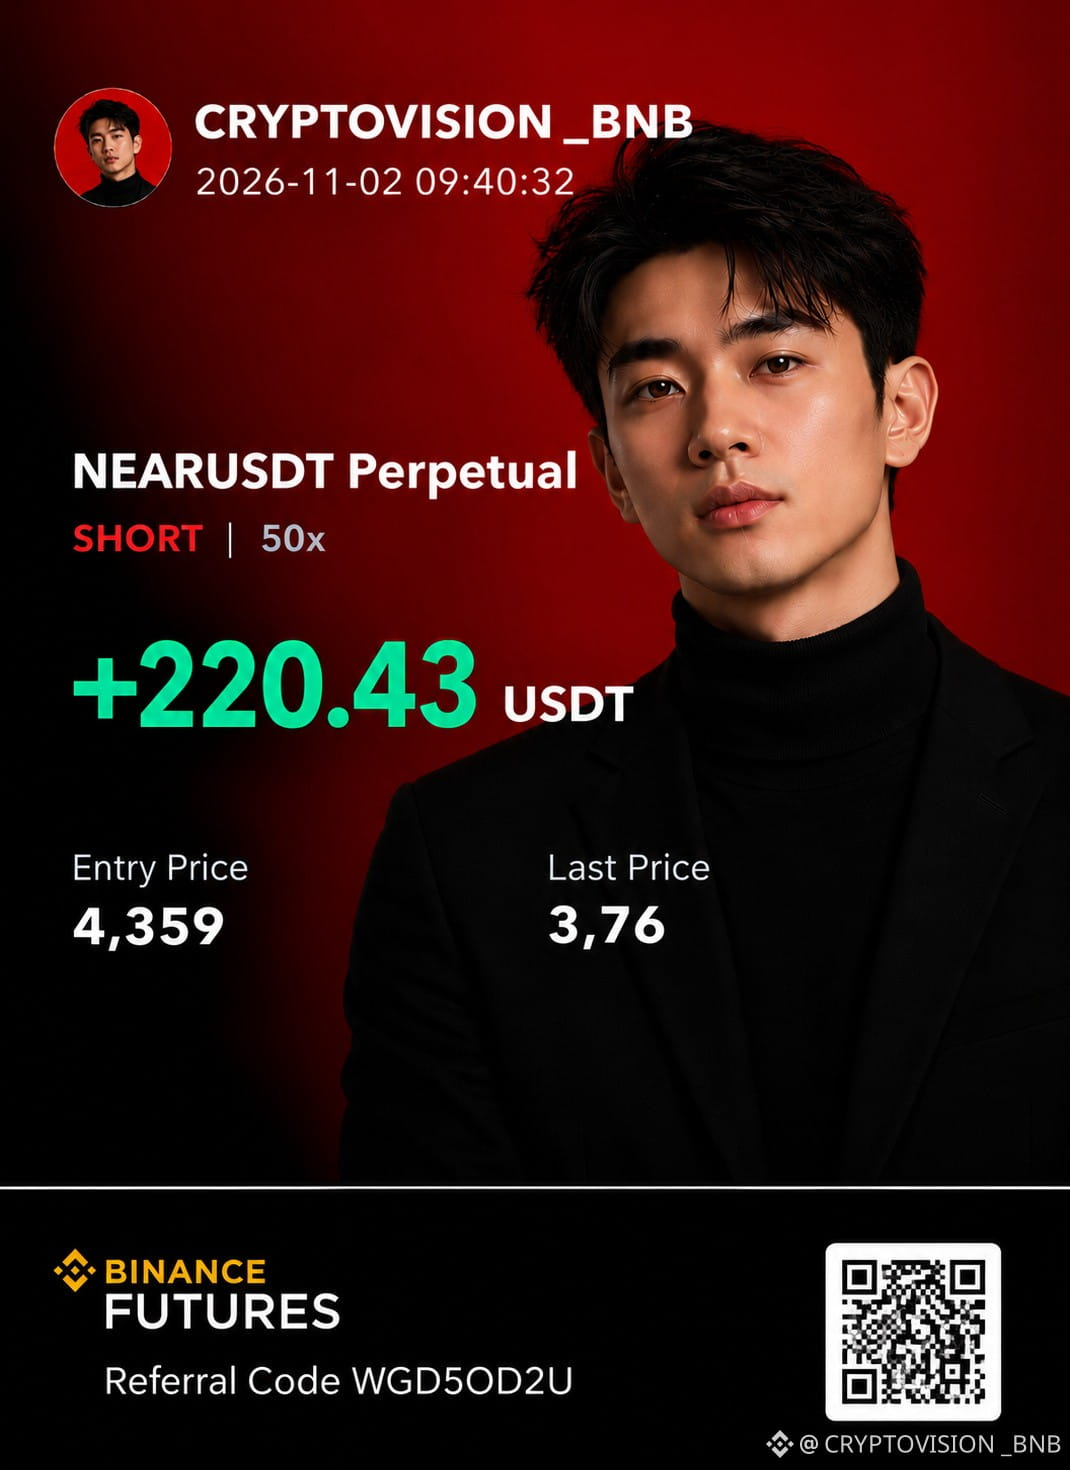
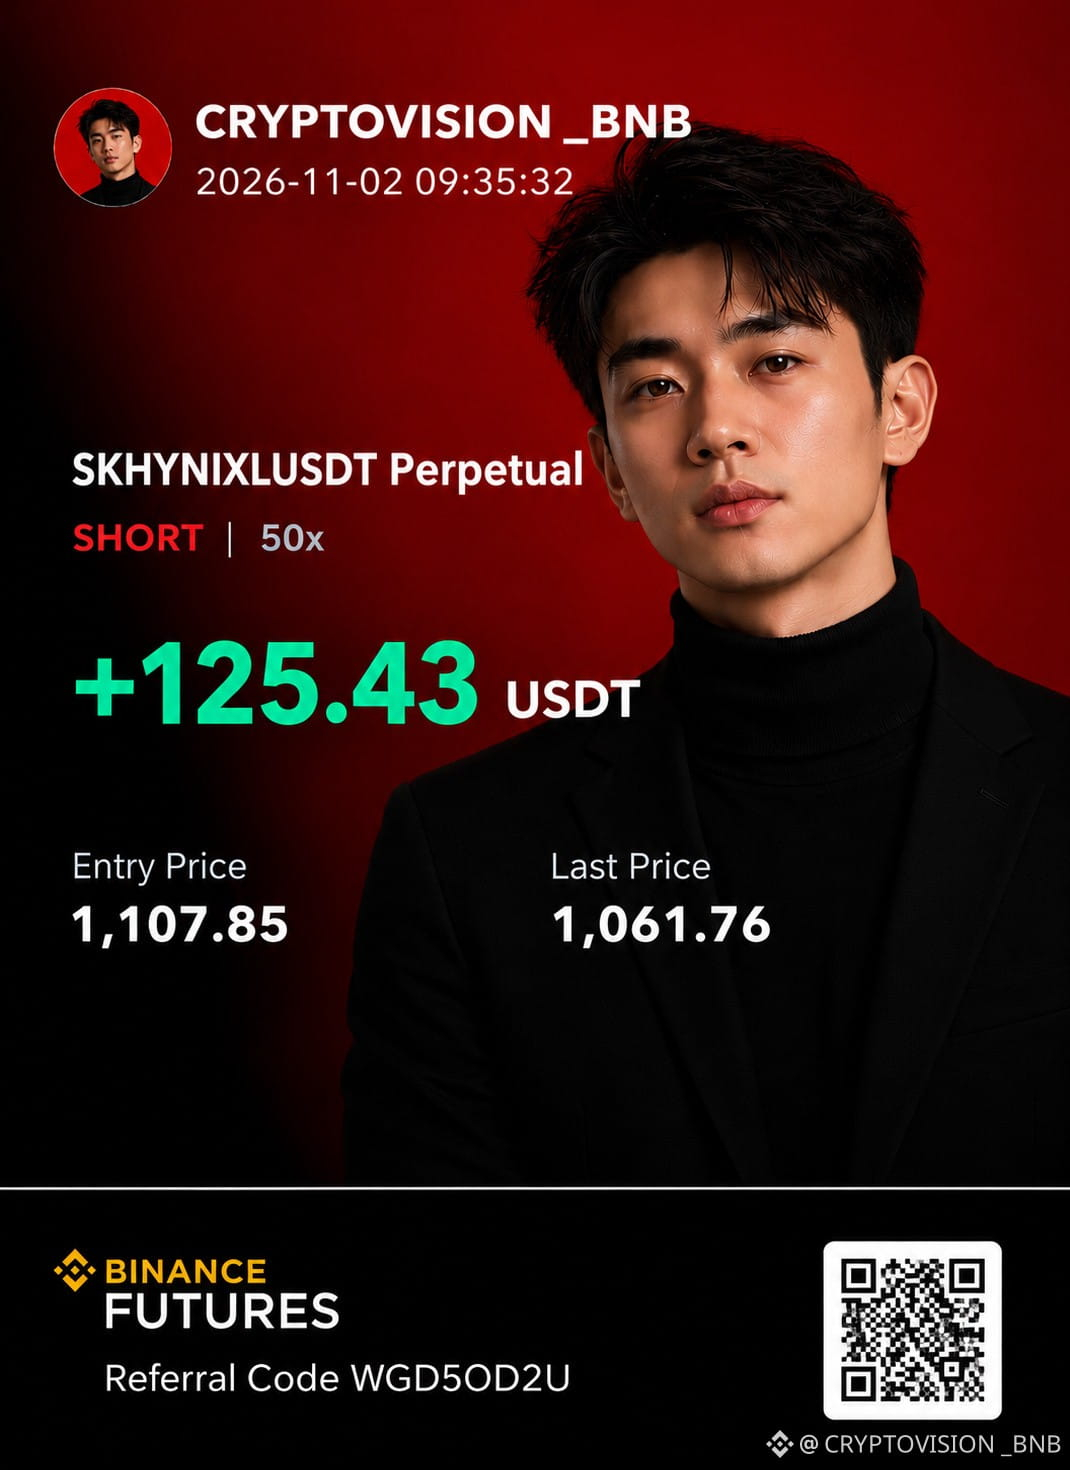
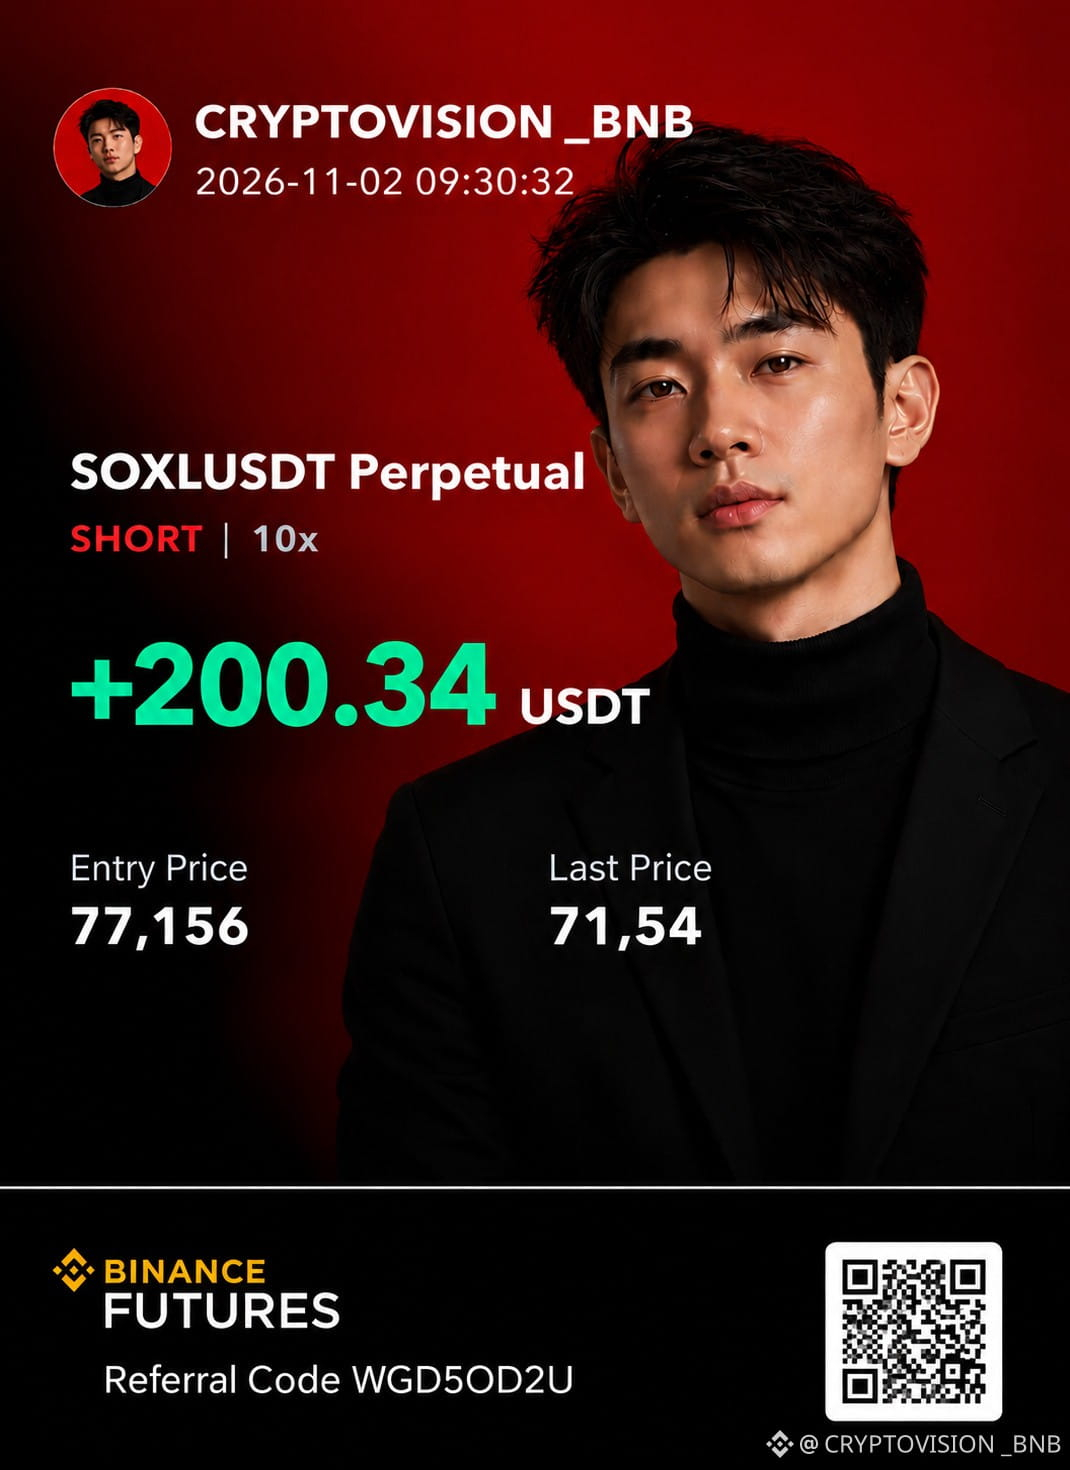
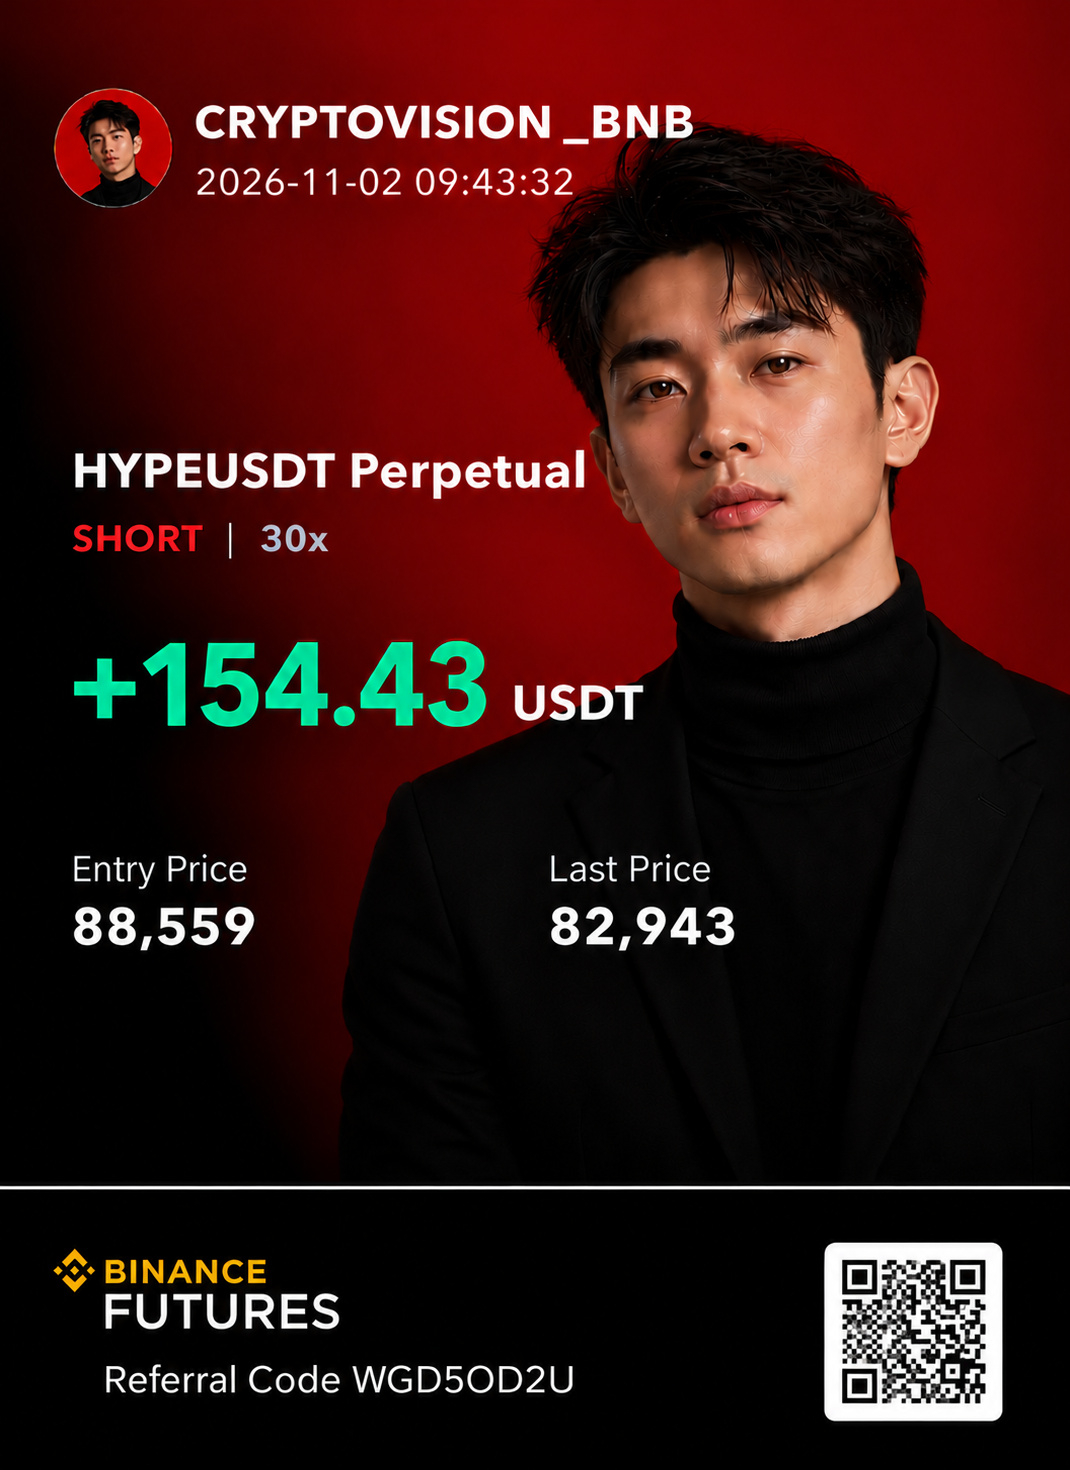
$SOXL, $SKHYNIX, $NEAR & $HYPE — How Did Your Trades Perform Today?
Four assets, different market conditions, and one thing that matters more than a high win rate: realized PnL.
Winning frequently doesn't always mean making more money. Position sizing, risk management, and knowing when to close a trade can make all the difference.
Una buena estrategia no se mide únicamente por cuántas operaciones ganas, sino también por cuánto arriesgas y cuánto conservas.
Your turn: What's your realized PnL today?
Profit, loss, or breakeven — share your result.
{future}(SOXLUSDT)
{spot}(NEARUSDT)
{spot}(HYPEUSDT)
#trading
$SOXL, $SKHYNIX, $NEAR & $HYPE — How Did Your Trades Perform Today?
Four assets, different market conditions, and one thing that matters more than a high win rate: realized PnL.
Winning frequently doesn't always mean making more money. Position sizing, risk management, and knowing when to close a trade can make all the difference.
Una buena estrategia no se mide únicamente por cuántas operaciones ganas, sino también por cuánto arriesgas y cuánto conservas.
Your turn: What's your realized PnL today?
Profit, loss, or breakeven — share your result.
#trading
Four assets, different market conditions, and one thing that matters more than a high win rate: realized PnL.
Winning frequently doesn't always mean making more money. Position sizing, risk management, and knowing when to close a trade can make all the difference.
Una buena estrategia no se mide únicamente por cuántas operaciones ganas, sino también por cuánto arriesgas y cuánto conservas.
Your turn: What's your realized PnL today?
Profit, loss, or breakeven — share your result.
#trading
55
The Hacker Behind Some of the Biggest Cyberattacks in History Is Still Wanted by the FBI
His name is Park Jin Hyok, a North Korean national indicted by U.S. authorities in 2018.
The FBI and Department of Justice have linked him to alleged involvement in three major cyberattacks:
2014 — Sony Pictures: A devastating cyberattack that disrupted the company's systems.
2016 — Bangladesh Bank: An $81 million theft involving fraudulent SWIFT transactions.
2017 — WannaCry: Ransomware that disrupted hospitals, companies, and critical services worldwide.
Según las autoridades estadounidenses, Park estaba vinculado al grupo Lazarus y a operaciones cibernéticas patrocinadas por Corea del Norte.
His case is a reminder that cybersecurity is not just a technical issue. It's a major financial risk.
For crypto investors, the lesson is clear: exchange security, wallet protection, and private-key management deserve as much attention as price charts.
The allegations against Park are criminal charges, not proof that he personally executed every attack.
$BTC
{spot}(BTCUSDT)
#Cybersecurity #CryptoSecurity
The Hacker Behind Some of the Biggest Cyberattacks in History Is Still Wanted by the FBI
His name is Park Jin Hyok, a North Korean national indicted by U.S. authorities in 2018.
The FBI and Department of Justice have linked him to alleged involvement in three major cyberattacks:
2014 — Sony Pictures: A devastating cyberattack that disrupted the company's systems.
2016 — Bangladesh Bank: An $81 million theft involving fraudulent SWIFT transactions.
2017 — WannaCry: Ransomware that disrupted hospitals, companies, and critical services worldwide.
Según las autoridades estadounidenses, Park estaba vinculado al grupo Lazarus y a operaciones cibernéticas patrocinadas por Corea del Norte.
His case is a reminder that cybersecurity is not just a technical issue. It's a major financial risk.
For crypto investors, the lesson is clear: exchange security, wallet protection, and private-key management deserve as much attention as price charts.
The allegations against Park are criminal charges, not proof that he personally executed every attack.
$BTC
#Cybersecurity #CryptoSecurity
His name is Park Jin Hyok, a North Korean national indicted by U.S. authorities in 2018.
The FBI and Department of Justice have linked him to alleged involvement in three major cyberattacks:
2014 — Sony Pictures: A devastating cyberattack that disrupted the company's systems.
2016 — Bangladesh Bank: An $81 million theft involving fraudulent SWIFT transactions.
2017 — WannaCry: Ransomware that disrupted hospitals, companies, and critical services worldwide.
Según las autoridades estadounidenses, Park estaba vinculado al grupo Lazarus y a operaciones cibernéticas patrocinadas por Corea del Norte.
His case is a reminder that cybersecurity is not just a technical issue. It's a major financial risk.
For crypto investors, the lesson is clear: exchange security, wallet protection, and private-key management deserve as much attention as price charts.
The allegations against Park are criminal charges, not proof that he personally executed every attack.
$BTC
#Cybersecurity #CryptoSecurity


654
·
--
Жоғары (өспелі)
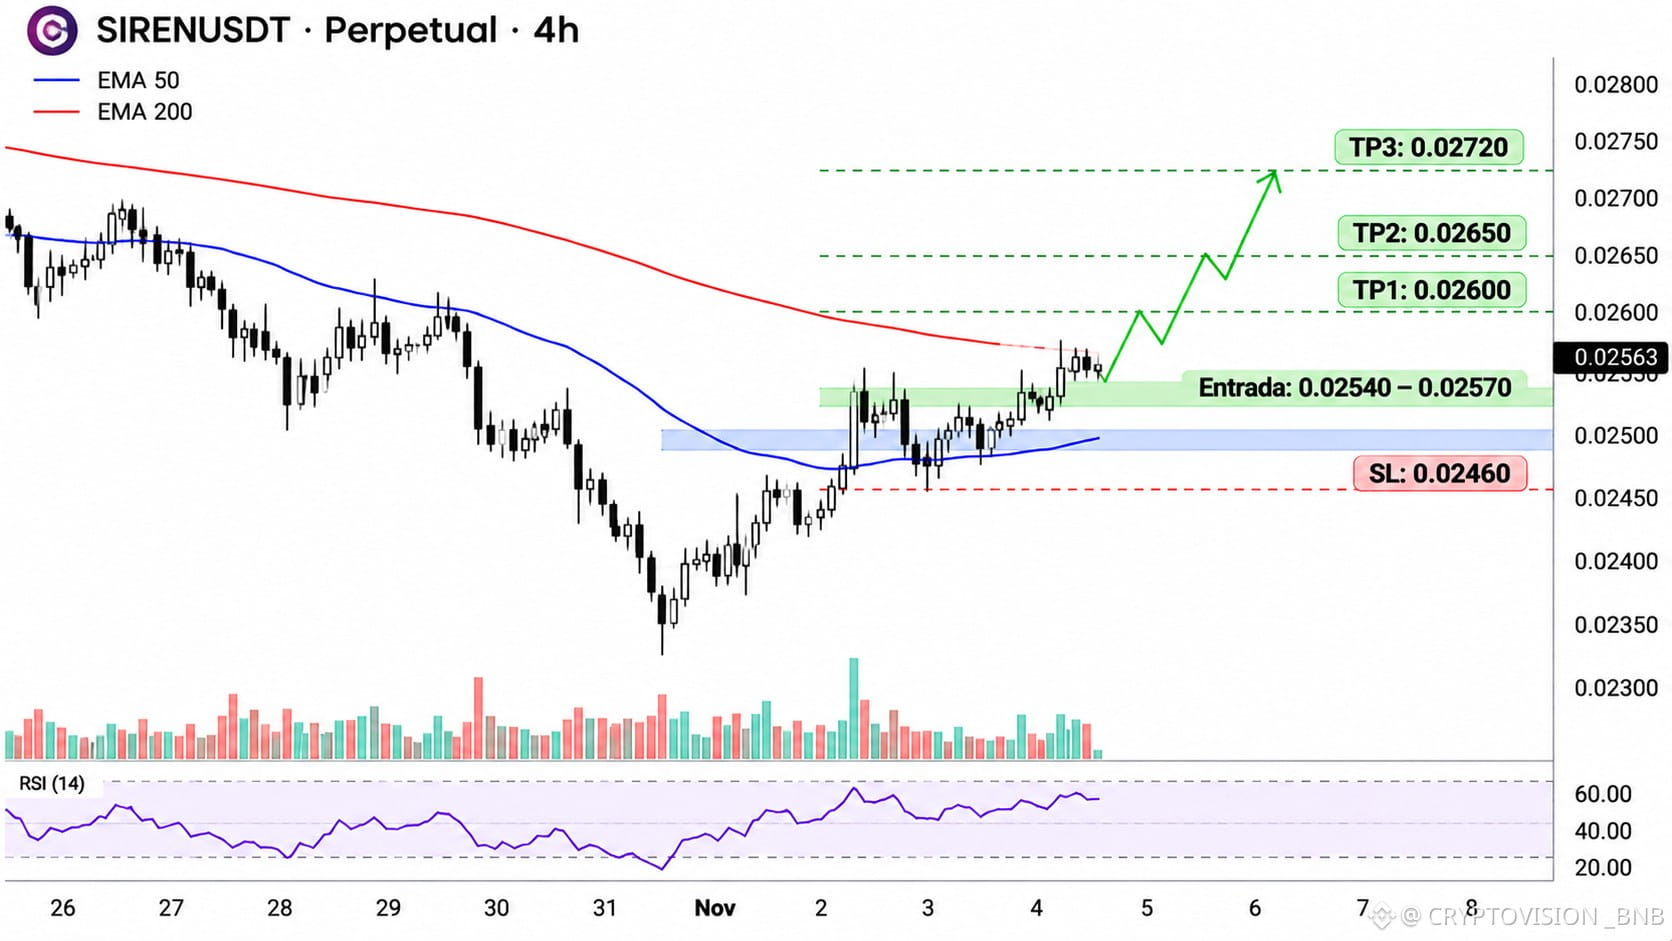
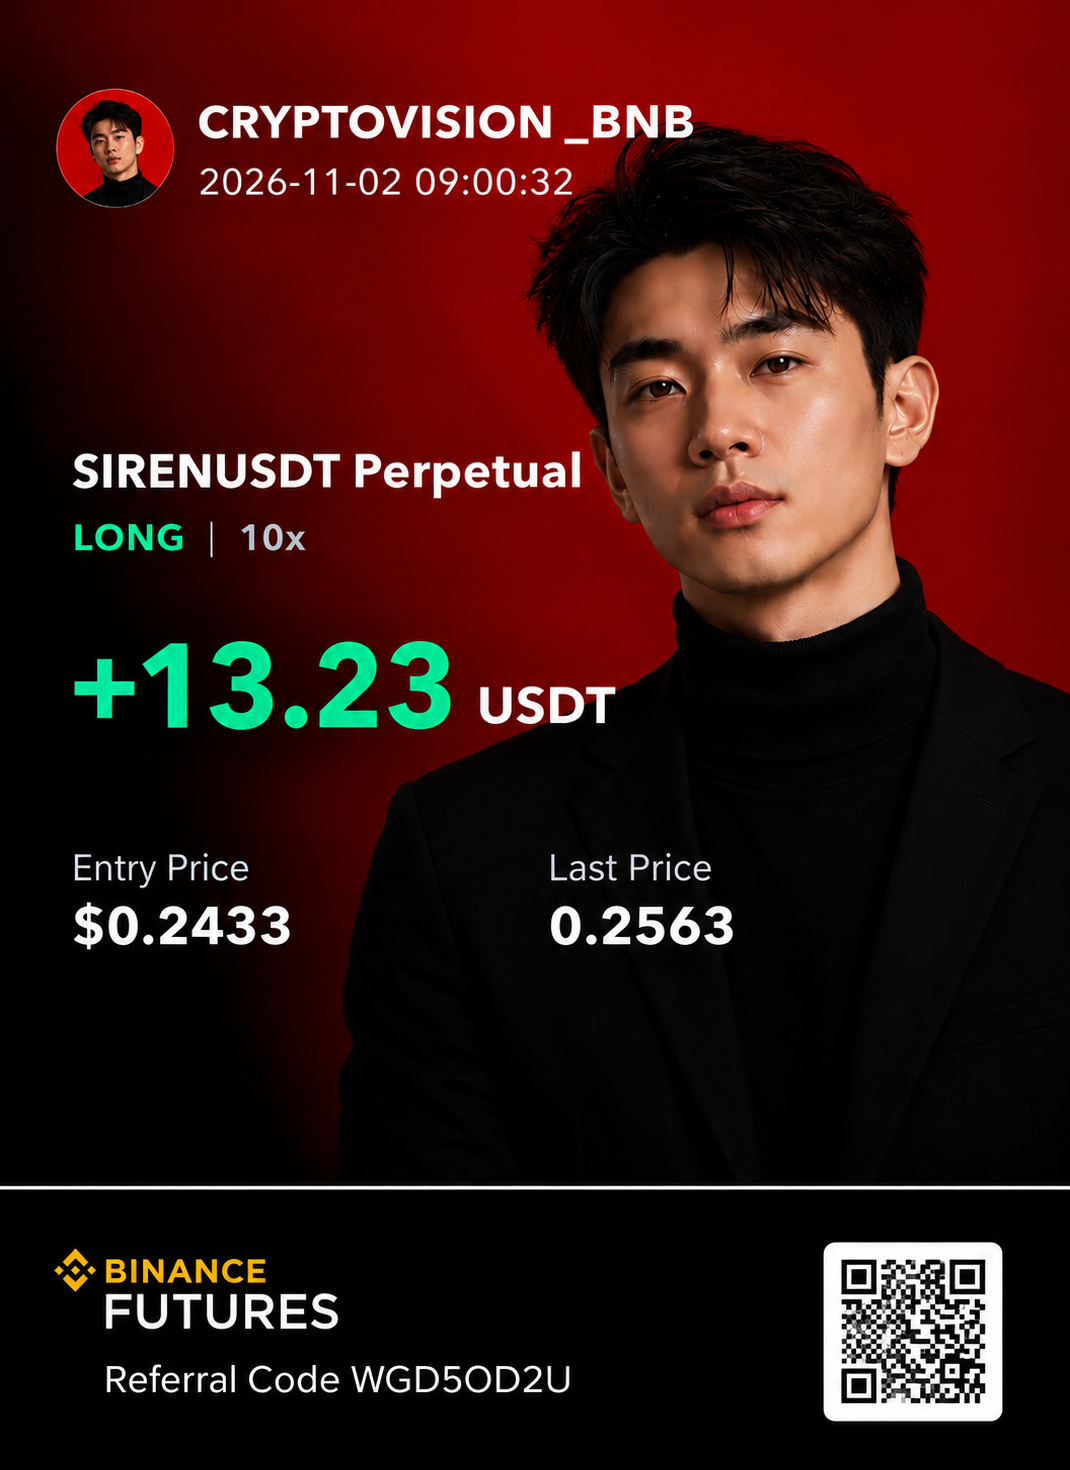
$SIREN : Buyers Are Fighting for Control After the $0.02341 Bounce
SIREN is attempting to build bullish momentum following its rebound from $0.02341.
The key question now is whether buyers can defend the $0.02500–$0.02490 support area and push through nearby resistance.
LONG setup — SIRENUSDT
Entry: $0.02540–$0.02570
TP1: $0.02600
TP2: $0.02650
TP3: $0.02720
Stop Loss: $0.02460
The upside scenario remains interesting while support holds. A sustained move above $0.02600 would strengthen the case for continuation toward $0.02650 and potentially $0.02720.
Pero cuidado: perder los $0.02500–$0.02490 podría anticipar debilidad. El nivel de invalidación de esta operación está en $0.02460.
I'm waiting for confirmation rather than chasing a green candle.
Leverage of 10x–20x significantly increases liquidation risk, even on relatively small price movements.
$SIREN
{future}(SIRENUSDT)
#CryptoTrading
$SIREN : Buyers Are Fighting for Control After the $0.02341 Bounce
SIREN is attempting to build bullish momentum following its rebound from $0.02341.
The key question now is whether buyers can defend the $0.02500–$0.02490 support area and push through nearby resistance.
LONG setup — SIRENUSDT
Entry: $0.02540–$0.02570
TP1: $0.02600
TP2: $0.02650
TP3: $0.02720
Stop Loss: $0.02460
The upside scenario remains interesting while support holds. A sustained move above $0.02600 would strengthen the case for continuation toward $0.02650 and potentially $0.02720.
Pero cuidado: perder los $0.02500–$0.02490 podría anticipar debilidad. El nivel de invalidación de esta operación está en $0.02460.
I'm waiting for confirmation rather than chasing a green candle.
Leverage of 10x–20x significantly increases liquidation risk, even on relatively small price movements.
$SIREN
#CryptoTrading
SIREN is attempting to build bullish momentum following its rebound from $0.02341.
The key question now is whether buyers can defend the $0.02500–$0.02490 support area and push through nearby resistance.
LONG setup — SIRENUSDT
Entry: $0.02540–$0.02570
TP1: $0.02600
TP2: $0.02650
TP3: $0.02720
Stop Loss: $0.02460
The upside scenario remains interesting while support holds. A sustained move above $0.02600 would strengthen the case for continuation toward $0.02650 and potentially $0.02720.
Pero cuidado: perder los $0.02500–$0.02490 podría anticipar debilidad. El nivel de invalidación de esta operación está en $0.02460.
I'm waiting for confirmation rather than chasing a green candle.
Leverage of 10x–20x significantly increases liquidation risk, even on relatively small price movements.
$SIREN
#CryptoTrading
264
·
--
Төмен (кемімелі)
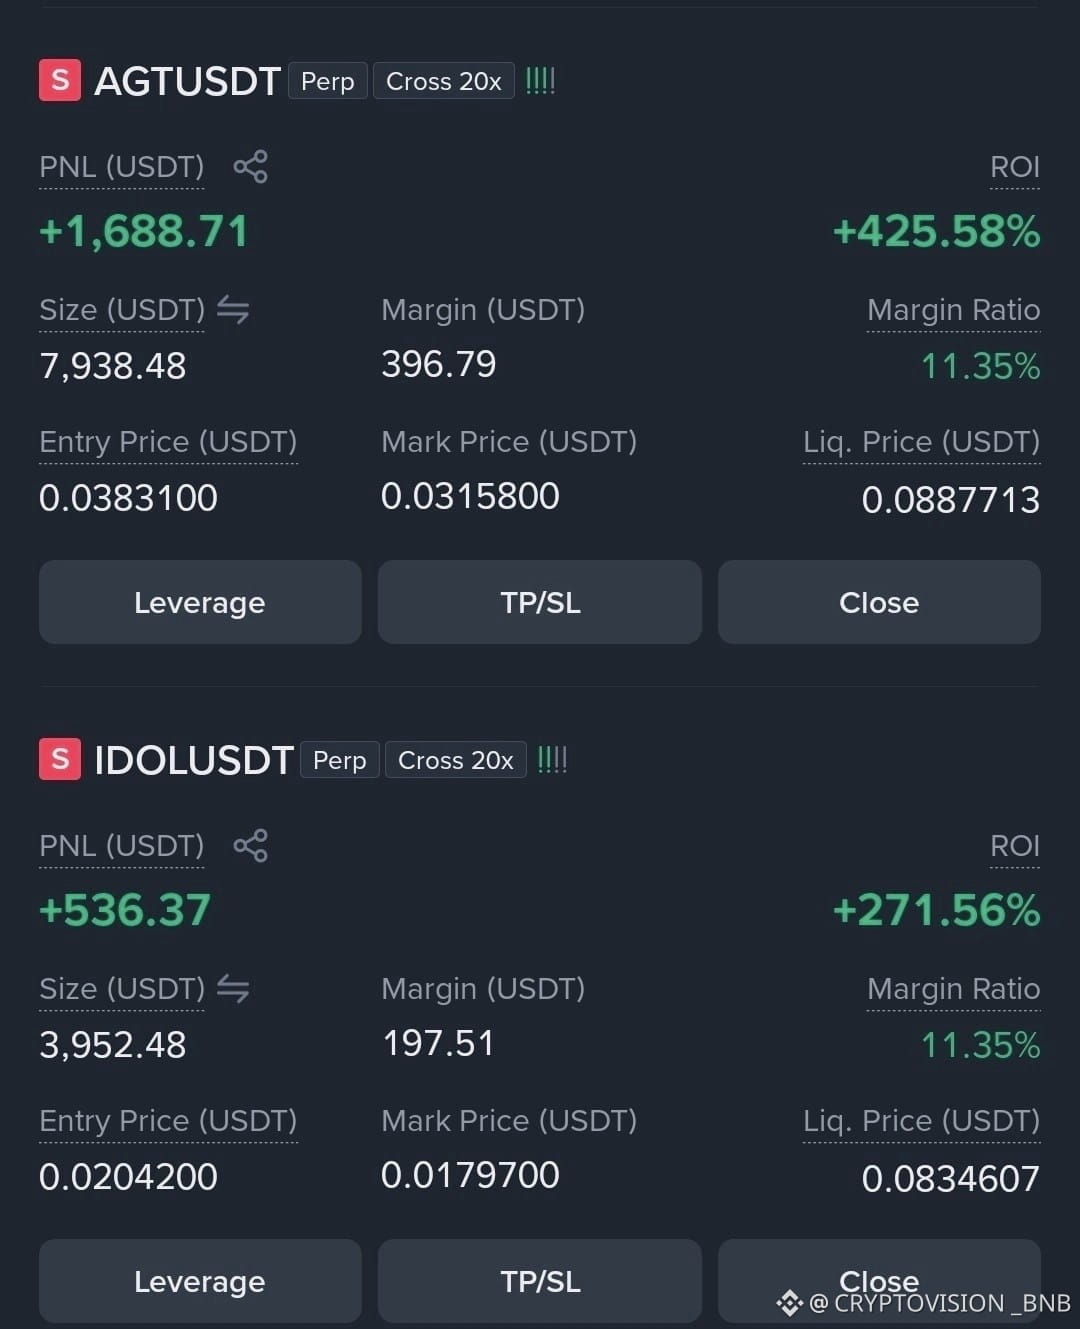
$IDOL & $AGT: Two Shorts, One $2,200 Result
Sometimes the best opportunities appear when everyone else is looking for a breakout.
Two short positions on $IDOL and $AGT, with a reported combined profit of $2,200.
Pero hay algo más importante que el resultado: identificar la debilidad, esperar una buena entrada y controlar el riesgo.
A profitable trade is one outcome. A repeatable strategy is the real goal.
Are you watching more short opportunities in this market?
{future}(IDOLUSDT)
$AGT
{future}(AGTUSDT)
$IDOL & $AGT : Two Shorts, One $2,200 Result
Sometimes the best opportunities appear when everyone else is looking for a breakout.
Two short positions on $IDOL and $AGT , with a reported combined profit of $2,200.
Pero hay algo más importante que el resultado: identificar la debilidad, esperar una buena entrada y controlar el riesgo.
A profitable trade is one outcome. A repeatable strategy is the real goal.
Are you watching more short opportunities in this market?
$AGT
Sometimes the best opportunities appear when everyone else is looking for a breakout.
Two short positions on $IDOL and $AGT , with a reported combined profit of $2,200.
Pero hay algo más importante que el resultado: identificar la debilidad, esperar una buena entrada y controlar el riesgo.
A profitable trade is one outcome. A repeatable strategy is the real goal.
Are you watching more short opportunities in this market?
$AGT
116
·
--
Төмен (кемімелі)
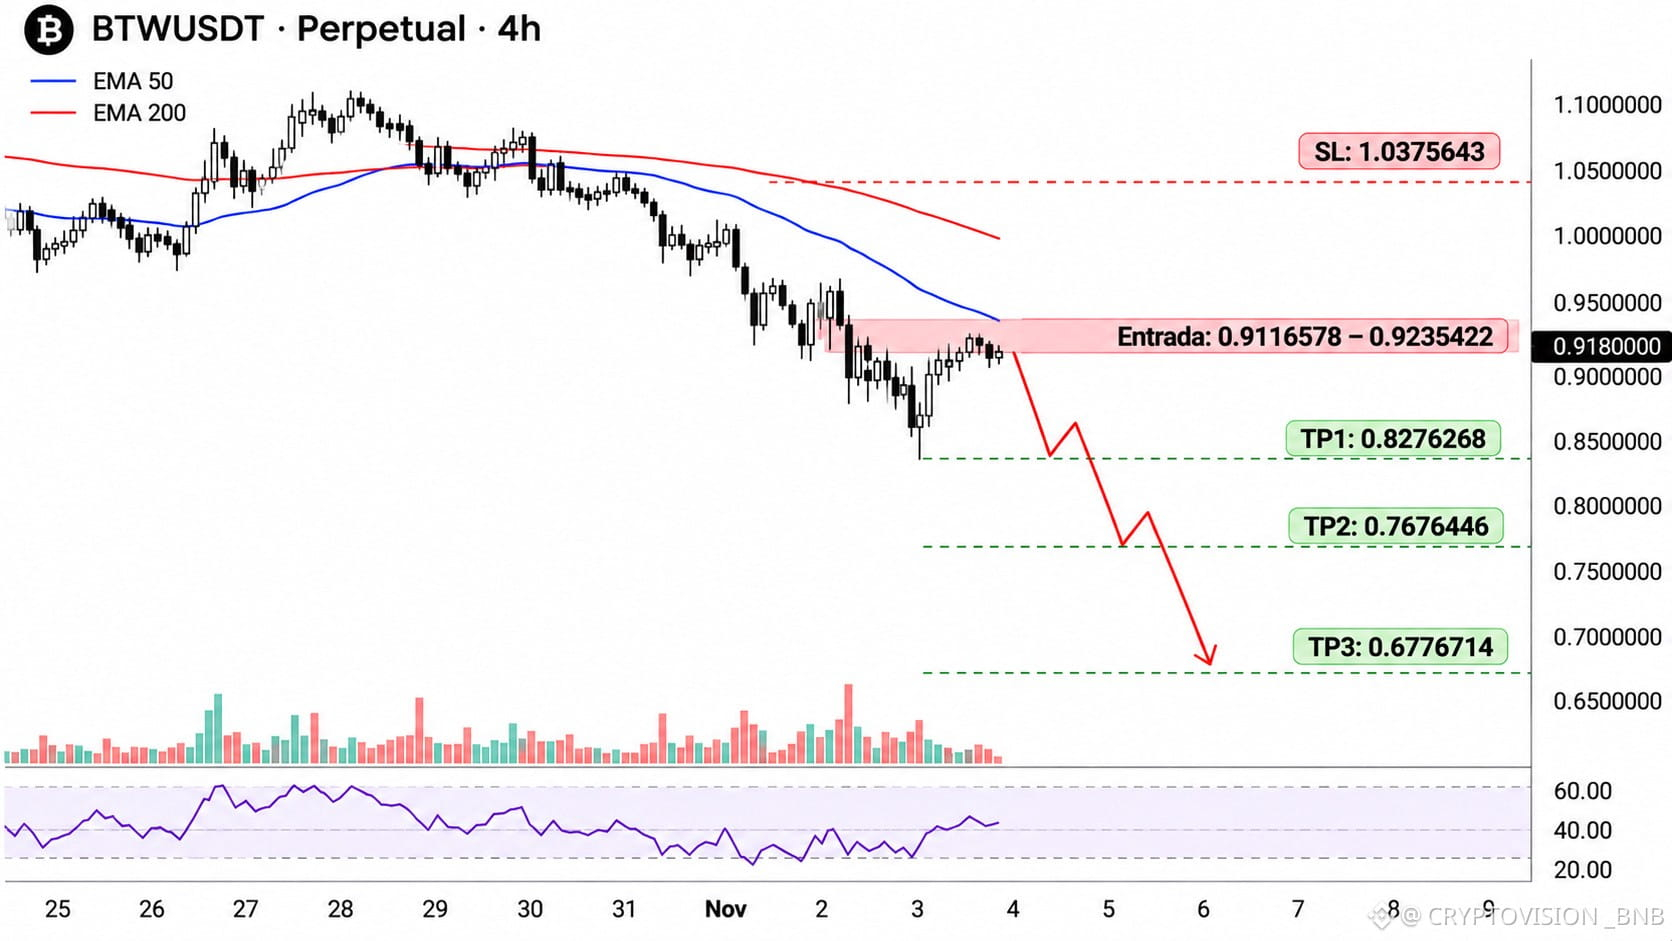
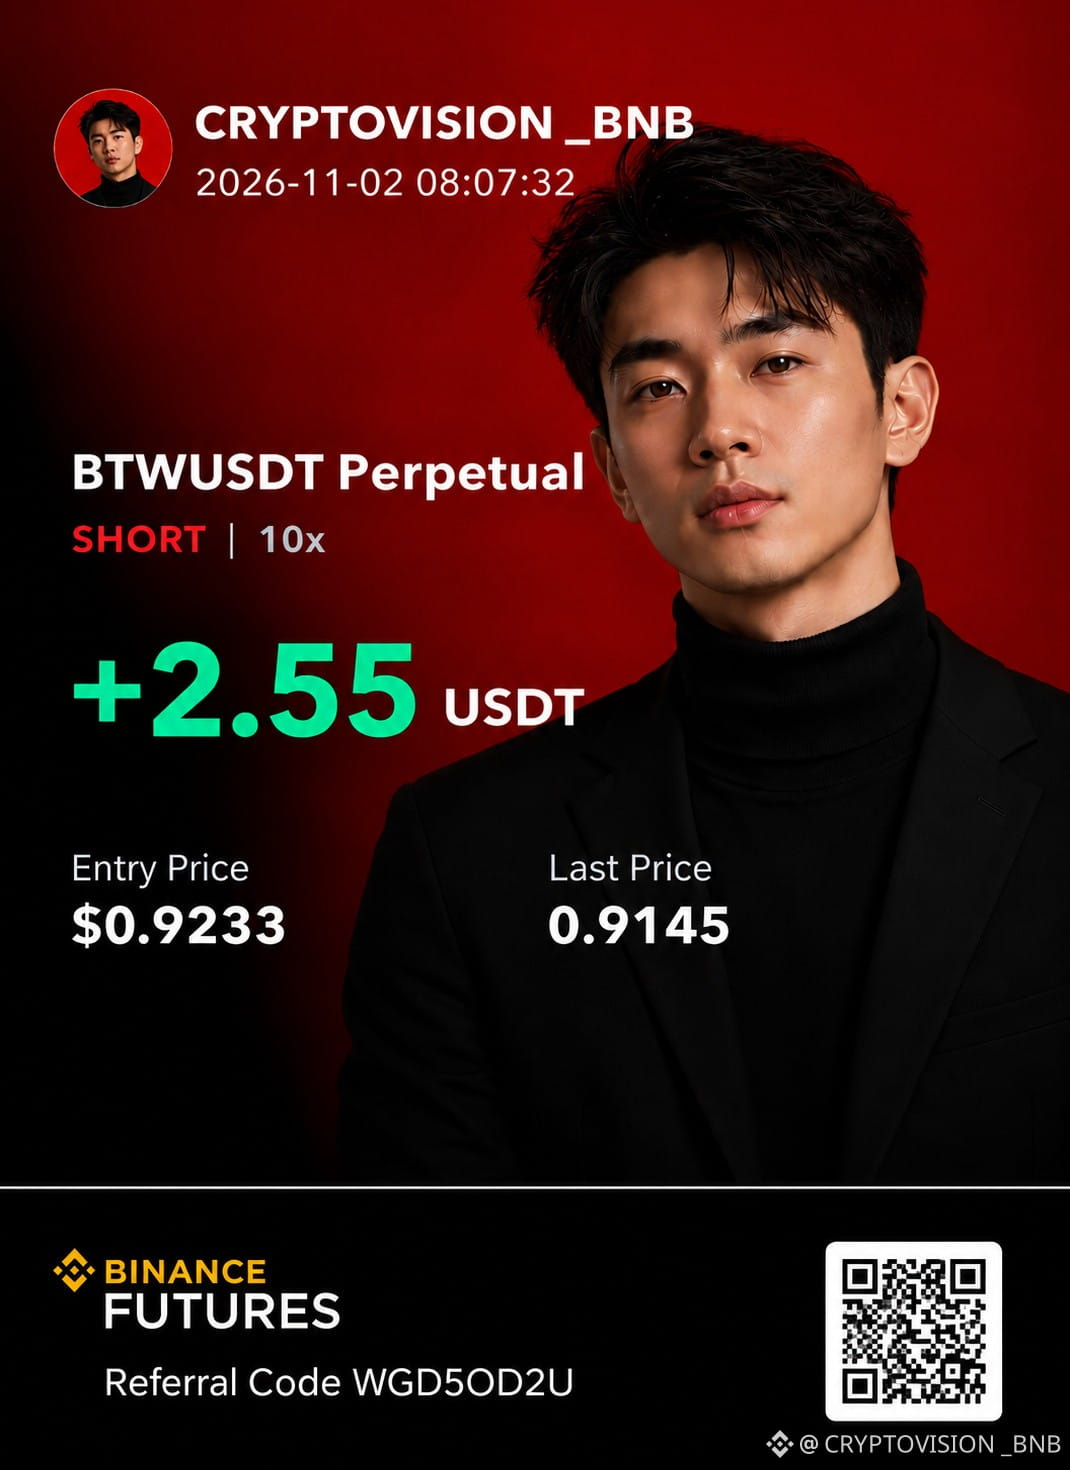
$BTW : Even a Sideways Market Can Hide a Strong Bearish Trend
BTW is showing something interesting: price may look relatively quiet, but the underlying momentum still favors sellers.
SHORT setup — BTW/USDT
Entry: $0.9116578–$0.9235422
TP1: $0.8276268
TP2: $0.7676446
TP3: $0.6776714
Stop Loss: $1.0375643
The bearish thesis comes from multiple timeframes. Según el análisis, BTW cotiza por debajo de las EMA50 y EMA200 en 1H y 4H, mientras el ADX de 15 minutos marca 37.4, señal de una tendencia con fuerza, aunque no confirma por sí solo su dirección.
But there's a catch.
BTW is reportedly trading 3.3 ATR below its 1H EMA50. That suggests an overstretched move, where a sharp relief bounce could punish late shorts.
My approach is to wait for price to return to the entry zone rather than chase the decline.
If the trade develops as expected, the plan is to close 50% at TP1, another 25% at TP2, and the remaining 25% at TP3. After TP1, move the stop to breakeven.
La dirección puede ser bajista, pero una buena entrada sigue siendo fundamental.
A move above $1.0375 invalidates this setup.
$BTW
{future}(BTWUSDT)
$BTW : Even a Sideways Market Can Hide a Strong Bearish Trend
BTW is showing something interesting: price may look relatively quiet, but the underlying momentum still favors sellers.
SHORT setup — BTW/USDT
Entry: $0.9116578–$0.9235422
TP1: $0.8276268
TP2: $0.7676446
TP3: $0.6776714
Stop Loss: $1.0375643
The bearish thesis comes from multiple timeframes. Según el análisis, BTW cotiza por debajo de las EMA50 y EMA200 en 1H y 4H, mientras el ADX de 15 minutos marca 37.4, señal de una tendencia con fuerza, aunque no confirma por sí solo su dirección.
But there's a catch.
BTW is reportedly trading 3.3 ATR below its 1H EMA50. That suggests an overstretched move, where a sharp relief bounce could punish late shorts.
My approach is to wait for price to return to the entry zone rather than chase the decline.
If the trade develops as expected, the plan is to close 50% at TP1, another 25% at TP2, and the remaining 25% at TP3. After TP1, move the stop to breakeven.
La dirección puede ser bajista, pero una buena entrada sigue siendo fundamental.
A move above $1.0375 invalidates this setup.
$BTW
BTW is showing something interesting: price may look relatively quiet, but the underlying momentum still favors sellers.
SHORT setup — BTW/USDT
Entry: $0.9116578–$0.9235422
TP1: $0.8276268
TP2: $0.7676446
TP3: $0.6776714
Stop Loss: $1.0375643
The bearish thesis comes from multiple timeframes. Según el análisis, BTW cotiza por debajo de las EMA50 y EMA200 en 1H y 4H, mientras el ADX de 15 minutos marca 37.4, señal de una tendencia con fuerza, aunque no confirma por sí solo su dirección.
But there's a catch.
BTW is reportedly trading 3.3 ATR below its 1H EMA50. That suggests an overstretched move, where a sharp relief bounce could punish late shorts.
My approach is to wait for price to return to the entry zone rather than chase the decline.
If the trade develops as expected, the plan is to close 50% at TP1, another 25% at TP2, and the remaining 25% at TP3. After TP1, move the stop to breakeven.
La dirección puede ser bajista, pero una buena entrada sigue siendo fundamental.
A move above $1.0375 invalidates this setup.
$BTW
689
·
--
Төмен (кемімелі)
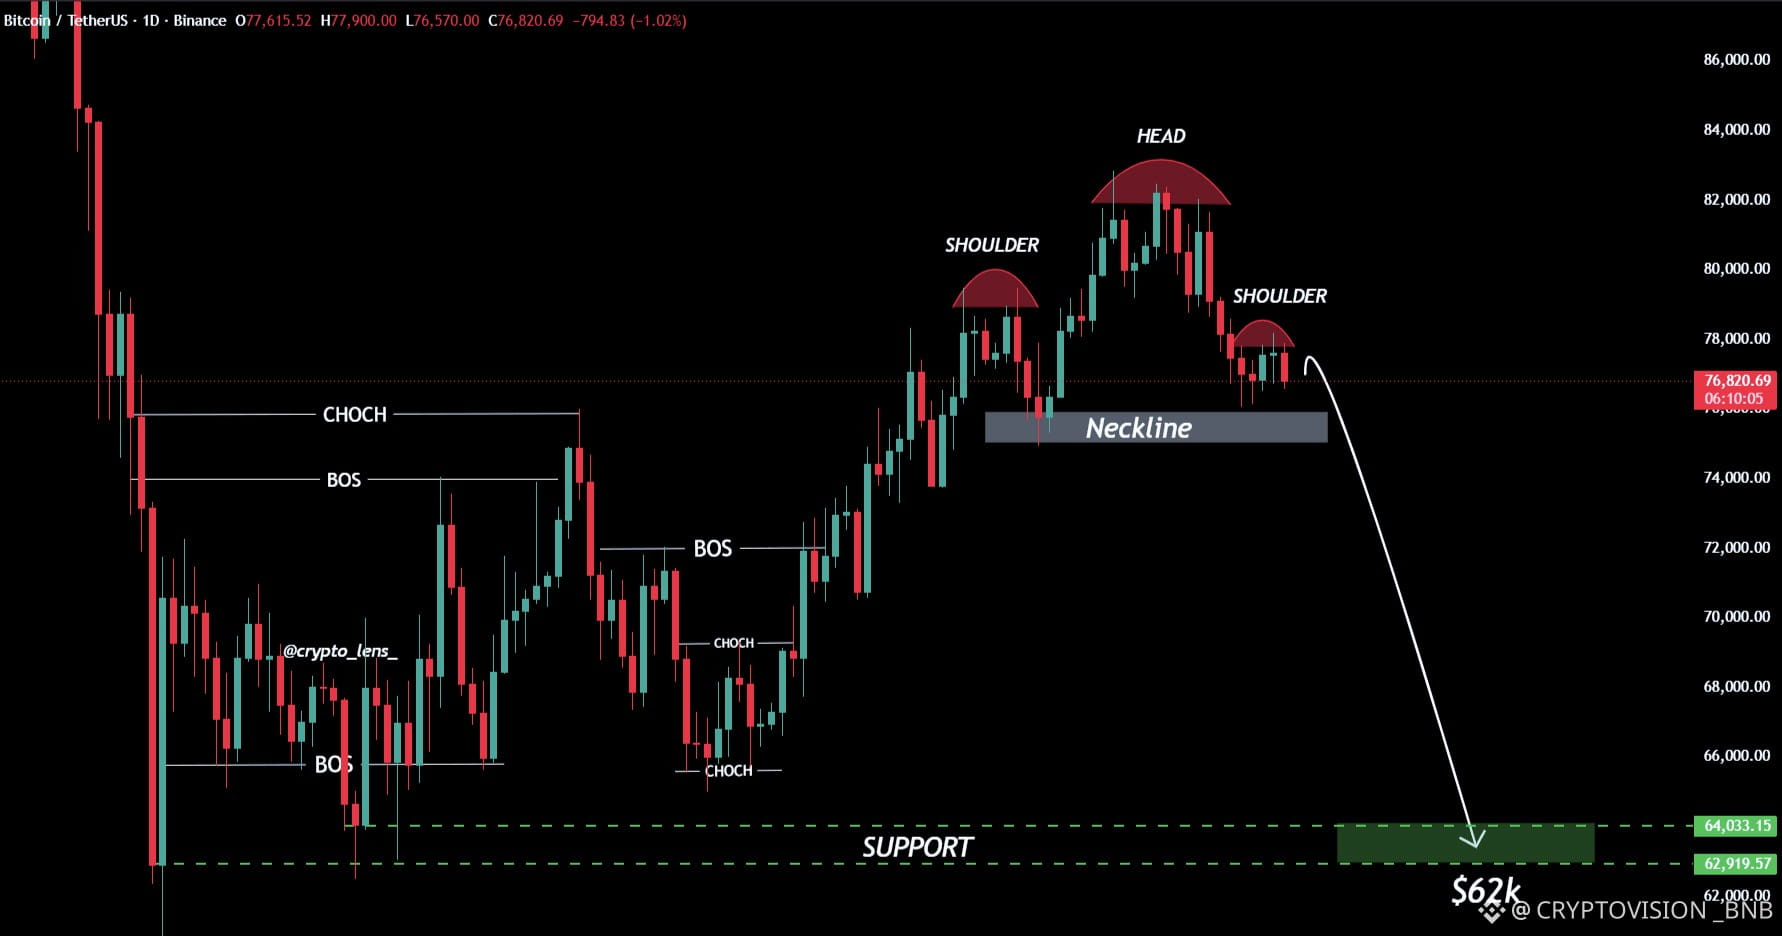
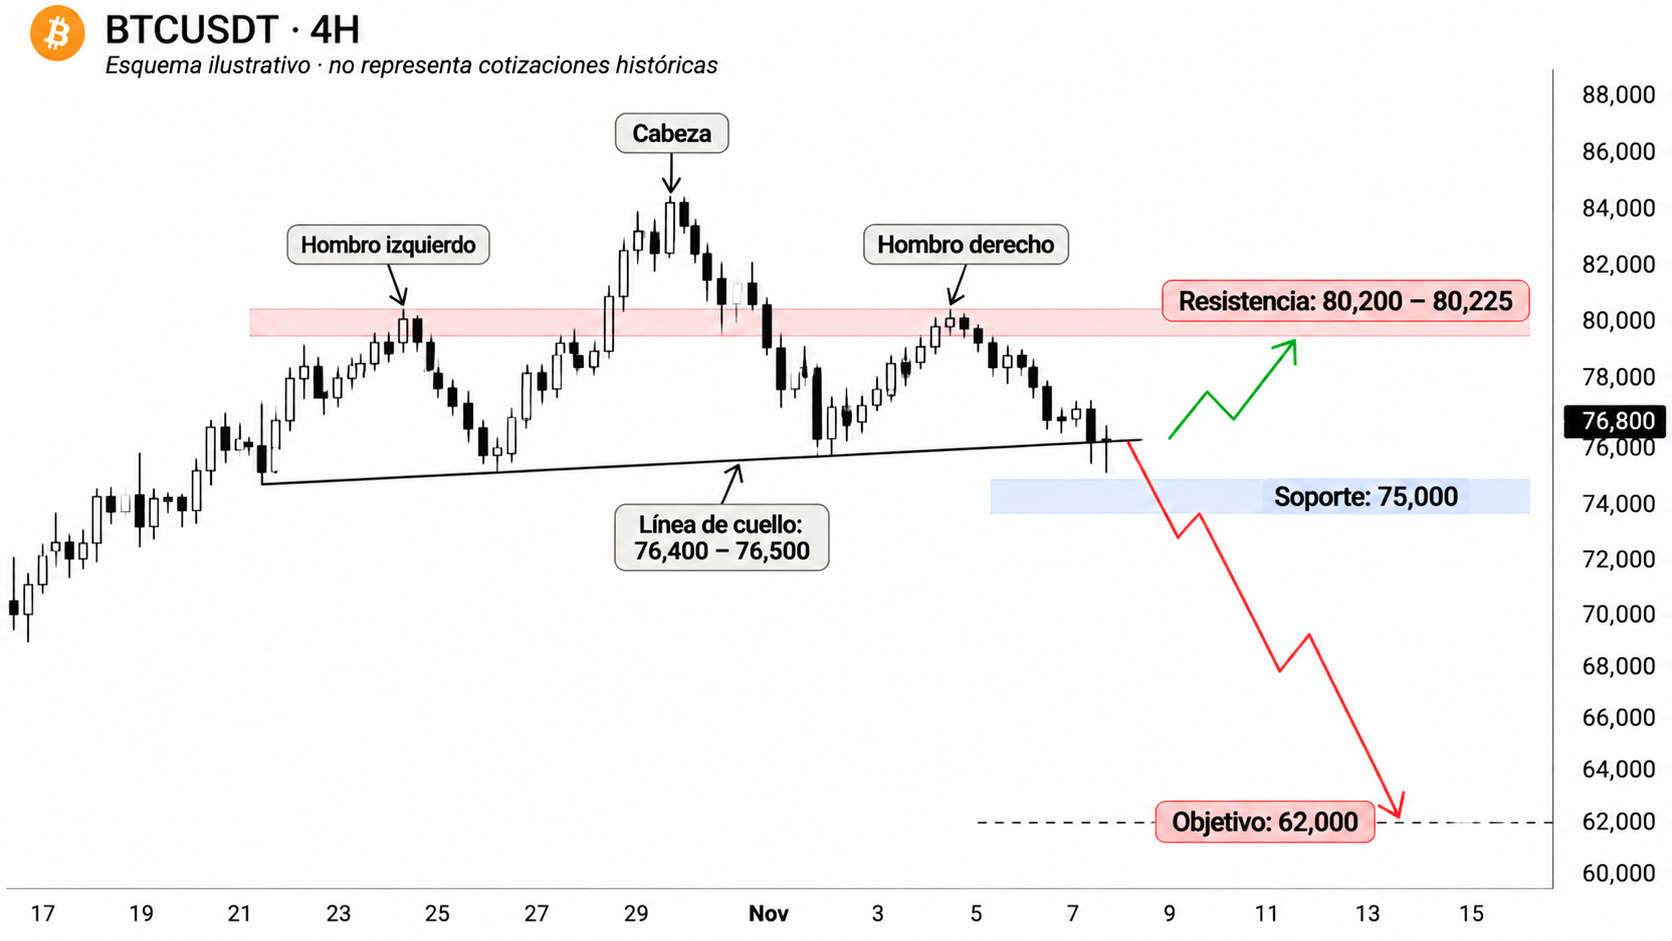
$BTC: A Head-and-Shoulders Breakdown Could Put $62K in Play
Bitcoin may be developing a classic head-and-shoulders breakdown, with the recent bullish recovery potentially turning into a bull trap.
The key isn't the pattern's appearance. It's whether BTC breaks the neckline and fails to reclaim it.
If that happens, bearish momentum could accelerate, putting $62,000 on the radar as a potential downside target.
¿Podría ocurrir en los próximos 12 días? Es posible, pero el mercado todavía tiene que confirmar esa ruptura. No hay garantía de que el movimiento ocurra en ese plazo.
A strong recovery above the neckline would weaken the bearish thesis.
Save this analysis. We'll revisit it next week and compare the scenario with what actually happened.
$BTC
{spot}(BTCUSDT)
$BTC : A Head-and-Shoulders Breakdown Could Put $62K in Play
Bitcoin may be developing a classic head-and-shoulders breakdown, with the recent bullish recovery potentially turning into a bull trap.
The key isn't the pattern's appearance. It's whether BTC breaks the neckline and fails to reclaim it.
If that happens, bearish momentum could accelerate, putting $62,000 on the radar as a potential downside target.
¿Podría ocurrir en los próximos 12 días? Es posible, pero el mercado todavía tiene que confirmar esa ruptura. No hay garantía de que el movimiento ocurra en ese plazo.
A strong recovery above the neckline would weaken the bearish thesis.
Save this analysis. We'll revisit it next week and compare the scenario with what actually happened.
$BTC
Bitcoin may be developing a classic head-and-shoulders breakdown, with the recent bullish recovery potentially turning into a bull trap.
The key isn't the pattern's appearance. It's whether BTC breaks the neckline and fails to reclaim it.
If that happens, bearish momentum could accelerate, putting $62,000 on the radar as a potential downside target.
¿Podría ocurrir en los próximos 12 días? Es posible, pero el mercado todavía tiene que confirmar esa ruptura. No hay garantía de que el movimiento ocurra en ese plazo.
A strong recovery above the neckline would weaken the bearish thesis.
Save this analysis. We'll revisit it next week and compare the scenario with what actually happened.
$BTC
189
·
--
Жоғары (өспелі)
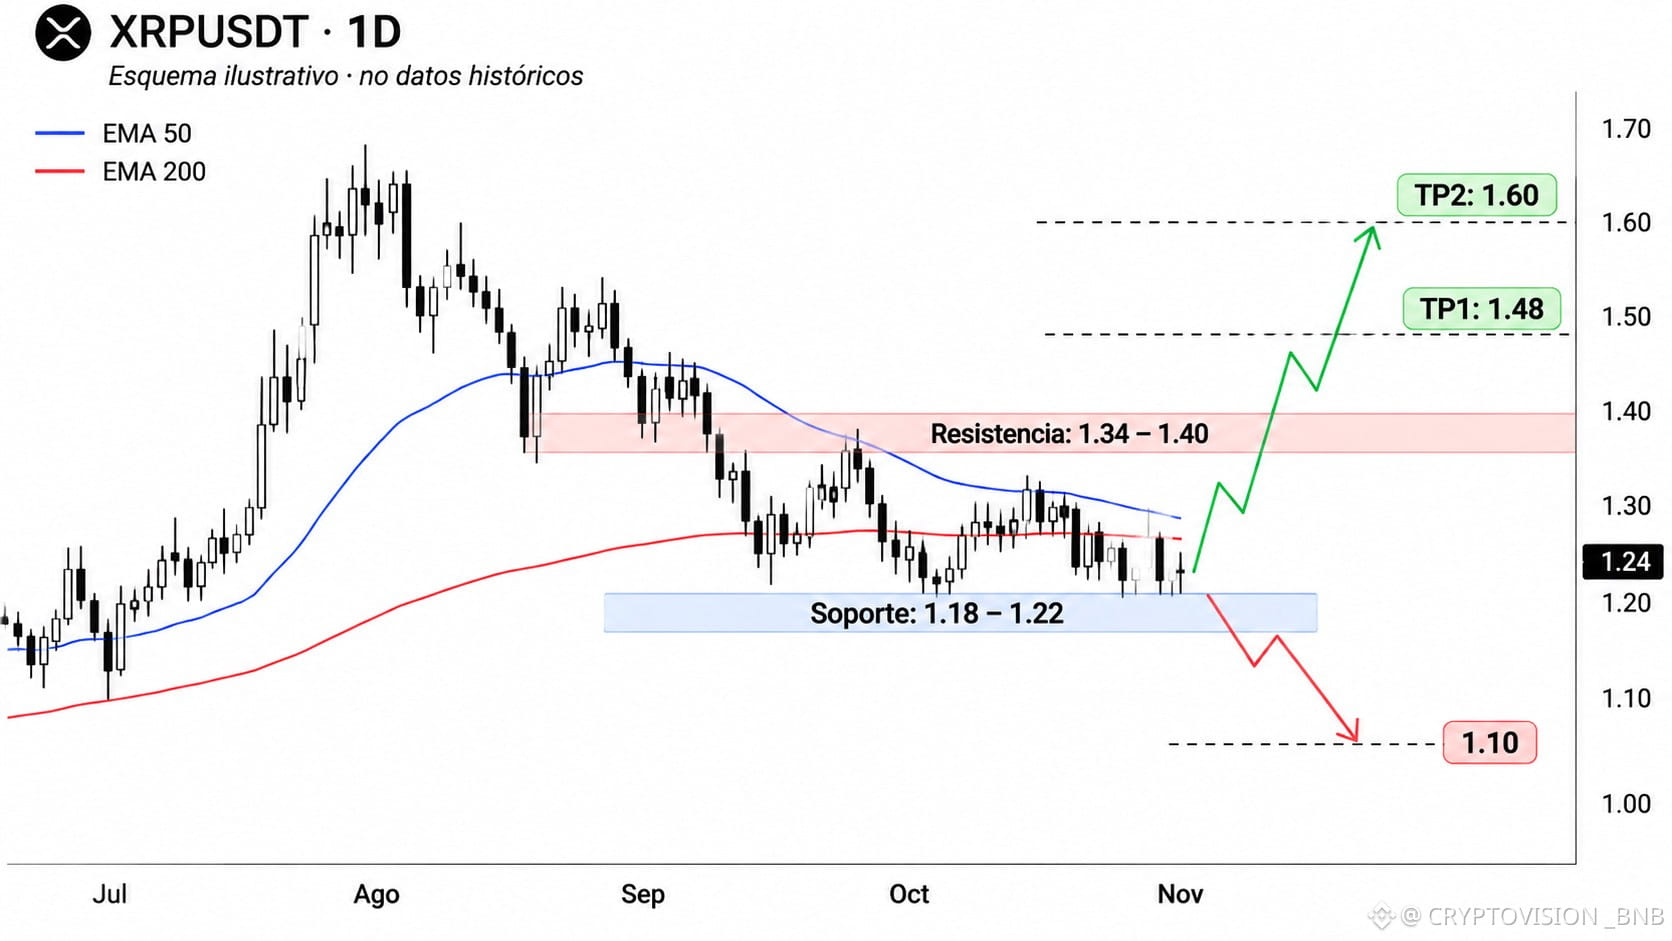
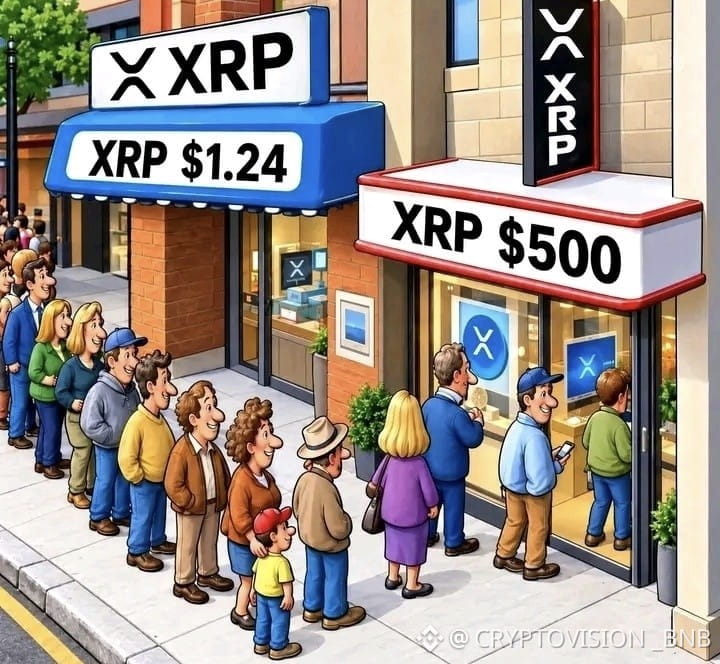
$XRP at $1.24 vs. $500: How Strong Are Your Diamond Hands?
XRP is trading around $1.24, and long-term holders are still debating its future.
But imagine a hypothetical scenario where XRP reaches $500.
Would you really hold through every rally and correction, or would you take profits long before that?
Let's put that number into perspective: at roughly 63.35 billion XRP circulating, a $500 price would imply a market capitalization above $31 trillion.
Es un escenario extremadamente especulativo, no una predicción.
Holding is easy to talk about. Knowing when to take profits is a different challenge.
Be realistic: at what price would you sell your first XRP?
$3, $5, $10, or would you keep holding?
$XRP
{spot}(XRPUSDT)
$XRP at $1.24 vs. $500: How Strong Are Your Diamond Hands?
XRP is trading around $1.24, and long-term holders are still debating its future.
But imagine a hypothetical scenario where XRP reaches $500.
Would you really hold through every rally and correction, or would you take profits long before that?
Let's put that number into perspective: at roughly 63.35 billion XRP circulating, a $500 price would imply a market capitalization above $31 trillion.
Es un escenario extremadamente especulativo, no una predicción.
Holding is easy to talk about. Knowing when to take profits is a different challenge.
Be realistic: at what price would you sell your first XRP?
$3, $5, $10, or would you keep holding?
$XRP
XRP is trading around $1.24, and long-term holders are still debating its future.
But imagine a hypothetical scenario where XRP reaches $500.
Would you really hold through every rally and correction, or would you take profits long before that?
Let's put that number into perspective: at roughly 63.35 billion XRP circulating, a $500 price would imply a market capitalization above $31 trillion.
Es un escenario extremadamente especulativo, no una predicción.
Holding is easy to talk about. Knowing when to take profits is a different challenge.
Be realistic: at what price would you sell your first XRP?
$3, $5, $10, or would you keep holding?
$XRP
2
990
·
--
Жоғары (өспелі)
$ICNT: Strong Bounce, but the Real Test Starts at $0.187
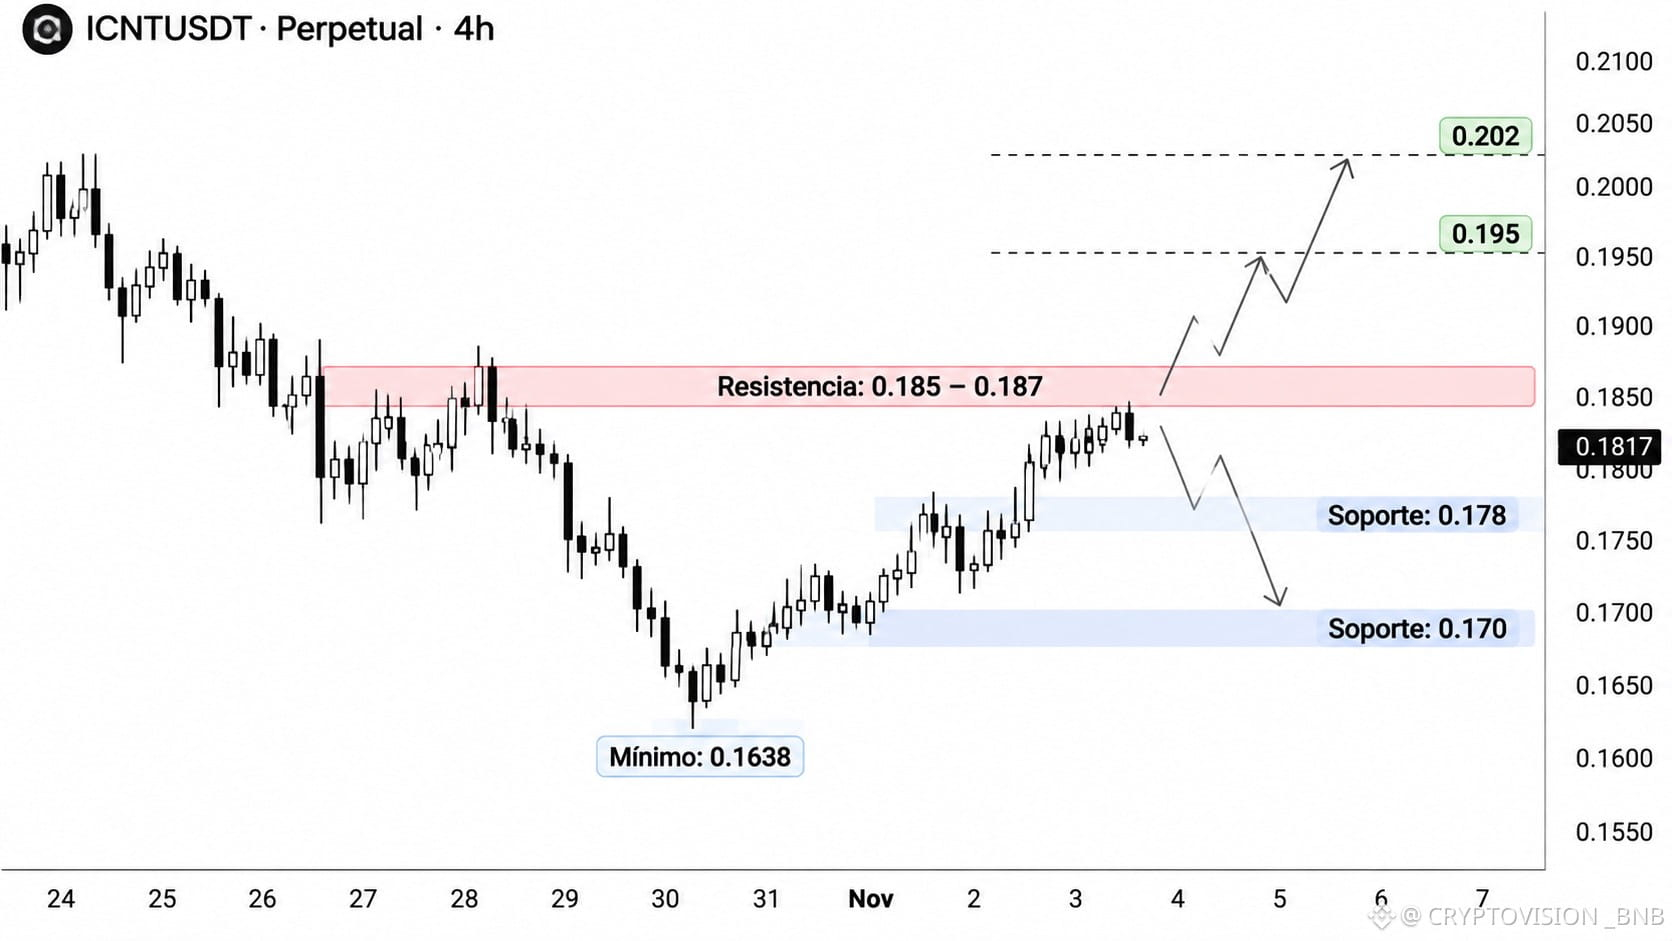
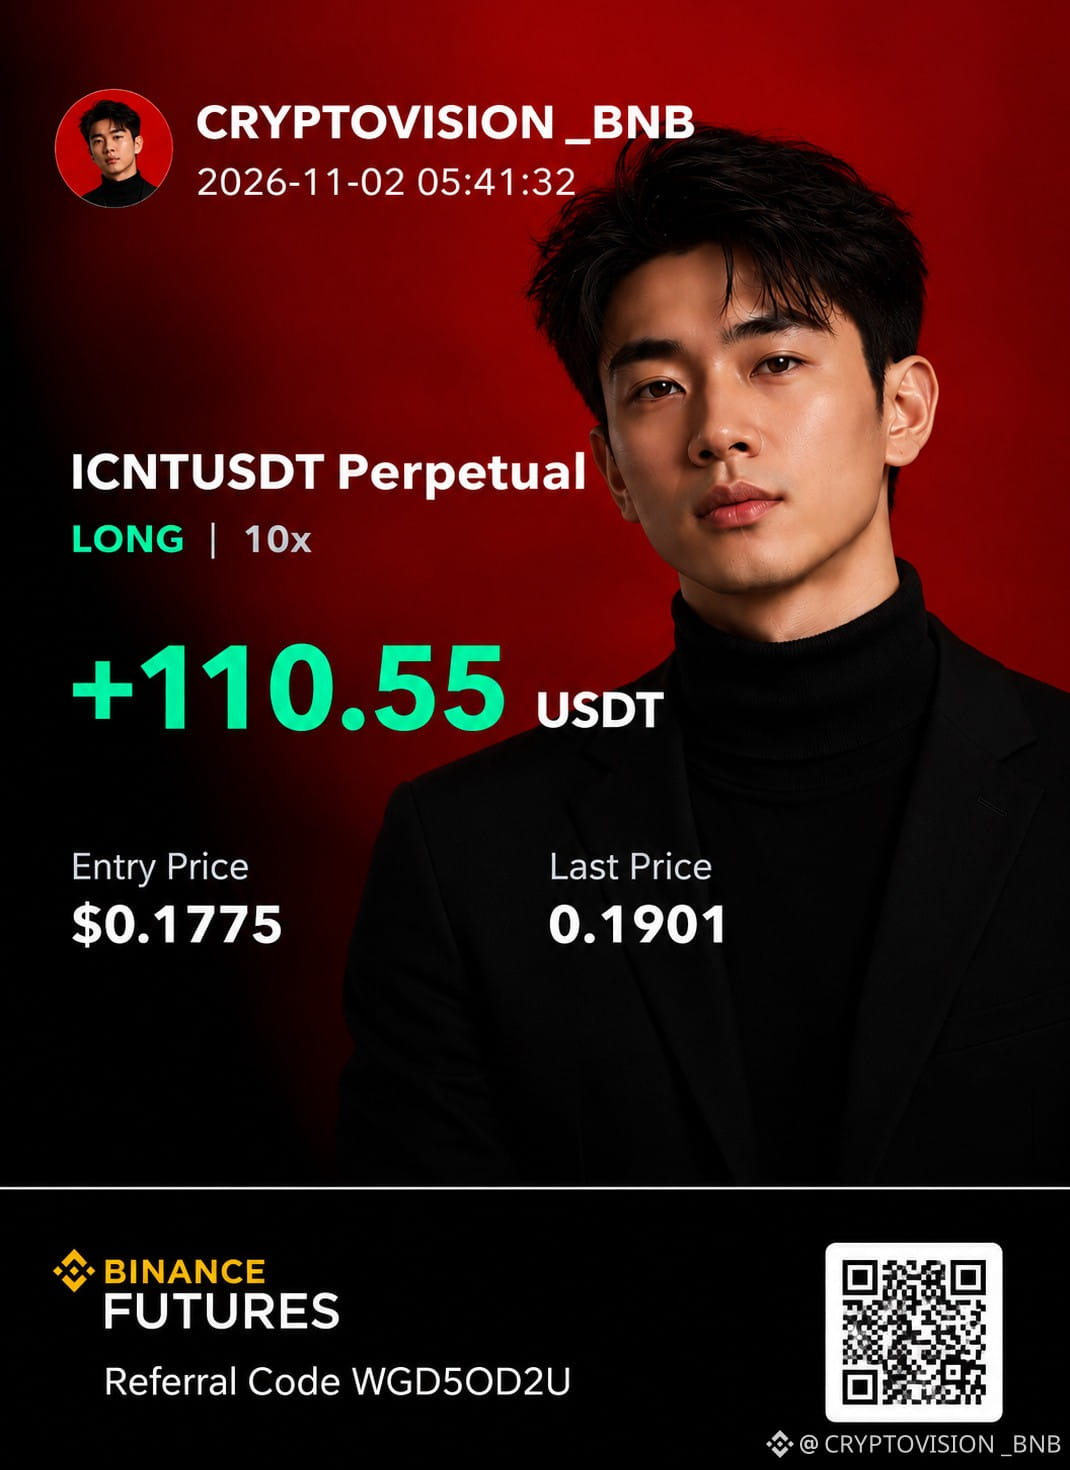
ICNT bounced sharply from $0.1638, and buyers are now testing the $0.185–$0.187 resistance zone.
The recovery looks promising, but I'm not calling it a bullish reversal just yet.
A clean breakout above $0.187 could open the door toward $0.195 and potentially $0.202.
But if sellers defend this area, another pullback toward $0.178–$0.170 remains possible.
That's what makes this level interesting. Both sides have something to prove.
A strong bounce is one thing. Turning resistance into support is another.
I'm waiting to see whether ICNT can hold above $0.187 before getting more bullish.
$ICNT
{future}(ICNTUSDT)
$ICNT : Strong Bounce, but the Real Test Starts at $0.187
ICNT bounced sharply from $0.1638, and buyers are now testing the $0.185–$0.187 resistance zone.
The recovery looks promising, but I'm not calling it a bullish reversal just yet.
A clean breakout above $0.187 could open the door toward $0.195 and potentially $0.202.
But if sellers defend this area, another pullback toward $0.178–$0.170 remains possible.
That's what makes this level interesting. Both sides have something to prove.
A strong bounce is one thing. Turning resistance into support is another.
I'm waiting to see whether ICNT can hold above $0.187 before getting more bullish.
$ICNT
ICNT bounced sharply from $0.1638, and buyers are now testing the $0.185–$0.187 resistance zone.
The recovery looks promising, but I'm not calling it a bullish reversal just yet.
A clean breakout above $0.187 could open the door toward $0.195 and potentially $0.202.
But if sellers defend this area, another pullback toward $0.178–$0.170 remains possible.
That's what makes this level interesting. Both sides have something to prove.
A strong bounce is one thing. Turning resistance into support is another.
I'm waiting to see whether ICNT can hold above $0.187 before getting more bullish.
$ICNT
109
·
--
Жоғары (өспелі)
$ARB: Three Years of Decline… Could This Be the Accumulation Opportunity?
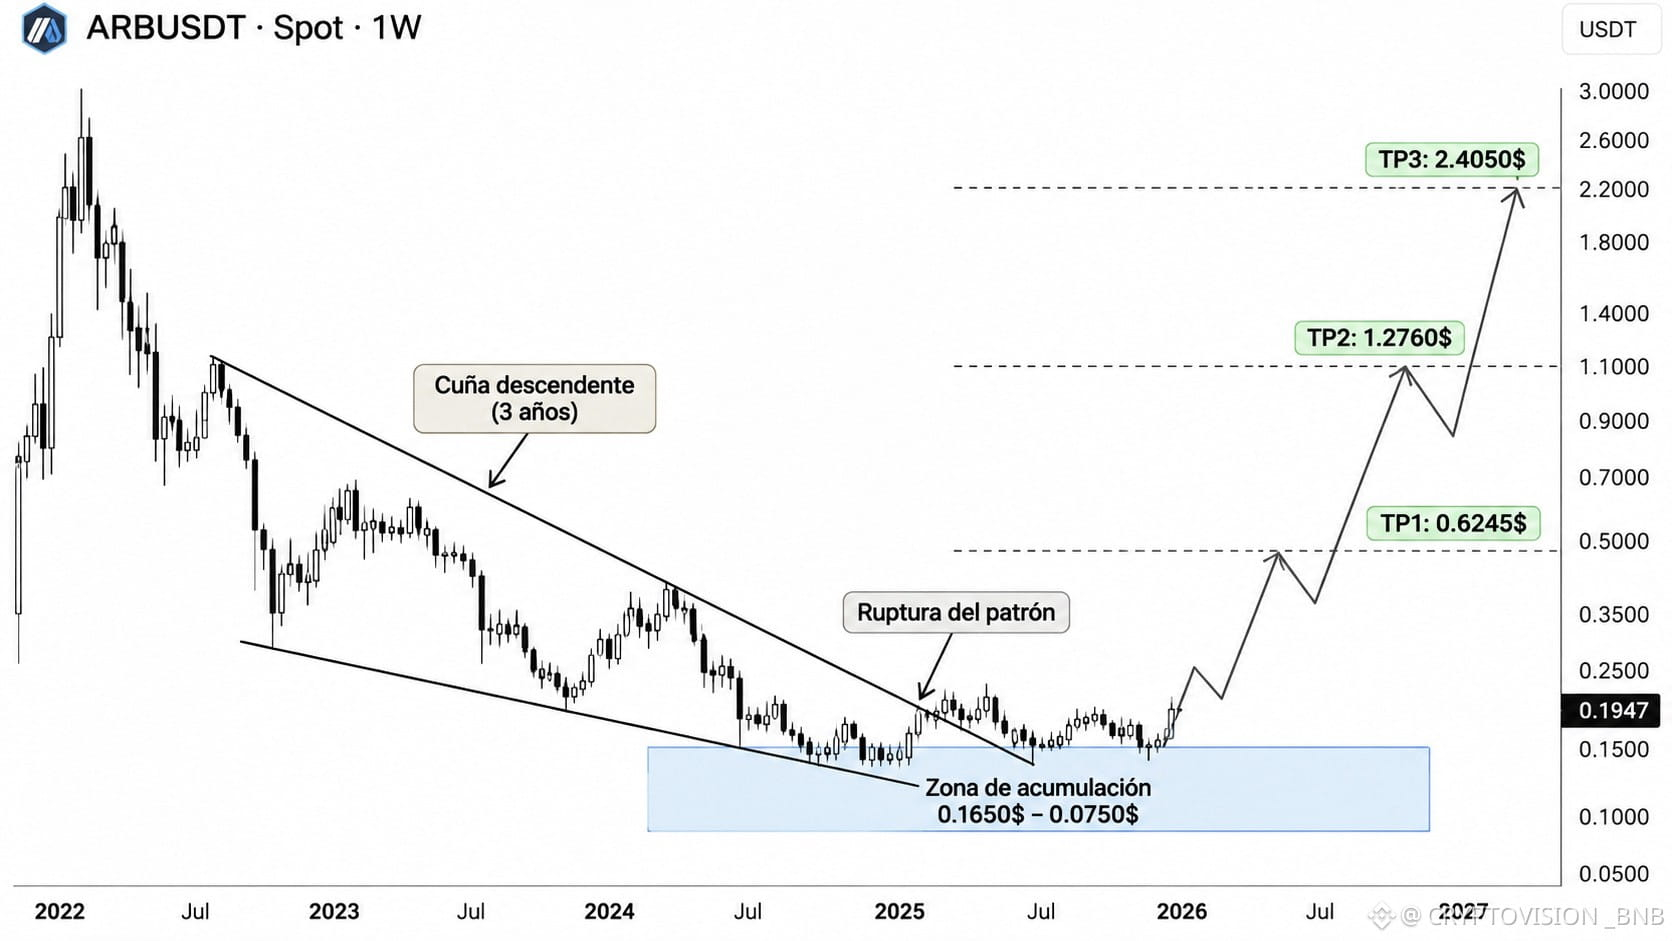
Arbitrum has spent years under bearish pressure, but its long-term structure is becoming interesting.
After a prolonged descending wedge, ARB may be entering an accumulation phase. If the breakout holds, the potential recovery could be substantial.
I'm watching $0.0750–$0.1650 as a possible spot accumulation zone.
My long-term targets:
TP1: $0.6245
TP2: $1.2760
TP3: $2.4050
Why ARB?
Beyond the chart, Arbitrum has exposure to several important Ethereum ecosystem trends: Layer 2 scaling, DeFi, tokenized real-world assets and the expansion of Arbitrum Orbit.
These developments could support long-term adoption, although ecosystem growth doesn't automatically translate into higher token prices.
The final target would represent an increase of roughly 1,357% from $0.1650, or 3,107% from $0.0750. That's significant upside potential, but also a highly speculative scenario—not a guaranteed return.
I'm approaching this as a long-term spot thesis, not a leveraged trade. A failed breakout or continued weakness would require reassessing the accumulation plan.
Three years of selling pressure. A possible structural shift. Now the question is whether buyers can sustain it.
Is $ARB undervalued, or does the market still see risks that bulls are overlooking?
$ARB
{spot}(ARBUSDT)
$ARB : Three Years of Decline… Could This Be the Accumulation Opportunity?
Arbitrum has spent years under bearish pressure, but its long-term structure is becoming interesting.
After a prolonged descending wedge, ARB may be entering an accumulation phase. If the breakout holds, the potential recovery could be substantial.
I'm watching $0.0750–$0.1650 as a possible spot accumulation zone.
My long-term targets:
TP1: $0.6245
TP2: $1.2760
TP3: $2.4050
Why ARB?
Beyond the chart, Arbitrum has exposure to several important Ethereum ecosystem trends: Layer 2 scaling, DeFi, tokenized real-world assets and the expansion of Arbitrum Orbit.
These developments could support long-term adoption, although ecosystem growth doesn't automatically translate into higher token prices.
The final target would represent an increase of roughly 1,357% from $0.1650, or 3,107% from $0.0750. That's significant upside potential, but also a highly speculative scenario—not a guaranteed return.
I'm approaching this as a long-term spot thesis, not a leveraged trade. A failed breakout or continued weakness would require reassessing the accumulation plan.
Three years of selling pressure. A possible structural shift. Now the question is whether buyers can sustain it.
Is $ARB undervalued, or does the market still see risks that bulls are overlooking?
$ARB
Arbitrum has spent years under bearish pressure, but its long-term structure is becoming interesting.
After a prolonged descending wedge, ARB may be entering an accumulation phase. If the breakout holds, the potential recovery could be substantial.
I'm watching $0.0750–$0.1650 as a possible spot accumulation zone.
My long-term targets:
TP1: $0.6245
TP2: $1.2760
TP3: $2.4050
Why ARB?
Beyond the chart, Arbitrum has exposure to several important Ethereum ecosystem trends: Layer 2 scaling, DeFi, tokenized real-world assets and the expansion of Arbitrum Orbit.
These developments could support long-term adoption, although ecosystem growth doesn't automatically translate into higher token prices.
The final target would represent an increase of roughly 1,357% from $0.1650, or 3,107% from $0.0750. That's significant upside potential, but also a highly speculative scenario—not a guaranteed return.
I'm approaching this as a long-term spot thesis, not a leveraged trade. A failed breakout or continued weakness would require reassessing the accumulation plan.
Three years of selling pressure. A possible structural shift. Now the question is whether buyers can sustain it.
Is $ARB undervalued, or does the market still see risks that bulls are overlooking?
$ARB
245
·
--
Жоғары (өспелі)
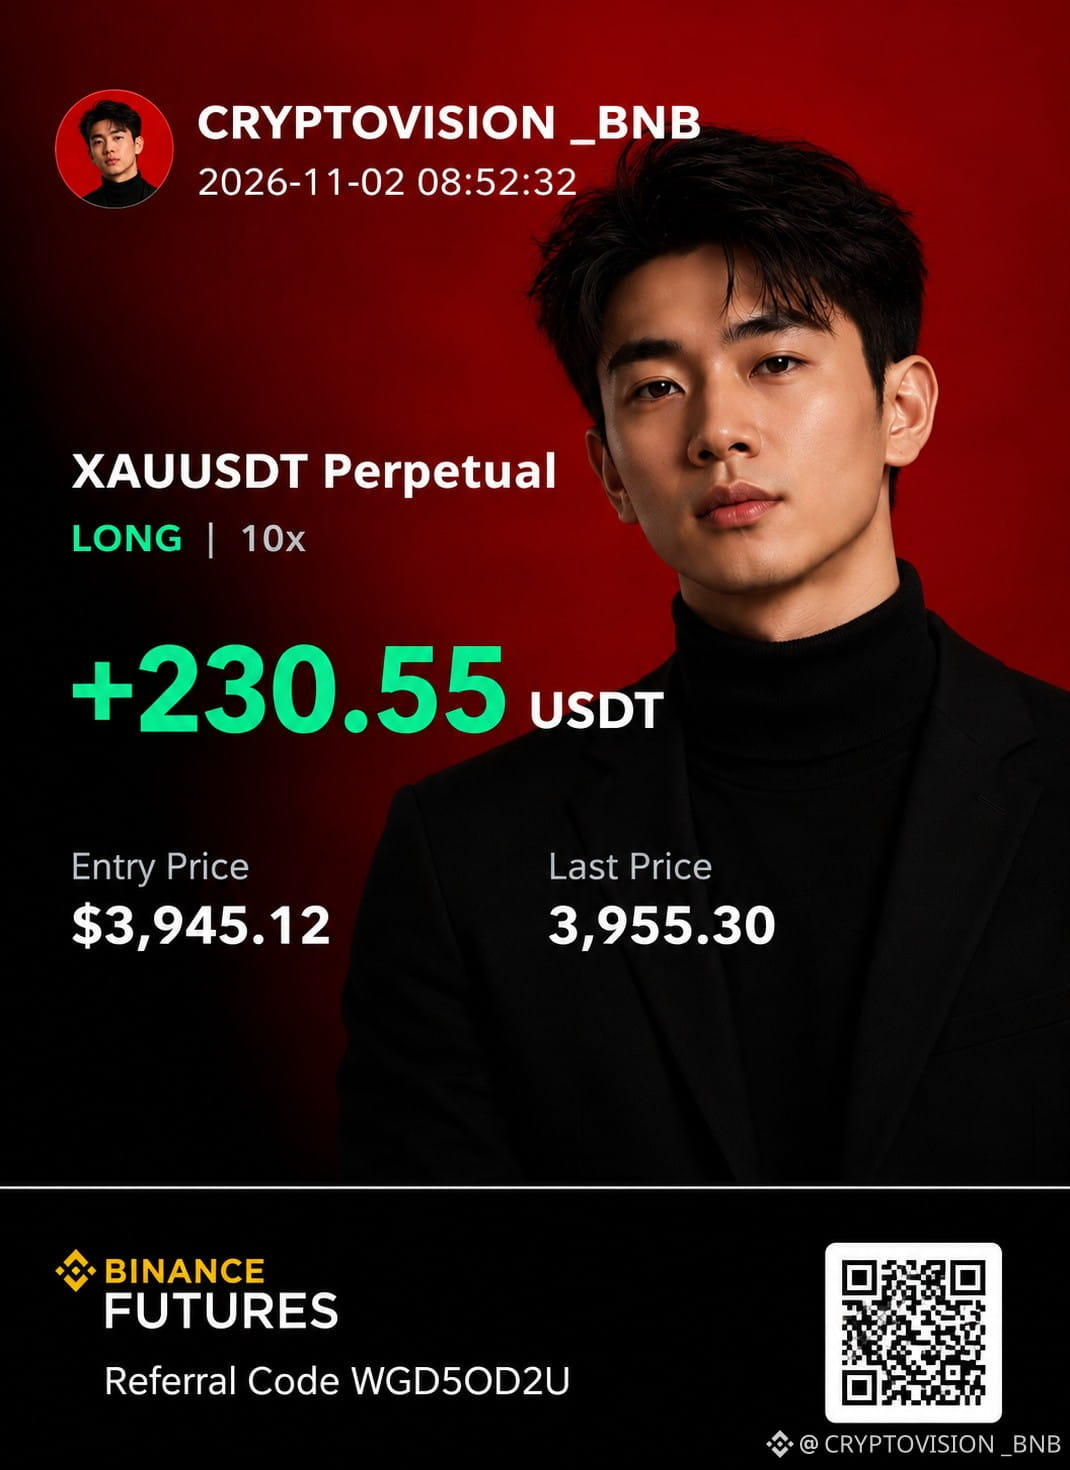
$XAU — Buyers Are Finally Showing Some Strength
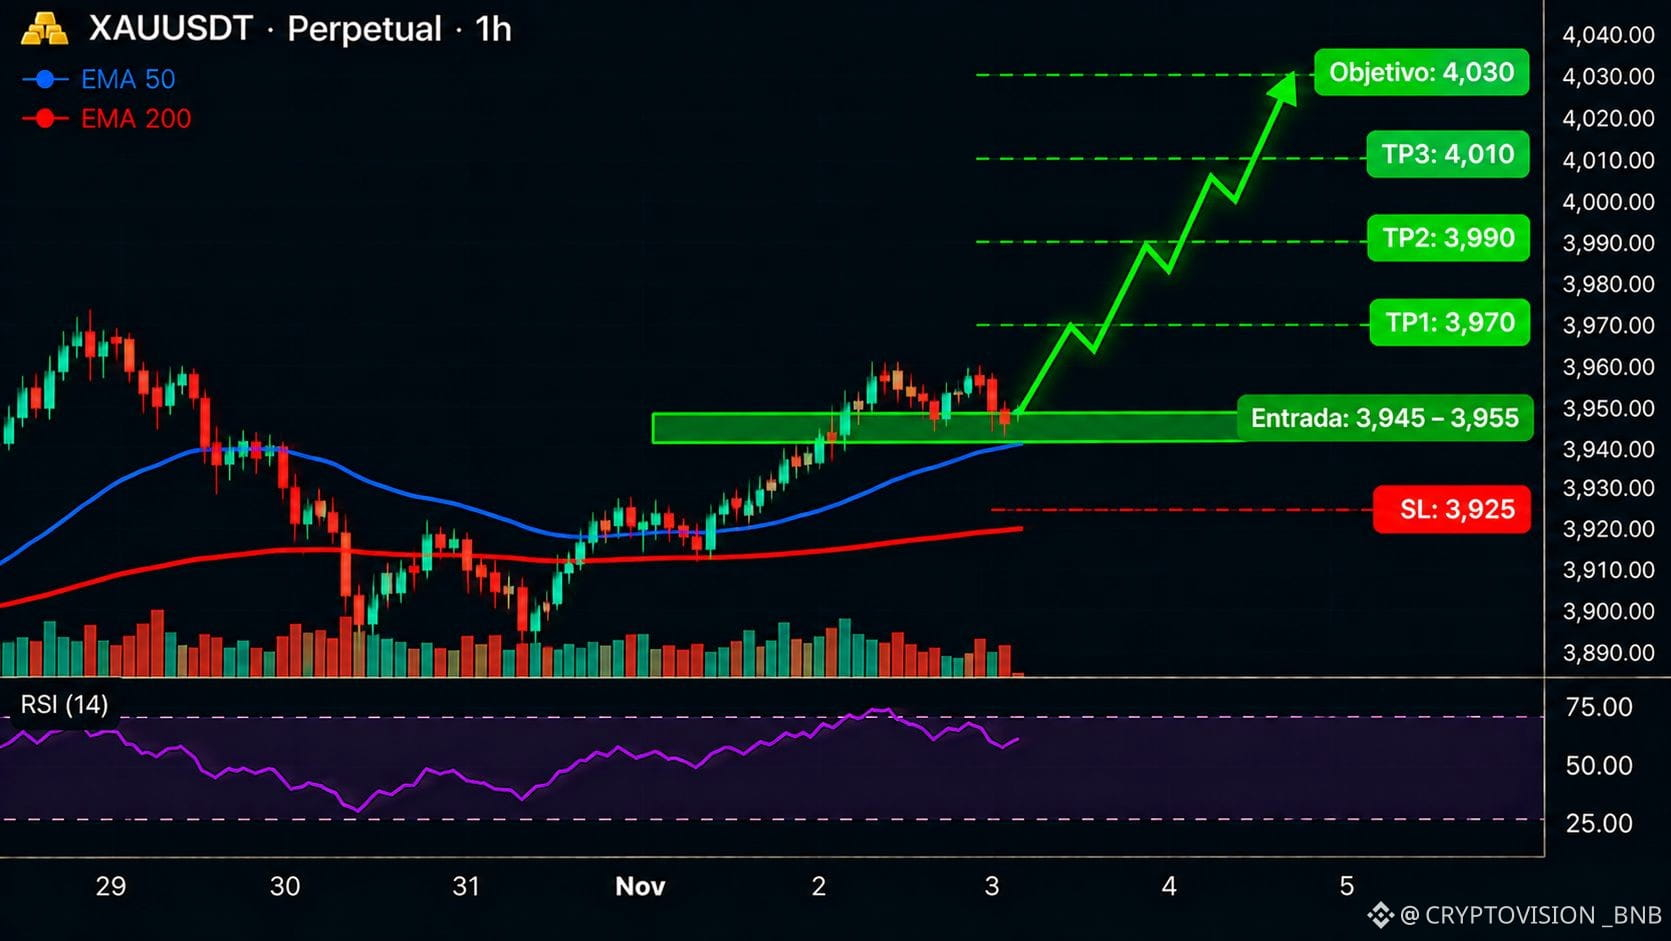
Gold is reacting around the $3,950 area, and this is exactly where I'm looking for a potential bullish continuation.
I'm watching $3,945–$3,955 for a LONG entry, with $3,925 as my invalidation level.
If buyers hold this zone, my upside targets are $3,970, $3,990, $4,010 and potentially $4,030.
The $3,935–$3,925 support area is important here. Lose that, and the setup changes.
I'm not rushing into 20x leverage without confirmation. The reaction at support matters more than predicting the next candle.
$4,000 is the level I'm watching most closely.
$XAU
{future}(XAUUSDT)
$XAU — Buyers Are Finally Showing Some Strength
Gold is reacting around the $3,950 area, and this is exactly where I'm looking for a potential bullish continuation.
I'm watching $3,945–$3,955 for a LONG entry, with $3,925 as my invalidation level.
If buyers hold this zone, my upside targets are $3,970, $3,990, $4,010 and potentially $4,030.
The $3,935–$3,925 support area is important here. Lose that, and the setup changes.
I'm not rushing into 20x leverage without confirmation. The reaction at support matters more than predicting the next candle.
$4,000 is the level I'm watching most closely.
$XAU
Gold is reacting around the $3,950 area, and this is exactly where I'm looking for a potential bullish continuation.
I'm watching $3,945–$3,955 for a LONG entry, with $3,925 as my invalidation level.
If buyers hold this zone, my upside targets are $3,970, $3,990, $4,010 and potentially $4,030.
The $3,935–$3,925 support area is important here. Lose that, and the setup changes.
I'm not rushing into 20x leverage without confirmation. The reaction at support matters more than predicting the next candle.
$4,000 is the level I'm watching most closely.
$XAU
92
·
--
Жоғары (өспелі)
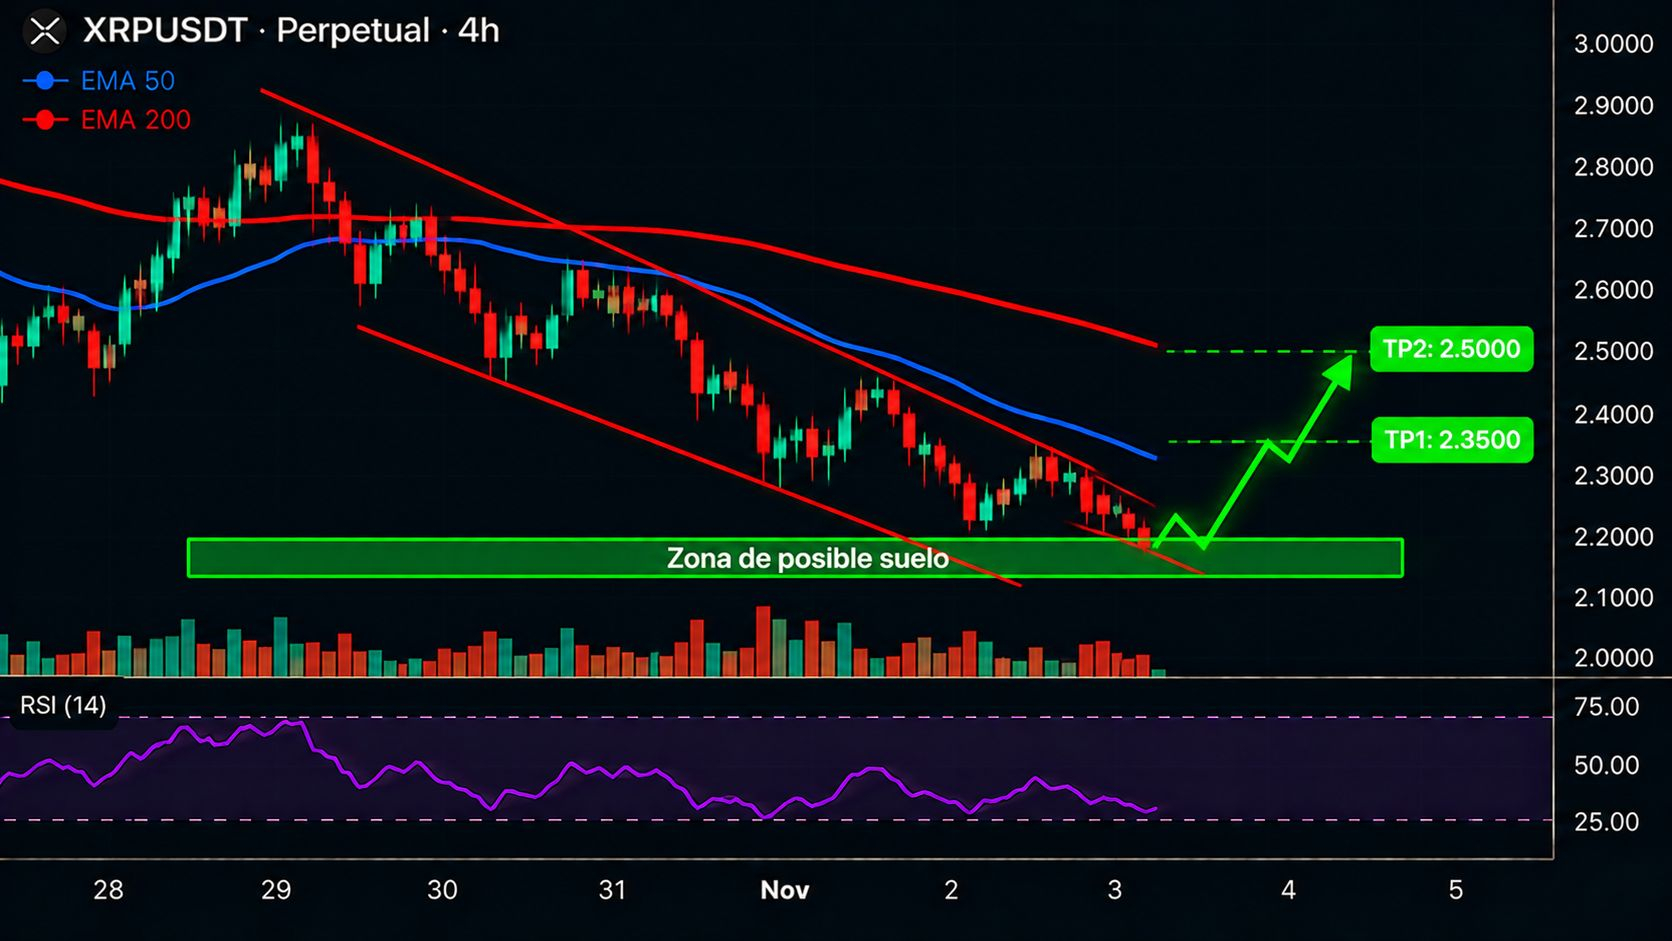
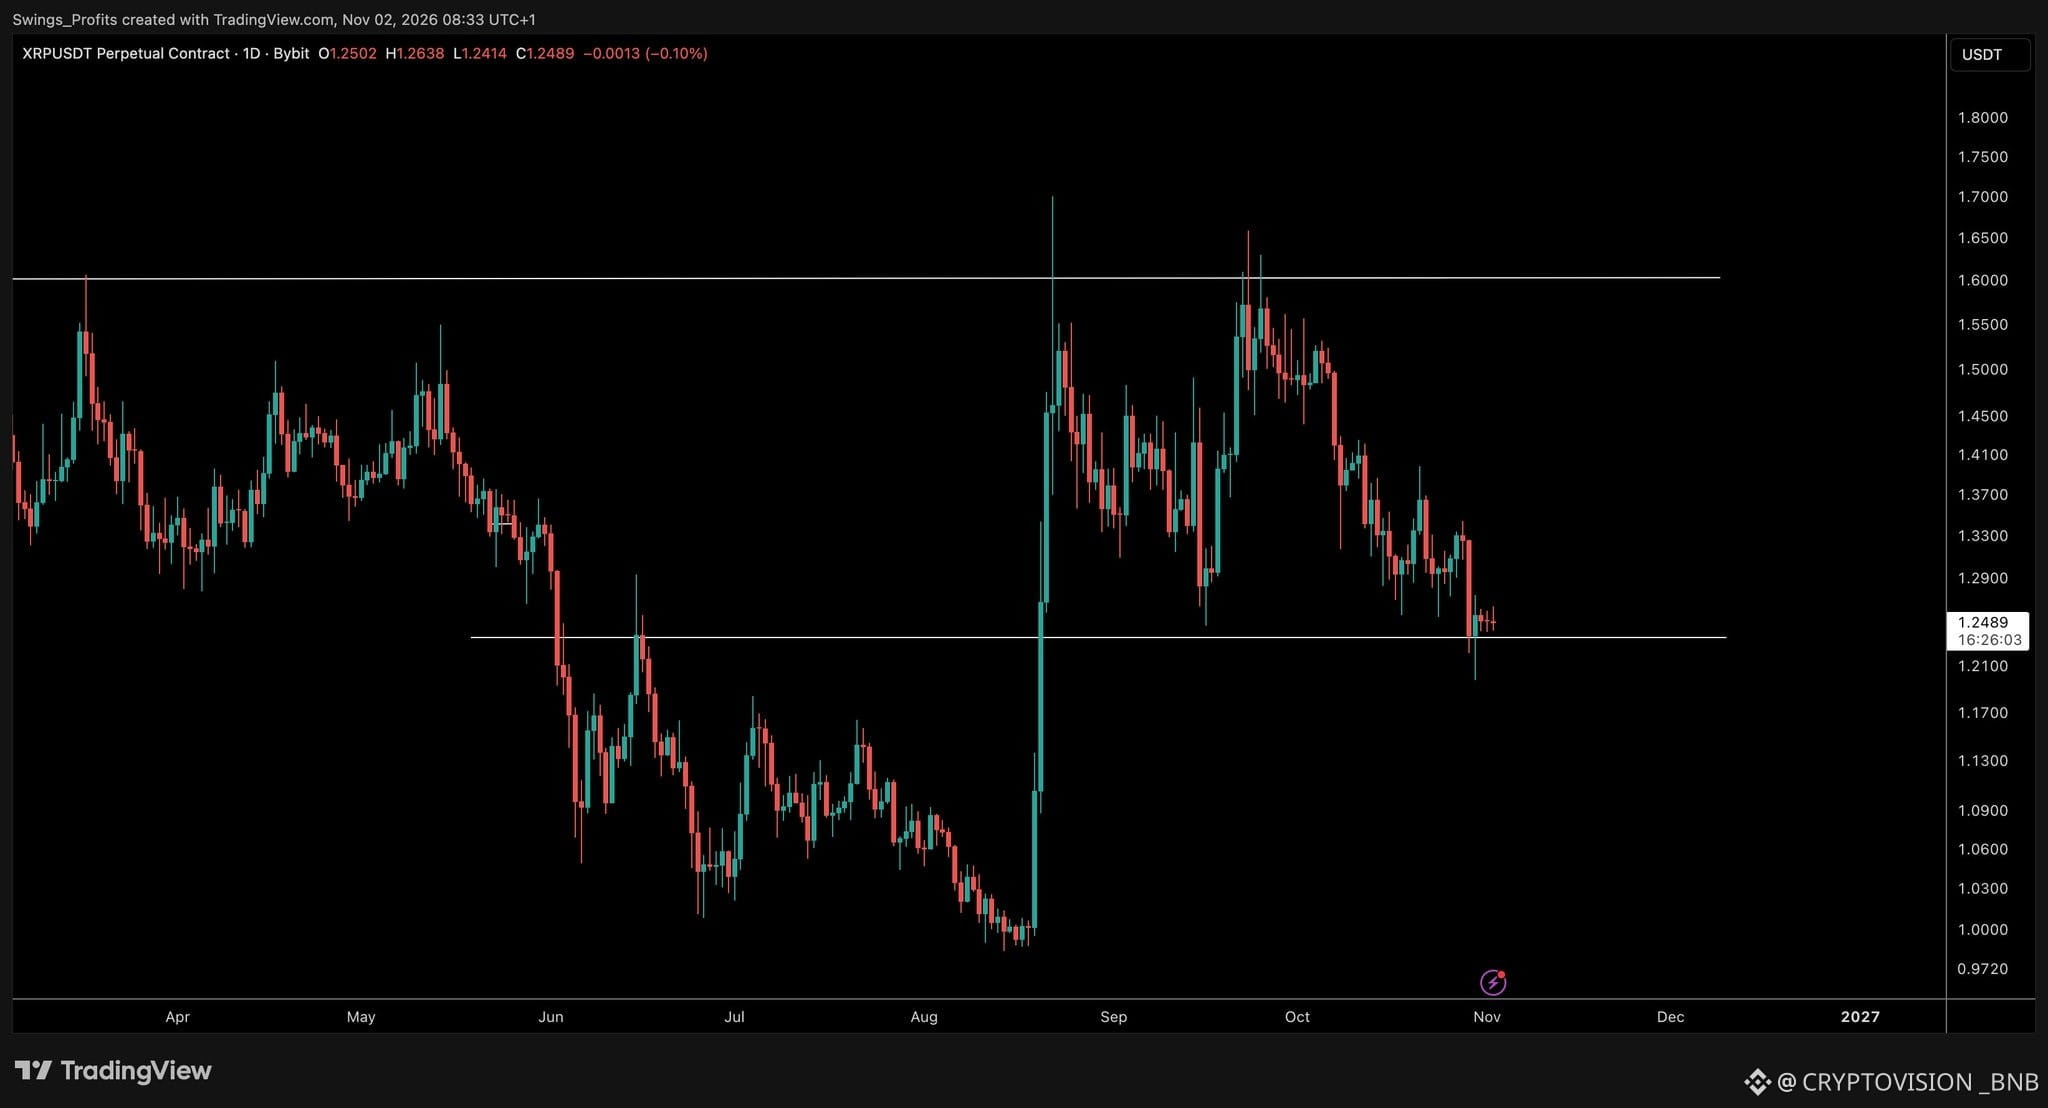
$XRP: Is This the Perfect Zone for a Market Bottom?
XRP is approaching an area where a potential bullish reversal could begin.
After recent selling pressure, this could become an important zone for buyers to defend.
What I'm Watching:
- A strong reaction from key support.
- Increasing buying volume.
- Bullish confirmation before considering a LONG.
- A successful retest that strengthens the recovery scenario.
A bounce alone doesn't confirm the bottom. If support breaks, XRP could face another wave of selling.
I'm watching for confirmation, not trying to catch the exact bottom.
Do you think $XRP has finally found its bottom, or is another drop coming?
Share your outlook below and follow CryptoVision for more technical analysis and market updates.
$XRP
{spot}(XRPUSDT)
$XRP : Is This the Perfect Zone for a Market Bottom?
XRP is approaching an area where a potential bullish reversal could begin.
After recent selling pressure, this could become an important zone for buyers to defend.
What I'm Watching:
- A strong reaction from key support.
- Increasing buying volume.
- Bullish confirmation before considering a LONG.
- A successful retest that strengthens the recovery scenario.
A bounce alone doesn't confirm the bottom. If support breaks, XRP could face another wave of selling.
I'm watching for confirmation, not trying to catch the exact bottom.
Do you think $XRP has finally found its bottom, or is another drop coming?
Share your outlook below and follow CryptoVision for more technical analysis and market updates.
$XRP
XRP is approaching an area where a potential bullish reversal could begin.
After recent selling pressure, this could become an important zone for buyers to defend.
What I'm Watching:
- A strong reaction from key support.
- Increasing buying volume.
- Bullish confirmation before considering a LONG.
- A successful retest that strengthens the recovery scenario.
A bounce alone doesn't confirm the bottom. If support breaks, XRP could face another wave of selling.
I'm watching for confirmation, not trying to catch the exact bottom.
Do you think $XRP has finally found its bottom, or is another drop coming?
Share your outlook below and follow CryptoVision for more technical analysis and market updates.
$XRP
171
·
--
Жоғары (өспелі)
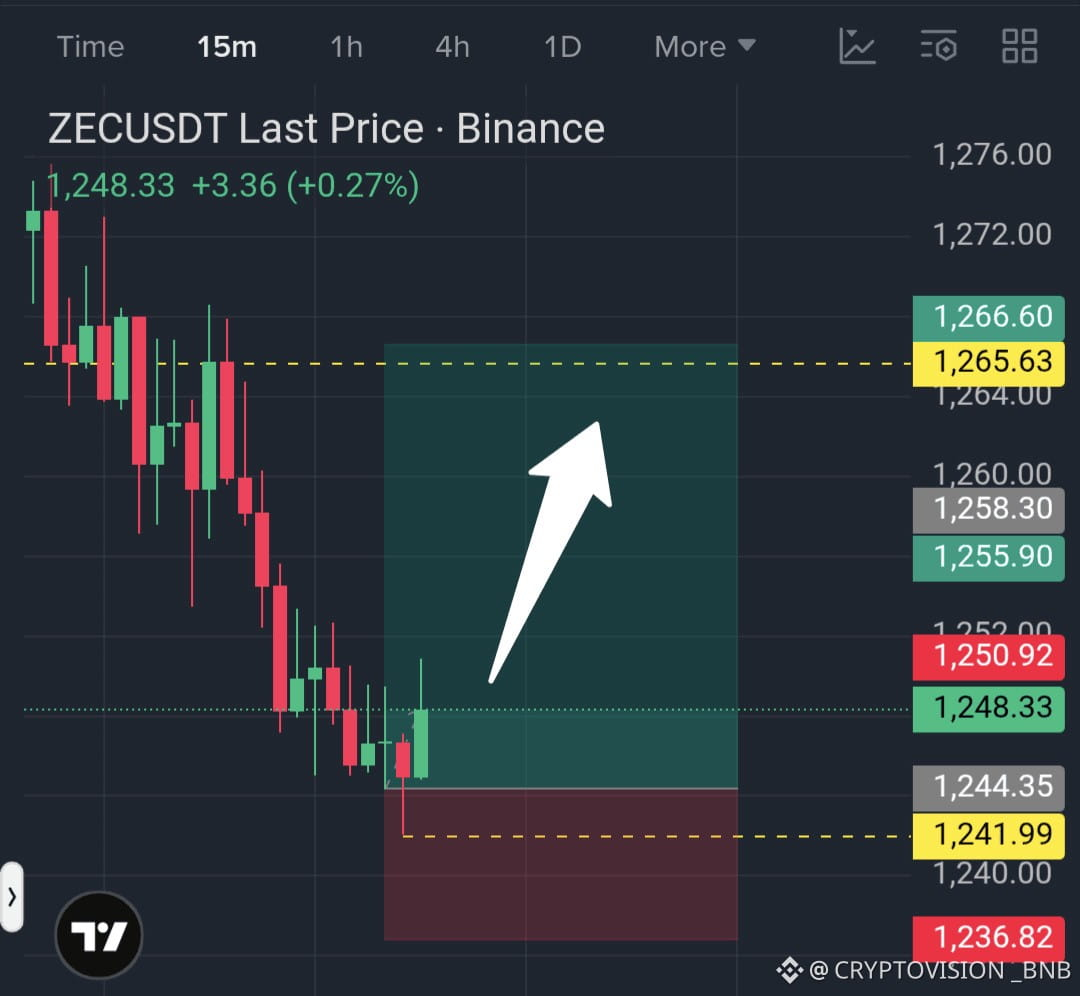
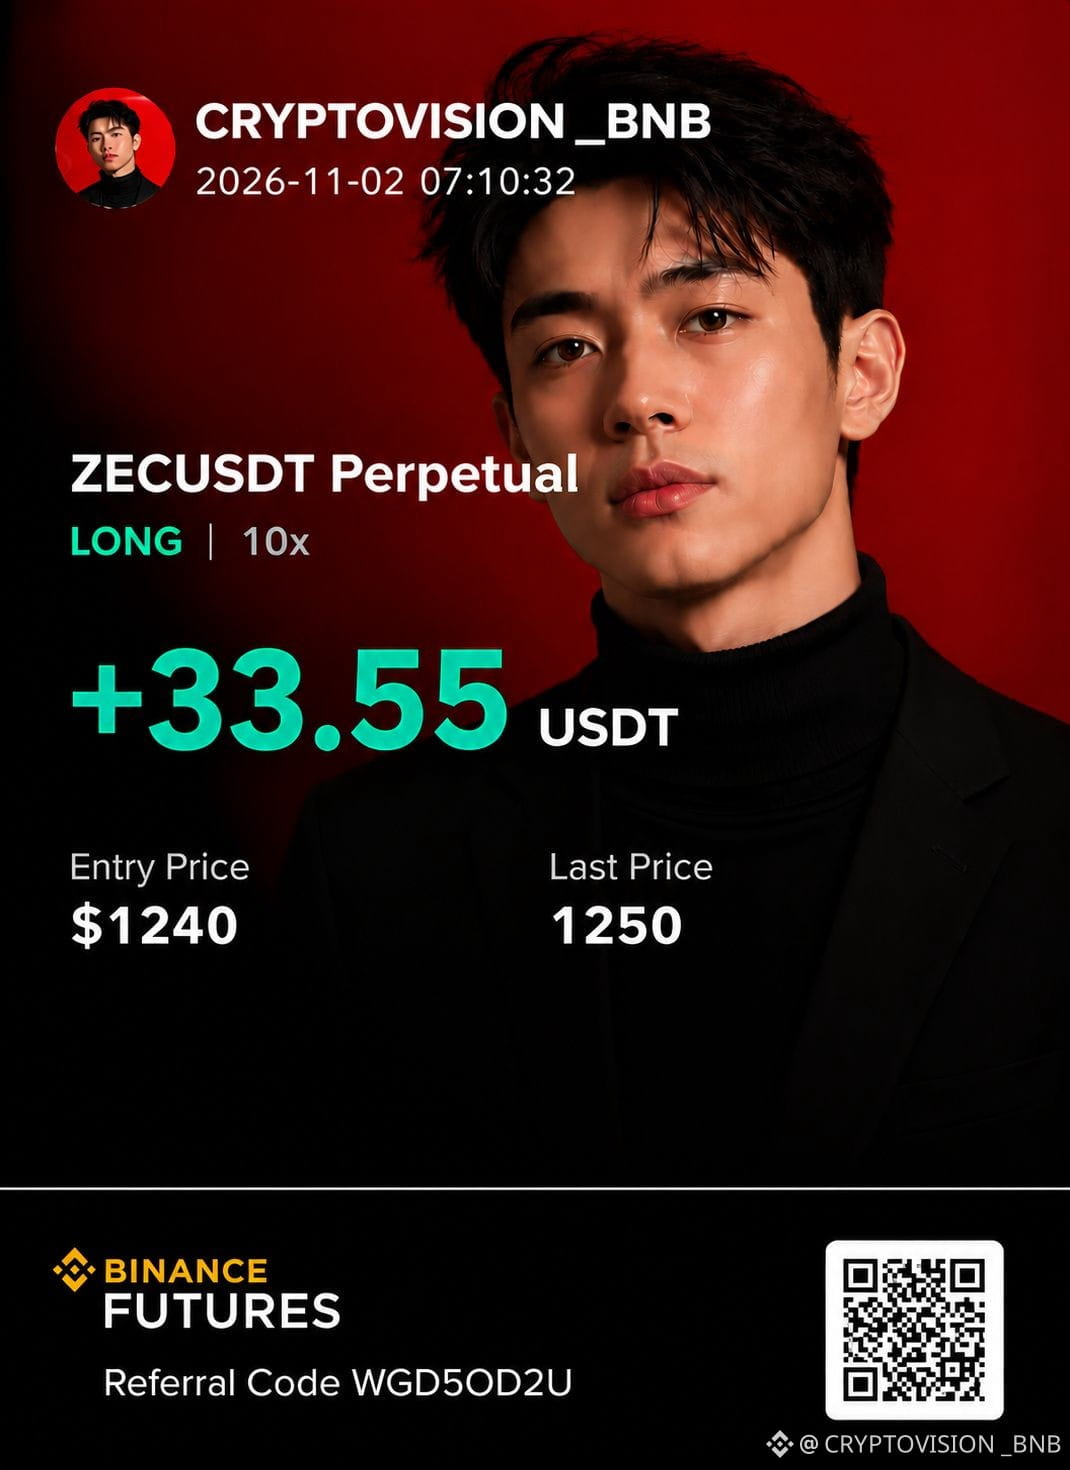
$ZEC: Bullish Rebound Ahead? Buyers Are Defending Key Support
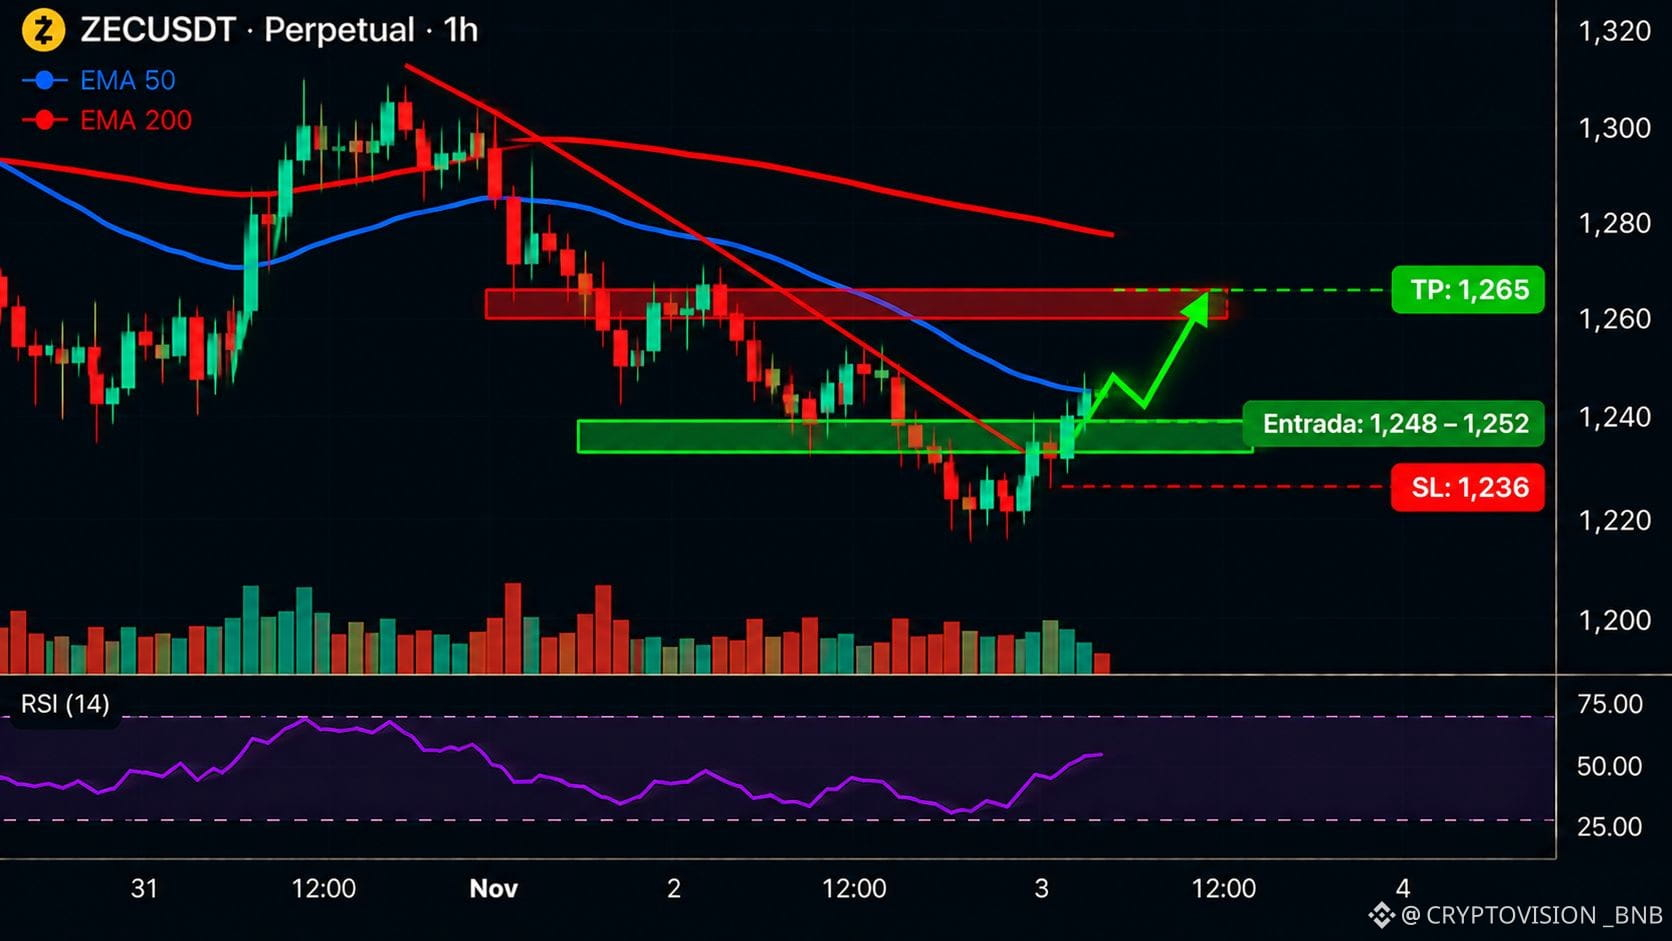
Zcash is approaching an interesting LONG opportunity as buyers attempt to defend a lower support zone.
ZEC/USDT — LONG Setup
- Direction: LONG
- Take Profit: $1,265
- Stop Loss: $1,236
- Entry: Wait for confirmation near support
- Target Liquidity Zone: $1,260–$1,265
Why I'm Watching This Setup
The idea is simple: price is testing lower support, where buyers may be starting to react.
Above the current area, the $1,260–$1,265 region is my proposed liquidity target.
If support holds and bullish momentum strengthens, ZEC could attempt a short-term recovery toward that zone.
But here's the important part:
The broader trend remains a concern. This is a potential countertrend rebound, not confirmation of a complete bullish reversal.
I'm focused on a controlled move from support toward overhead liquidity, with clearly defined risk.
Avoid oversized positions and wait for confirmation before entering.
Will $ZEC reach $1,265, or will sellers break support first?
Share your outlook below and follow CryptoVision for more technical analysis and trading setups.
$ZEC
{spot}(ZECUSDT)
$ZEC : Bullish Rebound Ahead? Buyers Are Defending Key Support
Zcash is approaching an interesting LONG opportunity as buyers attempt to defend a lower support zone.
ZEC/USDT — LONG Setup
- Direction: LONG
- Take Profit: $1,265
- Stop Loss: $1,236
- Entry: Wait for confirmation near support
- Target Liquidity Zone: $1,260–$1,265
Why I'm Watching This Setup
The idea is simple: price is testing lower support, where buyers may be starting to react.
Above the current area, the $1,260–$1,265 region is my proposed liquidity target.
If support holds and bullish momentum strengthens, ZEC could attempt a short-term recovery toward that zone.
But here's the important part:
The broader trend remains a concern. This is a potential countertrend rebound, not confirmation of a complete bullish reversal.
I'm focused on a controlled move from support toward overhead liquidity, with clearly defined risk.
Avoid oversized positions and wait for confirmation before entering.
Will $ZEC reach $1,265, or will sellers break support first?
Share your outlook below and follow CryptoVision for more technical analysis and trading setups.
$ZEC
Zcash is approaching an interesting LONG opportunity as buyers attempt to defend a lower support zone.
ZEC/USDT — LONG Setup
- Direction: LONG
- Take Profit: $1,265
- Stop Loss: $1,236
- Entry: Wait for confirmation near support
- Target Liquidity Zone: $1,260–$1,265
Why I'm Watching This Setup
The idea is simple: price is testing lower support, where buyers may be starting to react.
Above the current area, the $1,260–$1,265 region is my proposed liquidity target.
If support holds and bullish momentum strengthens, ZEC could attempt a short-term recovery toward that zone.
But here's the important part:
The broader trend remains a concern. This is a potential countertrend rebound, not confirmation of a complete bullish reversal.
I'm focused on a controlled move from support toward overhead liquidity, with clearly defined risk.
Avoid oversized positions and wait for confirmation before entering.
Will $ZEC reach $1,265, or will sellers break support first?
Share your outlook below and follow CryptoVision for more technical analysis and trading setups.
$ZEC
100
·
--
Төмен (кемімелі)
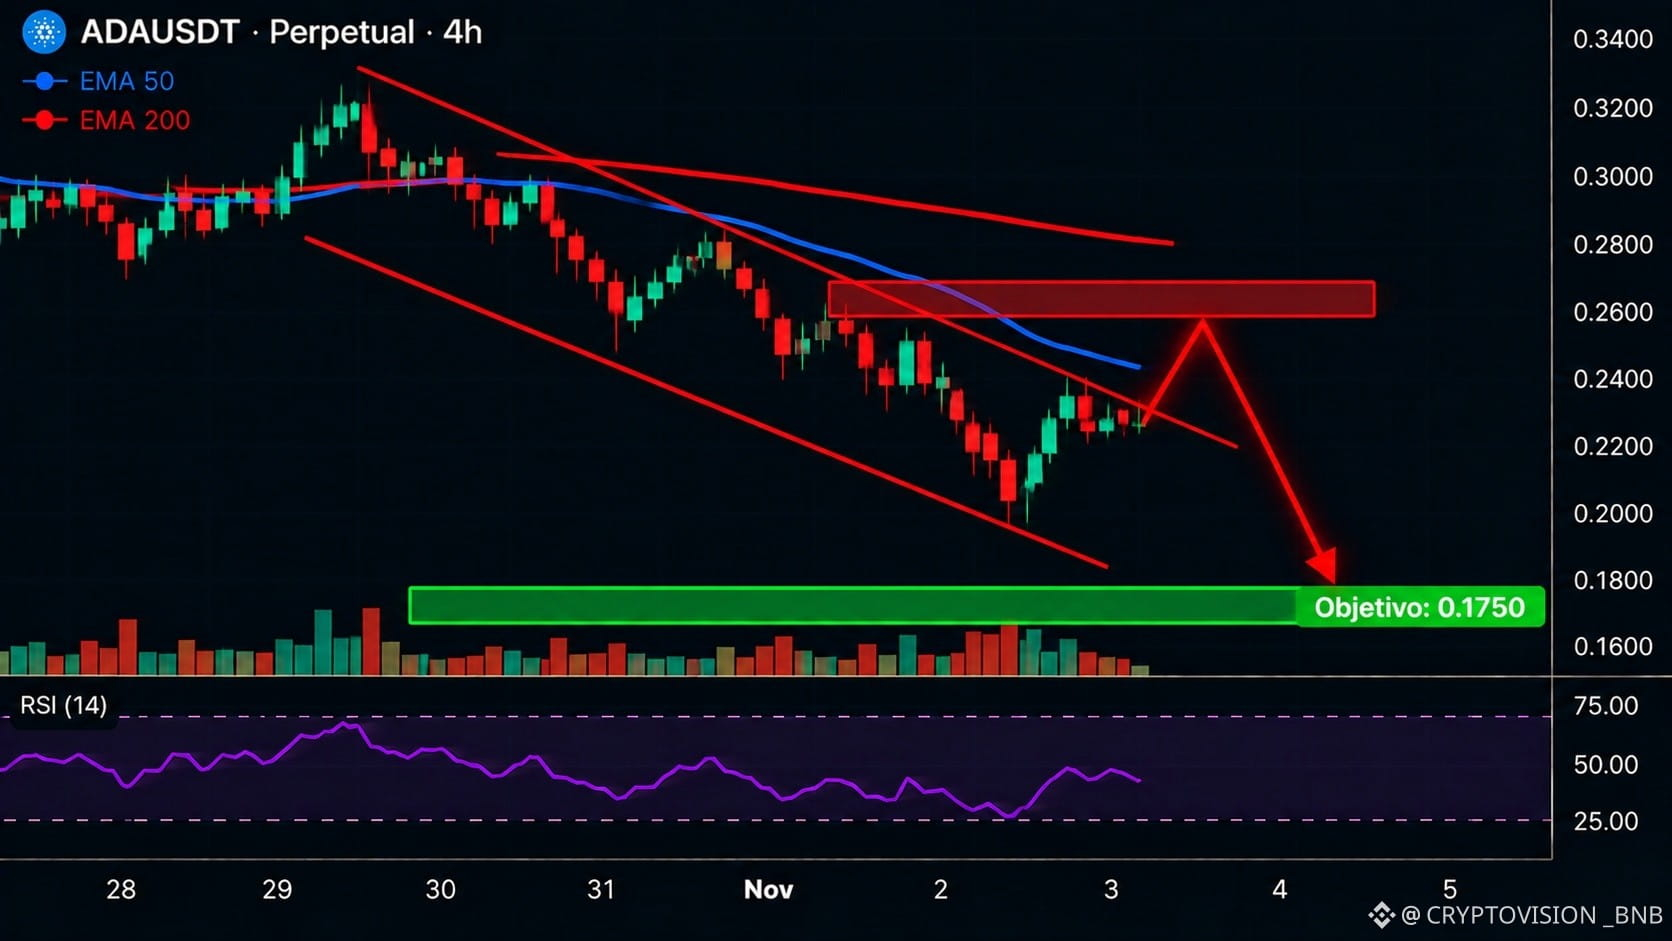
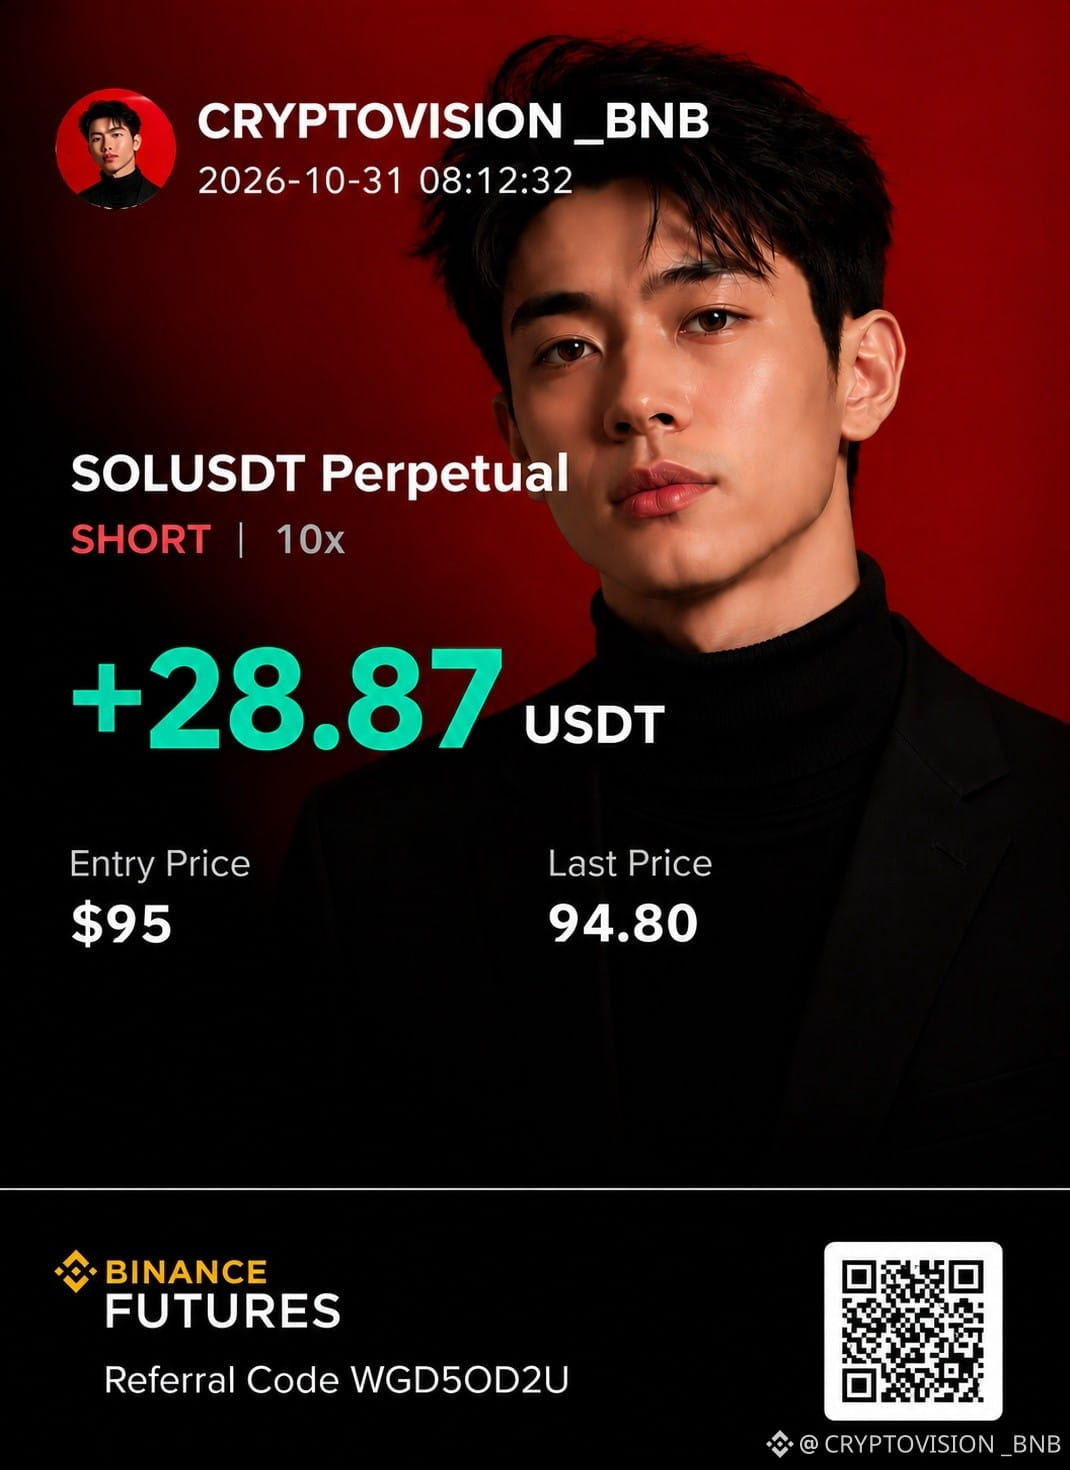
$SOL: A Strong Bearish Breakdown Could Be Coming
Sideways markets don't stay quiet forever. When support breaks and momentum shifts, a sharp move can follow.
Solana is showing a potential SHORT setup, with bearish signals across multiple timeframes.
SOL/USDT — SHORT Setup
- Entry: $94.00–$96.28
- TP1: $92.5653
- TP2: $91.4822
- TP3: $89.8576
- Stop Loss: $97.35
- Bias: Strong Bearish
Why I'm Watching This SHORT
- 4H and 1H trends are bearish, with price reportedly below EMA50 and EMA200.
- The reported 15-minute ADX of 33.6 suggests strong trend momentum.
- Six of twelve technical signals support the bearish scenario, while one opposes it.
- A confirmed breakdown below $94.19 could strengthen the downside case.
My Trading Plan
Enter only within the specified zone. Consider taking 50% profit at TP1, 25% at TP2, and the remaining 25% at TP3. After TP1, consider moving the stop to breakeven.
Important Risk: BTC is reportedly rising, and SOL's stated correlation of 0.86 could work against this SHORT setup. A move to $96.3562 invalidates the plan.
These technical readings are supplied estimates, not independently verified live data.
Will $SOL break toward $89.85, or will buyers defend the $94 area?
Share your outlook below and follow CryptoVision for more trading setups and technical analysis.
$SOL
{spot}(SOLUSDT)
$SOL : A Strong Bearish Breakdown Could Be Coming
Sideways markets don't stay quiet forever. When support breaks and momentum shifts, a sharp move can follow.
Solana is showing a potential SHORT setup, with bearish signals across multiple timeframes.
SOL/USDT — SHORT Setup
- Entry: $94.00–$96.28
- TP1: $92.5653
- TP2: $91.4822
- TP3: $89.8576
- Stop Loss: $97.35
- Bias: Strong Bearish
Why I'm Watching This SHORT
- 4H and 1H trends are bearish, with price reportedly below EMA50 and EMA200.
- The reported 15-minute ADX of 33.6 suggests strong trend momentum.
- Six of twelve technical signals support the bearish scenario, while one opposes it.
- A confirmed breakdown below $94.19 could strengthen the downside case.
My Trading Plan
Enter only within the specified zone. Consider taking 50% profit at TP1, 25% at TP2, and the remaining 25% at TP3. After TP1, consider moving the stop to breakeven.
Important Risk: BTC is reportedly rising, and SOL's stated correlation of 0.86 could work against this SHORT setup. A move to $96.3562 invalidates the plan.
These technical readings are supplied estimates, not independently verified live data.
Will $SOL break toward $89.85, or will buyers defend the $94 area?
Share your outlook below and follow CryptoVision for more trading setups and technical analysis.
$SOL
Sideways markets don't stay quiet forever. When support breaks and momentum shifts, a sharp move can follow.
Solana is showing a potential SHORT setup, with bearish signals across multiple timeframes.
SOL/USDT — SHORT Setup
- Entry: $94.00–$96.28
- TP1: $92.5653
- TP2: $91.4822
- TP3: $89.8576
- Stop Loss: $97.35
- Bias: Strong Bearish
Why I'm Watching This SHORT
- 4H and 1H trends are bearish, with price reportedly below EMA50 and EMA200.
- The reported 15-minute ADX of 33.6 suggests strong trend momentum.
- Six of twelve technical signals support the bearish scenario, while one opposes it.
- A confirmed breakdown below $94.19 could strengthen the downside case.
My Trading Plan
Enter only within the specified zone. Consider taking 50% profit at TP1, 25% at TP2, and the remaining 25% at TP3. After TP1, consider moving the stop to breakeven.
Important Risk: BTC is reportedly rising, and SOL's stated correlation of 0.86 could work against this SHORT setup. A move to $96.3562 invalidates the plan.
These technical readings are supplied estimates, not independently verified live data.
Will $SOL break toward $89.85, or will buyers defend the $94 area?
Share your outlook below and follow CryptoVision for more trading setups and technical analysis.
$SOL
245
·
--
Жоғары (өспелі)
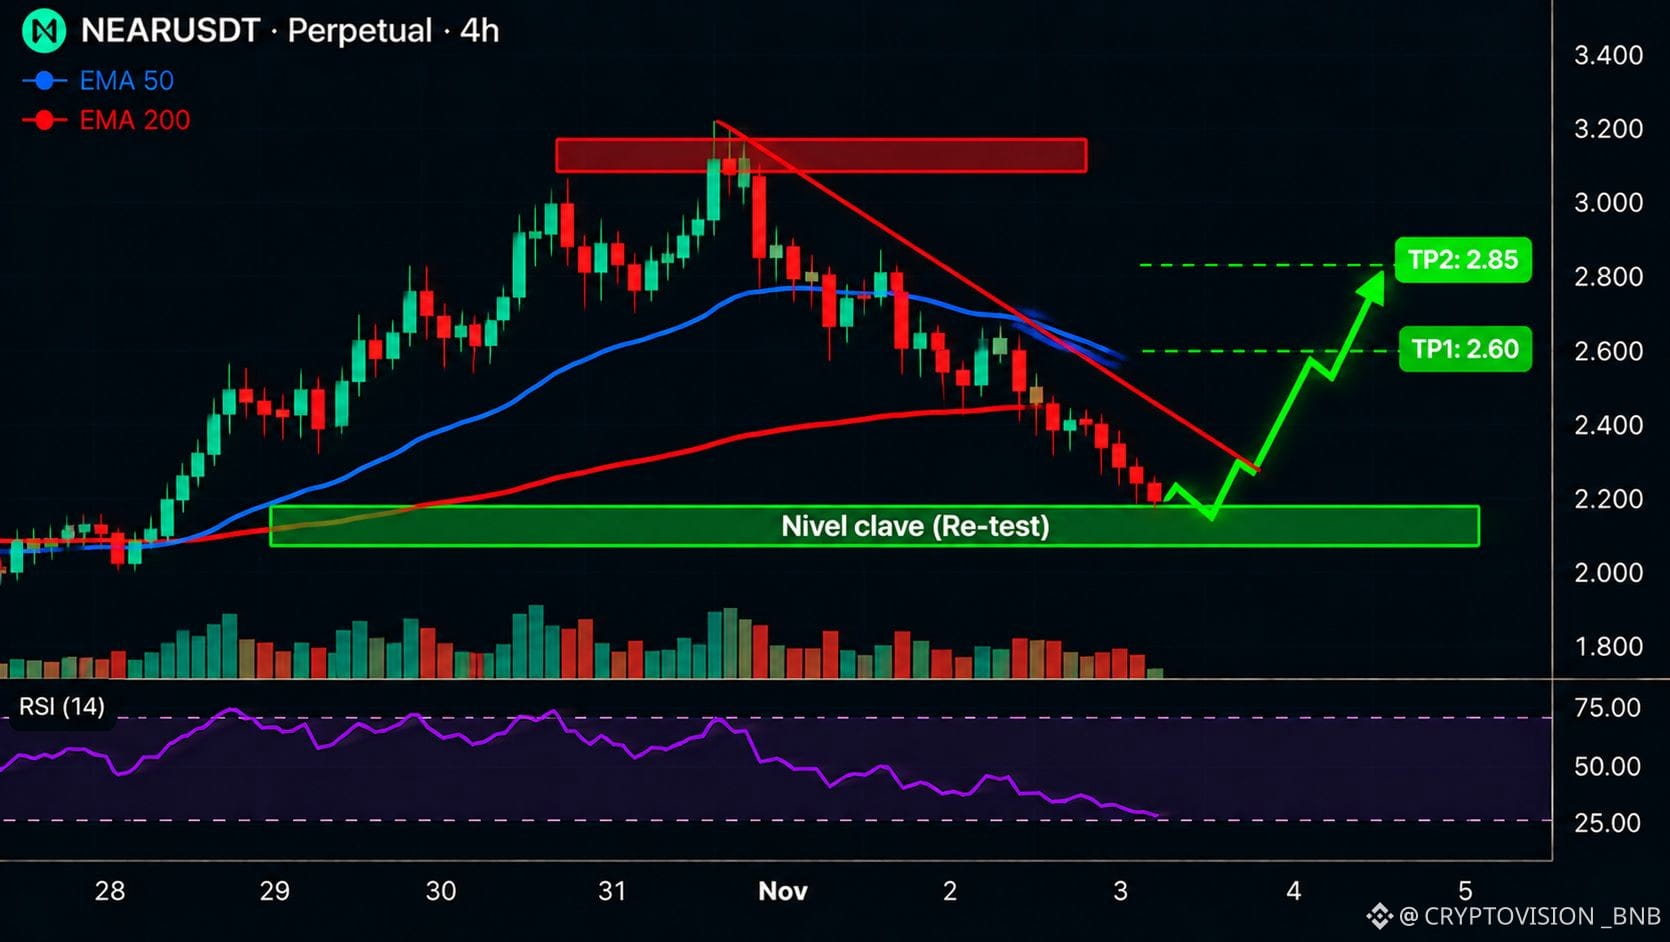
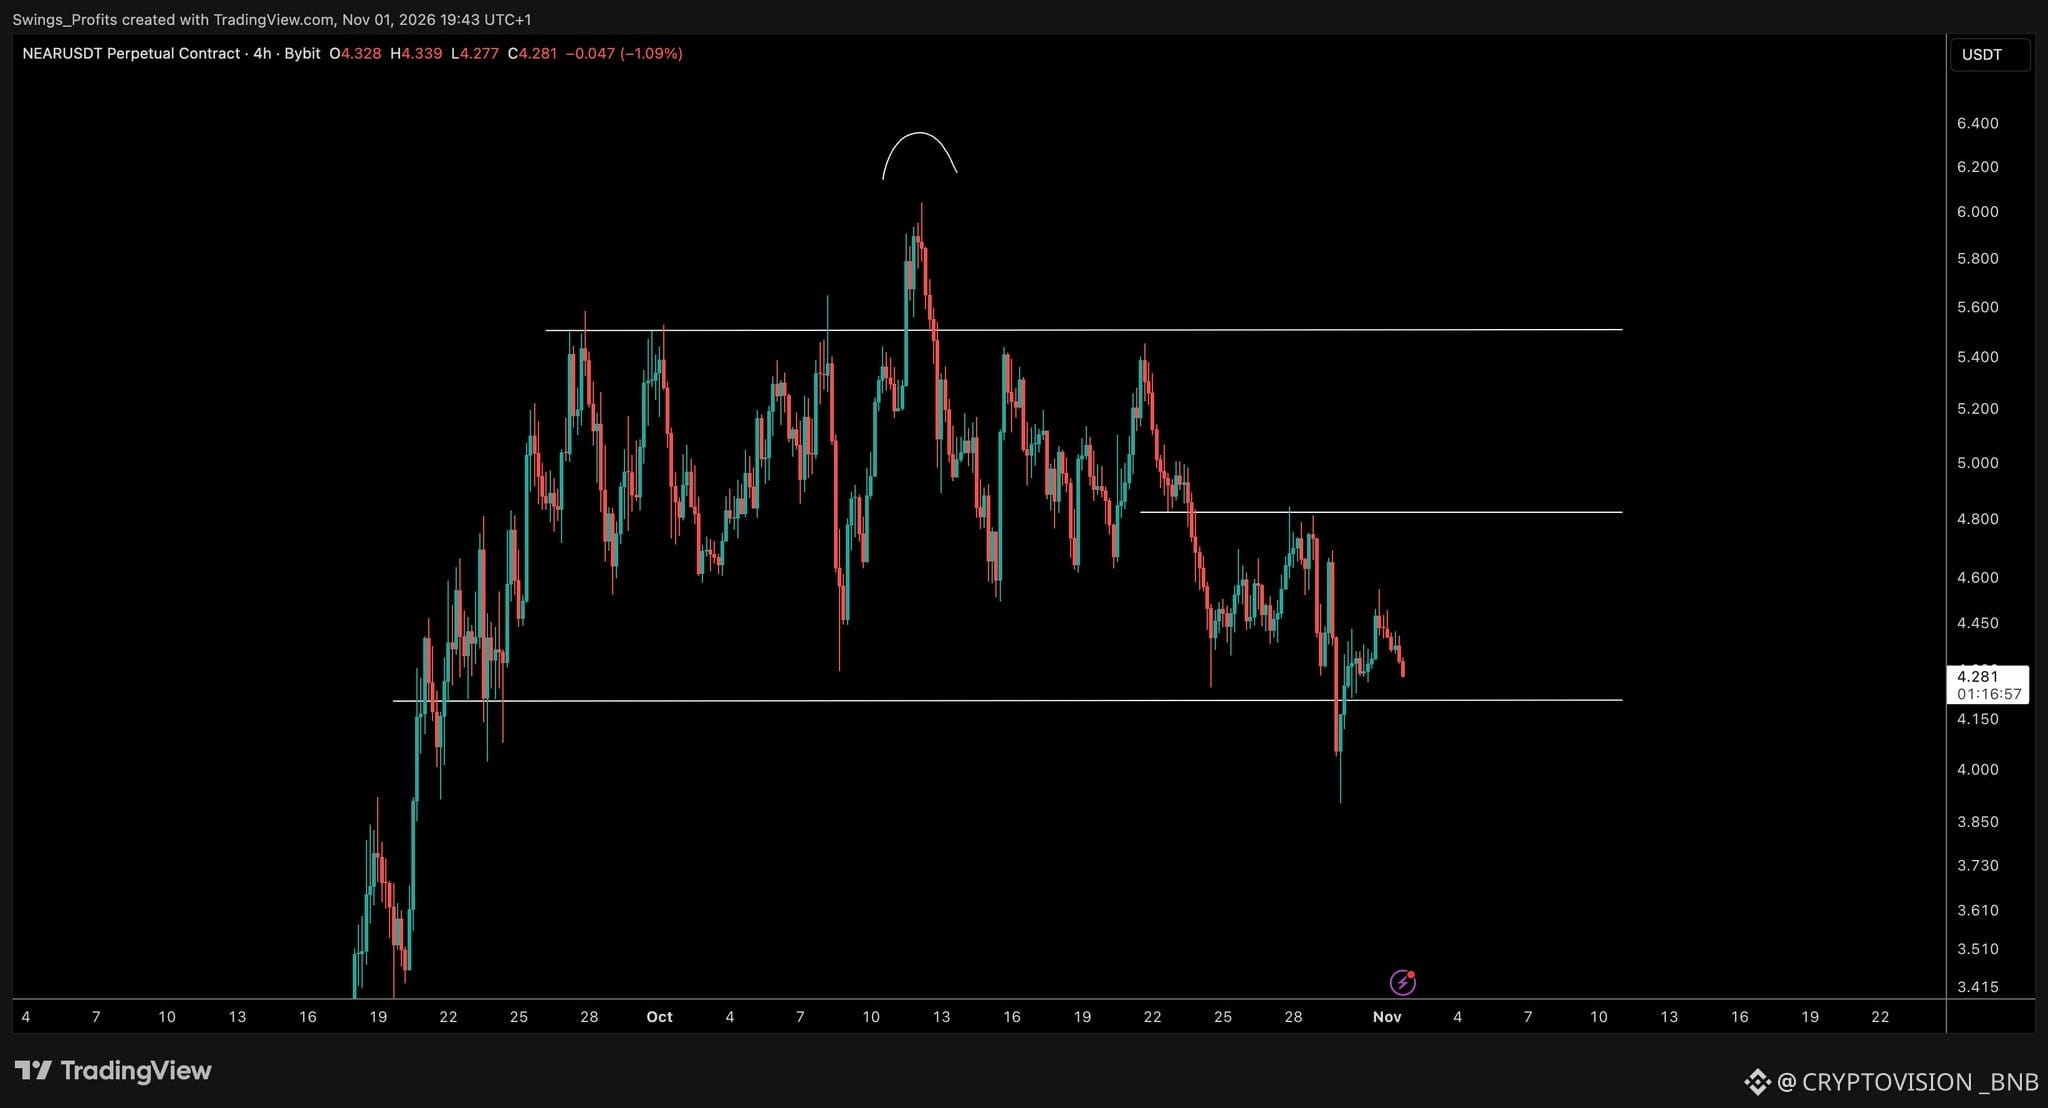
$NEAR: A Key Retest Could Set Up the Next Bullish Move
NEAR remains on my watchlist, but patience is essential at this stage.
Rather than chasing the price, I'm waiting for a retest of a key support level before considering a potential LONG opportunity.
What I'm Watching:
- A controlled pullback toward support.
- A successful retest with buyers defending the zone.
- Bullish confirmation before considering an entry.
If support holds and buying momentum returns, NEAR could offer an attractive rebound setup.
However, a confirmed breakdown below support would weaken the bullish scenario.
No rushed entries. No FOMO. Confirmation comes first.
Do you think $NEAR is preparing for a rebound, or is another correction coming?
Share your outlook below and follow CryptoVision for more technical analysis and trading updates.
$NEAR
{spot}(NEARUSDT)
$NEAR : A Key Retest Could Set Up the Next Bullish Move
NEAR remains on my watchlist, but patience is essential at this stage.
Rather than chasing the price, I'm waiting for a retest of a key support level before considering a potential LONG opportunity.
What I'm Watching:
- A controlled pullback toward support.
- A successful retest with buyers defending the zone.
- Bullish confirmation before considering an entry.
If support holds and buying momentum returns, NEAR could offer an attractive rebound setup.
However, a confirmed breakdown below support would weaken the bullish scenario.
No rushed entries. No FOMO. Confirmation comes first.
Do you think $NEAR is preparing for a rebound, or is another correction coming?
Share your outlook below and follow CryptoVision for more technical analysis and trading updates.
$NEAR
NEAR remains on my watchlist, but patience is essential at this stage.
Rather than chasing the price, I'm waiting for a retest of a key support level before considering a potential LONG opportunity.
What I'm Watching:
- A controlled pullback toward support.
- A successful retest with buyers defending the zone.
- Bullish confirmation before considering an entry.
If support holds and buying momentum returns, NEAR could offer an attractive rebound setup.
However, a confirmed breakdown below support would weaken the bullish scenario.
No rushed entries. No FOMO. Confirmation comes first.
Do you think $NEAR is preparing for a rebound, or is another correction coming?
Share your outlook below and follow CryptoVision for more technical analysis and trading updates.
$NEAR
240
·
--
Жоғары (өспелі)
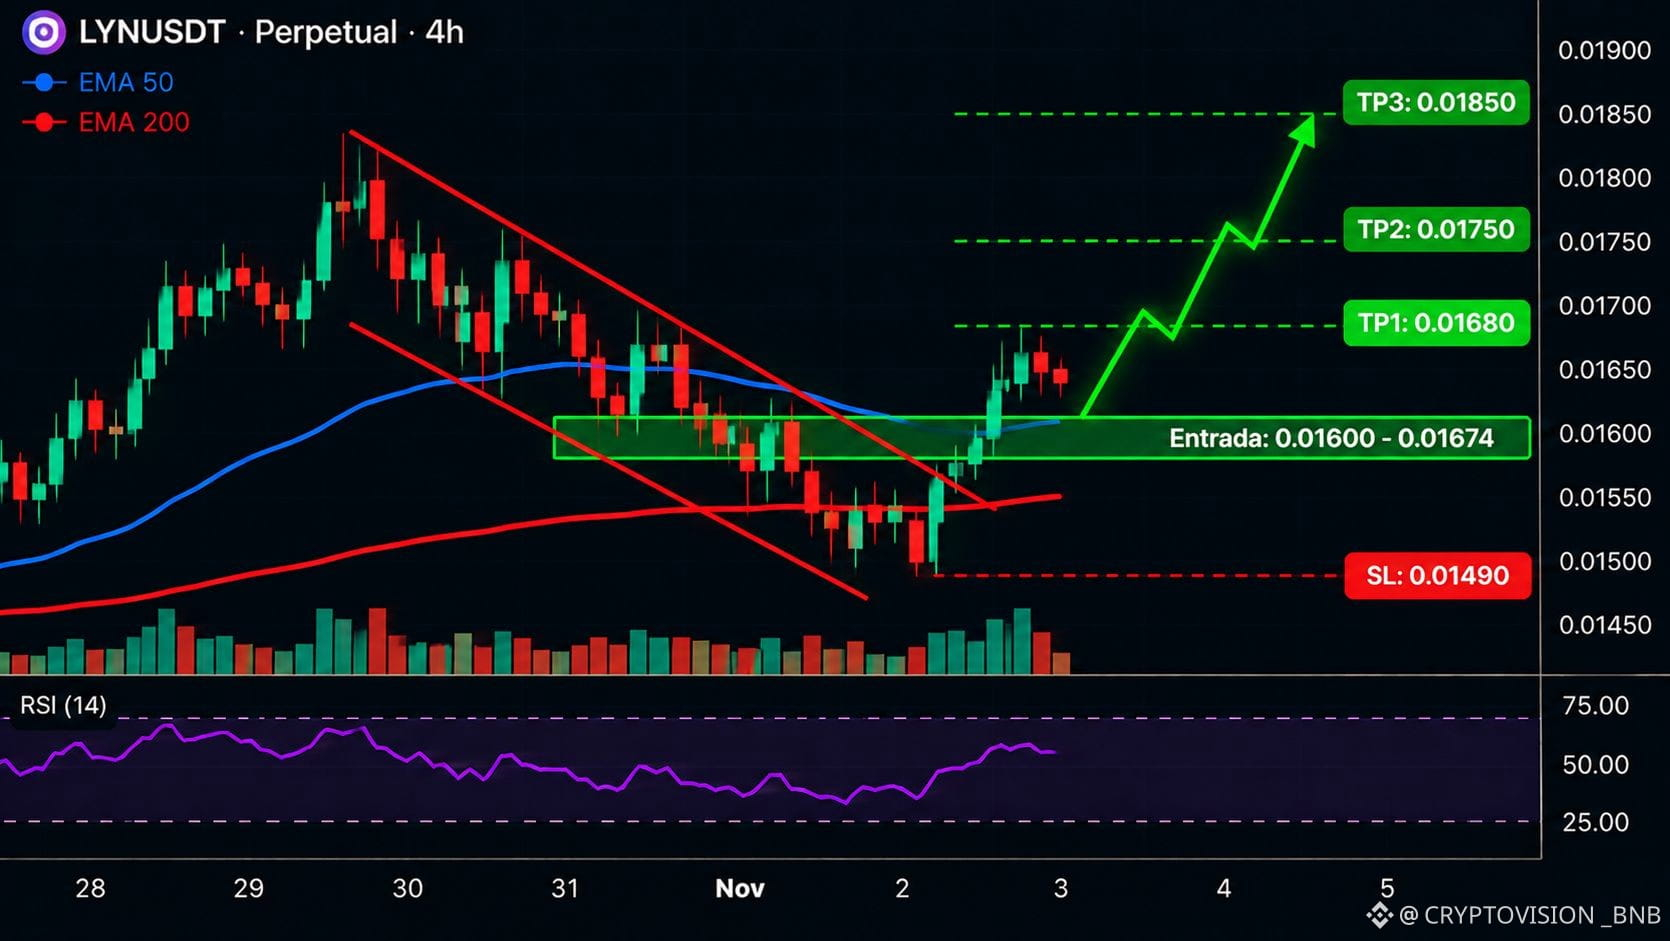
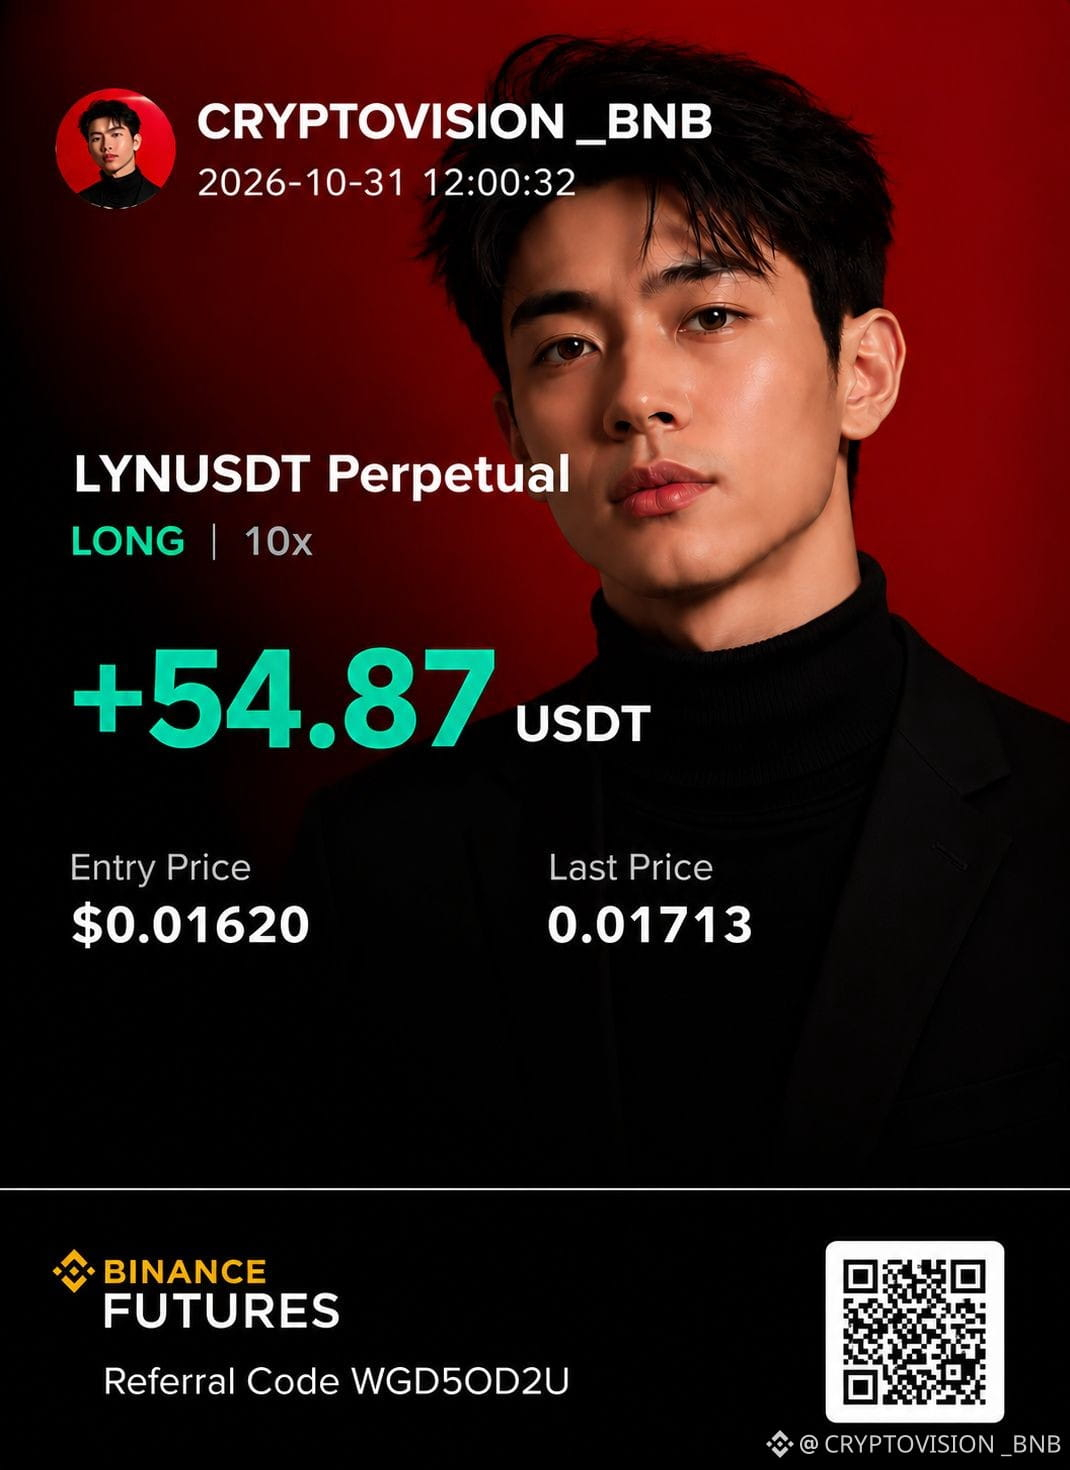
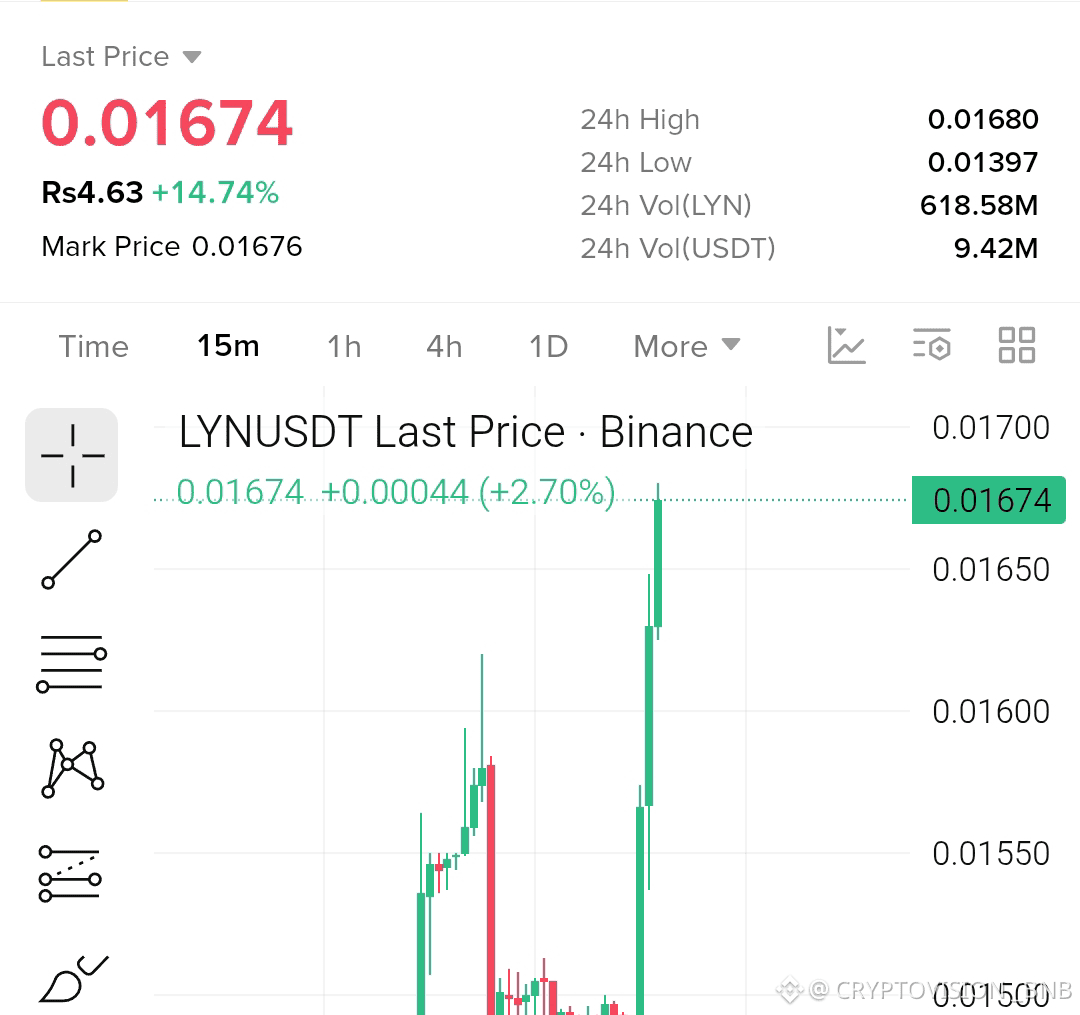
$LYN: Bullish Breakout Ahead? LONG Setup to Watch
LYN is on my radar for a potential bullish continuation, with three upside targets in focus.
LYN/USDT — LONG Setup
- Entry Zone: $0.01600–$0.01774
- TP1: $0.01880
- TP2: $0.01950
- TP3: $0.02050
- Stop Loss: $0.01490
Trading Strategy
I'm watching for buyers to defend the entry zone and confirm renewed bullish momentum.
If the setup develops as expected, consider taking partial profits at each target and adjusting the stop after TP1 to protect capital.
A sustained move below $0.01490 would invalidate this bullish scenario.
Risk Management: Keep position size controlled and avoid chasing the price above the entry zone.
Can $LYN reach $0.01850, or will resistance stop the rally?
Share your outlook below and follow CryptoVision for more trading setups and market analysis.
$LYN
{future}(LYNUSDT)
$LYN : Bullish Breakout Ahead? LONG Setup to Watch
LYN is on my radar for a potential bullish continuation, with three upside targets in focus.
LYN/USDT — LONG Setup
- Entry Zone: $0.01600–$0.01774
- TP1: $0.01880
- TP2: $0.01950
- TP3: $0.02050
- Stop Loss: $0.01490
Trading Strategy
I'm watching for buyers to defend the entry zone and confirm renewed bullish momentum.
If the setup develops as expected, consider taking partial profits at each target and adjusting the stop after TP1 to protect capital.
A sustained move below $0.01490 would invalidate this bullish scenario.
Risk Management: Keep position size controlled and avoid chasing the price above the entry zone.
Can $LYN reach $0.01850, or will resistance stop the rally?
Share your outlook below and follow CryptoVision for more trading setups and market analysis.
$LYN
LYN is on my radar for a potential bullish continuation, with three upside targets in focus.
LYN/USDT — LONG Setup
- Entry Zone: $0.01600–$0.01774
- TP1: $0.01880
- TP2: $0.01950
- TP3: $0.02050
- Stop Loss: $0.01490
Trading Strategy
I'm watching for buyers to defend the entry zone and confirm renewed bullish momentum.
If the setup develops as expected, consider taking partial profits at each target and adjusting the stop after TP1 to protect capital.
A sustained move below $0.01490 would invalidate this bullish scenario.
Risk Management: Keep position size controlled and avoid chasing the price above the entry zone.
Can $LYN reach $0.01850, or will resistance stop the rally?
Share your outlook below and follow CryptoVision for more trading setups and market analysis.
$LYN
55
·
--
Төмен (кемімелі)
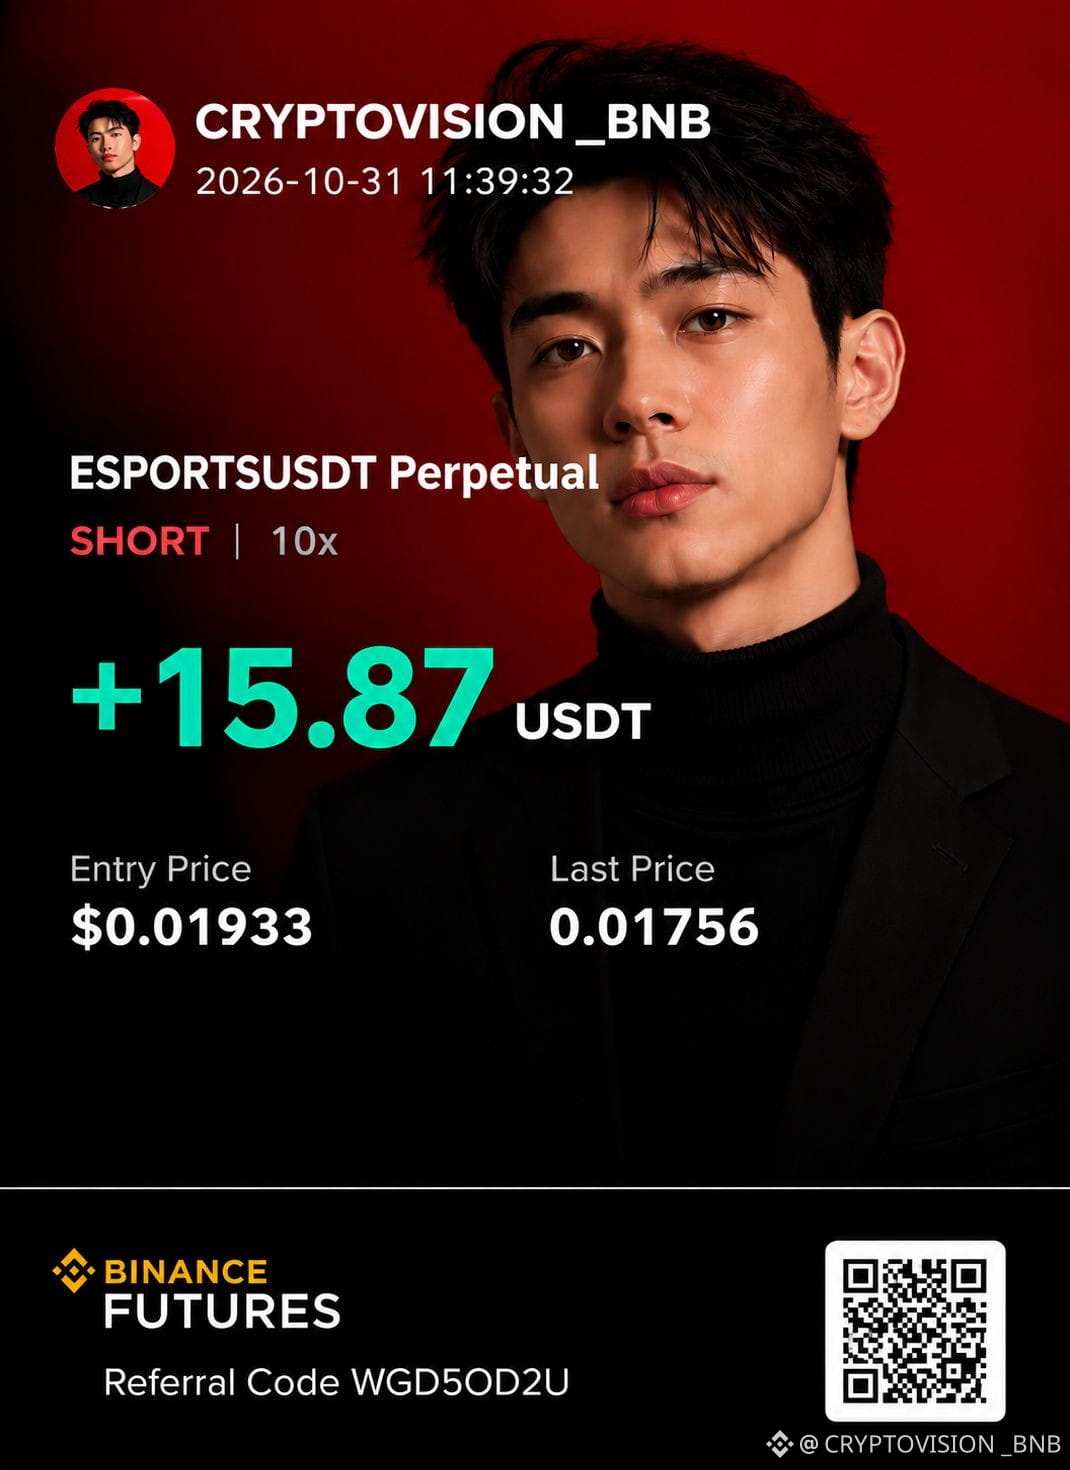
$ESPORTS: Is the Rally Running Out of Steam? A Major Correction Could Be Next
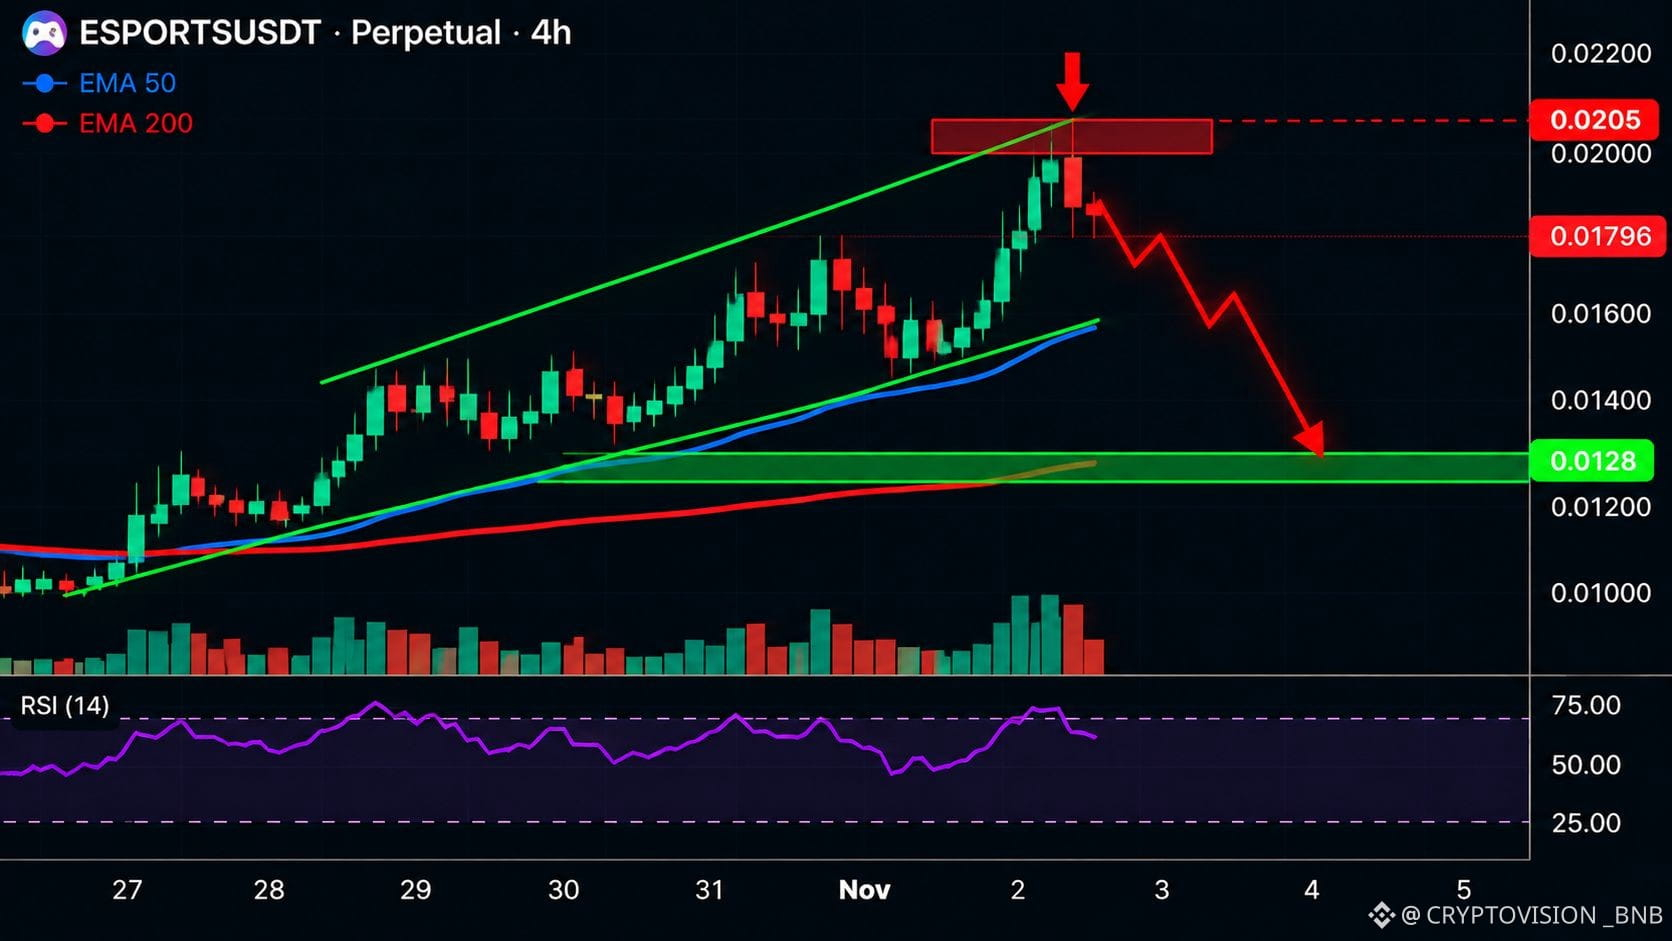
After an aggressive upward move, $ESPORTS is approaching what I consider a potential exhaustion zone.
The question now isn't how much higher it can go, but whether buyers can sustain this momentum.
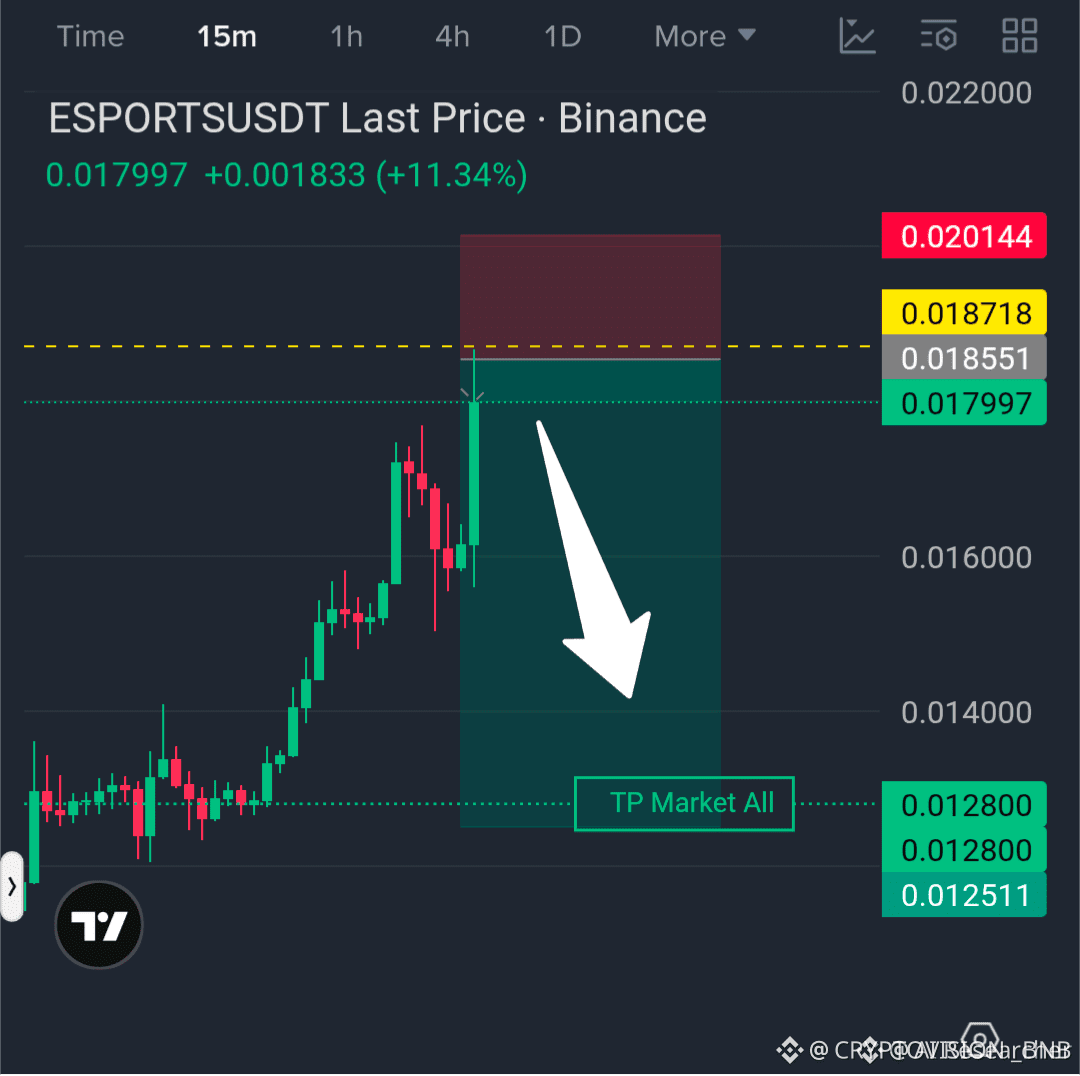
ESPORTSUSDT Perpetual — SHORT Setup
- Reference Price: $0.01796
- Take Profit: $0.01280
- Stop Loss: $0.02050
- Direction: SHORT
- Reported Return: +101.61% (unverified)
Why I'm Watching for a Reversal
A sharp rally can create significant downside risk if momentum fades and sellers regain control.
My bearish scenario targets $0.0128, but a sustained breakout above resistance could invalidate this outlook.
I'm watching for rejection and confirmation rather than assuming the exact top is already in.
Would you take profits on $ESPORTS now, or do you think another breakout is coming?
Share your outlook below and follow CryptoVision for more trading setups and market analysis.
$ESPORTS
{future}(ESPORTSUSDT)
$ESPORTS : Is the Rally Running Out of Steam? A Major Correction Could Be Next
After an aggressive upward move, $ESPORTS is approaching what I consider a potential exhaustion zone.
The question now isn't how much higher it can go, but whether buyers can sustain this momentum.
ESPORTSUSDT Perpetual — SHORT Setup
- Reference Price: $0.01796
- Take Profit: $0.01280
- Stop Loss: $0.02050
- Direction: SHORT
- Reported Return: +101.61% (unverified)
Why I'm Watching for a Reversal
A sharp rally can create significant downside risk if momentum fades and sellers regain control.
My bearish scenario targets $0.0128, but a sustained breakout above resistance could invalidate this outlook.
I'm watching for rejection and confirmation rather than assuming the exact top is already in.
Would you take profits on $ESPORTS now, or do you think another breakout is coming?
Share your outlook below and follow CryptoVision for more trading setups and market analysis.
$ESPORTS
After an aggressive upward move, $ESPORTS is approaching what I consider a potential exhaustion zone.
The question now isn't how much higher it can go, but whether buyers can sustain this momentum.
ESPORTSUSDT Perpetual — SHORT Setup
- Reference Price: $0.01796
- Take Profit: $0.01280
- Stop Loss: $0.02050
- Direction: SHORT
- Reported Return: +101.61% (unverified)
Why I'm Watching for a Reversal
A sharp rally can create significant downside risk if momentum fades and sellers regain control.
My bearish scenario targets $0.0128, but a sustained breakout above resistance could invalidate this outlook.
I'm watching for rejection and confirmation rather than assuming the exact top is already in.
Would you take profits on $ESPORTS now, or do you think another breakout is coming?
Share your outlook below and follow CryptoVision for more trading setups and market analysis.
$ESPORTS
560
Көбірек контент көру үшін кіріңіз
Binance Square платформасында әлемдік криптоқоғамдастыққа қосылыңыз
⚡️ Криптовалюта туралы ең соңғы және пайдалы ақпаратты алыңыз.
💬 Әлемдегі ең ірі криптобиржаның сеніміне ие.
👍 Расталған авторлардың нақты пікірлерін табыңыз.
Электрондық пошта/телефон нөмірі
Трендтегі тақырыптар
BinanceReopensWithdrawalsForMoreAssets
12,783 рет көрілді
421 адам талқылап жатыр
Security Incident | Recovery Update #6: Withdrawals Reopen for More Assets (2026-11-03)
Binance Announcement
·135 лайк
·362.5k рет көрілді
AppleReportsMixedResults
8,919 рет көрілді
343 адам талқылап жатыр
BinanceHourlyDepositsExceedWithdrawals
430 рет көрілді
42 адам талқылап жатыр