
crypto insights jihad
112 Жариялаулар

crypto insights jihad
Хабарлау
Пайдаланушыны блоктау
Crypto Lover | Learning & Earning in Binance Square
Ашық сауда
Жоғары жиілікті трейдер
2.2 ай
28 Жазылым
5 Жазылушылар
22 лайк басылған
Жазбалар
Портфолио
$BOME
{spot}(BOMEUSDT)
BOME bounce back?
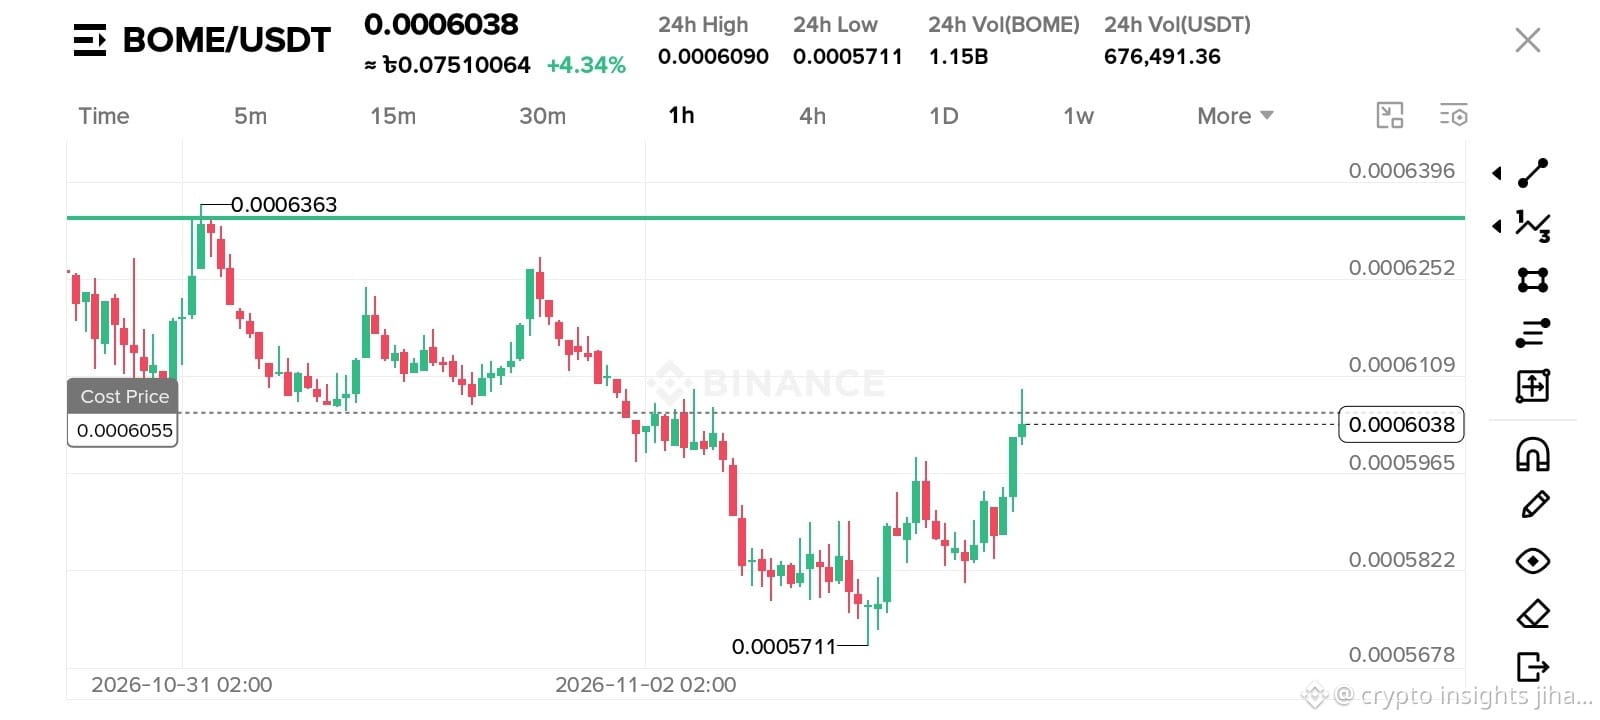
BOME hit 0.0005711 low and now trying to recover. currently 0.0006038, +4.34% in 24h.
I bought around 0.0006055 cost, almost breakeven now. chart shows double bottom at 0.0005711 and strong green candle today.
volume 1.15B BOME, so interest is coming back. If it can break and hold above 0.00061, next target is 0.0006363 resistance.
I am holding for now. not selling at loss.
NFA, just sharing my position.
#BOME #Binance
$BOME
BOME bounce back?
BOME hit 0.0005711 low and now trying to recover. currently 0.0006038, +4.34% in 24h.
I bought around 0.0006055 cost, almost breakeven now. chart shows double bottom at 0.0005711 and strong green candle today.
volume 1.15B BOME, so interest is coming back. If it can break and hold above 0.00061, next target is 0.0006363 resistance.
I am holding for now. not selling at loss.
NFA, just sharing my position.
#BOME #Binance
BOME bounce back?
BOME hit 0.0005711 low and now trying to recover. currently 0.0006038, +4.34% in 24h.
I bought around 0.0006055 cost, almost breakeven now. chart shows double bottom at 0.0005711 and strong green candle today.
volume 1.15B BOME, so interest is coming back. If it can break and hold above 0.00061, next target is 0.0006363 resistance.
I am holding for now. not selling at loss.
NFA, just sharing my position.
#BOME #Binance
226
·
--
Жоғары (өспелі)
$XPL
{spot}(XPLUSDT)
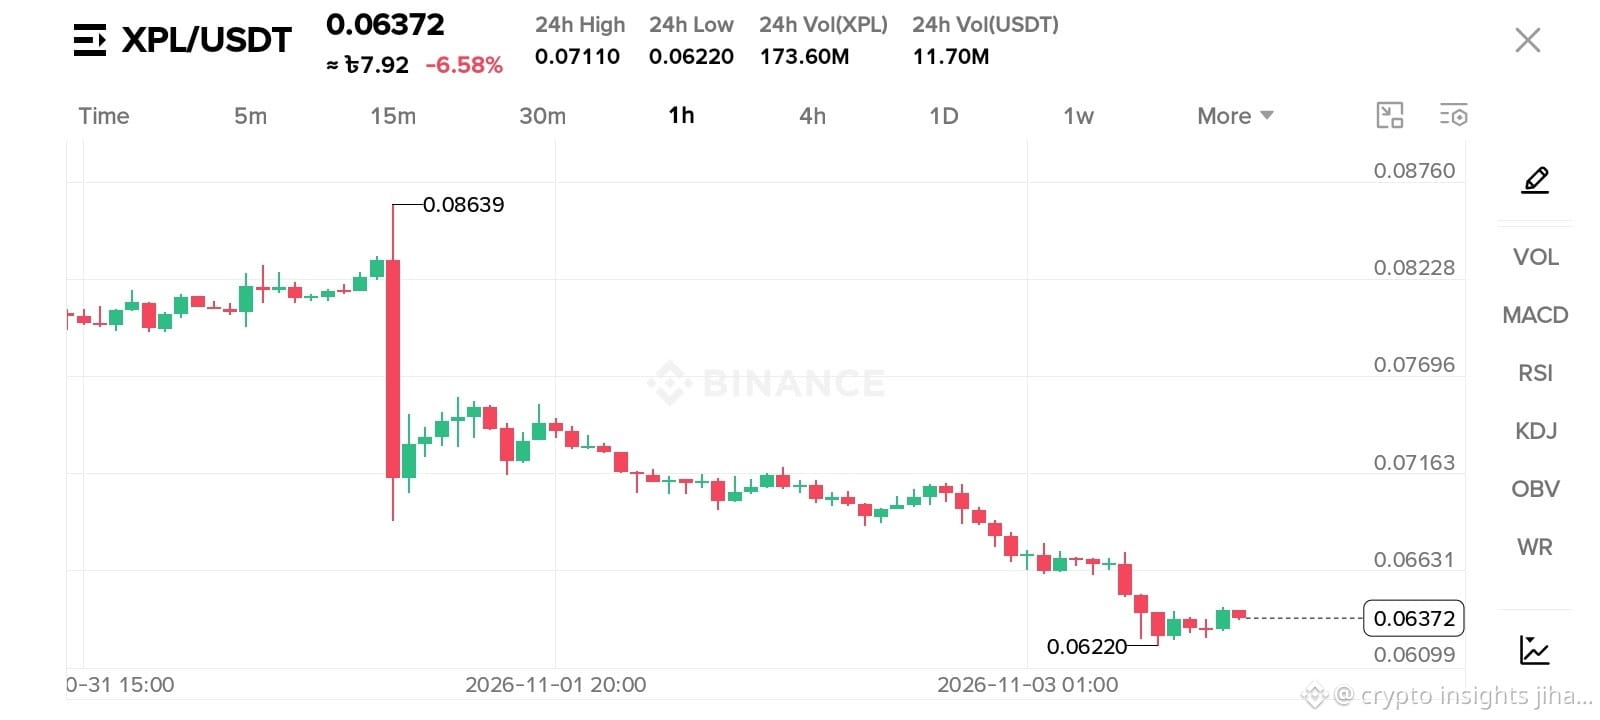
XPL is down bad today -6% already. Dropped from 0.086 to 0.062.
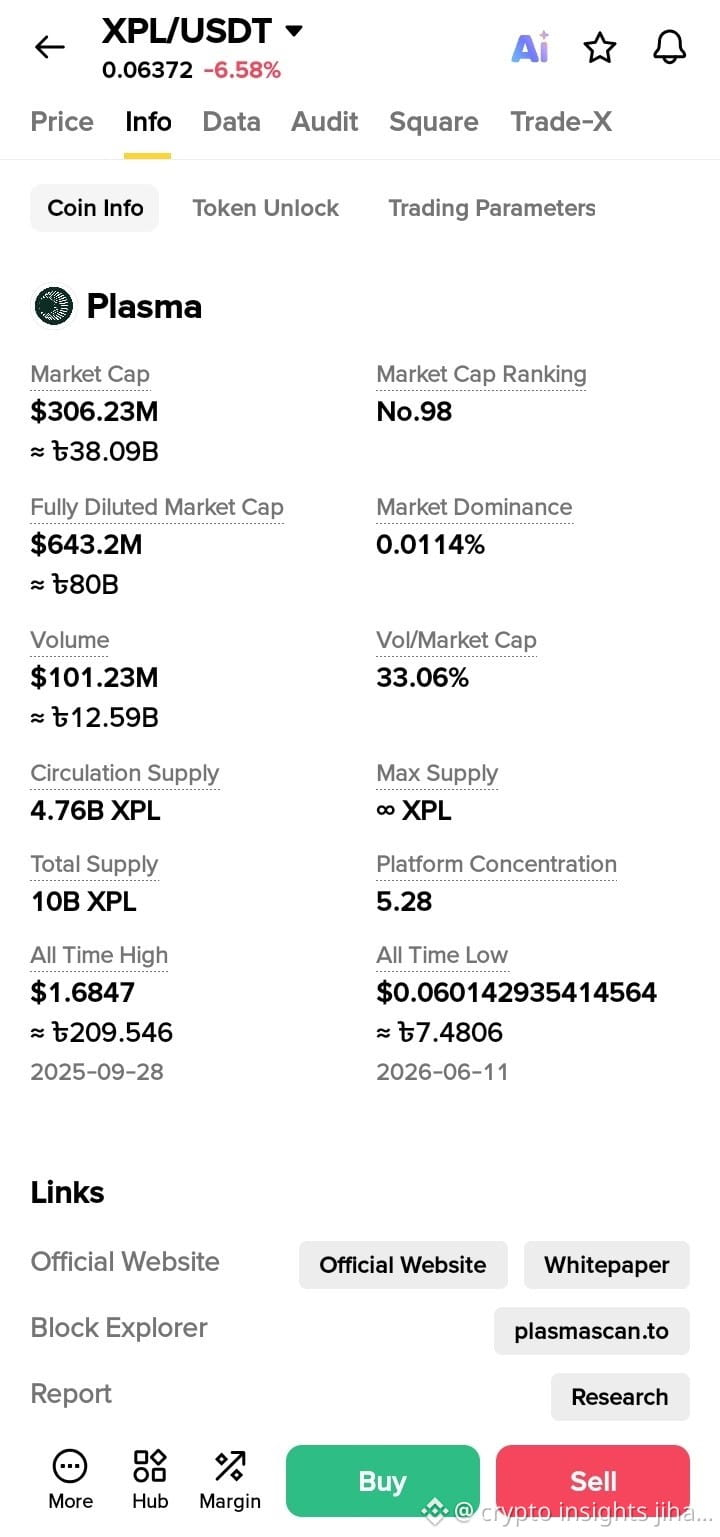
But look, this is ATL area. Price hit 0.0622 and wicked. A lot of longs got liquidated.
I think shorting here is risky. Better to wait. If it holds 0.061 and goes back above 0.072, it can pump quick.
If 0.061 breaks, then it can go lower. So keep SL tight.
This is just my opinion, NFA.
$XPL
XPL is down bad today -6% already. Dropped from 0.086 to 0.062.
But look, this is ATL area. Price hit 0.0622 and wicked. A lot of longs got liquidated.
I think shorting here is risky. Better to wait. If it holds 0.061 and goes back above 0.072, it can pump quick.
If 0.061 breaks, then it can go lower. So keep SL tight.
This is just my opinion, NFA.
XPL is down bad today -6% already. Dropped from 0.086 to 0.062.
But look, this is ATL area. Price hit 0.0622 and wicked. A lot of longs got liquidated.
I think shorting here is risky. Better to wait. If it holds 0.061 and goes back above 0.072, it can pump quick.
If 0.061 breaks, then it can go lower. So keep SL tight.
This is just my opinion, NFA.
283
$RUNE
{spot}(RUNEUSDT)
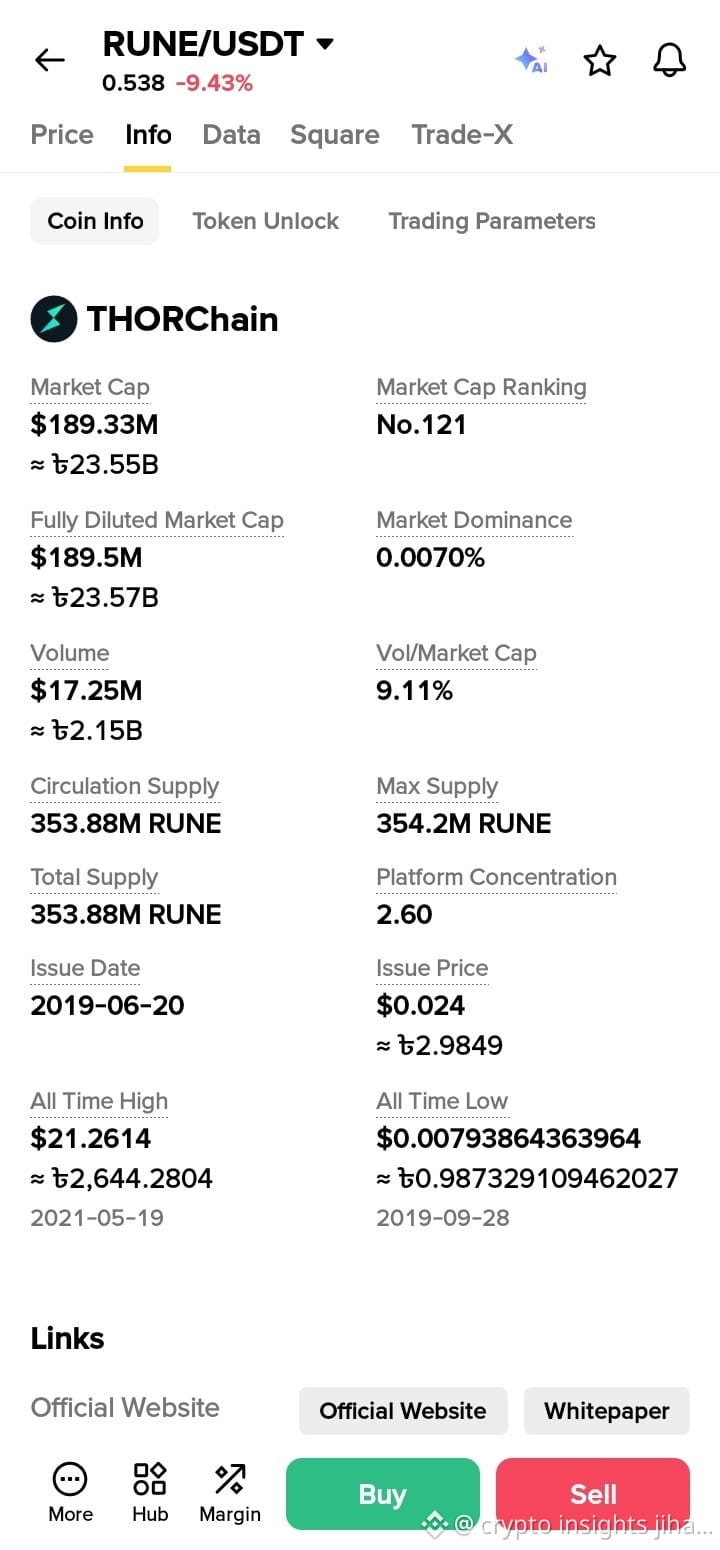
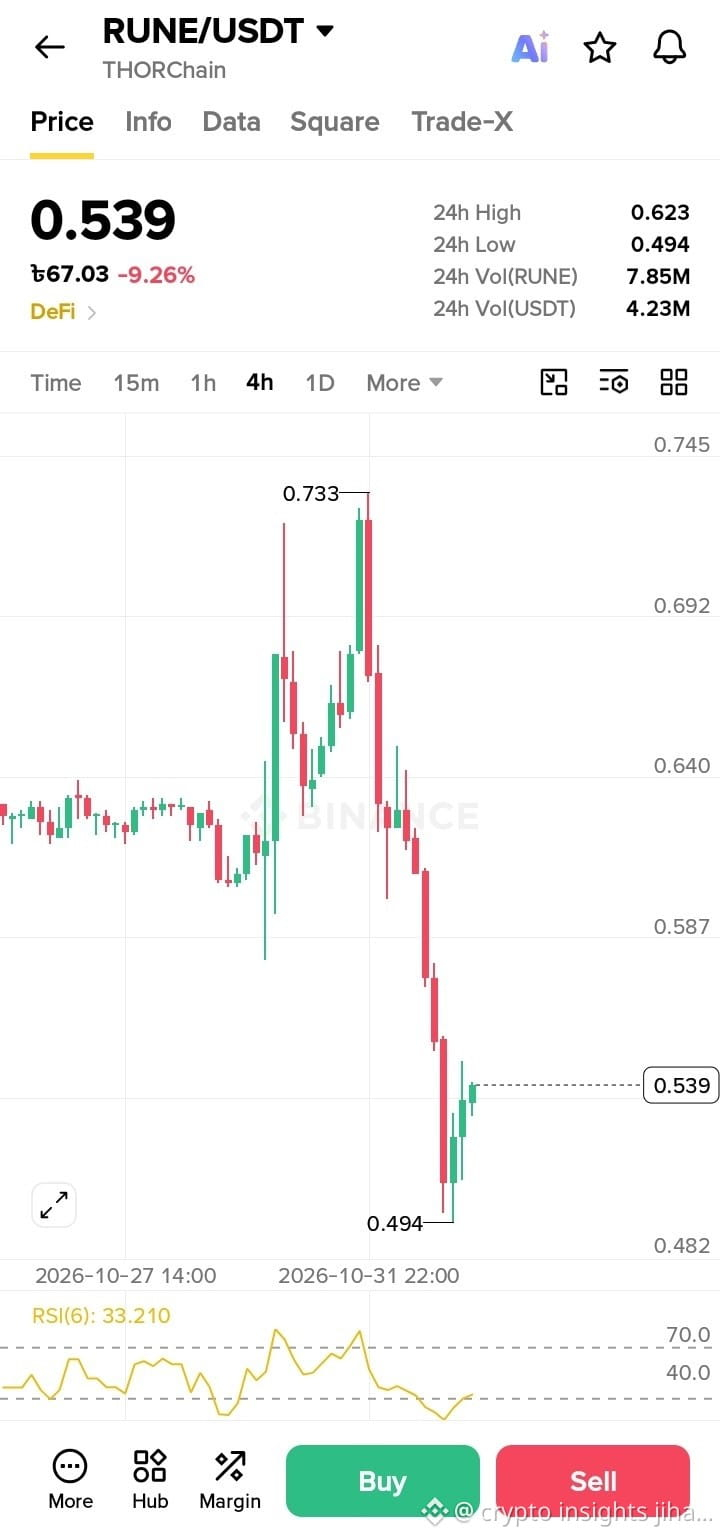
RUNE at $0.538 - Capitulation done? My trade setup
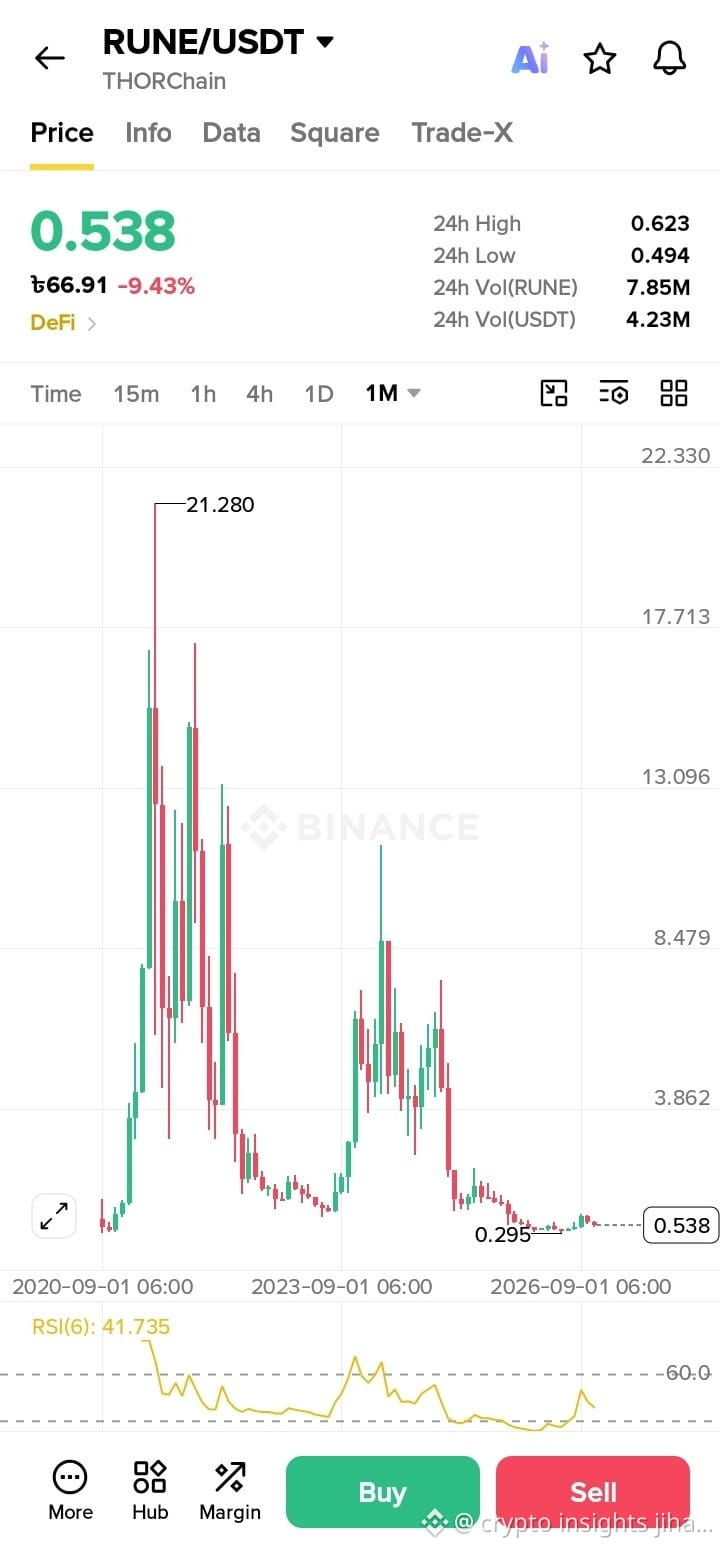
RYNE just flushed to $0.494 after rejecting $0.733.
-9.43% today. monthly chart $21.28 ATH to $0.49 now, -97% down.
My Plan
I am watching $0.50 - $0.52 zone. RSI on 4H is 33, oversold.
if daily close holds above $0.50, I am looking for long with target $0.62 and $0.69. stop below $0.48.
if $0.494 breaks, i will wait at $0.30 area.
risk is high, so small position only. This is high volatility coin.
Are you watching this level too?
NFA, DYOR.
$RUNE #TradingSetup #Crypto
$RUNE
RUNE at $0.538 - Capitulation done? My trade setup
RYNE just flushed to $0.494 after rejecting $0.733.
-9.43% today. monthly chart $21.28 ATH to $0.49 now, -97% down.
My Plan
I am watching $0.50 - $0.52 zone. RSI on 4H is 33, oversold.
if daily close holds above $0.50, I am looking for long with target $0.62 and $0.69. stop below $0.48.
if $0.494 breaks, i will wait at $0.30 area.
risk is high, so small position only. This is high volatility coin.
Are you watching this level too?
NFA, DYOR.
$RUNE #TradingSetup #Crypto
RUNE at $0.538 - Capitulation done? My trade setup
RYNE just flushed to $0.494 after rejecting $0.733.
-9.43% today. monthly chart $21.28 ATH to $0.49 now, -97% down.
My Plan
I am watching $0.50 - $0.52 zone. RSI on 4H is 33, oversold.
if daily close holds above $0.50, I am looking for long with target $0.62 and $0.69. stop below $0.48.
if $0.494 breaks, i will wait at $0.30 area.
risk is high, so small position only. This is high volatility coin.
Are you watching this level too?
NFA, DYOR.
$RUNE #TradingSetup #Crypto
2
180
$DEXE
{spot}(DEXEUSDT)
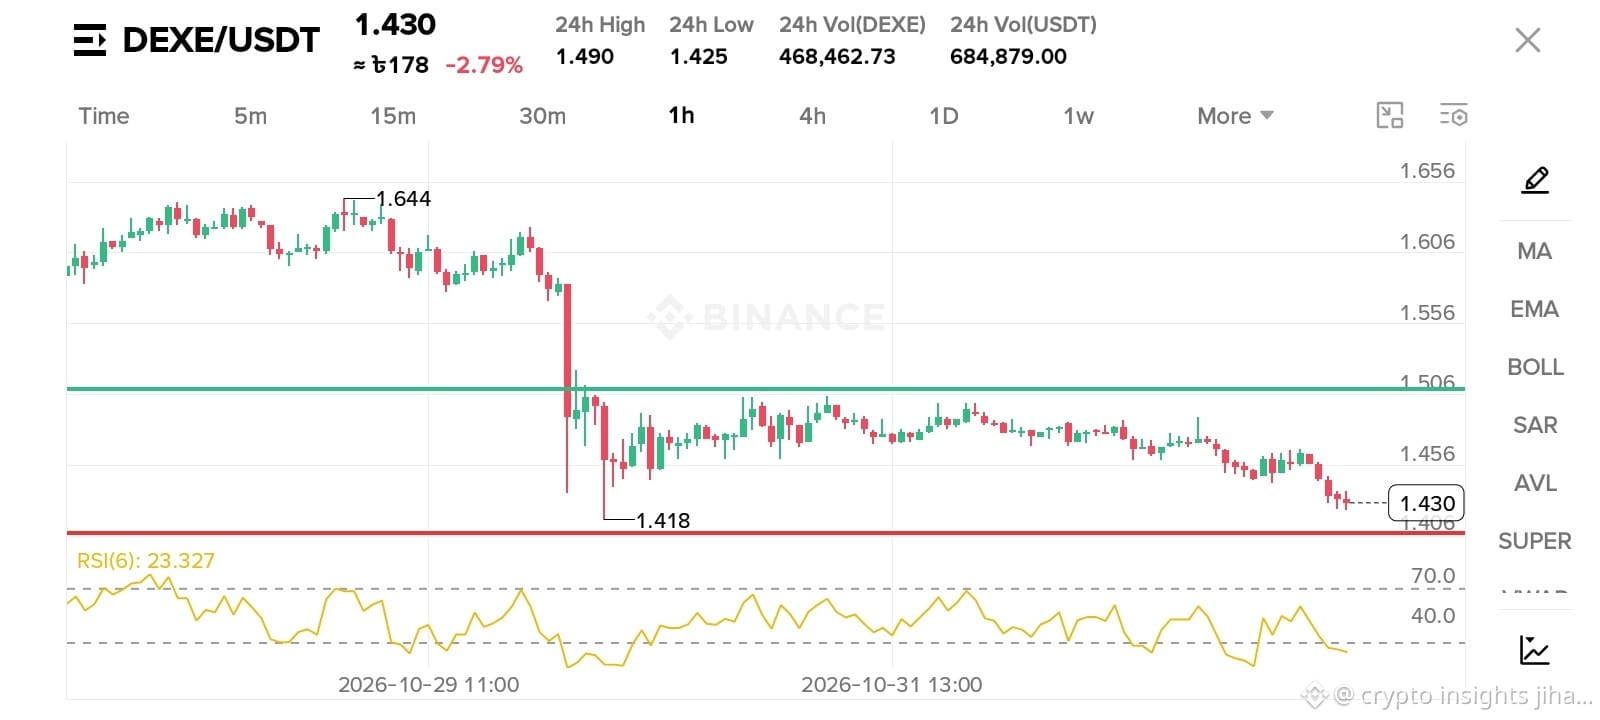
DEXE/USDT now $1.43, down almost 3% today. Dropped from $1.64 to $1.41 and now trying to hold.
24h low $1.425 touched, if $1.40 breaks then we may see $1.35. On top $1.50 - $1.51 is strong resistance, that green line you see on chart.
RSI is 23, fully oversold. So bounce can come anytime but volume is still low.
What you guys thinking about DEXE?
#DEXE #CryptoAnalysis
$DEXE
DEXE/USDT now $1.43, down almost 3% today. Dropped from $1.64 to $1.41 and now trying to hold.
24h low $1.425 touched, if $1.40 breaks then we may see $1.35. On top $1.50 - $1.51 is strong resistance, that green line you see on chart.
RSI is 23, fully oversold. So bounce can come anytime but volume is still low.
What you guys thinking about DEXE?
#DEXE #CryptoAnalysis
DEXE/USDT now $1.43, down almost 3% today. Dropped from $1.64 to $1.41 and now trying to hold.
24h low $1.425 touched, if $1.40 breaks then we may see $1.35. On top $1.50 - $1.51 is strong resistance, that green line you see on chart.
RSI is 23, fully oversold. So bounce can come anytime but volume is still low.
What you guys thinking about DEXE?
#DEXE #CryptoAnalysis
736
$BTC $RVN
{spot}(BTCUSDT)
{spot}(RVNUSDT)
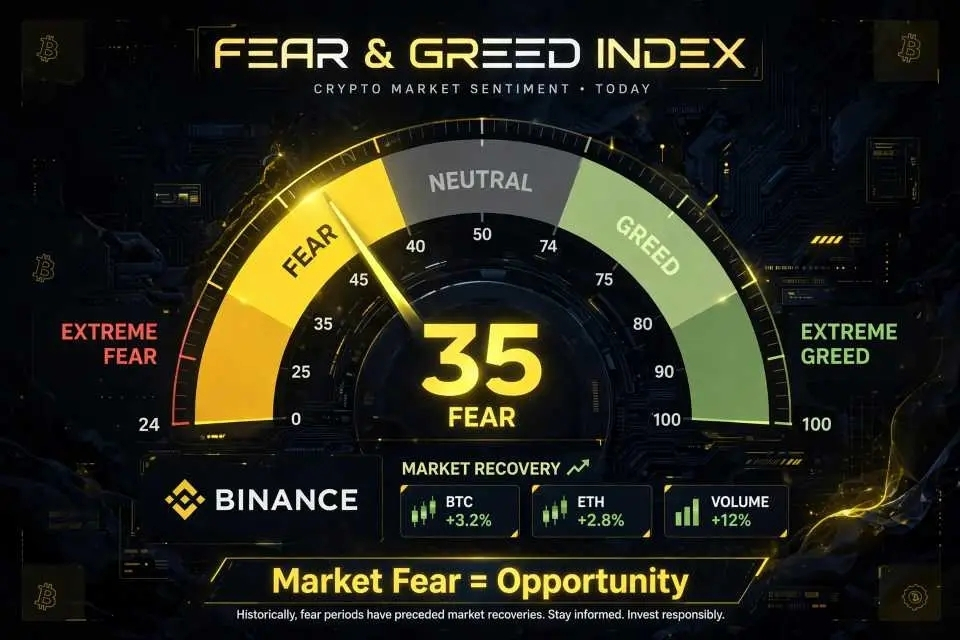
BTC $78.6k now, bounced from $77.2k. Still fear at 35 after that Binance hack but withdrawals started again today morning, so worst is over I think.
I'm holding RVN spot, still red but not selling here. Market dumped too much for a hack that Binance already covered 95% via SAFU.
If BTC holds $78k, $80k coming next week. If breaks $77k then we may see $76k again.
Just holding and waiting. What you guys doing?
#btc #binance #rvn
$BTC $RVN
BTC $78.6k now, bounced from $77.2k. Still fear at 35 after that Binance hack but withdrawals started again today morning, so worst is over I think.
I'm holding RVN spot, still red but not selling here. Market dumped too much for a hack that Binance already covered 95% via SAFU.
If BTC holds $78k, $80k coming next week. If breaks $77k then we may see $76k again.
Just holding and waiting. What you guys doing?
#btc #binance #rvn
BTC $78.6k now, bounced from $77.2k. Still fear at 35 after that Binance hack but withdrawals started again today morning, so worst is over I think.
I'm holding RVN spot, still red but not selling here. Market dumped too much for a hack that Binance already covered 95% via SAFU.
If BTC holds $78k, $80k coming next week. If breaks $77k then we may see $76k again.
Just holding and waiting. What you guys doing?
#btc #binance #rvn
823
·
--
Жоғары (өспелі)
$ETC
{spot}(ETCUSDT)
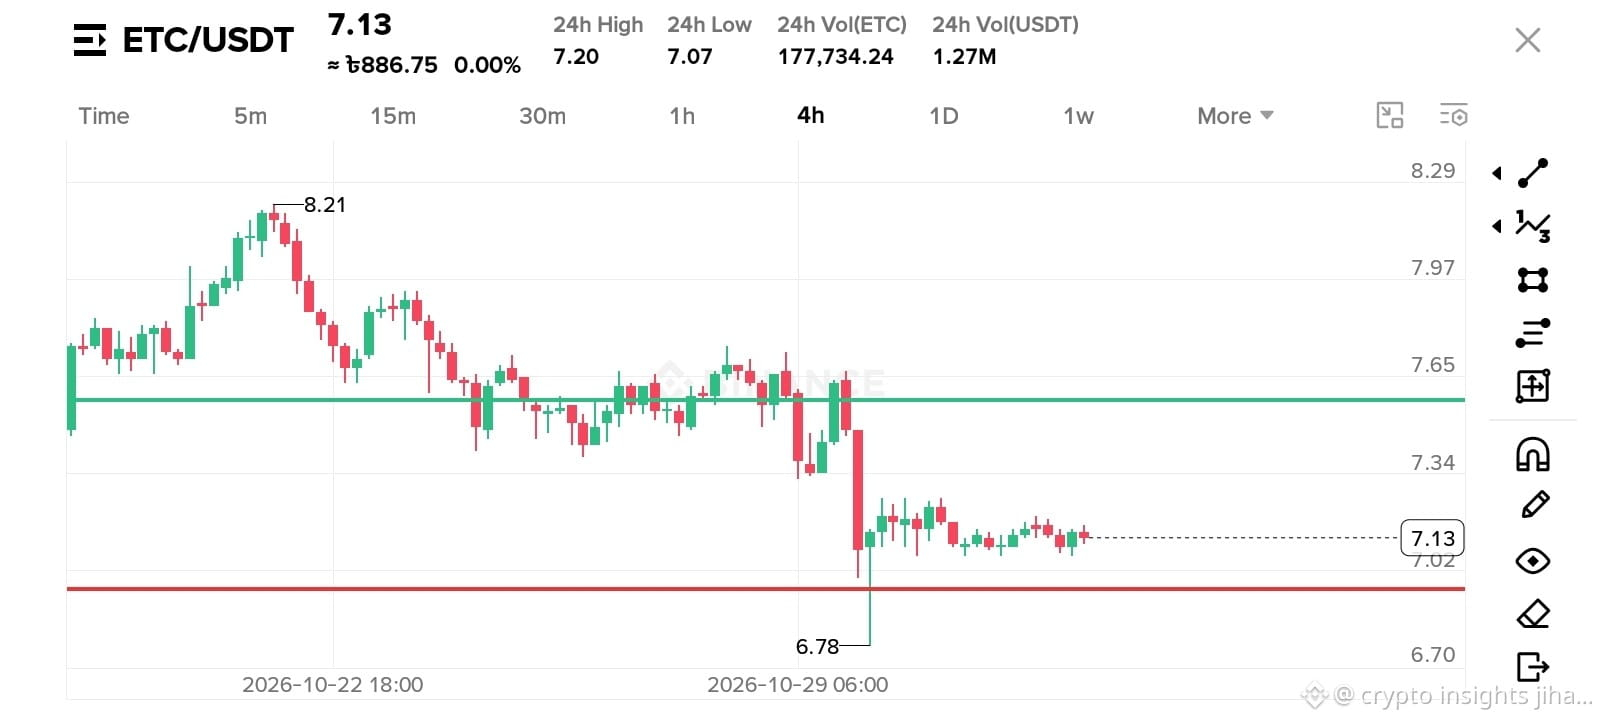
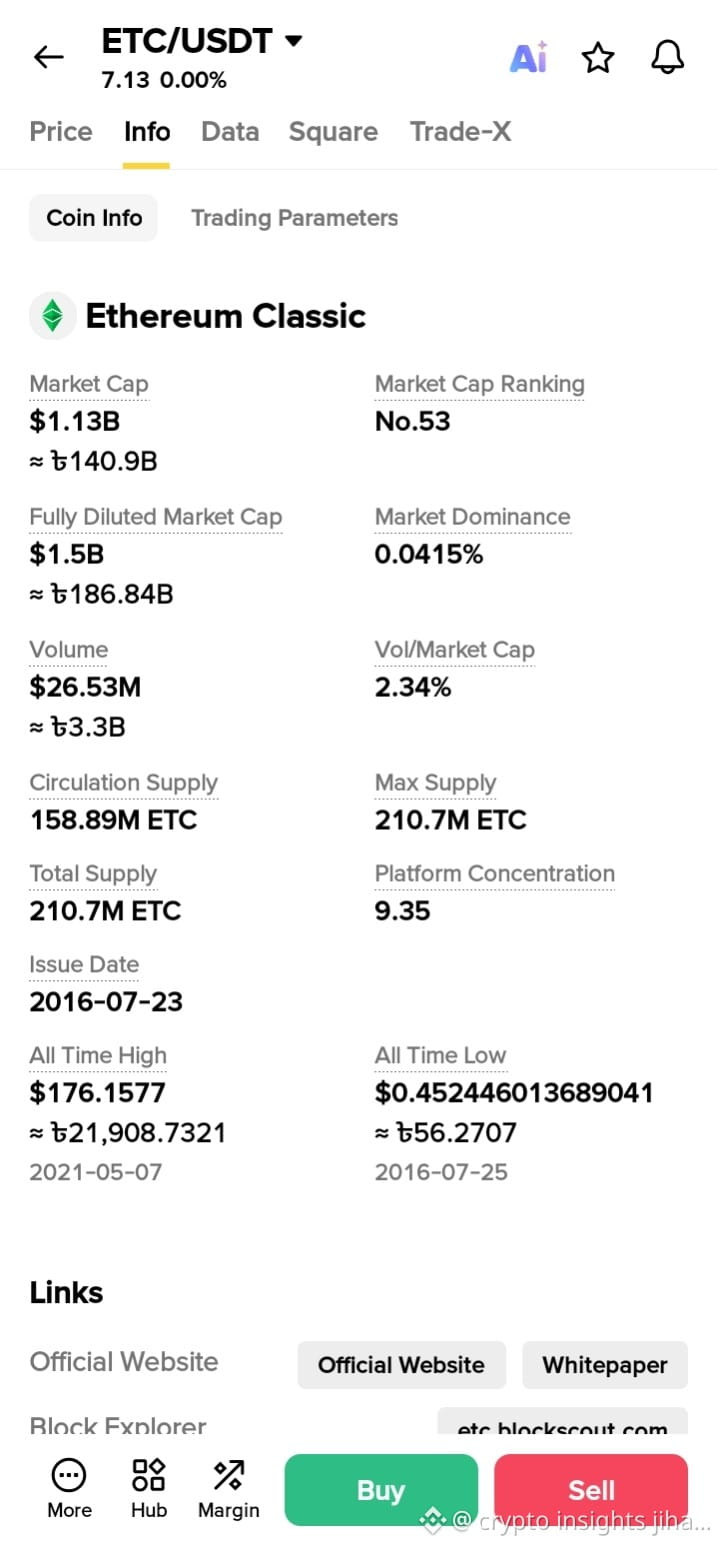
$ETC is playing textbook.
Look at 4H chart - clear rejection from 8.21 then slow bleed to 6.78. That long wick down to 6.78 was pure liquidity sweep, stopped out everyone. Red line held like a rock.
Now price stuck at 7.13 and building base. Volume drying up means sellers tired.
My target is green line - 7.55 area. That's the previous support turned resistance. If we break that, 7.55 will be easy.
Invalidation if we close below red line. But for now, long bias.
Not financial advice, just what I see.
#ETC #ETCUSDT
$ETC
$ETC is playing textbook.
Look at 4H chart - clear rejection from 8.21 then slow bleed to 6.78. That long wick down to 6.78 was pure liquidity sweep, stopped out everyone. Red line held like a rock.
Now price stuck at 7.13 and building base. Volume drying up means sellers tired.
My target is green line - 7.55 area. That's the previous support turned resistance. If we break that, 7.55 will be easy.
Invalidation if we close below red line. But for now, long bias.
Not financial advice, just what I see.
#ETC #ETCUSDT
$ETC is playing textbook.
Look at 4H chart - clear rejection from 8.21 then slow bleed to 6.78. That long wick down to 6.78 was pure liquidity sweep, stopped out everyone. Red line held like a rock.
Now price stuck at 7.13 and building base. Volume drying up means sellers tired.
My target is green line - 7.55 area. That's the previous support turned resistance. If we break that, 7.55 will be easy.
Invalidation if we close below red line. But for now, long bias.
Not financial advice, just what I see.
#ETC #ETCUSDT
2
392
$RVN
{spot}(RVNUSDT)
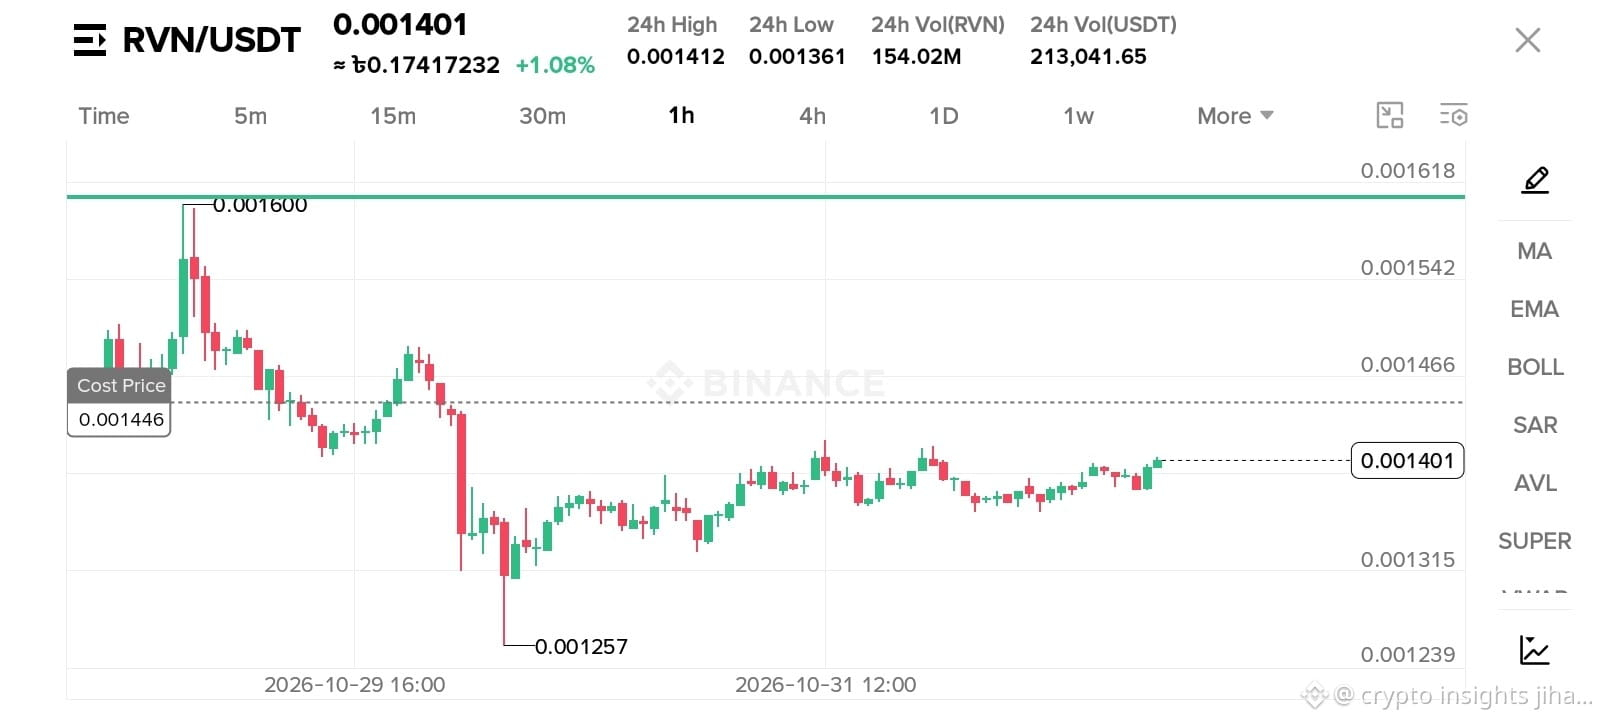
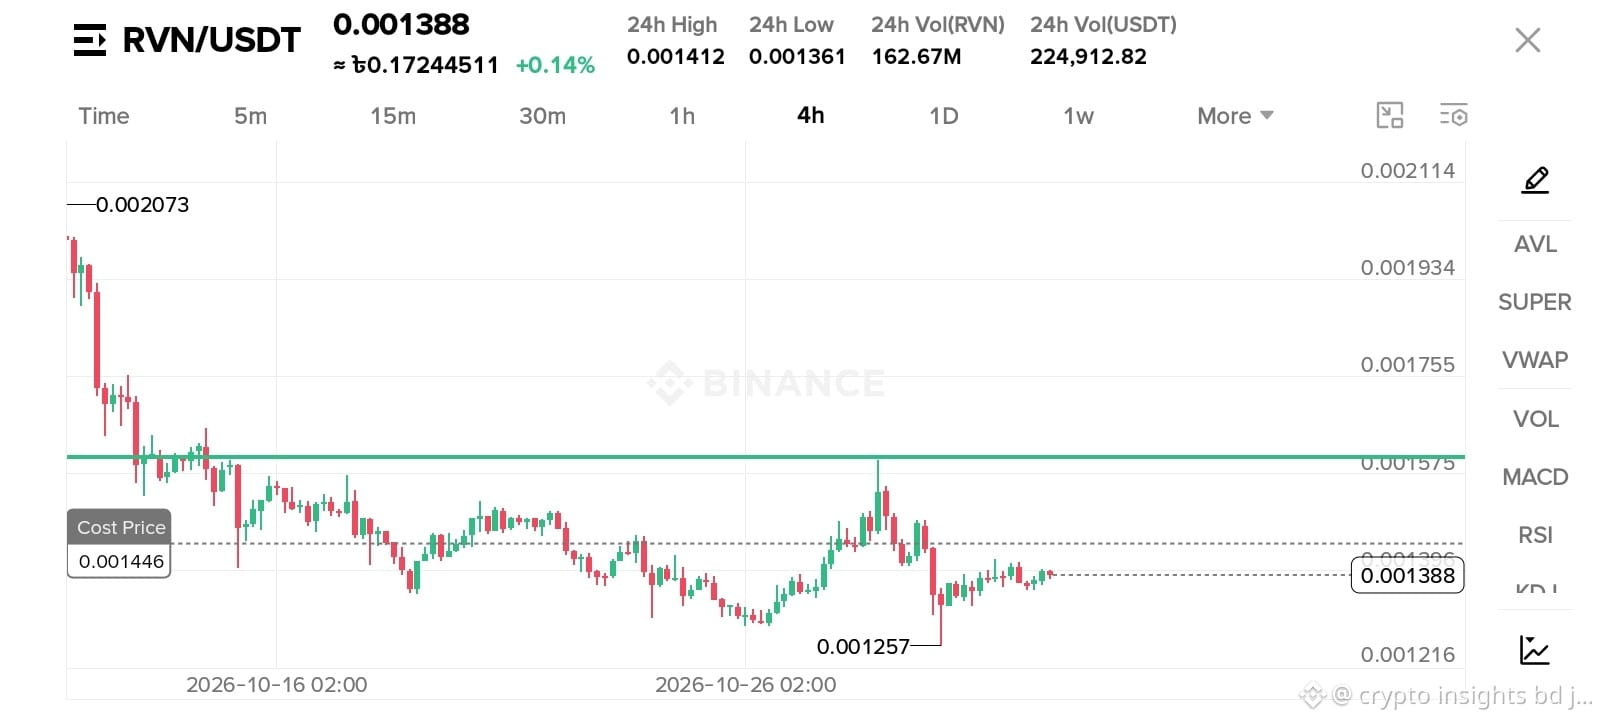
I'm still down on RVN, not gonna lie.
My cost is 0.001446 and price is 0.001388 now.
Chart shows we touched 0.001257 bottom and survived.
That green line at 0.001575 is the real boss. Until we break it, it's just pain.
But volume is 162M, people are still here. I'm holding.
Are you still holding RVN or already sold?
$RVN
I'm still down on RVN, not gonna lie.
My cost is 0.001446 and price is 0.001388 now.
Chart shows we touched 0.001257 bottom and survived.
That green line at 0.001575 is the real boss. Until we break it, it's just pain.
But volume is 162M, people are still here. I'm holding.
Are you still holding RVN or already sold?
I'm still down on RVN, not gonna lie.
My cost is 0.001446 and price is 0.001388 now.
Chart shows we touched 0.001257 bottom and survived.
That green line at 0.001575 is the real boss. Until we break it, it's just pain.
But volume is 162M, people are still here. I'm holding.
Are you still holding RVN or already sold?
16
985
$PEPE
{spot}(PEPEUSDT)
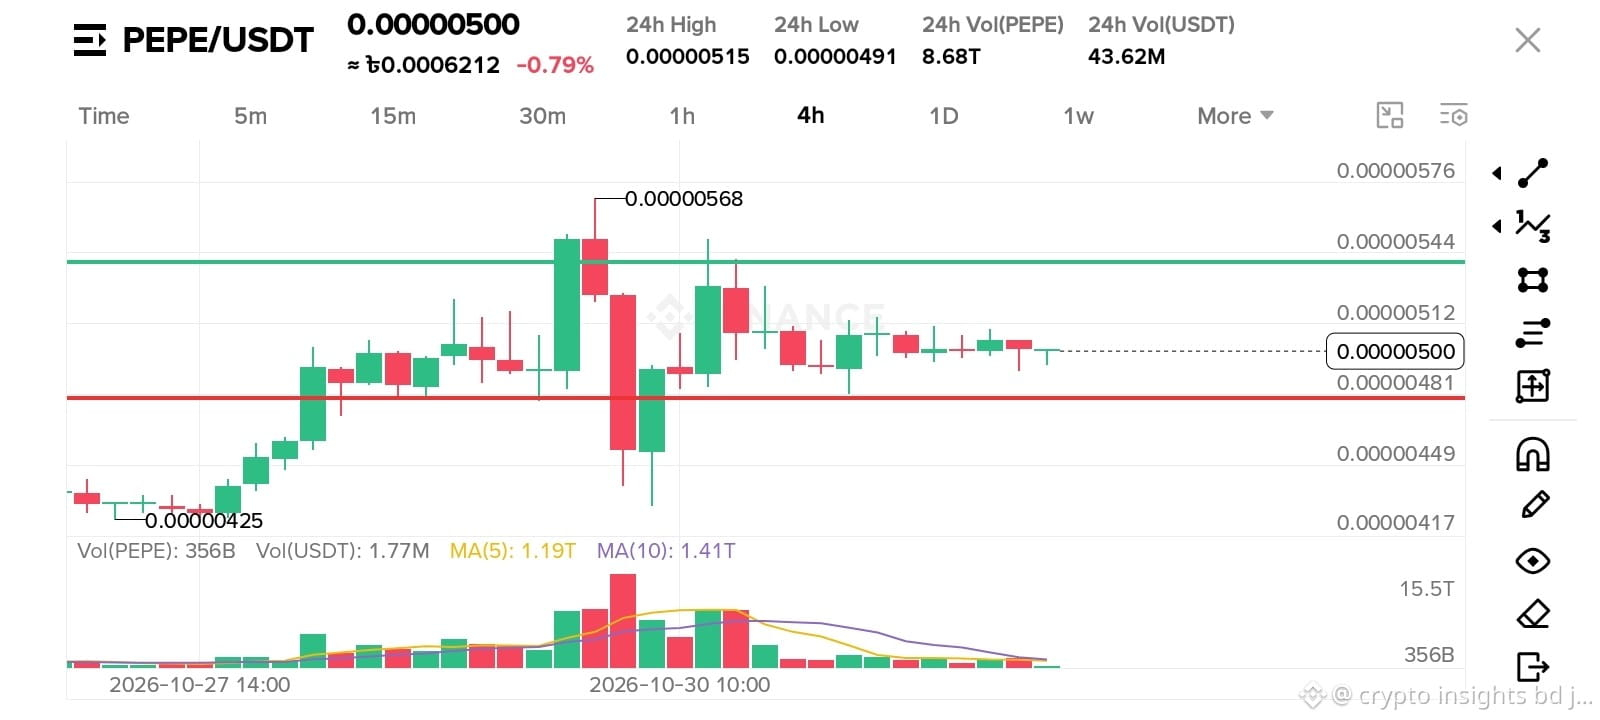
I can't sleep looking at this chart man.
It ran from 0.00000425 straight to 0.00000568, and now it's just sitting at 0.00000500 like nothing happened.
See that green line on top? 0.00000535. That's the wall. If it breaks that, it's gone.
And the red line below, 0.00000481 - market is not letting it break. Every time it touches, it bounces.
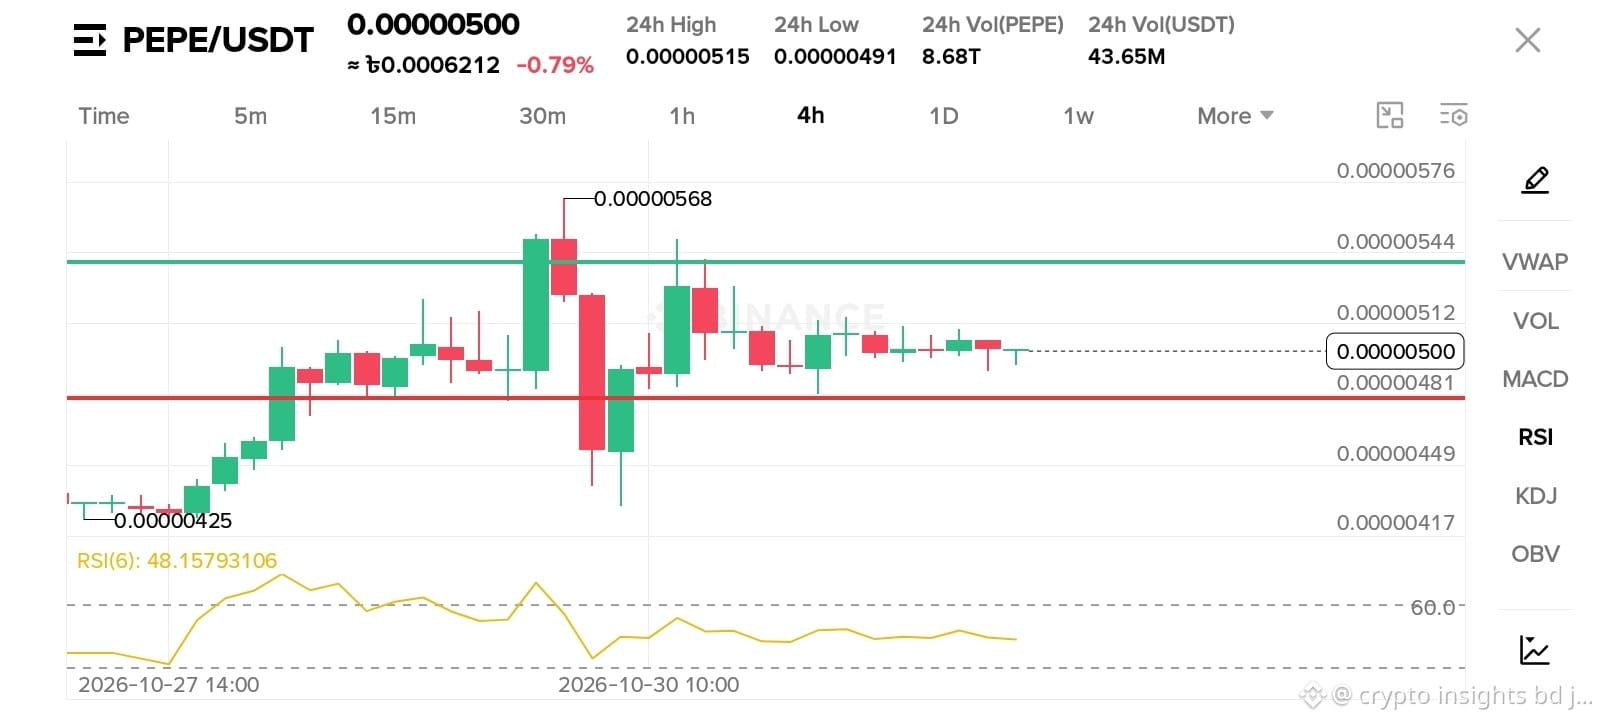
Volume is dead. MA(5) and MA(10) are squeezed together. You know what that means. A big move is coming, very soon.
I couldn't wait anymore. Took a small long, SL just below the red line.
I don't know what you will do, but this tight zone won't last long.
$PEPE #PEPE
NFA, just sharing my position.
$PEPE
I can't sleep looking at this chart man.
It ran from 0.00000425 straight to 0.00000568, and now it's just sitting at 0.00000500 like nothing happened.
See that green line on top? 0.00000535. That's the wall. If it breaks that, it's gone.
And the red line below, 0.00000481 - market is not letting it break. Every time it touches, it bounces.
Volume is dead. MA(5) and MA(10) are squeezed together. You know what that means. A big move is coming, very soon.
I couldn't wait anymore. Took a small long, SL just below the red line.
I don't know what you will do, but this tight zone won't last long.
$PEPE #PEPE
NFA, just sharing my position.
I can't sleep looking at this chart man.
It ran from 0.00000425 straight to 0.00000568, and now it's just sitting at 0.00000500 like nothing happened.
See that green line on top? 0.00000535. That's the wall. If it breaks that, it's gone.
And the red line below, 0.00000481 - market is not letting it break. Every time it touches, it bounces.
Volume is dead. MA(5) and MA(10) are squeezed together. You know what that means. A big move is coming, very soon.
I couldn't wait anymore. Took a small long, SL just below the red line.
I don't know what you will do, but this tight zone won't last long.
$PEPE #PEPE
NFA, just sharing my position.
2
779
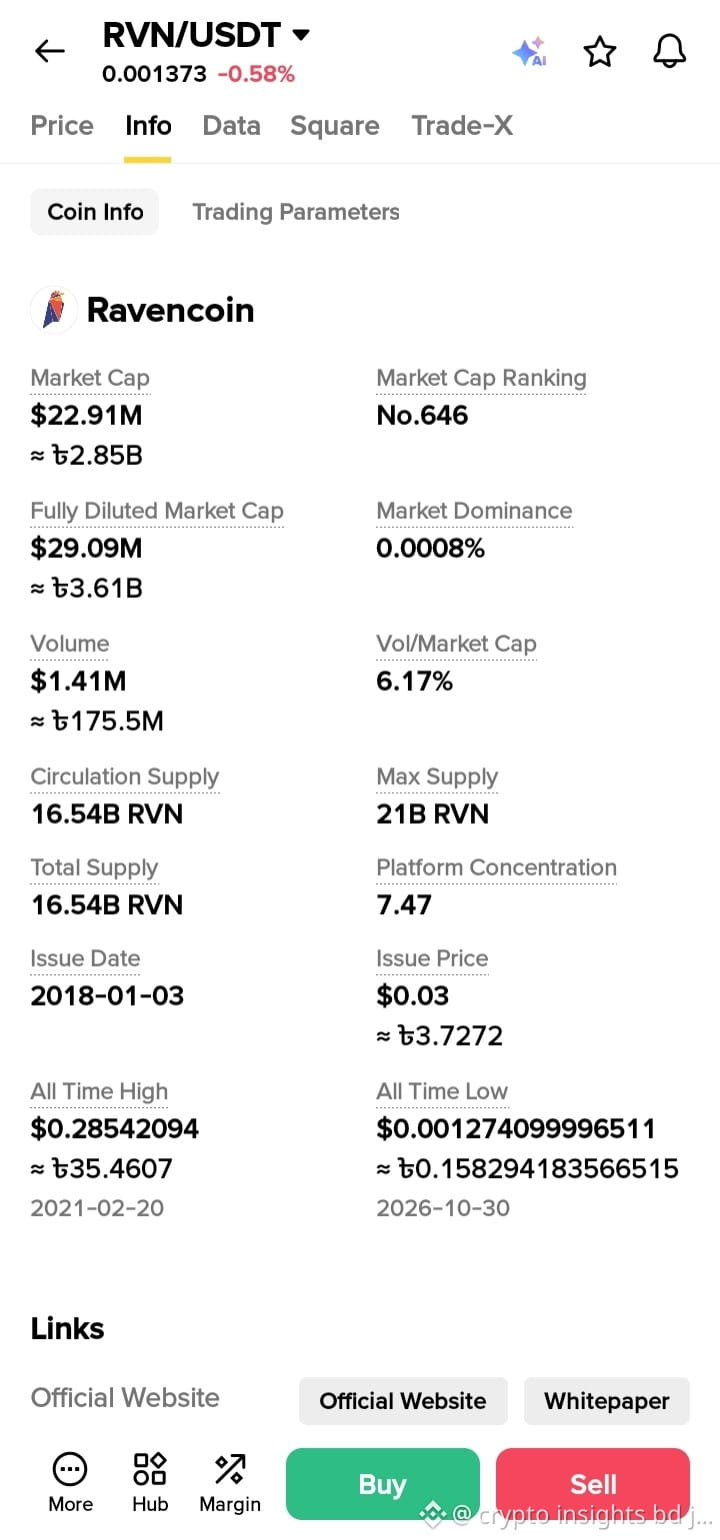
$RVN
{future}(RVNUSDT)
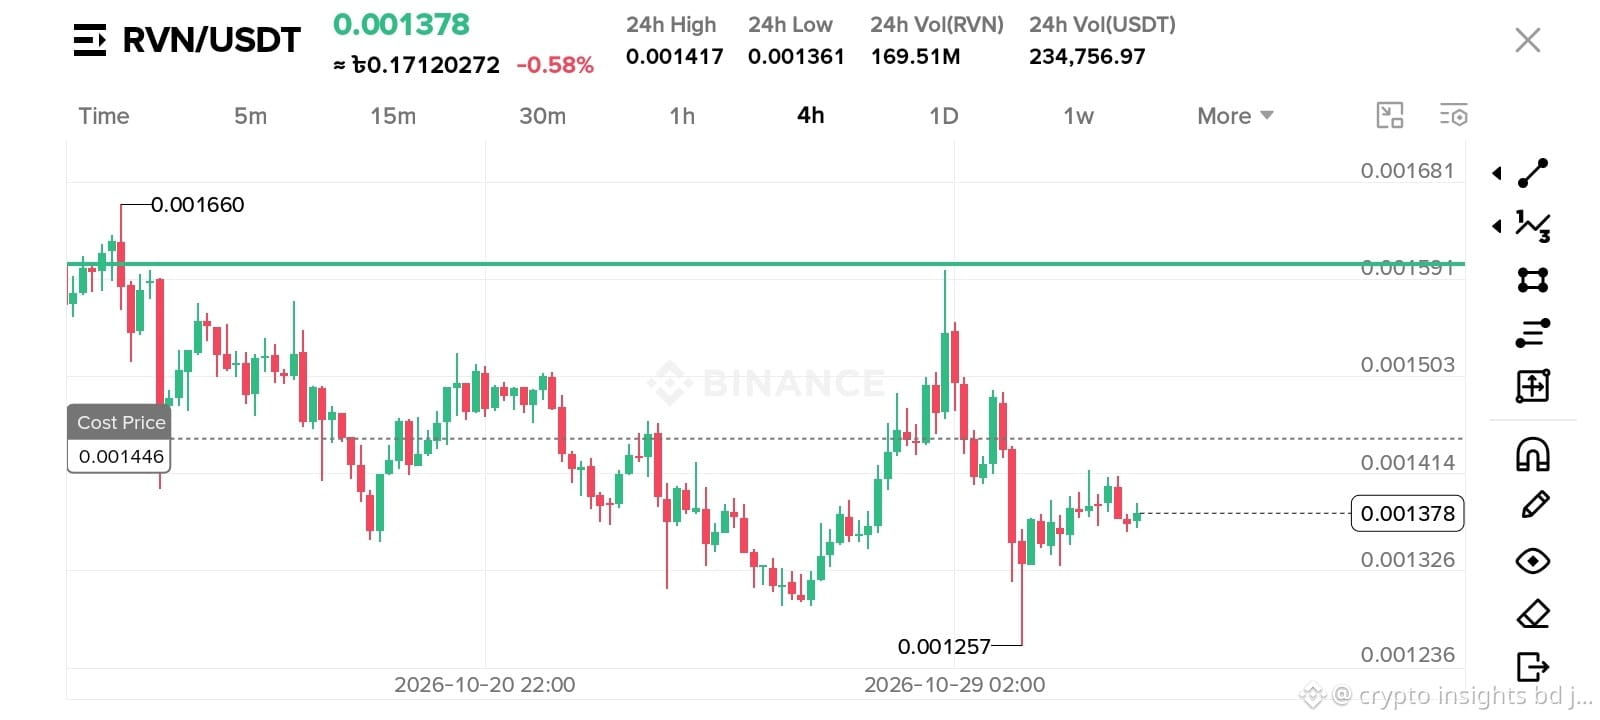
Me to RVN: Smash that $0.00160 resistance.
RVN at $0.00137: hehehehe 😈
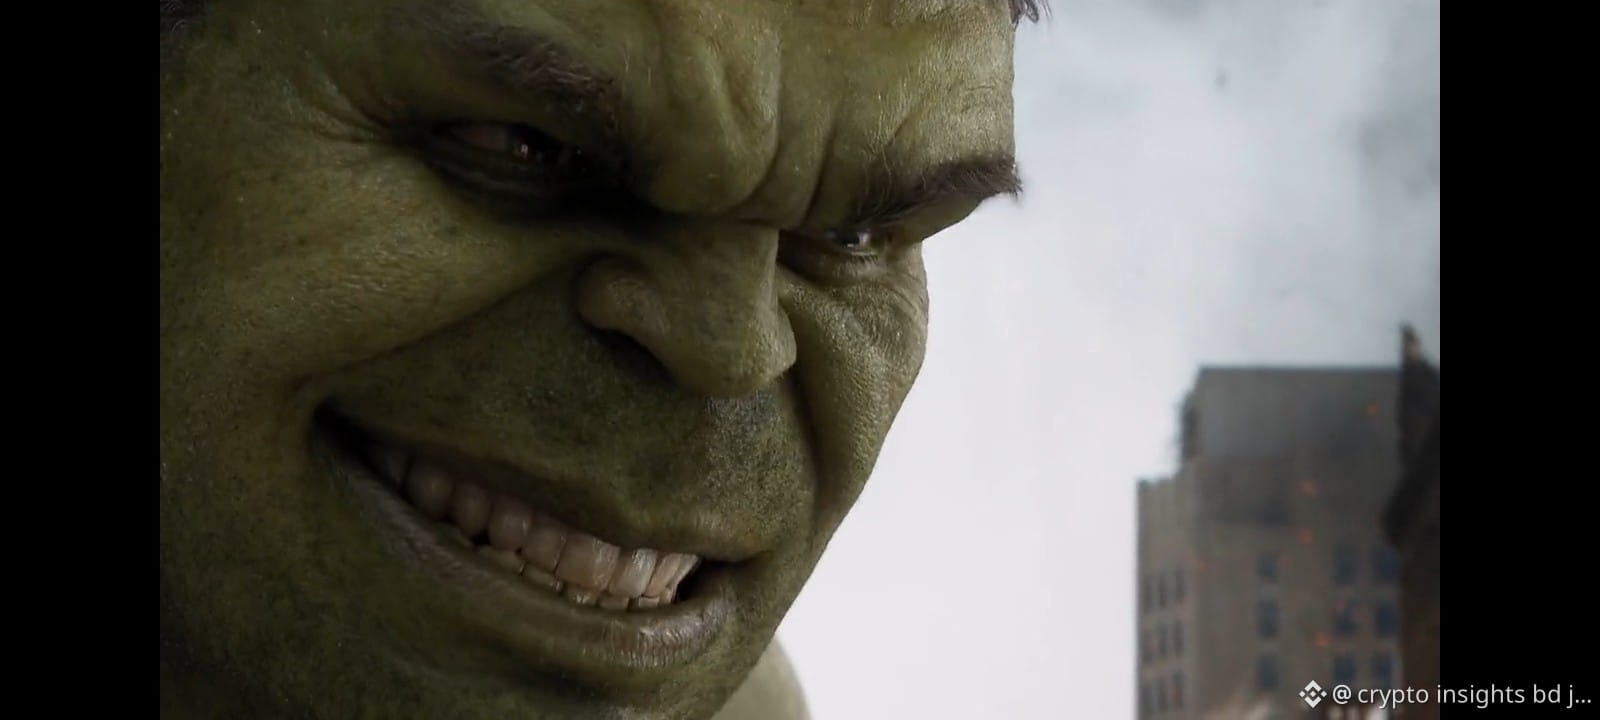
Still holding this dead coin from last bull run. Lets see if hulk really smashes this time.
$RVN #RVN
$RVN
Me to RVN: Smash that $0.00160 resistance.
RVN at $0.00137: hehehehe 😈
Still holding this dead coin from last bull run. Lets see if hulk really smashes this time.
$RVN #RVN
Me to RVN: Smash that $0.00160 resistance.
RVN at $0.00137: hehehehe 😈
Still holding this dead coin from last bull run. Lets see if hulk really smashes this time.
$RVN #RVN

674
$LTC
{spot}(LTCUSDT)
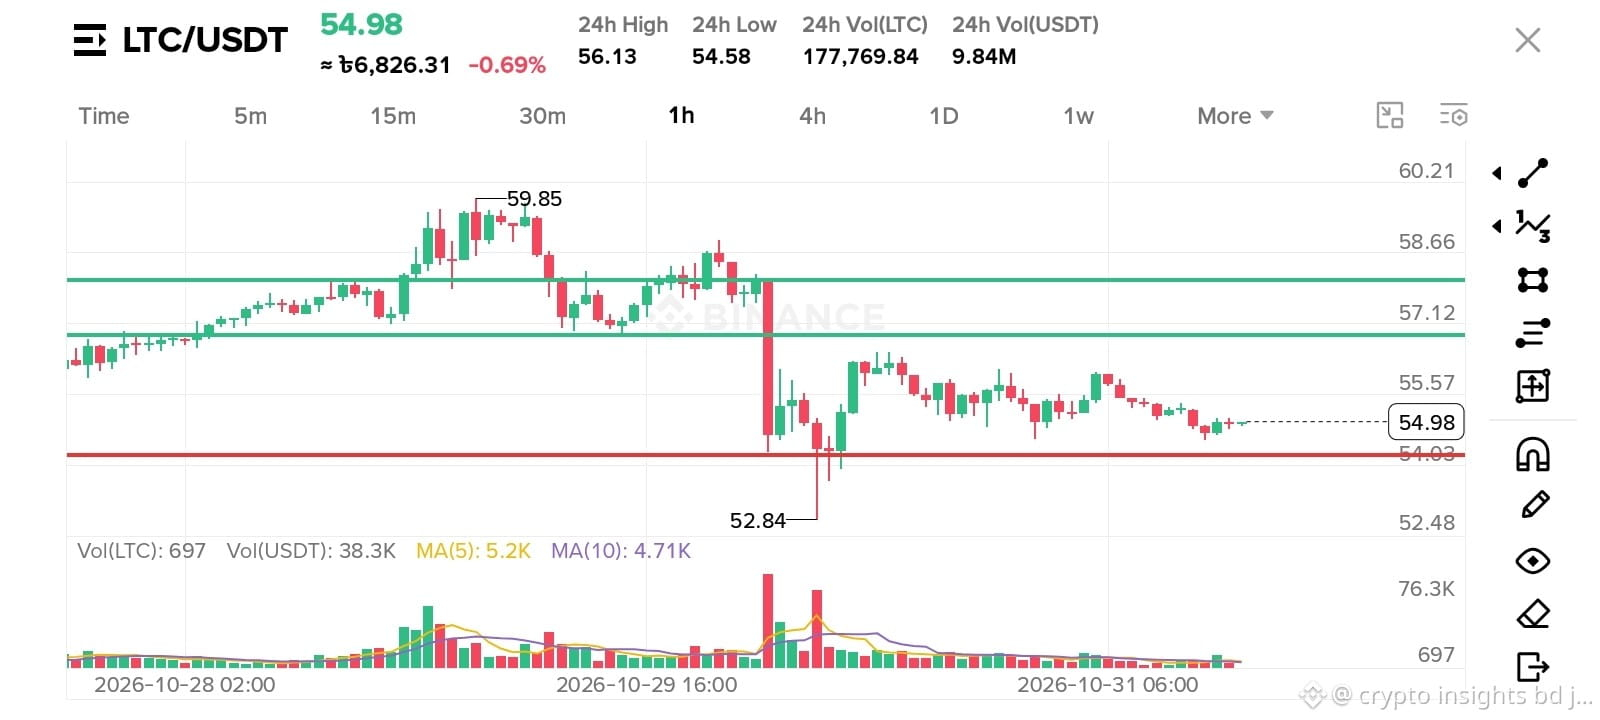
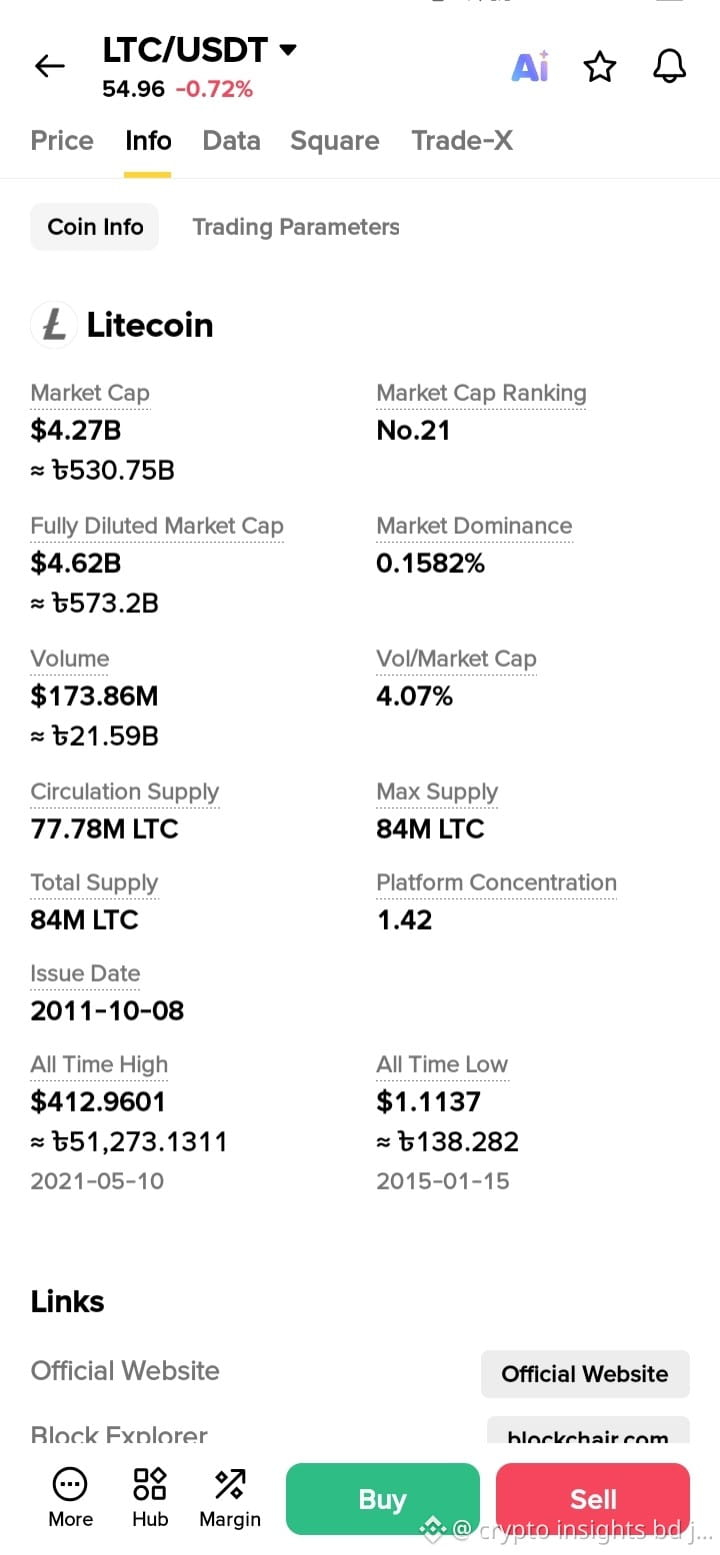
LTC/USDT- honestly this is the level i was waiting for
Price now $54.98, -0.69% today. 24h high $56.13 low $54.58
Look guys on 1h chart it made a top at $59.85 and then that big red candle dumped straight to $52.84. that was a proper shakeout. volume also spiked a lot that time, 177k LTC.
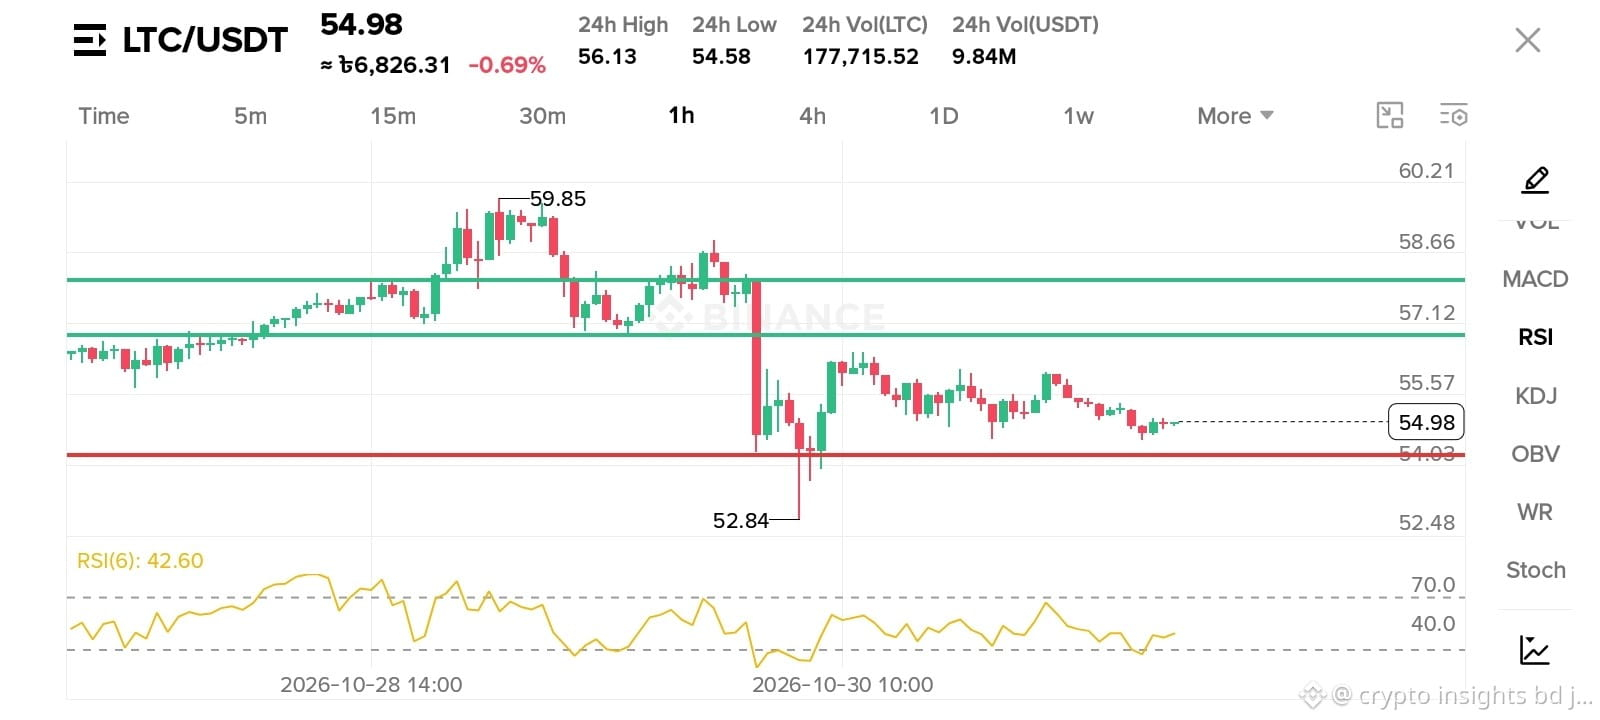
Now see my lines, green lines around $56.80 and $57.80 was support before, now that is acting as resistance. price could not break it again.
But main thing is this red line at $54.03. price is just above it at $54.98. last time it wicked to $52.84 but closed above this red line. so buyers are still defending it.
RSI(6) is 42.60, not oversold, not overbought. neutral zone. means if $54.03 holds, we can see a small bounce to $55.50 - $56 again.
I personally think if ltc holds $54.03, long opportunity is good with tight sl below $53.90. break below then risk is more.
in my opinion it will hit green line /TP.
Just my view, not financial advice.
#LTC #USDT #CryptoAnalysis
$LTC
LTC/USDT- honestly this is the level i was waiting for
Price now $54.98, -0.69% today. 24h high $56.13 low $54.58
Look guys on 1h chart it made a top at $59.85 and then that big red candle dumped straight to $52.84. that was a proper shakeout. volume also spiked a lot that time, 177k LTC.
Now see my lines, green lines around $56.80 and $57.80 was support before, now that is acting as resistance. price could not break it again.
But main thing is this red line at $54.03. price is just above it at $54.98. last time it wicked to $52.84 but closed above this red line. so buyers are still defending it.
RSI(6) is 42.60, not oversold, not overbought. neutral zone. means if $54.03 holds, we can see a small bounce to $55.50 - $56 again.
I personally think if ltc holds $54.03, long opportunity is good with tight sl below $53.90. break below then risk is more.
in my opinion it will hit green line /TP.
Just my view, not financial advice.
#LTC #USDT #CryptoAnalysis
LTC/USDT- honestly this is the level i was waiting for
Price now $54.98, -0.69% today. 24h high $56.13 low $54.58
Look guys on 1h chart it made a top at $59.85 and then that big red candle dumped straight to $52.84. that was a proper shakeout. volume also spiked a lot that time, 177k LTC.
Now see my lines, green lines around $56.80 and $57.80 was support before, now that is acting as resistance. price could not break it again.
But main thing is this red line at $54.03. price is just above it at $54.98. last time it wicked to $52.84 but closed above this red line. so buyers are still defending it.
RSI(6) is 42.60, not oversold, not overbought. neutral zone. means if $54.03 holds, we can see a small bounce to $55.50 - $56 again.
I personally think if ltc holds $54.03, long opportunity is good with tight sl below $53.90. break below then risk is more.
in my opinion it will hit green line /TP.
Just my view, not financial advice.
#LTC #USDT #CryptoAnalysis
218
·
--
Жоғары (өспелі)
$KAS
{future}(KASUSDT)
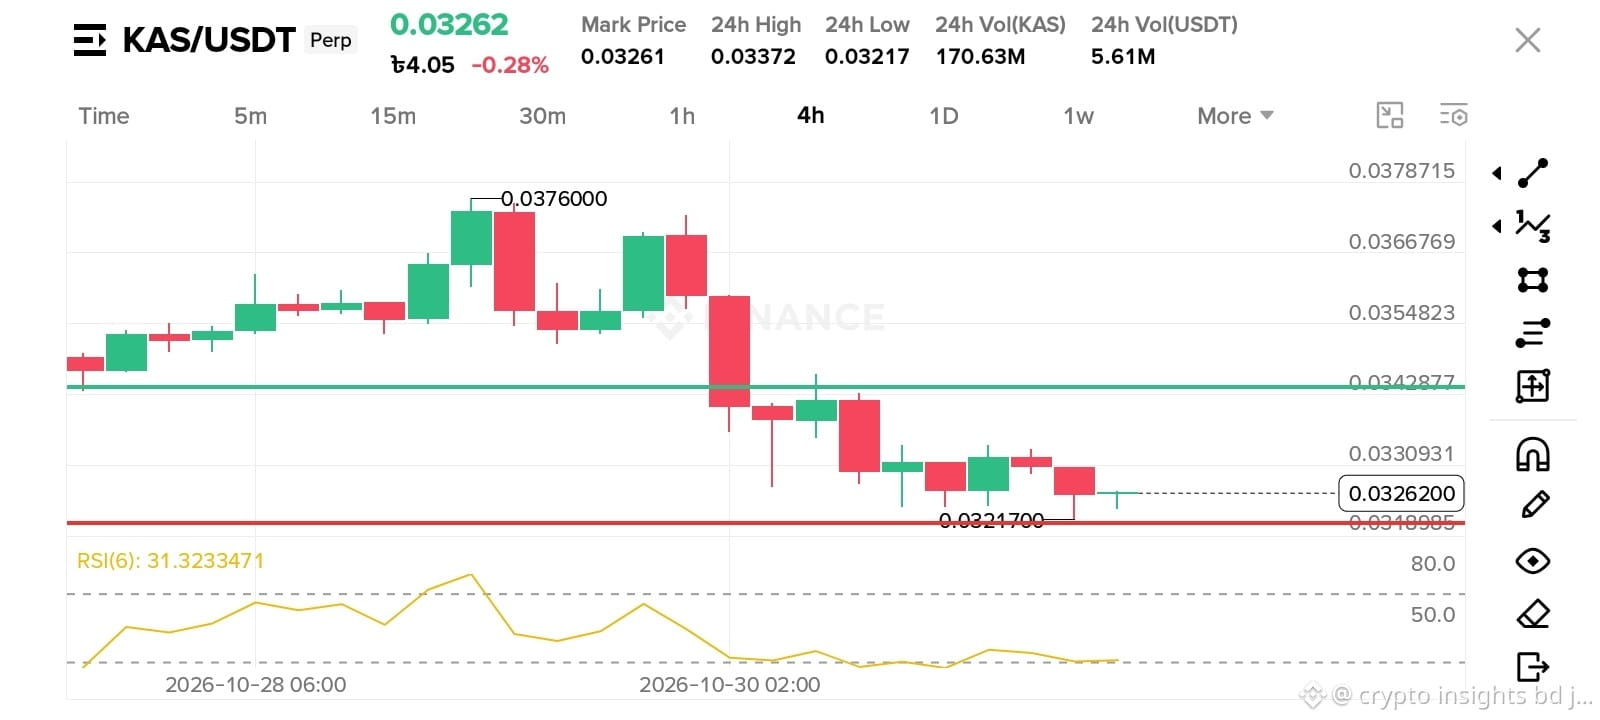
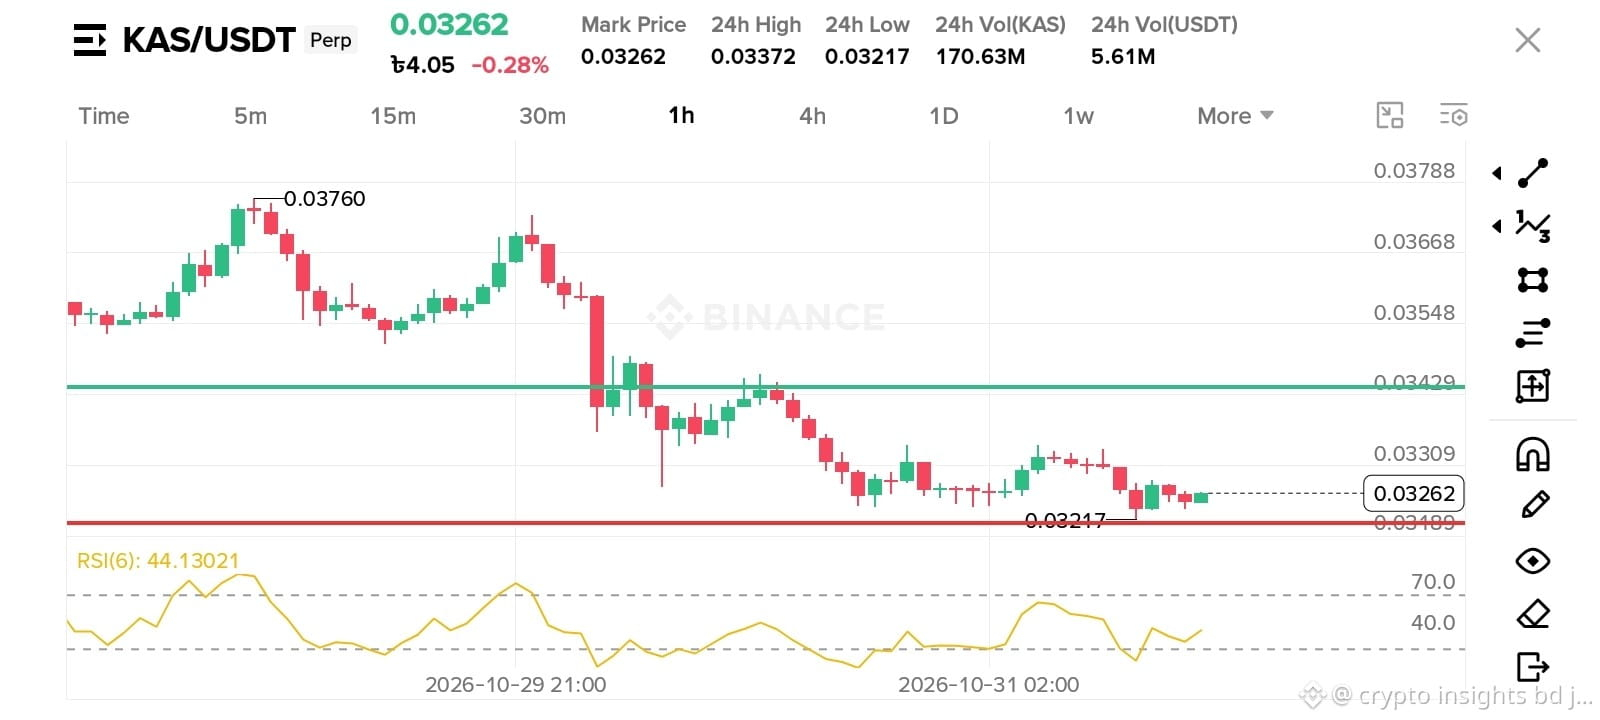
KAS/USDT is at make or break level
Price: $0.03262
24h low: $0.03217 just tested and bounced
look at chart after top at 0.03760 price dumped straight. now green line 0.03428 is big resistance to break.
but here is opportunity, rsi on 4h is 31.3 which is almost oversold. means sellers are tired. and price is holding red support at $0.03217 very strongly.
if support holds, next target is $0.03428, thats almost 5% move from here. risk is small, reward is good.
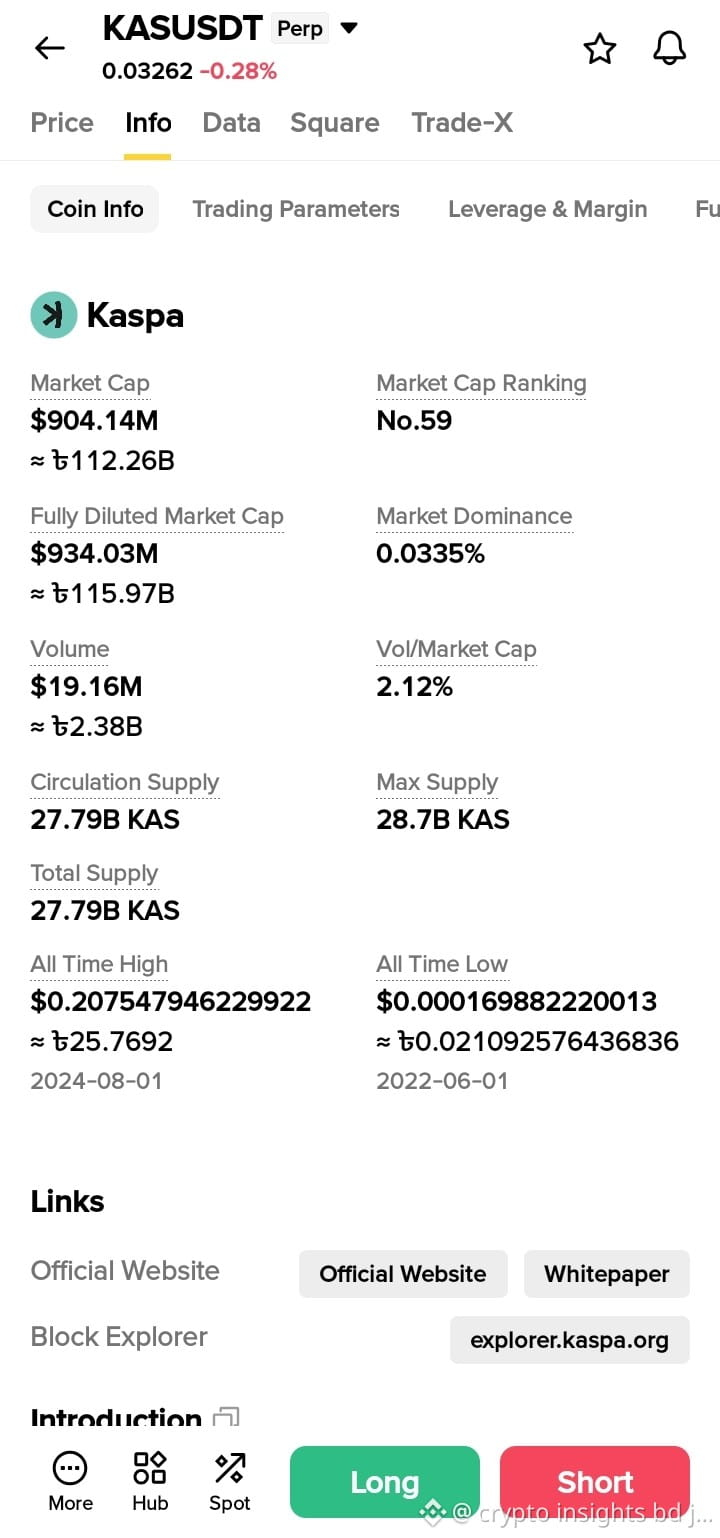
170m volume shows buyers are coming back slowly.
I am watching for a long entry above $0.03270 with SL below $0.03210
What you guys think, bounce coming?
In my opinion it will go up if it $0.03262 hols.
#KAS #USDT #CryptoAnalysis"
$KAS
KAS/USDT is at make or break level
Price: $0.03262
24h low: $0.03217 just tested and bounced
look at chart after top at 0.03760 price dumped straight. now green line 0.03428 is big resistance to break.
but here is opportunity, rsi on 4h is 31.3 which is almost oversold. means sellers are tired. and price is holding red support at $0.03217 very strongly.
if support holds, next target is $0.03428, thats almost 5% move from here. risk is small, reward is good.
170m volume shows buyers are coming back slowly.
I am watching for a long entry above $0.03270 with SL below $0.03210
What you guys think, bounce coming?
In my opinion it will go up if it $0.03262 hols.
#KAS #USDT #CryptoAnalysis"
KAS/USDT is at make or break level
Price: $0.03262
24h low: $0.03217 just tested and bounced
look at chart after top at 0.03760 price dumped straight. now green line 0.03428 is big resistance to break.
but here is opportunity, rsi on 4h is 31.3 which is almost oversold. means sellers are tired. and price is holding red support at $0.03217 very strongly.
if support holds, next target is $0.03428, thats almost 5% move from here. risk is small, reward is good.
170m volume shows buyers are coming back slowly.
I am watching for a long entry above $0.03270 with SL below $0.03210
What you guys think, bounce coming?
In my opinion it will go up if it $0.03262 hols.
#KAS #USDT #CryptoAnalysis"
118
·
--
Жоғары (өспелі)
$BCH
{spot}(BCHUSDT)
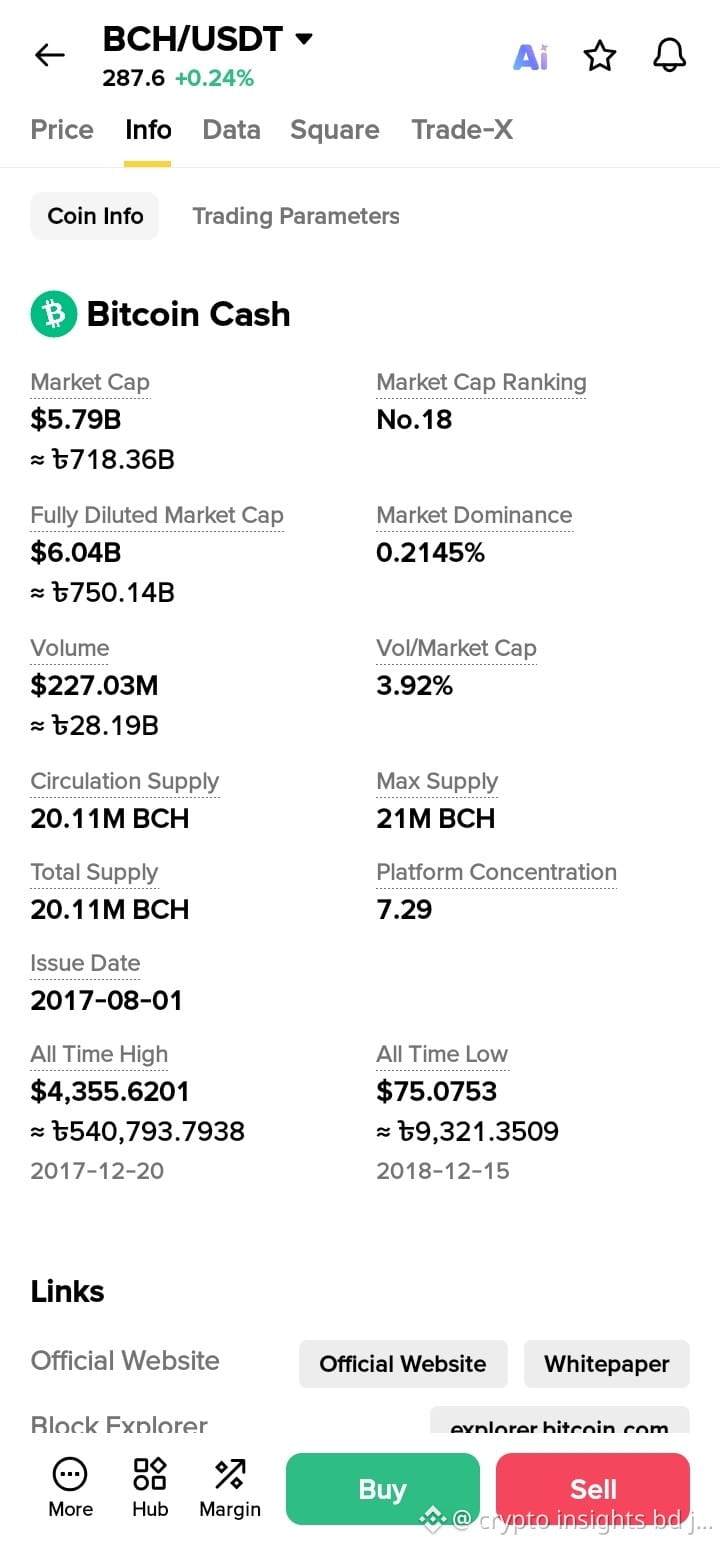
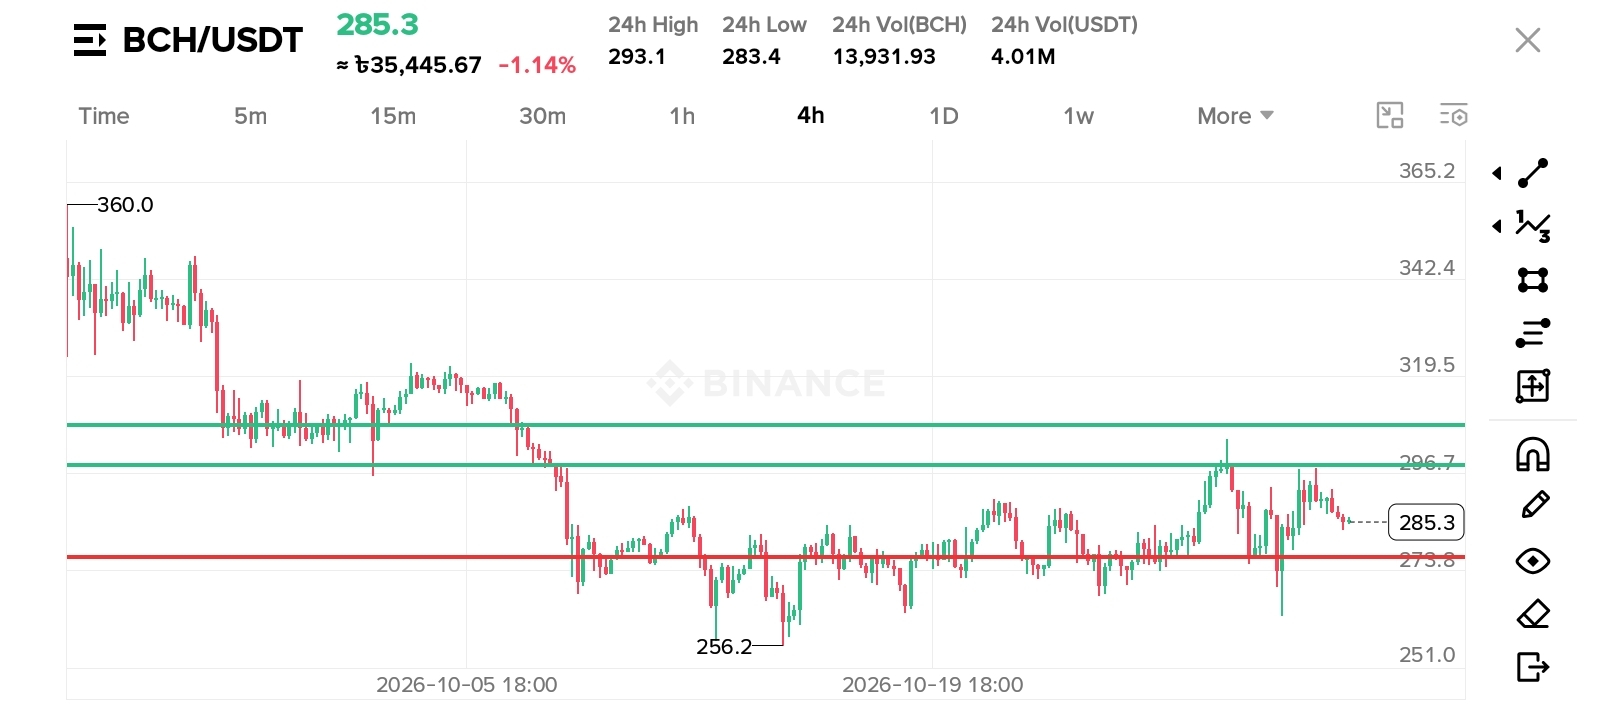
BCH/USDT 4H Update: Key Level Holding
BCH is trading at 288.0 now, +0.24% in 24h.
On 4H chart, resistance is very clear at $297.7. Price wicked to $304.8 but failed to close above it. So sellers are active there.
Support is around $283 - $284 zone (red line). BCH is holding just above it right now, which is a good sign.
RSI(6) at 49.4 - completely neutral. Means no overbought or oversold pressure.
24H Volume 7.84M USDT, not huge but stable. My plan is simple: Hold above $283 bullish attempt toward $297.7 again. Break below $283 = risk down to $270.
In my opinion it will go up .
Not financial advice. Just sharing my view.
#BCH #BCHUSDT #CryptoAnalysis
$BCH
BCH/USDT 4H Update: Key Level Holding
BCH is trading at 288.0 now, +0.24% in 24h.
On 4H chart, resistance is very clear at $297.7. Price wicked to $304.8 but failed to close above it. So sellers are active there.
Support is around $283 - $284 zone (red line). BCH is holding just above it right now, which is a good sign.
RSI(6) at 49.4 - completely neutral. Means no overbought or oversold pressure.
24H Volume 7.84M USDT, not huge but stable. My plan is simple: Hold above $283 bullish attempt toward $297.7 again. Break below $283 = risk down to $270.
In my opinion it will go up .
Not financial advice. Just sharing my view.
#BCH #BCHUSDT #CryptoAnalysis
BCH/USDT 4H Update: Key Level Holding
BCH is trading at 288.0 now, +0.24% in 24h.
On 4H chart, resistance is very clear at $297.7. Price wicked to $304.8 but failed to close above it. So sellers are active there.
Support is around $283 - $284 zone (red line). BCH is holding just above it right now, which is a good sign.
RSI(6) at 49.4 - completely neutral. Means no overbought or oversold pressure.
24H Volume 7.84M USDT, not huge but stable. My plan is simple: Hold above $283 bullish attempt toward $297.7 again. Break below $283 = risk down to $270.
In my opinion it will go up .
Not financial advice. Just sharing my view.
#BCH #BCHUSDT #CryptoAnalysis
236
$SEI
{spot}(SEIUSDT)
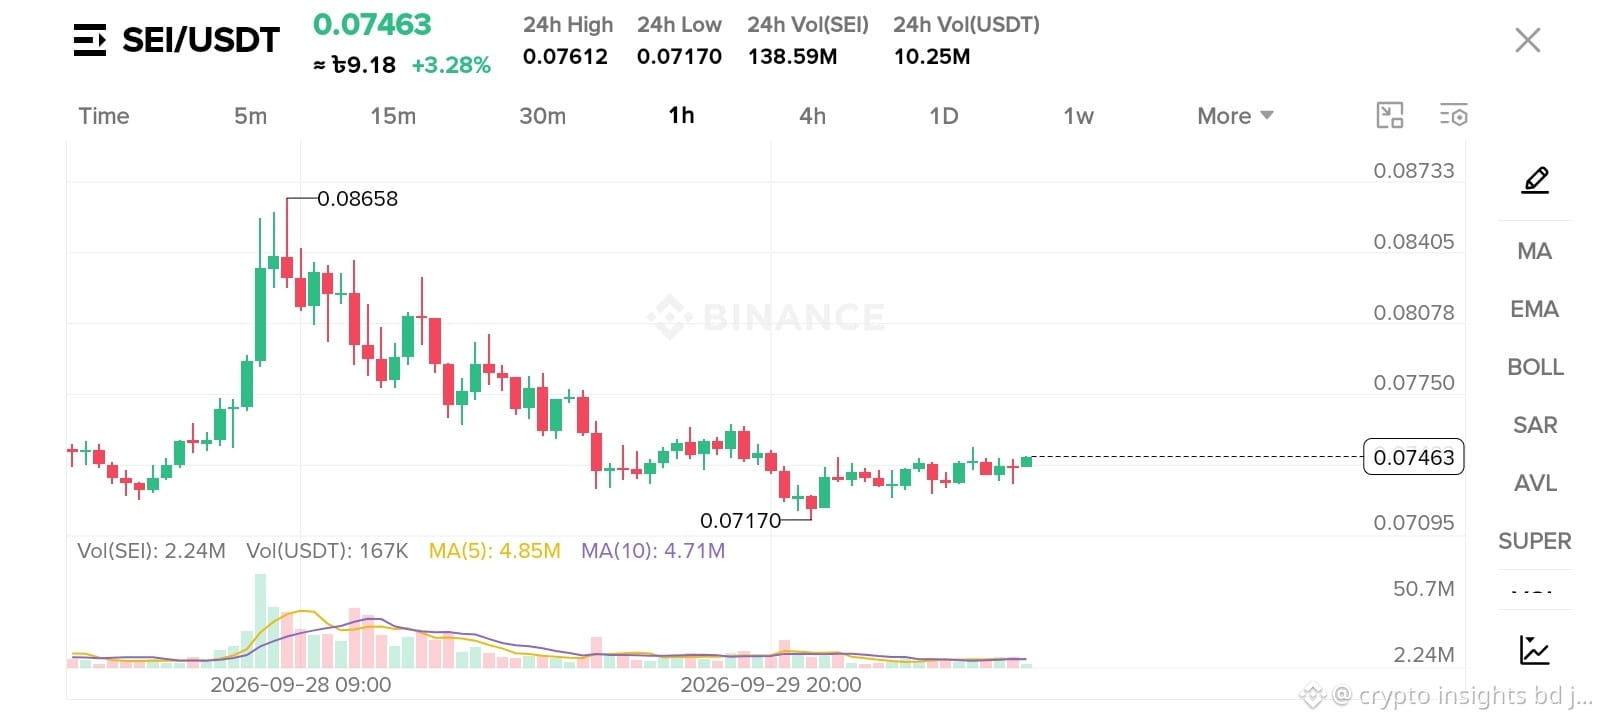
SEI finally showing some green today, up 3.28% and trading around 0.07463.
Yesterday it pumped hard to $0.08658 but couldn't hold, then dumped all the way to 0.07170.
That $0.07170 level worked as solid support, price took a bounce from there.
Right now it's not pumping, just slowly consolidating sideways after the big fall.
24h volume is decent - 138.59M SEI ($10.25M), buyers are coming back slowly.
MA(5) and MA(10) are flat at the bottom, which means the downtrend might be over for now.
If SEI can stay above $0.072, we can expect a move towards $0.07612 which is today's high.
I'm watching this range, no need to rush. This is not financial advice, always do your own research.
my plan
SL $0.07250
TP $0.07800
#SEI #SEIUSDT #CryptoAnalysis
$SEI
SEI finally showing some green today, up 3.28% and trading around 0.07463.
Yesterday it pumped hard to $0.08658 but couldn't hold, then dumped all the way to 0.07170.
That $0.07170 level worked as solid support, price took a bounce from there.
Right now it's not pumping, just slowly consolidating sideways after the big fall.
24h volume is decent - 138.59M SEI ($10.25M), buyers are coming back slowly.
MA(5) and MA(10) are flat at the bottom, which means the downtrend might be over for now.
If SEI can stay above $0.072, we can expect a move towards $0.07612 which is today's high.
I'm watching this range, no need to rush. This is not financial advice, always do your own research.
my plan
SL $0.07250
TP $0.07800
#SEI #SEIUSDT #CryptoAnalysis
SEI finally showing some green today, up 3.28% and trading around 0.07463.
Yesterday it pumped hard to $0.08658 but couldn't hold, then dumped all the way to 0.07170.
That $0.07170 level worked as solid support, price took a bounce from there.
Right now it's not pumping, just slowly consolidating sideways after the big fall.
24h volume is decent - 138.59M SEI ($10.25M), buyers are coming back slowly.
MA(5) and MA(10) are flat at the bottom, which means the downtrend might be over for now.
If SEI can stay above $0.072, we can expect a move towards $0.07612 which is today's high.
I'm watching this range, no need to rush. This is not financial advice, always do your own research.
my plan
SL $0.07250
TP $0.07800
#SEI #SEIUSDT #CryptoAnalysis
347
$BTC
{spot}(BTCUSDT)
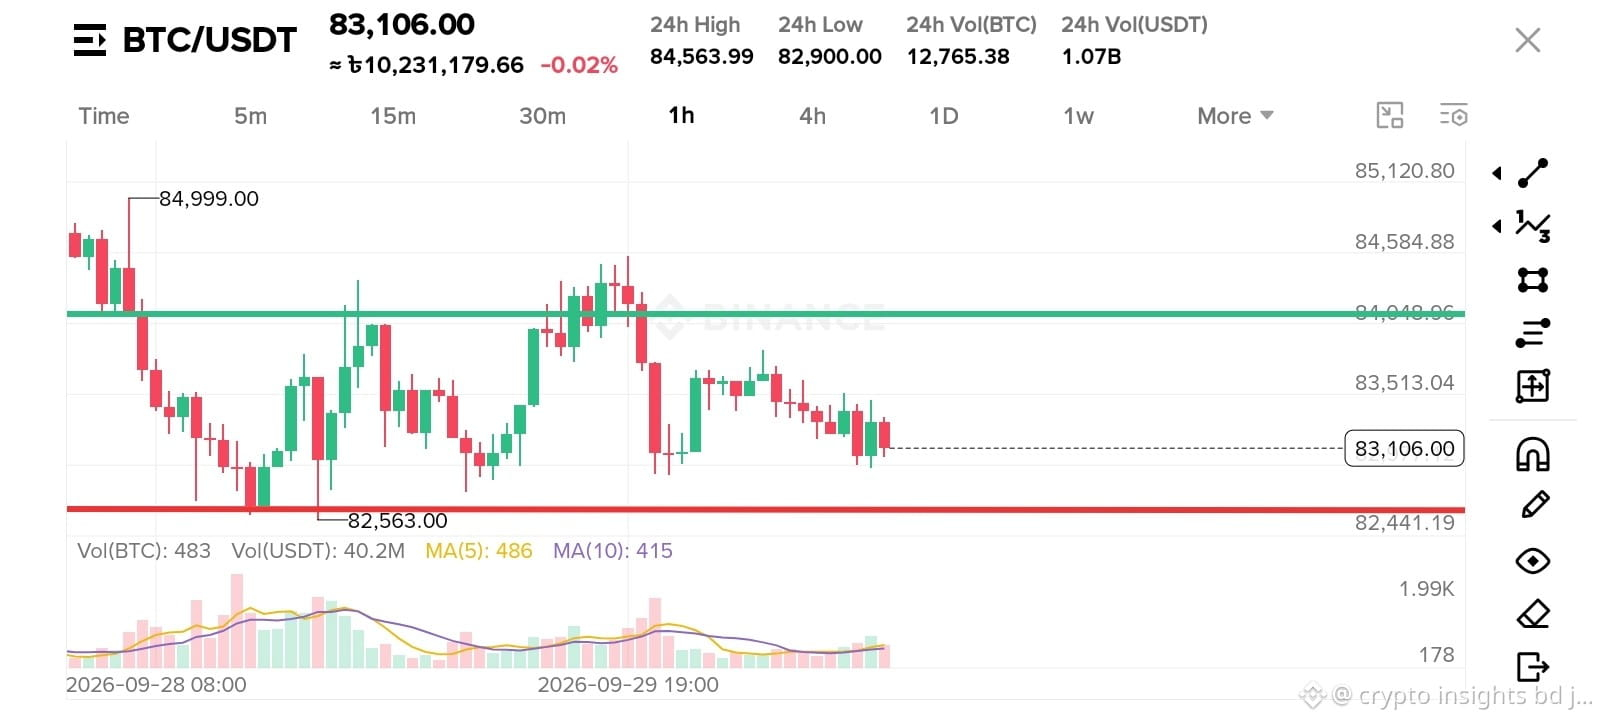
BTC/USDT is trading around $83,106 with -0.02%, showing complete indecision in the 1H timeframe.
the price is trapped in a clear range, 84,048 is acting as strong resistance (green line) and 82,441 is the key support (red line).
24H High was 84,999 and Low was 82,563, sellers are active near 85K and buyers are defending 82.5K.
after rejecting from 84K, BTC is making lower highs, which shows short-term bearish pressure.
colume is $1.07B in 24H but last few candles have low volume, so momentum is weak right now.
MA(5) and MA(10) are flat at the bottom, indicating consolidation before the next big move.
if support breaks, we may see more downside, if $84,048 breaks with volume, $85K is possible.
overall market is in wait & see mode, better to wait for a clean breakout. Not financial advice.
in my opinion ,it will go up .
#BTC #BTCUSDT. #CryptoAnalytics .
$BTC
BTC/USDT is trading around $83,106 with -0.02%, showing complete indecision in the 1H timeframe.
the price is trapped in a clear range, 84,048 is acting as strong resistance (green line) and 82,441 is the key support (red line).
24H High was 84,999 and Low was 82,563, sellers are active near 85K and buyers are defending 82.5K.
after rejecting from 84K, BTC is making lower highs, which shows short-term bearish pressure.
colume is $1.07B in 24H but last few candles have low volume, so momentum is weak right now.
MA(5) and MA(10) are flat at the bottom, indicating consolidation before the next big move.
if support breaks, we may see more downside, if $84,048 breaks with volume, $85K is possible.
overall market is in wait & see mode, better to wait for a clean breakout. Not financial advice.
in my opinion ,it will go up .
#BTC #BTCUSDT. #CryptoAnalytics .
BTC/USDT is trading around $83,106 with -0.02%, showing complete indecision in the 1H timeframe.
the price is trapped in a clear range, 84,048 is acting as strong resistance (green line) and 82,441 is the key support (red line).
24H High was 84,999 and Low was 82,563, sellers are active near 85K and buyers are defending 82.5K.
after rejecting from 84K, BTC is making lower highs, which shows short-term bearish pressure.
colume is $1.07B in 24H but last few candles have low volume, so momentum is weak right now.
MA(5) and MA(10) are flat at the bottom, indicating consolidation before the next big move.
if support breaks, we may see more downside, if $84,048 breaks with volume, $85K is possible.
overall market is in wait & see mode, better to wait for a clean breakout. Not financial advice.
in my opinion ,it will go up .
#BTC #BTCUSDT. #CryptoAnalytics .
82
$SUI
{spot}(SUIUSDT)
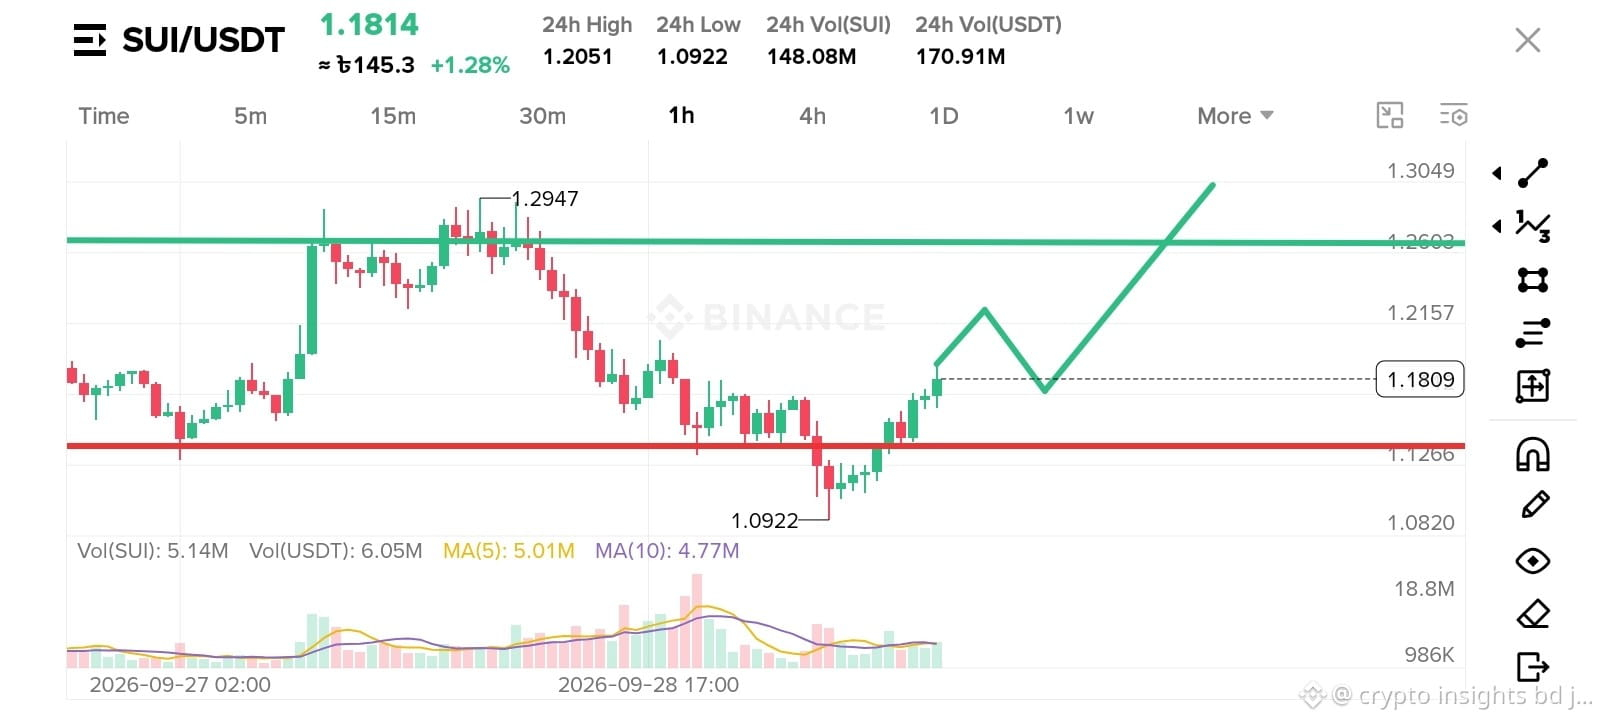
SUI/USDT 1H - Strong Reversal From Support, Eyes On $1.26
SUI took a sharp dip to 1.0922 and found massive support around $1.1266. Now it's trading at 1.1814 (+1.28%) with a solid bounce.
volume is confirming the move. current Vol(SUI) 5.14M is above MA(5) 5.01M and MA(10) 4.77M. that means buyers are stepping in, not just a dead cat bounce. 24h volume is also healthy - 148M SUI / $170M USDT.
chart structure is clear - rejection from $1.2947, then correction, then double bottom near support. now price is making higher lows.
I'm expecting a push towards the green resistance at $1.26.
My setup
Entry: $1.1750 - $1.1850
SL: $1.1200
TP1: $1.2250
TP2: $1.2600
if it holds $1.1266, momentum can continue. watch the $1.26 breakout.
NFA, manage your risk.
In my opinion , it will hit TP .
#SUI #SUIUSDT
$SUI
SUI/USDT 1H - Strong Reversal From Support, Eyes On $1.26
SUI took a sharp dip to 1.0922 and found massive support around $1.1266. Now it's trading at 1.1814 (+1.28%) with a solid bounce.
volume is confirming the move. current Vol(SUI) 5.14M is above MA(5) 5.01M and MA(10) 4.77M. that means buyers are stepping in, not just a dead cat bounce. 24h volume is also healthy - 148M SUI / $170M USDT.
chart structure is clear - rejection from $1.2947, then correction, then double bottom near support. now price is making higher lows.
I'm expecting a push towards the green resistance at $1.26.
My setup
Entry: $1.1750 - $1.1850
SL: $1.1200
TP1: $1.2250
TP2: $1.2600
if it holds $1.1266, momentum can continue. watch the $1.26 breakout.
NFA, manage your risk.
In my opinion , it will hit TP .
#SUI #SUIUSDT
SUI/USDT 1H - Strong Reversal From Support, Eyes On $1.26
SUI took a sharp dip to 1.0922 and found massive support around $1.1266. Now it's trading at 1.1814 (+1.28%) with a solid bounce.
volume is confirming the move. current Vol(SUI) 5.14M is above MA(5) 5.01M and MA(10) 4.77M. that means buyers are stepping in, not just a dead cat bounce. 24h volume is also healthy - 148M SUI / $170M USDT.
chart structure is clear - rejection from $1.2947, then correction, then double bottom near support. now price is making higher lows.
I'm expecting a push towards the green resistance at $1.26.
My setup
Entry: $1.1750 - $1.1850
SL: $1.1200
TP1: $1.2250
TP2: $1.2600
if it holds $1.1266, momentum can continue. watch the $1.26 breakout.
NFA, manage your risk.
In my opinion , it will hit TP .
#SUI #SUIUSDT
137
$SAGA
{spot}(SAGAUSDT)
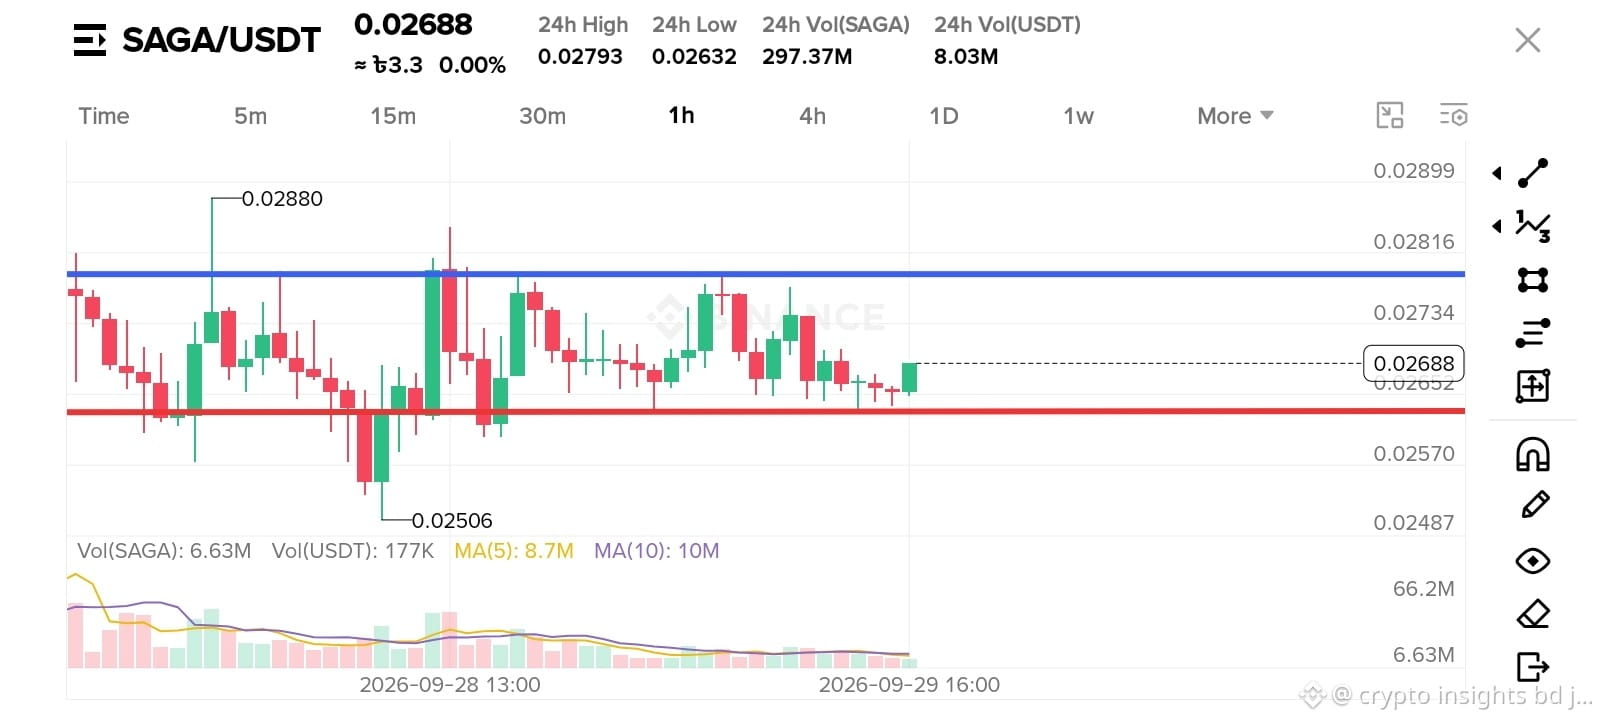
SAGA/USDT 1H - Tight Range, Breakout Loading?
SAGA is trading in a clear range. Price is currently at 0.02688 right near the lower support around 0.02610. Upper resistance is around 0.02780.
What I like is the volume story. 24h volume is huge - 297M SAGA / $8.03M USDT, but on the 1H chart volume is drying up. Last candle volume only 6.63M vs MA(5) 8.7M and MA(10) 10M. That means sellers are getting weak at support.
We saw a fakeout to $0.02880 and a wick to $0.02506 yesterday, both got sold/bought quickly. Market is compressing between the red and blue lines.
Looking for longs as long as $0.02610 holds.
Entry: $0.02650 - $0.02688
SL: $0.02590
TP1: $0.02770
TP2: $0.02860
Low volume near support often leads to a sharp move. Keep it on watchlist.
Not financial advice.
#SAGA #SAGAUSDT
$SAGA
SAGA/USDT 1H - Tight Range, Breakout Loading?
SAGA is trading in a clear range. Price is currently at 0.02688 right near the lower support around 0.02610. Upper resistance is around 0.02780.
What I like is the volume story. 24h volume is huge - 297M SAGA / $8.03M USDT, but on the 1H chart volume is drying up. Last candle volume only 6.63M vs MA(5) 8.7M and MA(10) 10M. That means sellers are getting weak at support.
We saw a fakeout to $0.02880 and a wick to $0.02506 yesterday, both got sold/bought quickly. Market is compressing between the red and blue lines.
Looking for longs as long as $0.02610 holds.
Entry: $0.02650 - $0.02688
SL: $0.02590
TP1: $0.02770
TP2: $0.02860
Low volume near support often leads to a sharp move. Keep it on watchlist.
Not financial advice.
#SAGA #SAGAUSDT
SAGA/USDT 1H - Tight Range, Breakout Loading?
SAGA is trading in a clear range. Price is currently at 0.02688 right near the lower support around 0.02610. Upper resistance is around 0.02780.
What I like is the volume story. 24h volume is huge - 297M SAGA / $8.03M USDT, but on the 1H chart volume is drying up. Last candle volume only 6.63M vs MA(5) 8.7M and MA(10) 10M. That means sellers are getting weak at support.
We saw a fakeout to $0.02880 and a wick to $0.02506 yesterday, both got sold/bought quickly. Market is compressing between the red and blue lines.
Looking for longs as long as $0.02610 holds.
Entry: $0.02650 - $0.02688
SL: $0.02590
TP1: $0.02770
TP2: $0.02860
Low volume near support often leads to a sharp move. Keep it on watchlist.
Not financial advice.
#SAGA #SAGAUSDT
1
602
$DOGE
{spot}(DOGEUSDT)
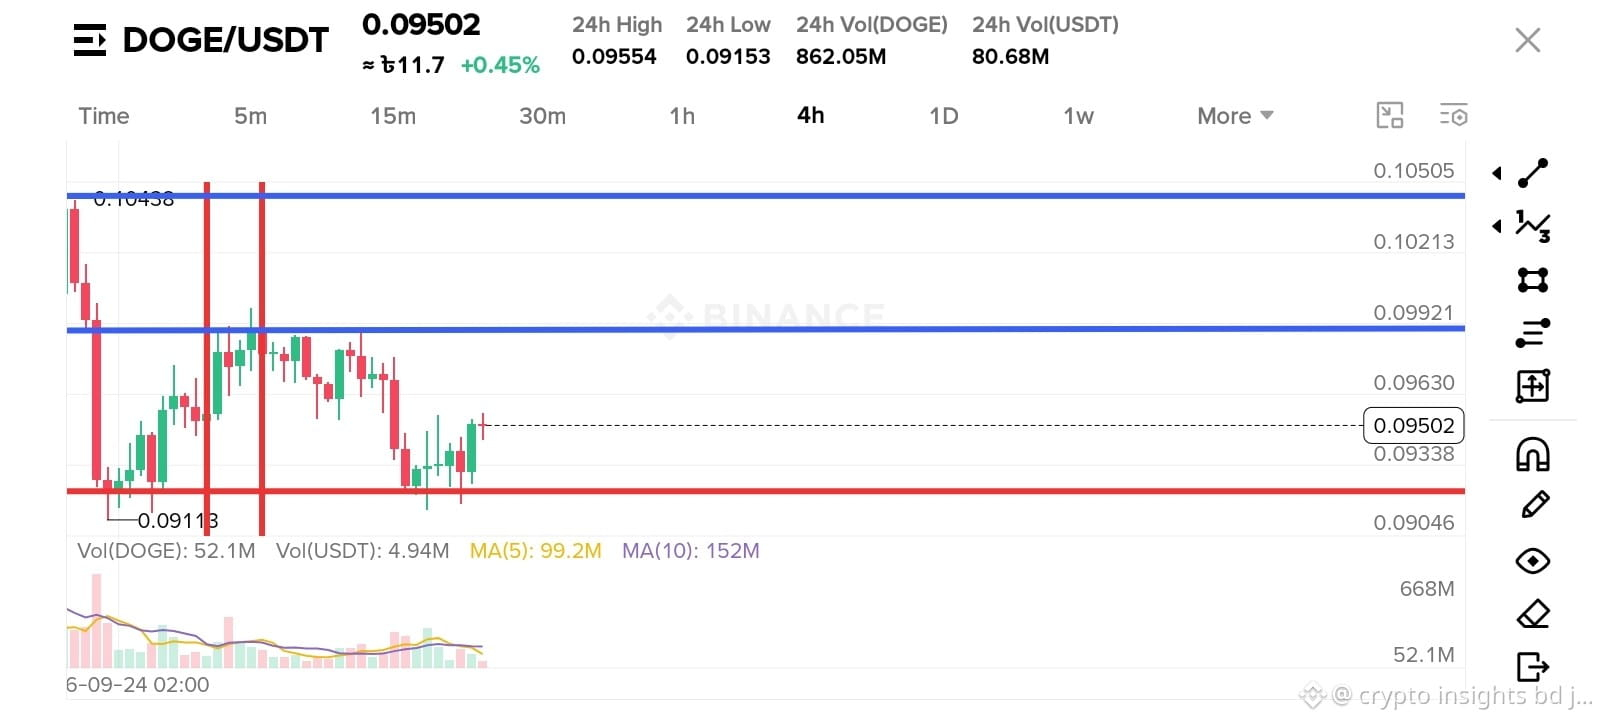
DOGE/USDT 4H - Bounce From Strong Support
DOGE found solid support around 0.09113 and is now recovering at 0.09502. the chart clearly shows buyers defending the red support zone twice.
I'm looking for long setup here.
entry: $0.09480 - $0.09520
SL: $0.09100
TP1: $0.09880
TP2: $0.10430
risk management is must. this is not financial advice, just my view.
in my opinion , it will hit TP.
#DOGE #DOGEUSDT
$DOGE
DOGE/USDT 4H - Bounce From Strong Support
DOGE found solid support around 0.09113 and is now recovering at 0.09502. the chart clearly shows buyers defending the red support zone twice.
I'm looking for long setup here.
entry: $0.09480 - $0.09520
SL: $0.09100
TP1: $0.09880
TP2: $0.10430
risk management is must. this is not financial advice, just my view.
in my opinion , it will hit TP.
#DOGE #DOGEUSDT
DOGE/USDT 4H - Bounce From Strong Support
DOGE found solid support around 0.09113 and is now recovering at 0.09502. the chart clearly shows buyers defending the red support zone twice.
I'm looking for long setup here.
entry: $0.09480 - $0.09520
SL: $0.09100
TP1: $0.09880
TP2: $0.10430
risk management is must. this is not financial advice, just my view.
in my opinion , it will hit TP.
#DOGE #DOGEUSDT
120
$GPROB
{spot}(GPROBUSDT)
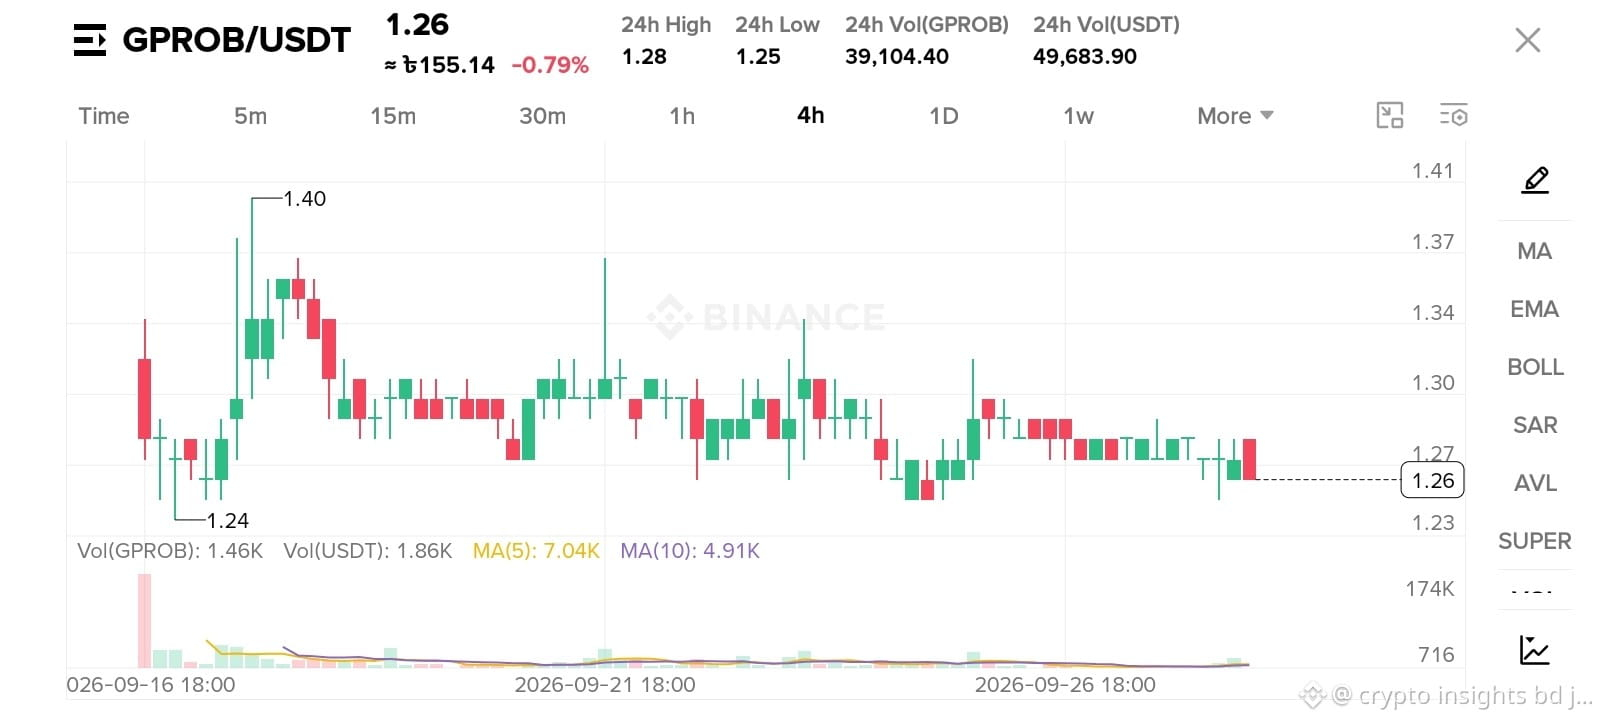
GPROB/USDT - Tight Consolidation on 4H
GPROB is now at 1.26 after a strong rejection from 1.40 high.
price is consistently holding above $1.24 - $1.25 strong support zone.
volatility and volume both cooling, sign of accumulation before breakout.
if 1.25 holds, next target $1.30 - $1.34. breakdown below $1.24 invalidates setup.
Perfect setup for range traders. watch closely.
#GPROB #Crypto #Binance
$GPROB
GPROB/USDT - Tight Consolidation on 4H
GPROB is now at 1.26 after a strong rejection from 1.40 high.
price is consistently holding above $1.24 - $1.25 strong support zone.
volatility and volume both cooling, sign of accumulation before breakout.
if 1.25 holds, next target $1.30 - $1.34. breakdown below $1.24 invalidates setup.
Perfect setup for range traders. watch closely.
#GPROB #Crypto #Binance
GPROB/USDT - Tight Consolidation on 4H
GPROB is now at 1.26 after a strong rejection from 1.40 high.
price is consistently holding above $1.24 - $1.25 strong support zone.
volatility and volume both cooling, sign of accumulation before breakout.
if 1.25 holds, next target $1.30 - $1.34. breakdown below $1.24 invalidates setup.
Perfect setup for range traders. watch closely.
#GPROB #Crypto #Binance
296
$HBAR
{spot}(HBARUSDT)
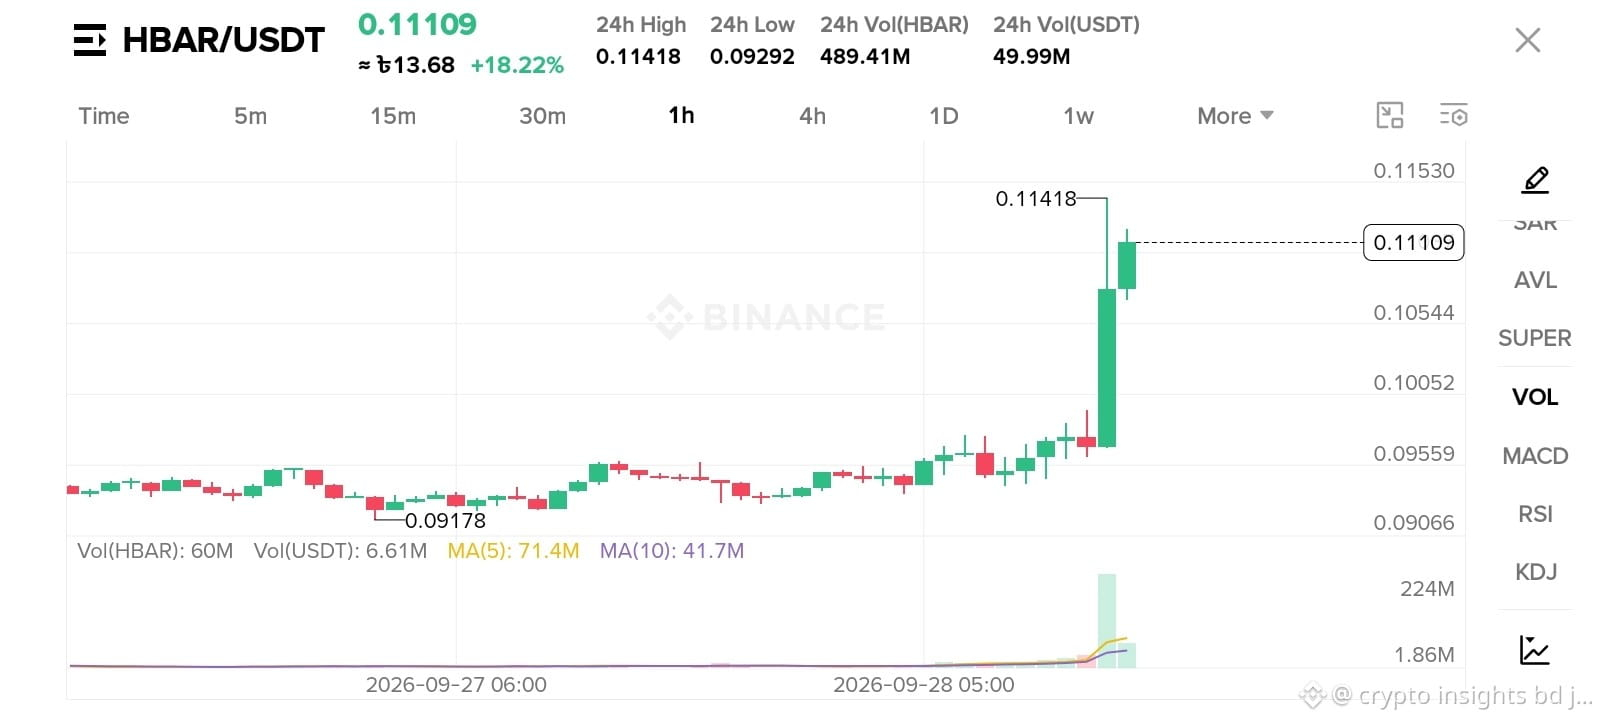
HBAR is not moving, it's launching.
+18% pump with $49.99M volume, that's not retail, that's whale fuel. last candle alone ate 60M+ HBAR volume vs MA5 71M - sellers got liquidated like paper.
price bounced hard from 0.0929 low to 0.1141 high and stil holding $0.1110 strong. this is classic breakout + retest setup, rocket is still on launchpad.
volume confirms the missile. when volume speaks this loud, price follows. keep eyes on $0.114 break.
Not financial advice. DYOR.
#HBAR #HBARUSDT #CryptoAnalysis
$HBAR
HBAR is not moving, it's launching.
+18% pump with $49.99M volume, that's not retail, that's whale fuel. last candle alone ate 60M+ HBAR volume vs MA5 71M - sellers got liquidated like paper.
price bounced hard from 0.0929 low to 0.1141 high and stil holding $0.1110 strong. this is classic breakout + retest setup, rocket is still on launchpad.
volume confirms the missile. when volume speaks this loud, price follows. keep eyes on $0.114 break.
Not financial advice. DYOR.
#HBAR #HBARUSDT #CryptoAnalysis
HBAR is not moving, it's launching.
+18% pump with $49.99M volume, that's not retail, that's whale fuel. last candle alone ate 60M+ HBAR volume vs MA5 71M - sellers got liquidated like paper.
price bounced hard from 0.0929 low to 0.1141 high and stil holding $0.1110 strong. this is classic breakout + retest setup, rocket is still on launchpad.
volume confirms the missile. when volume speaks this loud, price follows. keep eyes on $0.114 break.
Not financial advice. DYOR.
#HBAR #HBARUSDT #CryptoAnalysis
132
Көбірек контент көру үшін кіріңіз
Binance Square платформасында әлемдік криптоқоғамдастыққа қосылыңыз
⚡️ Криптовалюта туралы ең соңғы және пайдалы ақпаратты алыңыз.
💬 Әлемдегі ең ірі криптобиржаның сеніміне ие.
👍 Расталған авторлардың нақты пікірлерін табыңыз.
Электрондық пошта/телефон нөмірі
Трендтегі тақырыптар
BinanceReopensWithdrawalsForMoreAssets
54,982 рет көрілді
1,136 адам талқылап жатыр
Security Incident | Recovery Update #6: Withdrawals Reopen for More Assets (2026-11-03)
Binance Announcement
·179 лайк
·496.4k рет көрілді
BinanceHourlyDepositsExceedWithdrawals
17,793 рет көрілді
425 адам талқылап жатыр
AnthropicIPOPricedDownasInvestorsEye$1.5T
23 рет көрілді
12 адам талқылап жатыр