

Crypto Currency School
38 Жариялаулар

Crypto Currency School
Хабарлау
Пайдаланушыны блоктау
Daily provideLatest Crypto News
9 Жазылым
38 Жазылушылар
26 лайк басылған
Жазбалар
Барлығы
Баға ұсыныстары
PINNED
·
--
Жоғары (өспелі)
#BTC BOOM BOOM BTC
#BTC BOOM BOOM BTC
65476
37%
70,000
19%
73,000
16%
88,000
28%
116 дауыс • Дауыс беру жабық
4
615
Мақала
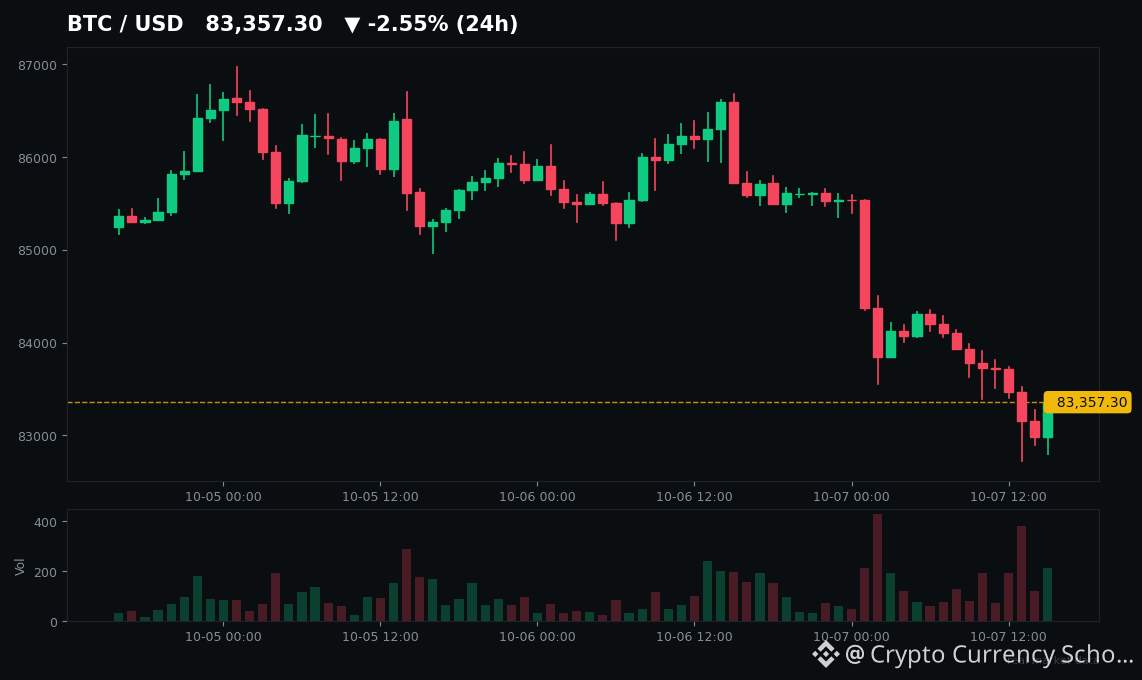
$30.5B in Whale Stablecoins Hit Binance While $BTC Fell to $83KWhile everyone was watching $BTC bleed below $83.5K, whales were quietly stockpiling ammunition.
$30.5 billion of it.
Here's the move nobody talked about tonight. 👇
The panic you felt? It was real. About $547M in leveraged positions got wiped out in 24 hours (CoinGlass via CoinDesk) as BTC slid to ~$83.4K — now roughly 34% below its $126K all-time high.
Retail longs got stopped out at the lows. Classic.
But zoom out to the whale wallets and the whole picture flips.
Between mid-August and end-September, large entities' rolling 30-day stablecoin inflows to Binance surged 40% — from $21.7B to $30.5B (CryptoQuant via Cointelegraph). That's the textbook "dry powder" metric: sidelined capital parked on the exchange, ready to deploy.
And it's the mirror image of what's leaving: ~40,000 BTC (about $3.3B) withdrawn from Binance in under two weeks, cutting reserves from ~704,800 to ~663,100 BTC — the biggest weekly outflow pace since June 2023, including a record single-day outflow of 14,300 BTC.
BTC off the exchanges. $USDT piling on. Same players, both sides of the table.
Last time Binance saw outflow pressure like this — June 2023 — BTC ran $26.3K to $30.5K the following week. History doesn't repeat, but it rhymes.
Now the honest part: flows are facts, motives are interpretation.
ETF money is schizophrenic right now. Monday's session saw ~$90M in net spot BTC ETF outflows; Tuesday's flipped straight back to +$119M in net inflows (SoSoValue via Cointelegraph). Ethereum ETFs are bleeding worse — −$202M in one session, a six-session streak totaling ~$408M.
And here's the weirdest stat of the night: the Fear & Greed Index still reads 71 — Greed — while the market bleeds. It has spent 27 of the last 30 days in Greed. Sentiment hasn't caught up to price, and $87K keeps rejecting every single bounce.
So what does it all mean?
My take: this isn't panic. Panic sells everything and leaves. This is positioning — whales pulled supply off the table AND loaded the buy button at the same time.
They're not rushing. They're ready.
The trigger? Probably $87K finally flipping to support, or one more flush that shakes out the last weak hands. Until then, it's a tug-of-war: whale dry powder vs. complacent greed near the highs.
Are the whales front-running the next leg up, or just shuffling custody? Drop your read 👇
#Bitcoin #Whales
Not financial advice. DYOR.
$30.5B in Whale Stablecoins Hit Binance While $BTC Fell to $83K
While everyone was watching $BTC bleed below $83.5K, whales were quietly stockpiling ammunition.
$30.5 billion of it.
Here's the move nobody talked about tonight. 👇
The panic you felt? It was real. About $547M in leveraged positions got wiped out in 24 hours (CoinGlass via CoinDesk) as BTC slid to ~$83.4K — now roughly 34% below its $126K all-time high.
Retail longs got stopped out at the lows. Classic.
But zoom out to the whale wallets and the whole picture flips.
Between mid-August and end-September, large entities' rolling 30-day stablecoin inflows to Binance surged 40% — from $21.7B to $30.5B (CryptoQuant via Cointelegraph). That's the textbook "dry powder" metric: sidelined capital parked on the exchange, ready to deploy.
And it's the mirror image of what's leaving: ~40,000 BTC (about $3.3B) withdrawn from Binance in under two weeks, cutting reserves from ~704,800 to ~663,100 BTC — the biggest weekly outflow pace since June 2023, including a record single-day outflow of 14,300 BTC.
BTC off the exchanges. $USDT piling on. Same players, both sides of the table.
Last time Binance saw outflow pressure like this — June 2023 — BTC ran $26.3K to $30.5K the following week. History doesn't repeat, but it rhymes.
Now the honest part: flows are facts, motives are interpretation.
ETF money is schizophrenic right now. Monday's session saw ~$90M in net spot BTC ETF outflows; Tuesday's flipped straight back to +$119M in net inflows (SoSoValue via Cointelegraph). Ethereum ETFs are bleeding worse — −$202M in one session, a six-session streak totaling ~$408M.
And here's the weirdest stat of the night: the Fear & Greed Index still reads 71 — Greed — while the market bleeds. It has spent 27 of the last 30 days in Greed. Sentiment hasn't caught up to price, and $87K keeps rejecting every single bounce.
So what does it all mean?
My take: this isn't panic. Panic sells everything and leaves. This is positioning — whales pulled supply off the table AND loaded the buy button at the same time.
They're not rushing. They're ready.
The trigger? Probably $87K finally flipping to support, or one more flush that shakes out the last weak hands. Until then, it's a tug-of-war: whale dry powder vs. complacent greed near the highs.
Are the whales front-running the next leg up, or just shuffling custody? Drop your read 👇
#Bitcoin #Whales
Not financial advice. DYOR.
$30.5 billion of it.
Here's the move nobody talked about tonight. 👇
The panic you felt? It was real. About $547M in leveraged positions got wiped out in 24 hours (CoinGlass via CoinDesk) as BTC slid to ~$83.4K — now roughly 34% below its $126K all-time high.
Retail longs got stopped out at the lows. Classic.
But zoom out to the whale wallets and the whole picture flips.
Between mid-August and end-September, large entities' rolling 30-day stablecoin inflows to Binance surged 40% — from $21.7B to $30.5B (CryptoQuant via Cointelegraph). That's the textbook "dry powder" metric: sidelined capital parked on the exchange, ready to deploy.
And it's the mirror image of what's leaving: ~40,000 BTC (about $3.3B) withdrawn from Binance in under two weeks, cutting reserves from ~704,800 to ~663,100 BTC — the biggest weekly outflow pace since June 2023, including a record single-day outflow of 14,300 BTC.
BTC off the exchanges. $USDT piling on. Same players, both sides of the table.
Last time Binance saw outflow pressure like this — June 2023 — BTC ran $26.3K to $30.5K the following week. History doesn't repeat, but it rhymes.
Now the honest part: flows are facts, motives are interpretation.
ETF money is schizophrenic right now. Monday's session saw ~$90M in net spot BTC ETF outflows; Tuesday's flipped straight back to +$119M in net inflows (SoSoValue via Cointelegraph). Ethereum ETFs are bleeding worse — −$202M in one session, a six-session streak totaling ~$408M.
And here's the weirdest stat of the night: the Fear & Greed Index still reads 71 — Greed — while the market bleeds. It has spent 27 of the last 30 days in Greed. Sentiment hasn't caught up to price, and $87K keeps rejecting every single bounce.
So what does it all mean?
My take: this isn't panic. Panic sells everything and leaves. This is positioning — whales pulled supply off the table AND loaded the buy button at the same time.
They're not rushing. They're ready.
The trigger? Probably $87K finally flipping to support, or one more flush that shakes out the last weak hands. Until then, it's a tug-of-war: whale dry powder vs. complacent greed near the highs.
Are the whales front-running the next leg up, or just shuffling custody? Drop your read 👇
#Bitcoin #Whales
Not financial advice. DYOR.
13
Мақала
CFTC Just Called These 6 Coins 'Digital Commodities' — Is Yours on the List?The CFTC just named six coins it treats as "digital commodities" — and the market barely blinked.
That's a mistake. Because this list might decide which altcoins get a green light for the next decade — and which get stuck in regulatory limbo.
Here's what happened: On Monday, CFTC Chair Mike Selig reaffirmed that $BTC, $ETH, SOL, XRP, XLM and XTZ are examples of "digital commodities" under the joint SEC-CFTC taxonomy. The practical translation? These assets sit in the category the agencies consider generally NOT securities.
The same day, the CFTC opened an advanced notice of proposed rulemaking (Reg CTX/CAM) — its first-ever formal framework for a federal crypto asset market, aimed at retail leveraged trading. 60-day comment period. Clock is ticking.
**Here's the part nobody's talking about**
Congress killed the CLARITY Act 49-50 back on September 15. Dead bill. No second vote coming soon.
So the agencies just… started writing the rules themselves. Treasury, the SEC, the Fed and the CFTC are now sprinting in lockstep toward coordinated rules with a January 18, 2027 effective date. Regulation by agency decree — and that six-coin list is the clearest public signal of which assets the new regime will treat kindly.
**The honest caveat**
Don't over-read this. The taxonomy is illustrative, not a binding new rule — the framework itself dates to March. And an asset that's "not a security" can still be sold through an investment contract. The CFTC also kept full antifraud authority over spot markets. This is direction, not destiny.
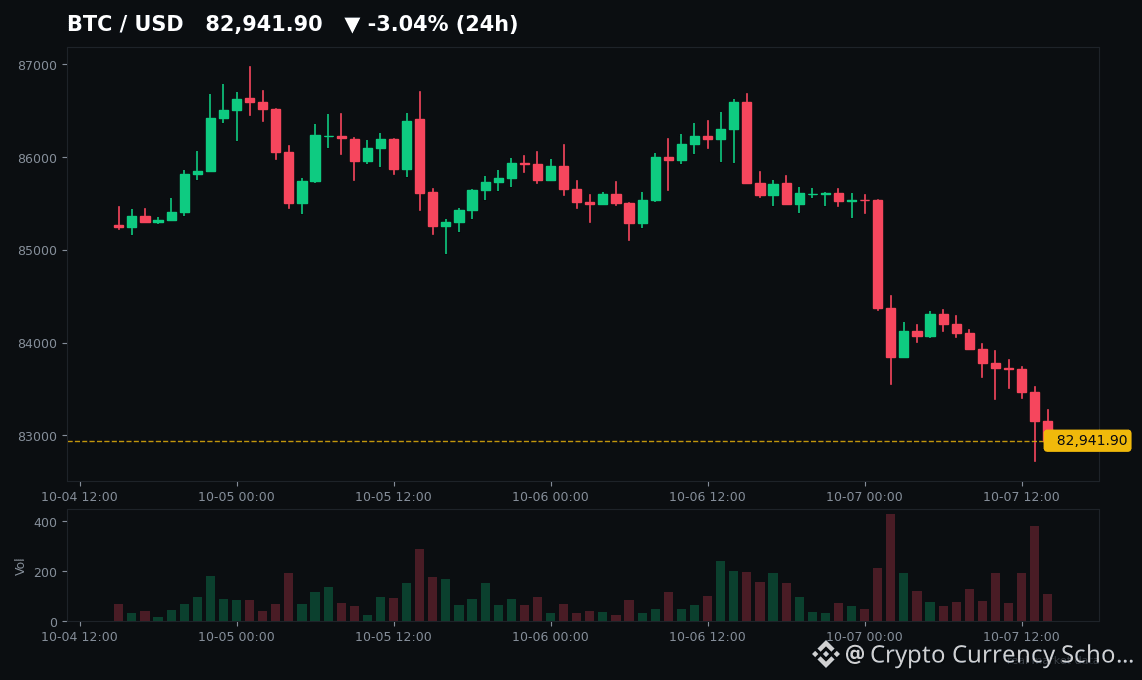
But direction matters. While everyone watched the Fed, institutions voted with wallets: spot Bitcoin ETFs pulled in +$119M on Tuesday while ETH ETFs bled -$202M — their sixth straight outflow day. And all of this happened with $BTC sliding ~3% to ~$83K under a 5.335% 10-year yield, the highest in decades.
Here's what this really means for you: the era of waiting for Congress is over. The rulebook for crypto is being written right now, by regulators, token category by token category. Six coins are already named. If the coins you hold aren't on any official list, that's a risk worth pricing in.
Which altcoin do you think gets named next? 👇
Not financial advice. DYOR.
#Bitcoin #Crypto #Regulation
CFTC Just Called These 6 Coins 'Digital Commodities' — Is Yours on the List?
The CFTC just named six coins it treats as "digital commodities" — and the market barely blinked.
That's a mistake. Because this list might decide which altcoins get a green light for the next decade — and which get stuck in regulatory limbo.
Here's what happened: On Monday, CFTC Chair Mike Selig reaffirmed that $BTC , $ETH , SOL, XRP, XLM and XTZ are examples of "digital commodities" under the joint SEC-CFTC taxonomy. The practical translation? These assets sit in the category the agencies consider generally NOT securities.
The same day, the CFTC opened an advanced notice of proposed rulemaking (Reg CTX/CAM) — its first-ever formal framework for a federal crypto asset market, aimed at retail leveraged trading. 60-day comment period. Clock is ticking.
**Here's the part nobody's talking about**
Congress killed the CLARITY Act 49-50 back on September 15. Dead bill. No second vote coming soon.
So the agencies just… started writing the rules themselves. Treasury, the SEC, the Fed and the CFTC are now sprinting in lockstep toward coordinated rules with a January 18, 2027 effective date. Regulation by agency decree — and that six-coin list is the clearest public signal of which assets the new regime will treat kindly.
**The honest caveat**
Don't over-read this. The taxonomy is illustrative, not a binding new rule — the framework itself dates to March. And an asset that's "not a security" can still be sold through an investment contract. The CFTC also kept full antifraud authority over spot markets. This is direction, not destiny.
But direction matters. While everyone watched the Fed, institutions voted with wallets: spot Bitcoin ETFs pulled in +$119M on Tuesday while ETH ETFs bled -$202M — their sixth straight outflow day. And all of this happened with $BTC sliding ~3% to ~$83K under a 5.335% 10-year yield, the highest in decades.
Here's what this really means for you: the era of waiting for Congress is over. The rulebook for crypto is being written right now, by regulators, token category by token category. Six coins are already named. If the coins you hold aren't on any official list, that's a risk worth pricing in.
Which altcoin do you think gets named next? 👇
Not financial advice. DYOR.
#Bitcoin #Crypto #Regulation
That's a mistake. Because this list might decide which altcoins get a green light for the next decade — and which get stuck in regulatory limbo.
Here's what happened: On Monday, CFTC Chair Mike Selig reaffirmed that $BTC , $ETH , SOL, XRP, XLM and XTZ are examples of "digital commodities" under the joint SEC-CFTC taxonomy. The practical translation? These assets sit in the category the agencies consider generally NOT securities.
The same day, the CFTC opened an advanced notice of proposed rulemaking (Reg CTX/CAM) — its first-ever formal framework for a federal crypto asset market, aimed at retail leveraged trading. 60-day comment period. Clock is ticking.
**Here's the part nobody's talking about**
Congress killed the CLARITY Act 49-50 back on September 15. Dead bill. No second vote coming soon.
So the agencies just… started writing the rules themselves. Treasury, the SEC, the Fed and the CFTC are now sprinting in lockstep toward coordinated rules with a January 18, 2027 effective date. Regulation by agency decree — and that six-coin list is the clearest public signal of which assets the new regime will treat kindly.
**The honest caveat**
Don't over-read this. The taxonomy is illustrative, not a binding new rule — the framework itself dates to March. And an asset that's "not a security" can still be sold through an investment contract. The CFTC also kept full antifraud authority over spot markets. This is direction, not destiny.
But direction matters. While everyone watched the Fed, institutions voted with wallets: spot Bitcoin ETFs pulled in +$119M on Tuesday while ETH ETFs bled -$202M — their sixth straight outflow day. And all of this happened with $BTC sliding ~3% to ~$83K under a 5.335% 10-year yield, the highest in decades.
Here's what this really means for you: the era of waiting for Congress is over. The rulebook for crypto is being written right now, by regulators, token category by token category. Six coins are already named. If the coins you hold aren't on any official list, that's a risk worth pricing in.
Which altcoin do you think gets named next? 👇
Not financial advice. DYOR.
#Bitcoin #Crypto #Regulation
69
Расталды
Мақала
Ondo Just Tokenized a Pre-IPO AI Company. $ONDO Fell 6% Anyway.They just gave retail a back door into a pre-IPO AI company — and the market shrugged.
Yesterday, Ondo Finance launched Ondo Private Markets: tokenized notes that track the per-share value of a pre-IPO AI company, tradable 24/7 starting this week. No brokerage account. No VC friends. Just onchain exposure to one of the hottest corners of private tech.
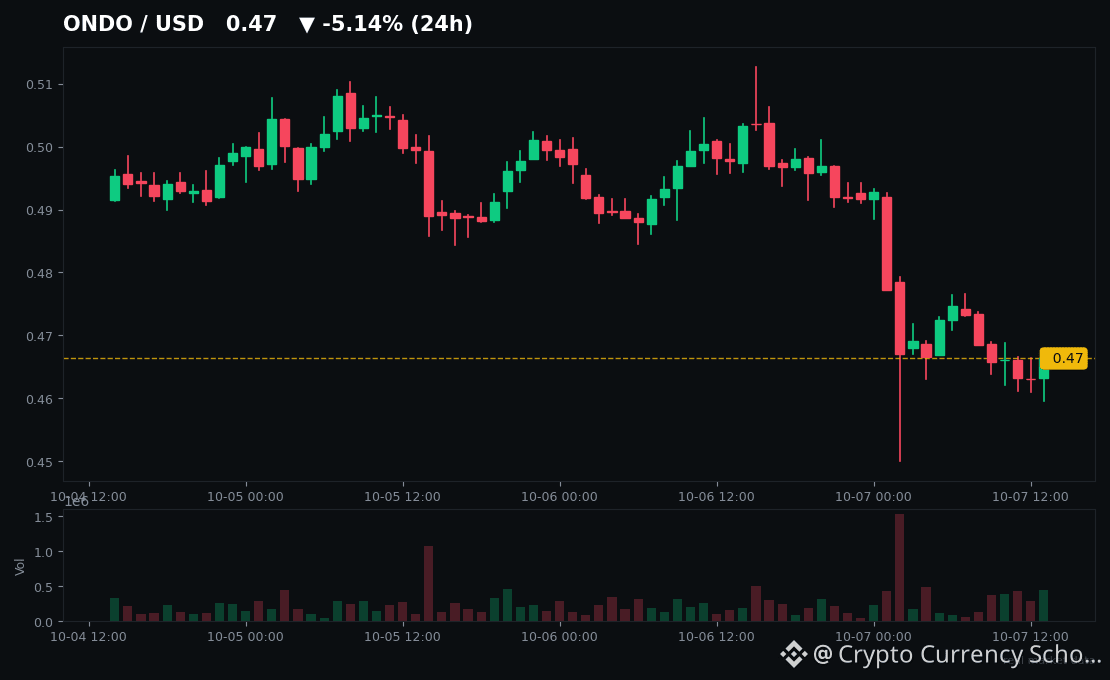
$ONDO's response? Down ~6% to ~$0.47.
**The setup**
Acting CEO Ian De Bode laid out the pitch bluntly: 87% of US companies with over $100M in revenue are still private — the fastest-growing tech companies live and IPO entirely behind closed doors. Ondo's notes turn that wall into a window: economic exposure to the AI company's value at a liquidity event, sold to eligible non-US investors.
It lands on top of an empire that's already enormous. Ondo now manages ~$3.7B in tokenized assets across stocks, ETFs, and Treasuries, with over a million cumulative holders. Industry-wide, tokenized Treasuries hit ~$15.7B and total onchain RWA value is ~$38.9B. Tokenized equities alone crossed $42B.
**Here's the uncomfortable part**
The business prints milestones and the token doesn't care. $ONDO is ~85% below its $2.14 all-time high. It pumped +130% when BlackRock's BUIDL arrived in 2024 — then faded. It tagged $2.14 when Trump-backed World Liberty bought in late 2024 — then a 1.94B-token unlock in January 2025 wiped out 68%.
Two reasons this keeps happening, and neither is a secret. One: only 4.87B of 10B $ONDO circulates, and the next big cliff (~1.71B tokens) lands in January 2027. Two: $ONDO is a governance token — protocol fees don't flow to holders. You can believe tokenization is the future and still watch the token dilute its way sideways.
**What this really means**
I'm not fading the trend itself. BlackRock is now talking about entire tokenized portfolios, rebalanced onchain, as the endgame. Kraken just launched yield on tokenized stocks. $LINK's CCIP and the big infra rails are wiring institutional money movement onchain in production — not pilots anymore. The rails are being built in public, in real time.
But the lesson of every RWA cycle so far: headlines pop the price for weeks, unlocks and tokenomics decide it for years. Ondo's customers — the institutions parking billions — don't need the token at all. So is $ONDO the cheapest ticket to the tokenization supercycle, or the most expensive lesson in "governance token doesn't mean value capture"?
I'm watching $0.45 — today's low and the line that has to hold.
$ONDO $LINK
#RWA #Tokenization #OndoFinance
Not financial advice. DYOR.
Ondo Just Tokenized a Pre-IPO AI Company. $ONDO Fell 6% Anyway.
They just gave retail a back door into a pre-IPO AI company — and the market shrugged.
Yesterday, Ondo Finance launched Ondo Private Markets: tokenized notes that track the per-share value of a pre-IPO AI company, tradable 24/7 starting this week. No brokerage account. No VC friends. Just onchain exposure to one of the hottest corners of private tech.
$ONDO 's response? Down ~6% to ~$0.47.
**The setup**
Acting CEO Ian De Bode laid out the pitch bluntly: 87% of US companies with over $100M in revenue are still private — the fastest-growing tech companies live and IPO entirely behind closed doors. Ondo's notes turn that wall into a window: economic exposure to the AI company's value at a liquidity event, sold to eligible non-US investors.
It lands on top of an empire that's already enormous. Ondo now manages ~$3.7B in tokenized assets across stocks, ETFs, and Treasuries, with over a million cumulative holders. Industry-wide, tokenized Treasuries hit ~$15.7B and total onchain RWA value is ~$38.9B. Tokenized equities alone crossed $42B.
**Here's the uncomfortable part**
The business prints milestones and the token doesn't care. $ONDO is ~85% below its $2.14 all-time high. It pumped +130% when BlackRock's BUIDL arrived in 2024 — then faded. It tagged $2.14 when Trump-backed World Liberty bought in late 2024 — then a 1.94B-token unlock in January 2025 wiped out 68%.
Two reasons this keeps happening, and neither is a secret. One: only 4.87B of 10B $ONDO circulates, and the next big cliff (~1.71B tokens) lands in January 2027. Two: $ONDO is a governance token — protocol fees don't flow to holders. You can believe tokenization is the future and still watch the token dilute its way sideways.
**What this really means**
I'm not fading the trend itself. BlackRock is now talking about entire tokenized portfolios, rebalanced onchain, as the endgame. Kraken just launched yield on tokenized stocks. $LINK 's CCIP and the big infra rails are wiring institutional money movement onchain in production — not pilots anymore. The rails are being built in public, in real time.
But the lesson of every RWA cycle so far: headlines pop the price for weeks, unlocks and tokenomics decide it for years. Ondo's customers — the institutions parking billions — don't need the token at all. So is $ONDO the cheapest ticket to the tokenization supercycle, or the most expensive lesson in "governance token doesn't mean value capture"?
I'm watching $0.45 — today's low and the line that has to hold.
$ONDO $LINK
#RWA #Tokenization #OndoFinance
Not financial advice. DYOR.
Yesterday, Ondo Finance launched Ondo Private Markets: tokenized notes that track the per-share value of a pre-IPO AI company, tradable 24/7 starting this week. No brokerage account. No VC friends. Just onchain exposure to one of the hottest corners of private tech.
$ONDO 's response? Down ~6% to ~$0.47.
**The setup**
Acting CEO Ian De Bode laid out the pitch bluntly: 87% of US companies with over $100M in revenue are still private — the fastest-growing tech companies live and IPO entirely behind closed doors. Ondo's notes turn that wall into a window: economic exposure to the AI company's value at a liquidity event, sold to eligible non-US investors.
It lands on top of an empire that's already enormous. Ondo now manages ~$3.7B in tokenized assets across stocks, ETFs, and Treasuries, with over a million cumulative holders. Industry-wide, tokenized Treasuries hit ~$15.7B and total onchain RWA value is ~$38.9B. Tokenized equities alone crossed $42B.
**Here's the uncomfortable part**
The business prints milestones and the token doesn't care. $ONDO is ~85% below its $2.14 all-time high. It pumped +130% when BlackRock's BUIDL arrived in 2024 — then faded. It tagged $2.14 when Trump-backed World Liberty bought in late 2024 — then a 1.94B-token unlock in January 2025 wiped out 68%.
Two reasons this keeps happening, and neither is a secret. One: only 4.87B of 10B $ONDO circulates, and the next big cliff (~1.71B tokens) lands in January 2027. Two: $ONDO is a governance token — protocol fees don't flow to holders. You can believe tokenization is the future and still watch the token dilute its way sideways.
**What this really means**
I'm not fading the trend itself. BlackRock is now talking about entire tokenized portfolios, rebalanced onchain, as the endgame. Kraken just launched yield on tokenized stocks. $LINK 's CCIP and the big infra rails are wiring institutional money movement onchain in production — not pilots anymore. The rails are being built in public, in real time.
But the lesson of every RWA cycle so far: headlines pop the price for weeks, unlocks and tokenomics decide it for years. Ondo's customers — the institutions parking billions — don't need the token at all. So is $ONDO the cheapest ticket to the tokenization supercycle, or the most expensive lesson in "governance token doesn't mean value capture"?
I'm watching $0.45 — today's low and the line that has to hold.
$ONDO $LINK
#RWA #Tokenization #OndoFinance
Not financial advice. DYOR.
172
Мақала
$ASTER Is Down 70% a Year After Binance Listing — Here's the Real StoryOne year ago, Binance listed the most hyped token of 2025 — and the chart since then is a warning every trader should study.
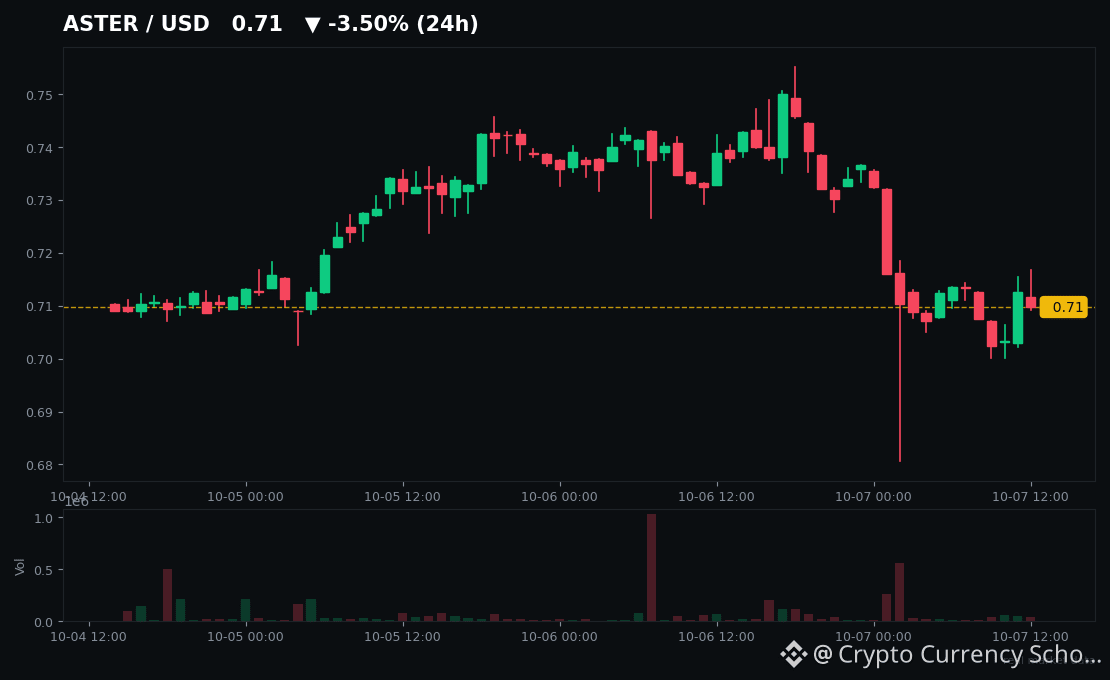
$ASTER is trading at ~$0.71 right now. That's roughly 70% below its $2.41 all-time high. Let that sink in before you read the next paragraph.
**The setup**
In September 2025, CZ publicly praised Aster — the $BNB Chain perp DEX with ex-Binance staff behind it and his YZi Labs holding a minority stake. What followed was pure frenzy: $ASTER ran ~1,500% in days, from under $0.10 to $2.41 by September 24.
Then came the official catalyst: on October 6, 2025, Binance spot-listed ASTER with USDT/USDC/TRY pairs and a Seed Tag. The announcement alone spiked it 10% in an hour, back above $2. On paper, the dream scenario.
**The unraveling**
Three things broke the story — and all three still matter today.
1. **The volume was suspect.** DeFiLlama delisted Aster's perp volume data after its founder showed Aster's volumes mirroring Binance's perps almost exactly — a correlation he said was unlikely to occur naturally. One snapshot showed Aster printing $2.76B in volume with just $7.2M in liquidations. Real traders liquidate. Loops don't.
2. **The unlocks never stopped.** Only ~2.7B of 8B tokens circulate today. The team had to slash monthly emissions 97% in March 2026 just to slow the bleeding. The airdrop tranche keeps vesting for 80 months.
3. **The king never left.** Hyperliquid now does ~$216.9B in 30-day perp volume vs Aster's $68.1B — and $48.3M in 30-day fees vs Aster's $4.4M. The "Aster flipped $HYPE" headline was a moment, not an era.
**So is it dead?**
No — and that's the interesting part. Aster is still the #2 perp DEX, with ~$479M in cumulative protocol fees and ~$1.49T in cumulative perp volume. TVL sits near $800M. CZ's publicly disclosed ~$2M+ personal buy ("I buy and hold") still anchors the bull case — and retail is still riding the dream, while signal traders short every bounce near $0.70.
Here's my take: listings are exits for the patient, not entries for the late. The data on Binance listings is brutal — on average, newly listed tokens dump ~70% from peak, and nearly half top on listing day itself. $ASTER followed the script almost perfectly.
The question isn't whether Aster the DEX survives. It's whether $ASTER the token ever earns its 2025 price again.
Not financial advice. DYOR.
$ASTER Is Down 70% a Year After Binance Listing — Here's the Real Story
One year ago, Binance listed the most hyped token of 2025 — and the chart since then is a warning every trader should study.
$ASTER is trading at ~$0.71 right now. That's roughly 70% below its $2.41 all-time high. Let that sink in before you read the next paragraph.
**The setup**
In September 2025, CZ publicly praised Aster — the $BNB Chain perp DEX with ex-Binance staff behind it and his YZi Labs holding a minority stake. What followed was pure frenzy: $ASTER ran ~1,500% in days, from under $0.10 to $2.41 by September 24.
Then came the official catalyst: on October 6, 2025, Binance spot-listed ASTER with USDT/USDC/TRY pairs and a Seed Tag. The announcement alone spiked it 10% in an hour, back above $2. On paper, the dream scenario.
**The unraveling**
Three things broke the story — and all three still matter today.
1. **The volume was suspect.** DeFiLlama delisted Aster's perp volume data after its founder showed Aster's volumes mirroring Binance's perps almost exactly — a correlation he said was unlikely to occur naturally. One snapshot showed Aster printing $2.76B in volume with just $7.2M in liquidations. Real traders liquidate. Loops don't.
2. **The unlocks never stopped.** Only ~2.7B of 8B tokens circulate today. The team had to slash monthly emissions 97% in March 2026 just to slow the bleeding. The airdrop tranche keeps vesting for 80 months.
3. **The king never left.** Hyperliquid now does ~$216.9B in 30-day perp volume vs Aster's $68.1B — and $48.3M in 30-day fees vs Aster's $4.4M. The "Aster flipped $HYPE " headline was a moment, not an era.
**So is it dead?**
No — and that's the interesting part. Aster is still the #2 perp DEX, with ~$479M in cumulative protocol fees and ~$1.49T in cumulative perp volume. TVL sits near $800M. CZ's publicly disclosed ~$2M+ personal buy ("I buy and hold") still anchors the bull case — and retail is still riding the dream, while signal traders short every bounce near $0.70.
Here's my take: listings are exits for the patient, not entries for the late. The data on Binance listings is brutal — on average, newly listed tokens dump ~70% from peak, and nearly half top on listing day itself. $ASTER followed the script almost perfectly.
The question isn't whether Aster the DEX survives. It's whether $ASTER the token ever earns its 2025 price again.
Not financial advice. DYOR.
$ASTER is trading at ~$0.71 right now. That's roughly 70% below its $2.41 all-time high. Let that sink in before you read the next paragraph.
**The setup**
In September 2025, CZ publicly praised Aster — the $BNB Chain perp DEX with ex-Binance staff behind it and his YZi Labs holding a minority stake. What followed was pure frenzy: $ASTER ran ~1,500% in days, from under $0.10 to $2.41 by September 24.
Then came the official catalyst: on October 6, 2025, Binance spot-listed ASTER with USDT/USDC/TRY pairs and a Seed Tag. The announcement alone spiked it 10% in an hour, back above $2. On paper, the dream scenario.
**The unraveling**
Three things broke the story — and all three still matter today.
1. **The volume was suspect.** DeFiLlama delisted Aster's perp volume data after its founder showed Aster's volumes mirroring Binance's perps almost exactly — a correlation he said was unlikely to occur naturally. One snapshot showed Aster printing $2.76B in volume with just $7.2M in liquidations. Real traders liquidate. Loops don't.
2. **The unlocks never stopped.** Only ~2.7B of 8B tokens circulate today. The team had to slash monthly emissions 97% in March 2026 just to slow the bleeding. The airdrop tranche keeps vesting for 80 months.
3. **The king never left.** Hyperliquid now does ~$216.9B in 30-day perp volume vs Aster's $68.1B — and $48.3M in 30-day fees vs Aster's $4.4M. The "Aster flipped $HYPE " headline was a moment, not an era.
**So is it dead?**
No — and that's the interesting part. Aster is still the #2 perp DEX, with ~$479M in cumulative protocol fees and ~$1.49T in cumulative perp volume. TVL sits near $800M. CZ's publicly disclosed ~$2M+ personal buy ("I buy and hold") still anchors the bull case — and retail is still riding the dream, while signal traders short every bounce near $0.70.
Here's my take: listings are exits for the patient, not entries for the late. The data on Binance listings is brutal — on average, newly listed tokens dump ~70% from peak, and nearly half top on listing day itself. $ASTER followed the script almost perfectly.
The question isn't whether Aster the DEX survives. It's whether $ASTER the token ever earns its 2025 price again.
Not financial advice. DYOR.
360
Мақала
BTC's Leverage Reset Is Complete. What the Data Says NextBitcoin just absorbed a $487M long liquidation flush — and the derivatives market came out of it looking *cleaner* than it has in months.
That's not hopium. That's what the data says. Let me show you.
**The leverage reset nobody's talking about**
Remember the scary funding spike? BTC perpetual funding ran from ~3% to ~10% annualized between Sept 30 and Oct 2 as open interest jumped 27,000 BTC (+$2.3B) to ~653,000 BTC. Everyone screamed "overleveraged top."
Then the market did what it always does — it flushed. Fast forward to today: funding has cooled back to 0–5% across venues. And here's the part most people missed: that OI "surge" started from ~625,000 BTC — the *lowest level in 12 months*. It wasn't excess leverage. It was leverage coming back from the floor.
**Spot buyers are driving now**
Glassnode's data shows futures OI actually *fell* $1.4B last week ($38.0B → $36.6B) — while spot buying flipped positive. That's a spot-led market, not a casino-led one. And it gets better: Binance users pulled ~14,300 BTC off the exchange in a single day, the largest daily outflow in three years. Coins are leaving exchanges while price holds. Read that twice.
**The two tripwires to watch**
Bitwise's latest report flags the two liquidation clusters that matter: **$82.5K below** and **$87.5K above**. A decisive move into either zone could trigger forced deleveraging — which means both zones are magnetic. The CME futures basis is holding 5–6% annualized, so institutional carry traders are still comfortable. The setup is coiled, not broken.
So here's my take: this isn't a market drowning in leverage. It's a market that *just* drowned its leverage — and spot buyers picked up the pieces. The next big move comes from whichever cluster breaks first.
Which one gets taken out first — $82.5K or $87.5K? Drop your call below. 👇
$BTC $ETH $SOL
#FundingRate #OpenInterest #Liquidation #Derivatives
Not financial advice. DYOR.
BTC's Leverage Reset Is Complete. What the Data Says Next
Bitcoin just absorbed a $487M long liquidation flush — and the derivatives market came out of it looking *cleaner* than it has in months.
That's not hopium. That's what the data says. Let me show you.
**The leverage reset nobody's talking about**
Remember the scary funding spike? BTC perpetual funding ran from ~3% to ~10% annualized between Sept 30 and Oct 2 as open interest jumped 27,000 BTC (+$2.3B) to ~653,000 BTC. Everyone screamed "overleveraged top."
Then the market did what it always does — it flushed. Fast forward to today: funding has cooled back to 0–5% across venues. And here's the part most people missed: that OI "surge" started from ~625,000 BTC — the *lowest level in 12 months*. It wasn't excess leverage. It was leverage coming back from the floor.
**Spot buyers are driving now**
Glassnode's data shows futures OI actually *fell* $1.4B last week ($38.0B → $36.6B) — while spot buying flipped positive. That's a spot-led market, not a casino-led one. And it gets better: Binance users pulled ~14,300 BTC off the exchange in a single day, the largest daily outflow in three years. Coins are leaving exchanges while price holds. Read that twice.
**The two tripwires to watch**
Bitwise's latest report flags the two liquidation clusters that matter: **$82.5K below** and **$87.5K above**. A decisive move into either zone could trigger forced deleveraging — which means both zones are magnetic. The CME futures basis is holding 5–6% annualized, so institutional carry traders are still comfortable. The setup is coiled, not broken.
So here's my take: this isn't a market drowning in leverage. It's a market that *just* drowned its leverage — and spot buyers picked up the pieces. The next big move comes from whichever cluster breaks first.
Which one gets taken out first — $82.5K or $87.5K? Drop your call below. 👇
$BTC $ETH $SOL
#FundingRate #OpenInterest #Liquidation #Derivatives
Not financial advice. DYOR.
That's not hopium. That's what the data says. Let me show you.
**The leverage reset nobody's talking about**
Remember the scary funding spike? BTC perpetual funding ran from ~3% to ~10% annualized between Sept 30 and Oct 2 as open interest jumped 27,000 BTC (+$2.3B) to ~653,000 BTC. Everyone screamed "overleveraged top."
Then the market did what it always does — it flushed. Fast forward to today: funding has cooled back to 0–5% across venues. And here's the part most people missed: that OI "surge" started from ~625,000 BTC — the *lowest level in 12 months*. It wasn't excess leverage. It was leverage coming back from the floor.
**Spot buyers are driving now**
Glassnode's data shows futures OI actually *fell* $1.4B last week ($38.0B → $36.6B) — while spot buying flipped positive. That's a spot-led market, not a casino-led one. And it gets better: Binance users pulled ~14,300 BTC off the exchange in a single day, the largest daily outflow in three years. Coins are leaving exchanges while price holds. Read that twice.
**The two tripwires to watch**
Bitwise's latest report flags the two liquidation clusters that matter: **$82.5K below** and **$87.5K above**. A decisive move into either zone could trigger forced deleveraging — which means both zones are magnetic. The CME futures basis is holding 5–6% annualized, so institutional carry traders are still comfortable. The setup is coiled, not broken.
So here's my take: this isn't a market drowning in leverage. It's a market that *just* drowned its leverage — and spot buyers picked up the pieces. The next big move comes from whichever cluster breaks first.
Which one gets taken out first — $82.5K or $87.5K? Drop your call below. 👇
$BTC $ETH $SOL
#FundingRate #OpenInterest #Liquidation #Derivatives
Not financial advice. DYOR.
24
Мақала
BTC Flushed $487M of Longs. Buyers Did Not Blink - Fed Minutes Decide Next$487 million in longs got wiped out in one flush — and Bitcoin is already back on its feet.
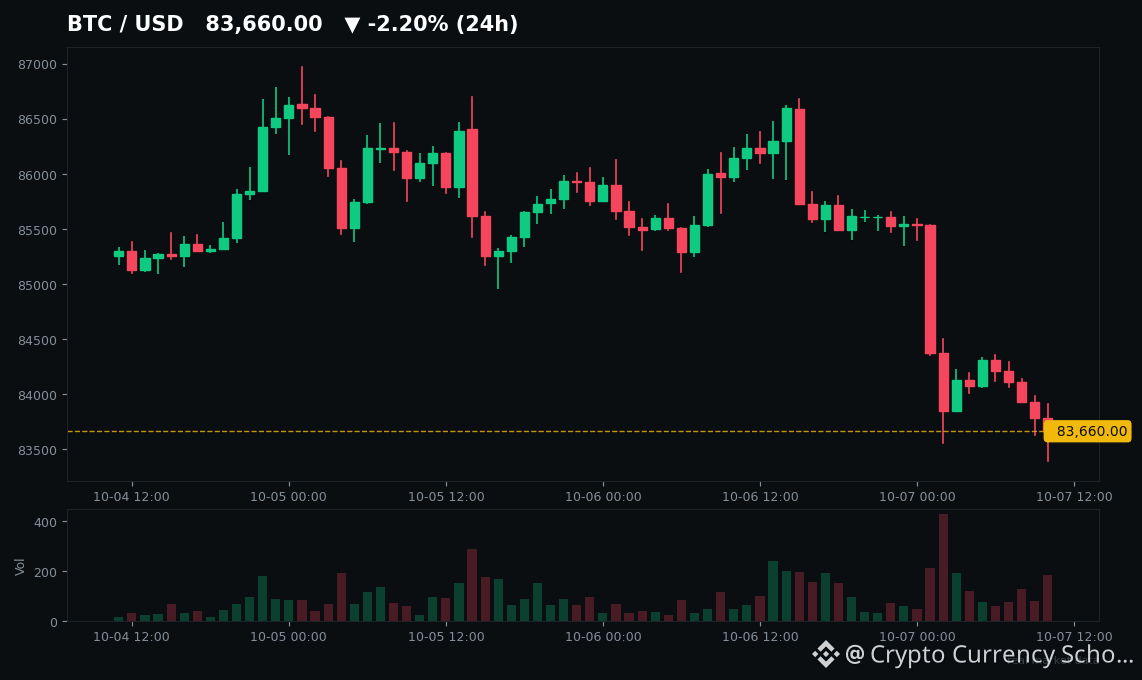
Wait, what? Yesterday $BTC wicked to $83,551, nearly half a billion in leveraged longs evaporated in hours, and this morning the Fear & Greed index still reads 71. Greed. 😅
That's the wildest part of this afternoon's tape. The market got punched in the face and barely blinked.
THE FLUSH
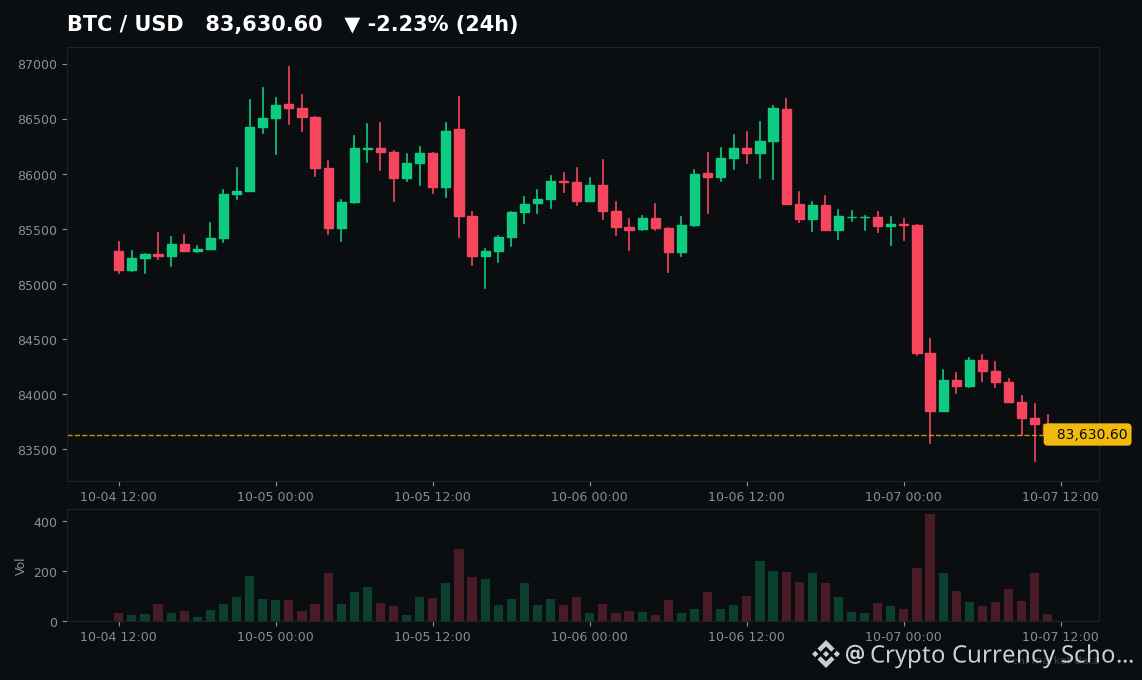
Last night BTC went from ~$85.5K to $83,387 on Kraken — a near-vertical drop on heavy volume. CoinGlass logged $487M in long liquidations in 24 hours, with the sharpest wave hitting in under an hour.
RSI on the hourly chart cratered to 17.8. Deeply oversold. The kind of reading you see at panic bottoms.
And then... buyers just stepped in. Spot CVD flipped positive. Funding rates reset to neutral. The leverage that fueled the move is gone.
WHAT CHANGED THIS AFTERNOON
Here's what makes today different from yesterday's chaos — the story is no longer the dump. It's what's happening underneath it:
🏦 The US government moved 833 BTC (~$71.6M) to Coinbase Prime this morning. Headline sounds scary, but this is under 1% of their stash — custody move, not a confirmed dump. The market shrugged.
📊 The real battle line: 1.59 million BTC — nearly 8% of all circulating supply — sits in the $83.3K–$84.6K cost-basis band. That zone has held three times now. Above $86.7K, there's almost no supply cluster until ~$105K. Thin air up there.
⏰ And then there's the Fed. FOMC minutes drop TODAY. October hike odds collapsed from 64% to under 25% in a week after weak payrolls (29K vs 90K expected). The 10-year yield is at 5.3% — a 24-year high. If those minutes sound dovish, risk assets get a tailwind. If hawkish? Buckle up.
KEY LEVELS TO WATCH
🟢 Support: $83,800–$83,400 — the defending zone, buyers active all day
🟢 Break below → $82,500, then $82,258 is the line that must not close under
🔴 Resistance: $84,900–$85,400 — the recovery hurdle
🔴 Above that: $87,000, the ceiling that's rejected BTC all month
Options traders are betting the upside story: $7.6B in calls vs $3.03B in puts into the Oct 30 expiry, with the $95K call carrying the biggest open interest.
THE HONEST RISK
Let's keep it real. The $84K–$87K zone is heavy supply overhead. Open interest is already UP 1% since the flush — longs are reloading into the same trap. ETF flows flipped to -$90M on Monday after weeks of strong inflows. And Mike McGlone at Bloomberg is out here warning $10K on equity-correlation fears.
If the Fed minutes land hawkish into thin afternoon liquidity, $83.4K could crack. History says leverage flushes only become bottoms when the reset is complete — watch whether longs keep rebuilding.
BOTTOM LINE
Here's what this really means: yesterday's flush was a leverage event, not a conviction event. Spot buyers absorbed it, the support shelf is holding, and sentiment never broke. That's constructive — but the afternoon's verdict belongs to the Fed minutes.
Are you buying this dip, or waiting to see what the Fed says first? 👇
#Bitcoin #BTC #CryptoMarket #CryptoNews #WriteToEarn
Not financial advice. DYOR.
BTC Flushed $487M of Longs. Buyers Did Not Blink - Fed Minutes Decide Next
$487 million in longs got wiped out in one flush — and Bitcoin is already back on its feet.
Wait, what? Yesterday $BTC wicked to $83,551, nearly half a billion in leveraged longs evaporated in hours, and this morning the Fear & Greed index still reads 71. Greed. 😅
That's the wildest part of this afternoon's tape. The market got punched in the face and barely blinked.
THE FLUSH
Last night BTC went from ~$85.5K to $83,387 on Kraken — a near-vertical drop on heavy volume. CoinGlass logged $487M in long liquidations in 24 hours, with the sharpest wave hitting in under an hour.
RSI on the hourly chart cratered to 17.8. Deeply oversold. The kind of reading you see at panic bottoms.
And then... buyers just stepped in. Spot CVD flipped positive. Funding rates reset to neutral. The leverage that fueled the move is gone.
WHAT CHANGED THIS AFTERNOON
Here's what makes today different from yesterday's chaos — the story is no longer the dump. It's what's happening underneath it:
🏦 The US government moved 833 BTC (~$71.6M) to Coinbase Prime this morning. Headline sounds scary, but this is under 1% of their stash — custody move, not a confirmed dump. The market shrugged.
📊 The real battle line: 1.59 million BTC — nearly 8% of all circulating supply — sits in the $83.3K–$84.6K cost-basis band. That zone has held three times now. Above $86.7K, there's almost no supply cluster until ~$105K. Thin air up there.
⏰ And then there's the Fed. FOMC minutes drop TODAY. October hike odds collapsed from 64% to under 25% in a week after weak payrolls (29K vs 90K expected). The 10-year yield is at 5.3% — a 24-year high. If those minutes sound dovish, risk assets get a tailwind. If hawkish? Buckle up.
KEY LEVELS TO WATCH
🟢 Support: $83,800–$83,400 — the defending zone, buyers active all day
🟢 Break below → $82,500, then $82,258 is the line that must not close under
🔴 Resistance: $84,900–$85,400 — the recovery hurdle
🔴 Above that: $87,000, the ceiling that's rejected BTC all month
Options traders are betting the upside story: $7.6B in calls vs $3.03B in puts into the Oct 30 expiry, with the $95K call carrying the biggest open interest.
THE HONEST RISK
Let's keep it real. The $84K–$87K zone is heavy supply overhead. Open interest is already UP 1% since the flush — longs are reloading into the same trap. ETF flows flipped to -$90M on Monday after weeks of strong inflows. And Mike McGlone at Bloomberg is out here warning $10K on equity-correlation fears.
If the Fed minutes land hawkish into thin afternoon liquidity, $83.4K could crack. History says leverage flushes only become bottoms when the reset is complete — watch whether longs keep rebuilding.
BOTTOM LINE
Here's what this really means: yesterday's flush was a leverage event, not a conviction event. Spot buyers absorbed it, the support shelf is holding, and sentiment never broke. That's constructive — but the afternoon's verdict belongs to the Fed minutes.
Are you buying this dip, or waiting to see what the Fed says first? 👇
#Bitcoin #BTC #CryptoMarket #CryptoNews #WriteToEarn
Not financial advice. DYOR.
Wait, what? Yesterday $BTC wicked to $83,551, nearly half a billion in leveraged longs evaporated in hours, and this morning the Fear & Greed index still reads 71. Greed. 😅
That's the wildest part of this afternoon's tape. The market got punched in the face and barely blinked.
THE FLUSH
Last night BTC went from ~$85.5K to $83,387 on Kraken — a near-vertical drop on heavy volume. CoinGlass logged $487M in long liquidations in 24 hours, with the sharpest wave hitting in under an hour.
RSI on the hourly chart cratered to 17.8. Deeply oversold. The kind of reading you see at panic bottoms.
And then... buyers just stepped in. Spot CVD flipped positive. Funding rates reset to neutral. The leverage that fueled the move is gone.
WHAT CHANGED THIS AFTERNOON
Here's what makes today different from yesterday's chaos — the story is no longer the dump. It's what's happening underneath it:
🏦 The US government moved 833 BTC (~$71.6M) to Coinbase Prime this morning. Headline sounds scary, but this is under 1% of their stash — custody move, not a confirmed dump. The market shrugged.
📊 The real battle line: 1.59 million BTC — nearly 8% of all circulating supply — sits in the $83.3K–$84.6K cost-basis band. That zone has held three times now. Above $86.7K, there's almost no supply cluster until ~$105K. Thin air up there.
⏰ And then there's the Fed. FOMC minutes drop TODAY. October hike odds collapsed from 64% to under 25% in a week after weak payrolls (29K vs 90K expected). The 10-year yield is at 5.3% — a 24-year high. If those minutes sound dovish, risk assets get a tailwind. If hawkish? Buckle up.
KEY LEVELS TO WATCH
🟢 Support: $83,800–$83,400 — the defending zone, buyers active all day
🟢 Break below → $82,500, then $82,258 is the line that must not close under
🔴 Resistance: $84,900–$85,400 — the recovery hurdle
🔴 Above that: $87,000, the ceiling that's rejected BTC all month
Options traders are betting the upside story: $7.6B in calls vs $3.03B in puts into the Oct 30 expiry, with the $95K call carrying the biggest open interest.
THE HONEST RISK
Let's keep it real. The $84K–$87K zone is heavy supply overhead. Open interest is already UP 1% since the flush — longs are reloading into the same trap. ETF flows flipped to -$90M on Monday after weeks of strong inflows. And Mike McGlone at Bloomberg is out here warning $10K on equity-correlation fears.
If the Fed minutes land hawkish into thin afternoon liquidity, $83.4K could crack. History says leverage flushes only become bottoms when the reset is complete — watch whether longs keep rebuilding.
BOTTOM LINE
Here's what this really means: yesterday's flush was a leverage event, not a conviction event. Spot buyers absorbed it, the support shelf is holding, and sentiment never broke. That's constructive — but the afternoon's verdict belongs to the Fed minutes.
Are you buying this dip, or waiting to see what the Fed says first? 👇
#Bitcoin #BTC #CryptoMarket #CryptoNews #WriteToEarn
Not financial advice. DYOR.
26
Мақала
The US Government Moved $31.6M of $BNB Today. Price Barely Moved.The US government moved 40,285 BNB (~$31.6M) this morning — and $BNB barely flinched.
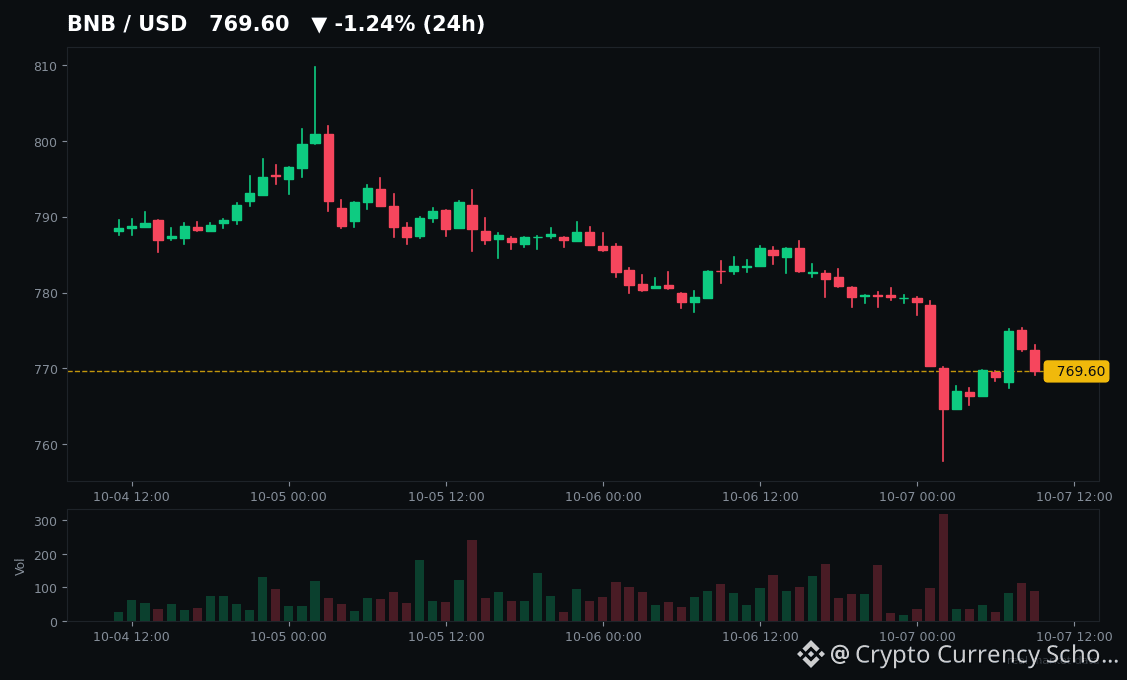
It's sitting at ~$770, down ~1%, while Bitcoin (-2.6%) and ETH (-4.2%) got hit harder. Read that again. The strongest seller in the market just showed up, and BNB outperformed both majors on the same day.
Here's what happened. Wallets linked to US authorities moved 833.6 BTC straight to Coinbase Prime and 40,285 BNB through intermediary hops to an unlabeled address — all within a nine-hour window. EmberCN, Arkham and Lookonchain flagged it live. Total: ~$103M. Sounds scary until you remember they still hold roughly $28B.
And notice the split: the BTC went to an exchange. The BNB went somewhere quieter. Consolidation, not panic.
The bigger picture is what makes this interesting. BNB is pinned at the low end of a three-week box between ~$758 and ~$799, after tapping ~$810 last week and getting rejected. The $800 wall has now rejected BNB three times — $806.53 on Sept 21, ~$799.53 on Sept 22, and again this week. But the floor keeps getting bought. This morning's flush to ~$758 got absorbed and BNB bounced back above its EMA-20 at ~$767.
So here's my take: this is the quiet-strength setup BNB has run before. Last October, BNB decoupled from a crashing BTC and ripped 15% to a new ATH in 24 hours. Exchange tokens with deflationary mechanics absorb sellers nobody else can — then sprint when the market turns. Two catalysts are lining up to test that: the 37th quarterly burn lands mid-October (date unconfirmed, but the Oct 2025 burn pushed BNB +3% to $1,168 and took #3 back from XRP), and VanEck just amended its spot BNB ETF filing to add staking with Figment — a first yield-bearing angle for the ETF race.
The honest risk, because I always give you both sides: longs are crowded (68–69% long, taker buy/sell ratio just 0.85), volume is thinning, and a daily close below $760 breaks the box toward $720–$730. If $800 rejects a fourth time, long liquidations could cascade. Binance users also rotated out of BNB (-0.77% balances) into BTC in the October proof-of-reserves. Respect the risk.
But today? Uncle Sam shifted $31M of BNB, and the buyers ate every coin. That's not weakness. That's absorption.
Watch $800. That's the whole trade right now.
Not financial advice. DYOR.
The US Government Moved $31.6M of $BNB Today. Price Barely Moved.
The US government moved 40,285 BNB (~$31.6M) this morning — and $BNB barely flinched.
It's sitting at ~$770, down ~1%, while Bitcoin (-2.6%) and ETH (-4.2%) got hit harder. Read that again. The strongest seller in the market just showed up, and BNB outperformed both majors on the same day.
Here's what happened. Wallets linked to US authorities moved 833.6 BTC straight to Coinbase Prime and 40,285 BNB through intermediary hops to an unlabeled address — all within a nine-hour window. EmberCN, Arkham and Lookonchain flagged it live. Total: ~$103M. Sounds scary until you remember they still hold roughly $28B.
And notice the split: the BTC went to an exchange. The BNB went somewhere quieter. Consolidation, not panic.
The bigger picture is what makes this interesting. BNB is pinned at the low end of a three-week box between ~$758 and ~$799, after tapping ~$810 last week and getting rejected. The $800 wall has now rejected BNB three times — $806.53 on Sept 21, ~$799.53 on Sept 22, and again this week. But the floor keeps getting bought. This morning's flush to ~$758 got absorbed and BNB bounced back above its EMA-20 at ~$767.
So here's my take: this is the quiet-strength setup BNB has run before. Last October, BNB decoupled from a crashing BTC and ripped 15% to a new ATH in 24 hours. Exchange tokens with deflationary mechanics absorb sellers nobody else can — then sprint when the market turns. Two catalysts are lining up to test that: the 37th quarterly burn lands mid-October (date unconfirmed, but the Oct 2025 burn pushed BNB +3% to $1,168 and took #3 back from XRP), and VanEck just amended its spot BNB ETF filing to add staking with Figment — a first yield-bearing angle for the ETF race.
The honest risk, because I always give you both sides: longs are crowded (68–69% long, taker buy/sell ratio just 0.85), volume is thinning, and a daily close below $760 breaks the box toward $720–$730. If $800 rejects a fourth time, long liquidations could cascade. Binance users also rotated out of BNB (-0.77% balances) into BTC in the October proof-of-reserves. Respect the risk.
But today? Uncle Sam shifted $31M of BNB, and the buyers ate every coin. That's not weakness. That's absorption.
Watch $800. That's the whole trade right now.
Not financial advice. DYOR.
It's sitting at ~$770, down ~1%, while Bitcoin (-2.6%) and ETH (-4.2%) got hit harder. Read that again. The strongest seller in the market just showed up, and BNB outperformed both majors on the same day.
Here's what happened. Wallets linked to US authorities moved 833.6 BTC straight to Coinbase Prime and 40,285 BNB through intermediary hops to an unlabeled address — all within a nine-hour window. EmberCN, Arkham and Lookonchain flagged it live. Total: ~$103M. Sounds scary until you remember they still hold roughly $28B.
And notice the split: the BTC went to an exchange. The BNB went somewhere quieter. Consolidation, not panic.
The bigger picture is what makes this interesting. BNB is pinned at the low end of a three-week box between ~$758 and ~$799, after tapping ~$810 last week and getting rejected. The $800 wall has now rejected BNB three times — $806.53 on Sept 21, ~$799.53 on Sept 22, and again this week. But the floor keeps getting bought. This morning's flush to ~$758 got absorbed and BNB bounced back above its EMA-20 at ~$767.
So here's my take: this is the quiet-strength setup BNB has run before. Last October, BNB decoupled from a crashing BTC and ripped 15% to a new ATH in 24 hours. Exchange tokens with deflationary mechanics absorb sellers nobody else can — then sprint when the market turns. Two catalysts are lining up to test that: the 37th quarterly burn lands mid-October (date unconfirmed, but the Oct 2025 burn pushed BNB +3% to $1,168 and took #3 back from XRP), and VanEck just amended its spot BNB ETF filing to add staking with Figment — a first yield-bearing angle for the ETF race.
The honest risk, because I always give you both sides: longs are crowded (68–69% long, taker buy/sell ratio just 0.85), volume is thinning, and a daily close below $760 breaks the box toward $720–$730. If $800 rejects a fourth time, long liquidations could cascade. Binance users also rotated out of BNB (-0.77% balances) into BTC in the October proof-of-reserves. Respect the risk.
But today? Uncle Sam shifted $31M of BNB, and the buyers ate every coin. That's not weakness. That's absorption.
Watch $800. That's the whole trade right now.
Not financial advice. DYOR.
32
Мақала
FET Just Broke Its 11-Month Downtrend — Then Pulled Back. What Happens Next?Two days ago $FET ripped 12% in a single session and snapped an 11-month downtrend.
Today it's down 4%. And honestly? That pullback is the most important part of the story.
Here's what actually happened.
**The breakout**
On October 4, FET surged 12.32% in one day and pushed to $0.2724 on October 5 — its highest print since early June. Volume exploded ~135% to around $370M in a day. Analysts are calling it the first real break of the downtrend that has been grinding FET down since late 2025. One chart analyst sees another 20–30% on a clean confirmation; another flagged $0.467 as the next major order block.
And it wasn't random. Capital is rotating into AI tokens right now — FET, VIRTUAL, and NEAR leading while DeFi names sit still. CoinGecko's AI category sat near $26.2 billion on October 6. Even Bitget reopened FET deposits and withdrawals this week, a small but telling sign exchanges smell demand again.
**Now the pullback — and why it matters**
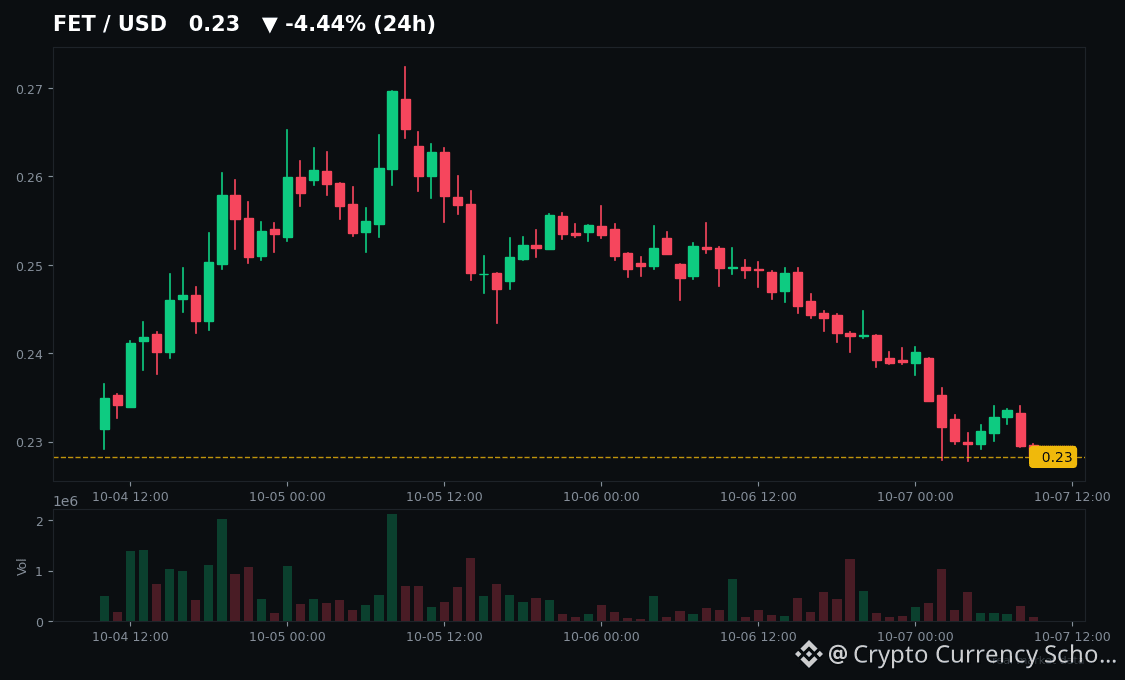
FET is trading around $0.228, down about 4% today. But look closer: it's sitting exactly on the 38.2% Fibonacci retracement ($0.226) of the whole September-to-October run, still above its 20-day EMA, with the 50-day EMA ($0.197) underneath.
That's a textbook bull-market pullback setup — IF $0.226 holds. Break it with a daily close, and $0.20 is the next stop. Hold it, and the door reopens to $0.245–$0.256, then the real test at $0.30.
**Here's the part nobody's talking about**
On September 20, someone drained ~$1.56 million worth of FET from the ASI Alliance's token converter contract in a signing-key exploit. Bad headline, right?
The market didn't care. FET went on to rally 51% in September anyway — alongside TAO (+40%) and RNDR (+35%). The October 5 spike (+15.6%) came with futures volume at 4.3x spot volume. This move isn't driven by fundamentals or fresh announcements. It's leverage, short squeezes, and rotation money hunting the cheapest AI exposure on the board.
**The honest risk**
I've seen this movie before. June 2026: FET ran +10% to $0.27 in a day, broke out, everybody cheered — then it bled all the way back to $0.20 by September. That was relief rally #4 in a graveyard of relief rallies since the $3.49 top in March 2024 (FET is still 93% below it). Every one of those runs died at the same resistance shelf, $0.28–$0.31.
So this is the trade: a genuine 11-month downtrend break, a market that shrugged off a hack, and a pullback sitting on real support. But crowded long positioning and that wall of overhead supply mean this is a knife-fight, not a coronation.
Is this the fifth failed relief rally — or the first real reversal? The next few daily closes above $0.226 will answer it.
$FET $ASI $TAO
Not financial advice. DYOR.
FET Just Broke Its 11-Month Downtrend — Then Pulled Back. What Happens Next?
Two days ago $FET ripped 12% in a single session and snapped an 11-month downtrend.
Today it's down 4%. And honestly? That pullback is the most important part of the story.
Here's what actually happened.
**The breakout**
On October 4, FET surged 12.32% in one day and pushed to $0.2724 on October 5 — its highest print since early June. Volume exploded ~135% to around $370M in a day. Analysts are calling it the first real break of the downtrend that has been grinding FET down since late 2025. One chart analyst sees another 20–30% on a clean confirmation; another flagged $0.467 as the next major order block.
And it wasn't random. Capital is rotating into AI tokens right now — FET, VIRTUAL, and NEAR leading while DeFi names sit still. CoinGecko's AI category sat near $26.2 billion on October 6. Even Bitget reopened FET deposits and withdrawals this week, a small but telling sign exchanges smell demand again.
**Now the pullback — and why it matters**
FET is trading around $0.228, down about 4% today. But look closer: it's sitting exactly on the 38.2% Fibonacci retracement ($0.226) of the whole September-to-October run, still above its 20-day EMA, with the 50-day EMA ($0.197) underneath.
That's a textbook bull-market pullback setup — IF $0.226 holds. Break it with a daily close, and $0.20 is the next stop. Hold it, and the door reopens to $0.245–$0.256, then the real test at $0.30.
**Here's the part nobody's talking about**
On September 20, someone drained ~$1.56 million worth of FET from the ASI Alliance's token converter contract in a signing-key exploit. Bad headline, right?
The market didn't care. FET went on to rally 51% in September anyway — alongside TAO (+40%) and RNDR (+35%). The October 5 spike (+15.6%) came with futures volume at 4.3x spot volume. This move isn't driven by fundamentals or fresh announcements. It's leverage, short squeezes, and rotation money hunting the cheapest AI exposure on the board.
**The honest risk**
I've seen this movie before. June 2026: FET ran +10% to $0.27 in a day, broke out, everybody cheered — then it bled all the way back to $0.20 by September. That was relief rally #4 in a graveyard of relief rallies since the $3.49 top in March 2024 (FET is still 93% below it). Every one of those runs died at the same resistance shelf, $0.28–$0.31.
So this is the trade: a genuine 11-month downtrend break, a market that shrugged off a hack, and a pullback sitting on real support. But crowded long positioning and that wall of overhead supply mean this is a knife-fight, not a coronation.
Is this the fifth failed relief rally — or the first real reversal? The next few daily closes above $0.226 will answer it.
$FET $ASI $TAO
Not financial advice. DYOR.
Today it's down 4%. And honestly? That pullback is the most important part of the story.
Here's what actually happened.
**The breakout**
On October 4, FET surged 12.32% in one day and pushed to $0.2724 on October 5 — its highest print since early June. Volume exploded ~135% to around $370M in a day. Analysts are calling it the first real break of the downtrend that has been grinding FET down since late 2025. One chart analyst sees another 20–30% on a clean confirmation; another flagged $0.467 as the next major order block.
And it wasn't random. Capital is rotating into AI tokens right now — FET, VIRTUAL, and NEAR leading while DeFi names sit still. CoinGecko's AI category sat near $26.2 billion on October 6. Even Bitget reopened FET deposits and withdrawals this week, a small but telling sign exchanges smell demand again.
**Now the pullback — and why it matters**
FET is trading around $0.228, down about 4% today. But look closer: it's sitting exactly on the 38.2% Fibonacci retracement ($0.226) of the whole September-to-October run, still above its 20-day EMA, with the 50-day EMA ($0.197) underneath.
That's a textbook bull-market pullback setup — IF $0.226 holds. Break it with a daily close, and $0.20 is the next stop. Hold it, and the door reopens to $0.245–$0.256, then the real test at $0.30.
**Here's the part nobody's talking about**
On September 20, someone drained ~$1.56 million worth of FET from the ASI Alliance's token converter contract in a signing-key exploit. Bad headline, right?
The market didn't care. FET went on to rally 51% in September anyway — alongside TAO (+40%) and RNDR (+35%). The October 5 spike (+15.6%) came with futures volume at 4.3x spot volume. This move isn't driven by fundamentals or fresh announcements. It's leverage, short squeezes, and rotation money hunting the cheapest AI exposure on the board.
**The honest risk**
I've seen this movie before. June 2026: FET ran +10% to $0.27 in a day, broke out, everybody cheered — then it bled all the way back to $0.20 by September. That was relief rally #4 in a graveyard of relief rallies since the $3.49 top in March 2024 (FET is still 93% below it). Every one of those runs died at the same resistance shelf, $0.28–$0.31.
So this is the trade: a genuine 11-month downtrend break, a market that shrugged off a hack, and a pullback sitting on real support. But crowded long positioning and that wall of overhead supply mean this is a knife-fight, not a coronation.
Is this the fifth failed relief rally — or the first real reversal? The next few daily closes above $0.226 will answer it.
$FET $ASI $TAO
Not financial advice. DYOR.
302
Мақала
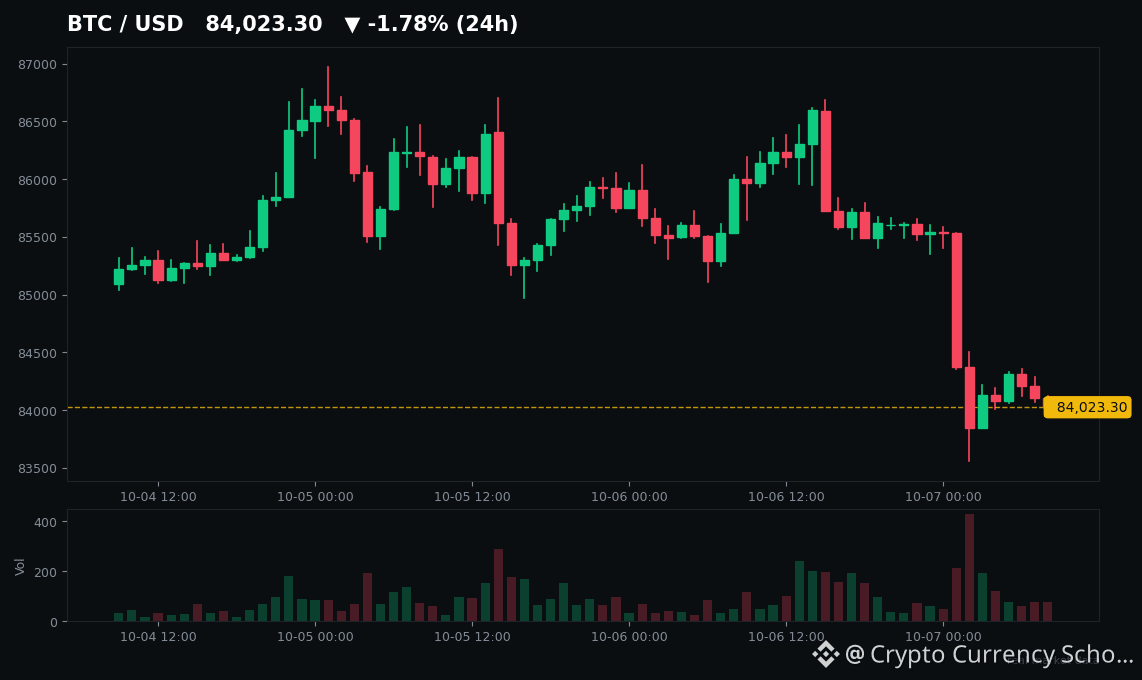
FinCEN Just Axed Its Self-Custody Wallet Rule — 3 More Things You MissedWhile everyone was staring at the $83K wick, Washington quietly handed crypto its biggest win of the month.
Miss this and you're reading the market wrong. Here's your 24-hour rundown:
**1/ The self-custody wallet rule is dead**
FinCEN just withdrew its 2020 proposal that would have forced exchanges to report withdrawals over $10K to unhosted wallets — plus the 2023 rule targeting crypto mixers. Federal Register, Oct 6. No further action.
Here's what this really means: the US just walked back two of the most feared surveillance proposals in crypto history. This isn't full deregulation — existing AML rules still stand — but it's the clearest signal yet that the "choke crypto with paperwork" era is ending. If you hold your own keys, this is a genuine win.
**2/ From "no spot ETF" to 3x leverage in 3 years**
Three years ago the SEC was in court fighting spot Bitcoin ETFs. Now it's cleared the first 3x leveraged Bitcoin and Ether ETPs — Volatility Shares' BITH and ETHK on Cboe BZX.
One catch most headlines skipped: the SEC cleared the listing rule, but no S-1 registration is effective yet. Nothing trades today.
Here's what this really means: the direction of travel is now unmistakable. Regulation went from lawsuit to triple leverage in 36 months.
**3/ The dip got bought**
After $89.8M flowed OUT of US spot $BTC ETFs on Oct 5, Oct 6 flipped to +$118.8M of net INFLOW (Farside data — several outlets got these dates backwards, check the table yourself). Cumulative net inflows sit near $57.9B.
Meanwhile Santiment clocked 24,073 BTC leaving exchanges on Oct 6 — the biggest single-day outflow since March — and a fresh $250M USDC mint is parked as potential buy-side fuel.
Here's what this really means: spot buyers are quietly absorbing every sell-off. Leverage got flushed; conviction didn't.
**4/ Glamsterdam is live (on testnet)**
Ethereum's next major upgrade went live on the Sepolia testnet Oct 6 — 200M gas limit test, enshrined proposer-builder separation. No mainnet date yet. But shipping is shipping, and $ETH developers keep building while the market argues about candles.
**The big picture:** Washington is unlocking, money is flowing back in, builders are shipping. The price chart looks messy. Everything underneath it doesn't.
Everyone's watching the candles. Watch the plumbing instead.
Not financial advice. DYOR.
FinCEN Just Axed Its Self-Custody Wallet Rule — 3 More Things You Missed
While everyone was staring at the $83K wick, Washington quietly handed crypto its biggest win of the month.
Miss this and you're reading the market wrong. Here's your 24-hour rundown:
**1/ The self-custody wallet rule is dead**
FinCEN just withdrew its 2020 proposal that would have forced exchanges to report withdrawals over $10K to unhosted wallets — plus the 2023 rule targeting crypto mixers. Federal Register, Oct 6. No further action.
Here's what this really means: the US just walked back two of the most feared surveillance proposals in crypto history. This isn't full deregulation — existing AML rules still stand — but it's the clearest signal yet that the "choke crypto with paperwork" era is ending. If you hold your own keys, this is a genuine win.
**2/ From "no spot ETF" to 3x leverage in 3 years**
Three years ago the SEC was in court fighting spot Bitcoin ETFs. Now it's cleared the first 3x leveraged Bitcoin and Ether ETPs — Volatility Shares' BITH and ETHK on Cboe BZX.
One catch most headlines skipped: the SEC cleared the listing rule, but no S-1 registration is effective yet. Nothing trades today.
Here's what this really means: the direction of travel is now unmistakable. Regulation went from lawsuit to triple leverage in 36 months.
**3/ The dip got bought**
After $89.8M flowed OUT of US spot $BTC ETFs on Oct 5, Oct 6 flipped to +$118.8M of net INFLOW (Farside data — several outlets got these dates backwards, check the table yourself). Cumulative net inflows sit near $57.9B.
Meanwhile Santiment clocked 24,073 BTC leaving exchanges on Oct 6 — the biggest single-day outflow since March — and a fresh $250M USDC mint is parked as potential buy-side fuel.
Here's what this really means: spot buyers are quietly absorbing every sell-off. Leverage got flushed; conviction didn't.
**4/ Glamsterdam is live (on testnet)**
Ethereum's next major upgrade went live on the Sepolia testnet Oct 6 — 200M gas limit test, enshrined proposer-builder separation. No mainnet date yet. But shipping is shipping, and $ETH developers keep building while the market argues about candles.
**The big picture:** Washington is unlocking, money is flowing back in, builders are shipping. The price chart looks messy. Everything underneath it doesn't.
Everyone's watching the candles. Watch the plumbing instead.
Not financial advice. DYOR.
Miss this and you're reading the market wrong. Here's your 24-hour rundown:
**1/ The self-custody wallet rule is dead**
FinCEN just withdrew its 2020 proposal that would have forced exchanges to report withdrawals over $10K to unhosted wallets — plus the 2023 rule targeting crypto mixers. Federal Register, Oct 6. No further action.
Here's what this really means: the US just walked back two of the most feared surveillance proposals in crypto history. This isn't full deregulation — existing AML rules still stand — but it's the clearest signal yet that the "choke crypto with paperwork" era is ending. If you hold your own keys, this is a genuine win.
**2/ From "no spot ETF" to 3x leverage in 3 years**
Three years ago the SEC was in court fighting spot Bitcoin ETFs. Now it's cleared the first 3x leveraged Bitcoin and Ether ETPs — Volatility Shares' BITH and ETHK on Cboe BZX.
One catch most headlines skipped: the SEC cleared the listing rule, but no S-1 registration is effective yet. Nothing trades today.
Here's what this really means: the direction of travel is now unmistakable. Regulation went from lawsuit to triple leverage in 36 months.
**3/ The dip got bought**
After $89.8M flowed OUT of US spot $BTC ETFs on Oct 5, Oct 6 flipped to +$118.8M of net INFLOW (Farside data — several outlets got these dates backwards, check the table yourself). Cumulative net inflows sit near $57.9B.
Meanwhile Santiment clocked 24,073 BTC leaving exchanges on Oct 6 — the biggest single-day outflow since March — and a fresh $250M USDC mint is parked as potential buy-side fuel.
Here's what this really means: spot buyers are quietly absorbing every sell-off. Leverage got flushed; conviction didn't.
**4/ Glamsterdam is live (on testnet)**
Ethereum's next major upgrade went live on the Sepolia testnet Oct 6 — 200M gas limit test, enshrined proposer-builder separation. No mainnet date yet. But shipping is shipping, and $ETH developers keep building while the market argues about candles.
**The big picture:** Washington is unlocking, money is flowing back in, builders are shipping. The price chart looks messy. Everything underneath it doesn't.
Everyone's watching the candles. Watch the plumbing instead.
Not financial advice. DYOR.
23
Расталды
Мақала
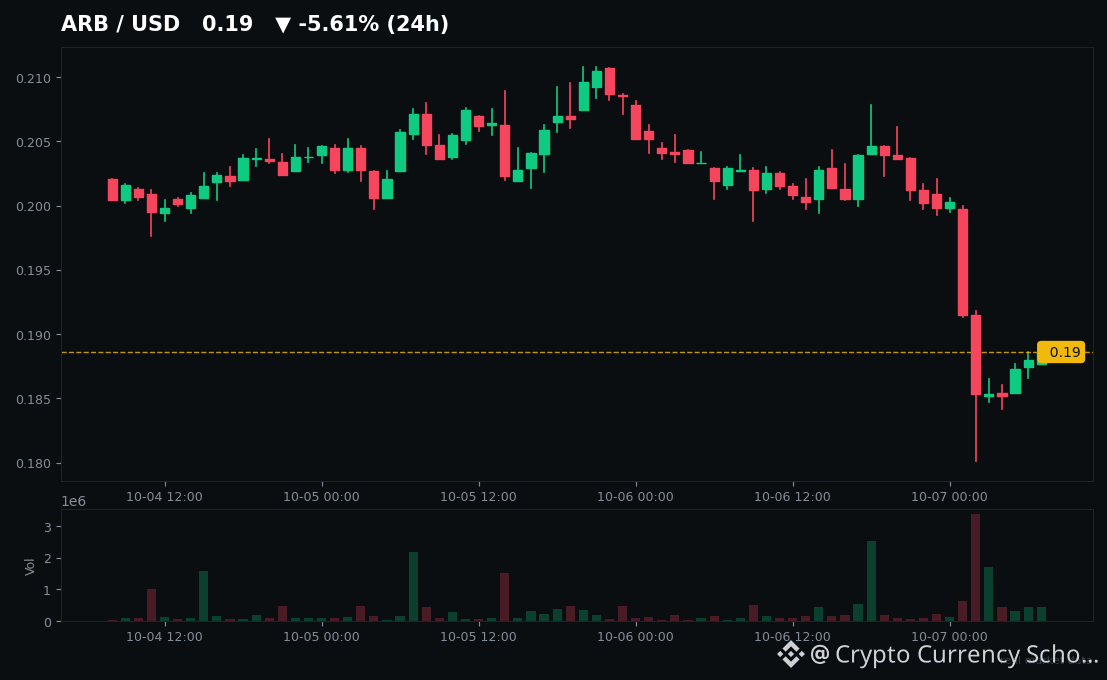
A Bank Says $ARB Could 70x — But It Is Down 5.6% Today. Here Is the Real Story$ARB is down 5.6% today, trading at $0.1886. Meanwhile, one of the world's biggest banks says it could 70x by 2030.
Both of those things are true. And that contradiction is exactly why you should be paying attention right now.
Let's start with the bank. Three weeks ago, Standard Chartered's head of digital assets research, Geoff Kendrick, initiated coverage on Arbitrum — calling it "the blockchain for TradFi." His price path: $0.50 by end of 2026, $1.50 in 2027, all the way to $10 by 2030. His thesis is simple: tokenized real-world assets could hit $4 trillion by 2028, and Arbitrum is quietly becoming the rails for that world.
And there's real smoke behind the call. Arbitrum just disclosed a record September: $5.45M in revenue, roughly 5x the month before.
But here's the catch — and this is the part most hype posts won't tell you. About $4.75M of that revenue (87%) came from Orbit licensing fees, mostly paid by one chain: Robinhood's memecoin chain. Arbitrum One's own transaction fees were just $507K. Plus, Robinhood's gas subsidy ended September 29. October is the first clean read on whether this is organic demand or one memecoin-boom month.
Still, the Arbitrum machine isn't sitting still. This week alone brought two fresh catalysts. Paxos launched its Global Dollar (USDG) on Arbitrum — a DAO proposal is now asking for 100M ARB in incentives to build USDG liquidity. And the Security Council paused new Stylus contract activations as a defensive move against malicious WASM programs — the kind of responsible security action that builders respect, even if it slows new app launches short-term.
Now the honest bear case, because you deserve it: the next token unlock hits October 16 — 92.6M ARB (~$20M) entering circulation. $ARB has no direct revenue share; protocol revenue goes to the DAO treasury, not holders. TVL sits at $1.414B while Base pulls ahead. And $0.21 keeps rejecting the price — trader Zach Anderson calls it "the line in the sand," with a daily close above it opening the path toward $0.25, or a rejection sliding toward $0.17.
So what does this actually mean? ARB has doubled off its June lows near $0.07, but it still sits 92% below its all-time high. A bank sees infrastructure for a $4 trillion market. The market sees a token with an unlock in nine days and a chart that can't hold $0.21.
One of those two stories is wrong. October will tell us which.
What's your take — is the bank early, or is everyone else late?
#Arbitrum #Layer2
Not financial advice. DYOR.
A Bank Says $ARB Could 70x — But It Is Down 5.6% Today. Here Is the Real Story
$ARB is down 5.6% today, trading at $0.1886. Meanwhile, one of the world's biggest banks says it could 70x by 2030.
Both of those things are true. And that contradiction is exactly why you should be paying attention right now.
Let's start with the bank. Three weeks ago, Standard Chartered's head of digital assets research, Geoff Kendrick, initiated coverage on Arbitrum — calling it "the blockchain for TradFi." His price path: $0.50 by end of 2026, $1.50 in 2027, all the way to $10 by 2030. His thesis is simple: tokenized real-world assets could hit $4 trillion by 2028, and Arbitrum is quietly becoming the rails for that world.
And there's real smoke behind the call. Arbitrum just disclosed a record September: $5.45M in revenue, roughly 5x the month before.
But here's the catch — and this is the part most hype posts won't tell you. About $4.75M of that revenue (87%) came from Orbit licensing fees, mostly paid by one chain: Robinhood's memecoin chain. Arbitrum One's own transaction fees were just $507K. Plus, Robinhood's gas subsidy ended September 29. October is the first clean read on whether this is organic demand or one memecoin-boom month.
Still, the Arbitrum machine isn't sitting still. This week alone brought two fresh catalysts. Paxos launched its Global Dollar (USDG) on Arbitrum — a DAO proposal is now asking for 100M ARB in incentives to build USDG liquidity. And the Security Council paused new Stylus contract activations as a defensive move against malicious WASM programs — the kind of responsible security action that builders respect, even if it slows new app launches short-term.
Now the honest bear case, because you deserve it: the next token unlock hits October 16 — 92.6M ARB (~$20M) entering circulation. $ARB has no direct revenue share; protocol revenue goes to the DAO treasury, not holders. TVL sits at $1.414B while Base pulls ahead. And $0.21 keeps rejecting the price — trader Zach Anderson calls it "the line in the sand," with a daily close above it opening the path toward $0.25, or a rejection sliding toward $0.17.
So what does this actually mean? ARB has doubled off its June lows near $0.07, but it still sits 92% below its all-time high. A bank sees infrastructure for a $4 trillion market. The market sees a token with an unlock in nine days and a chart that can't hold $0.21.
One of those two stories is wrong. October will tell us which.
What's your take — is the bank early, or is everyone else late?
#Arbitrum #Layer2
Not financial advice. DYOR.
Both of those things are true. And that contradiction is exactly why you should be paying attention right now.
Let's start with the bank. Three weeks ago, Standard Chartered's head of digital assets research, Geoff Kendrick, initiated coverage on Arbitrum — calling it "the blockchain for TradFi." His price path: $0.50 by end of 2026, $1.50 in 2027, all the way to $10 by 2030. His thesis is simple: tokenized real-world assets could hit $4 trillion by 2028, and Arbitrum is quietly becoming the rails for that world.
And there's real smoke behind the call. Arbitrum just disclosed a record September: $5.45M in revenue, roughly 5x the month before.
But here's the catch — and this is the part most hype posts won't tell you. About $4.75M of that revenue (87%) came from Orbit licensing fees, mostly paid by one chain: Robinhood's memecoin chain. Arbitrum One's own transaction fees were just $507K. Plus, Robinhood's gas subsidy ended September 29. October is the first clean read on whether this is organic demand or one memecoin-boom month.
Still, the Arbitrum machine isn't sitting still. This week alone brought two fresh catalysts. Paxos launched its Global Dollar (USDG) on Arbitrum — a DAO proposal is now asking for 100M ARB in incentives to build USDG liquidity. And the Security Council paused new Stylus contract activations as a defensive move against malicious WASM programs — the kind of responsible security action that builders respect, even if it slows new app launches short-term.
Now the honest bear case, because you deserve it: the next token unlock hits October 16 — 92.6M ARB (~$20M) entering circulation. $ARB has no direct revenue share; protocol revenue goes to the DAO treasury, not holders. TVL sits at $1.414B while Base pulls ahead. And $0.21 keeps rejecting the price — trader Zach Anderson calls it "the line in the sand," with a daily close above it opening the path toward $0.25, or a rejection sliding toward $0.17.
So what does this actually mean? ARB has doubled off its June lows near $0.07, but it still sits 92% below its all-time high. A bank sees infrastructure for a $4 trillion market. The market sees a token with an unlock in nine days and a chart that can't hold $0.21.
One of those two stories is wrong. October will tell us which.
What's your take — is the bank early, or is everyone else late?
#Arbitrum #Layer2
Not financial advice. DYOR.
1
2
708
Мақала
Whales Quietly Loaded 12M of DOGE While It Sat Under /bin/bash.10Your DOGE bag just bled another 4% and you're one click from rage-quitting.
Meanwhile, the wallets holding billions of coins are treating this dip like Black Friday.
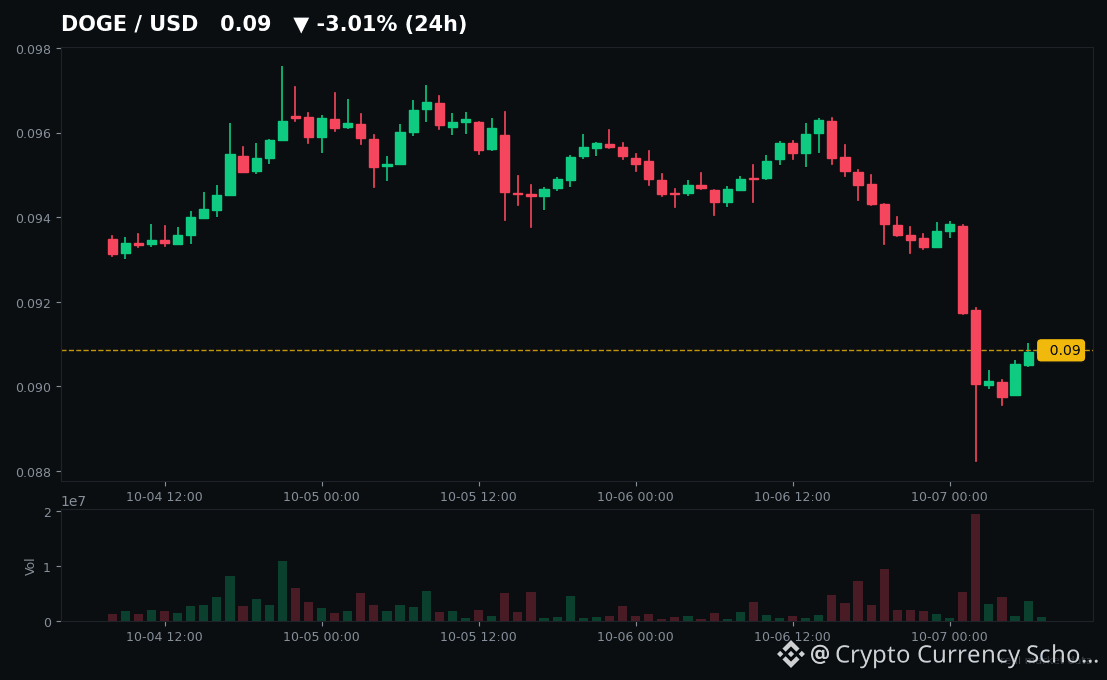
Here's the setup. $DOGE is sitting at ~$0.09 today, down about 3-4% with a wick down to $0.0882. $BTC's flush dragged the whole meme sector down 3-5% — SHIB, PEPE, WIF, BONK all red. Nobody's excited. That's usually when you should pay attention.
Because here's what the chain data shows.
Around September 26-27, wallets holding 100M-1B DOGE swallowed 1.14 BILLION DOGE — roughly $112M — in just 96 hours. That's Santiment data via analyst Ali Martinez, and it pushed this cohort's share of total supply from 20.75% to 21.55%. Follow-up reports say another 310M+ DOGE got added by large wallets in early October. This isn't retail FOMO. It's positioning.
The technicals are setting up too. Analysts are watching $0.095 — a 4-hour close above it confirms a breakout toward $0.106 (Martinez, Oct 4). And per Oct 5 reports, DOGE just printed its first daily golden cross since August 2025. Support sits at the 200-day EMA near $0.0932. Lose that, and sellers take the wheel.
Now the ETF twist nobody's pricing in. Bitwise is shutting down its Dogecoin ETF — last trade Oct 14, barely $800K in assets, nobody showed up. Sounds bearish? The other spot DOGE ETFs just posted RECORD ~$2.9M weekly inflows, led by Grayscale's GDOG which now owns ~81% of the DOGE ETF market. The money didn't leave DOGE. It consolidated behind the winner. Add SEC/CFTC guidance classifying DOGE as a digital commodity, plus the DogeOS Chikyū smart-contract testnet going live Oct 5 — the "just a meme" story is getting harder to tell.
The honest side, because you deserve both: DOGE is still ~88% below its $0.74 ATH from May 2021. Inflation never sleeps — ~5B new coins enter circulation every year. And when memes rotate, the smaller names eat first: on the Sept 22 rotation, PEPE ripped +20% and WIF +22% while DOGE managed +7%. Whale buying is a signal, not a guarantee.
So what's my read? Everyone is bored of $DOGE at $0.09. The whales clearly aren't. When the crowd goes quiet and the big wallets get loud — I listen.
Are you buying this dip, or waiting for $0.10 to break first?
Not financial advice. DYOR.
Whales Quietly Loaded 12M of DOGE While It Sat Under /bin/bash.10
Your DOGE bag just bled another 4% and you're one click from rage-quitting.
Meanwhile, the wallets holding billions of coins are treating this dip like Black Friday.
Here's the setup. $DOGE is sitting at ~$0.09 today, down about 3-4% with a wick down to $0.0882. $BTC 's flush dragged the whole meme sector down 3-5% — SHIB, PEPE, WIF, BONK all red. Nobody's excited. That's usually when you should pay attention.
Because here's what the chain data shows.
Around September 26-27, wallets holding 100M-1B DOGE swallowed 1.14 BILLION DOGE — roughly $112M — in just 96 hours. That's Santiment data via analyst Ali Martinez, and it pushed this cohort's share of total supply from 20.75% to 21.55%. Follow-up reports say another 310M+ DOGE got added by large wallets in early October. This isn't retail FOMO. It's positioning.
The technicals are setting up too. Analysts are watching $0.095 — a 4-hour close above it confirms a breakout toward $0.106 (Martinez, Oct 4). And per Oct 5 reports, DOGE just printed its first daily golden cross since August 2025. Support sits at the 200-day EMA near $0.0932. Lose that, and sellers take the wheel.
Now the ETF twist nobody's pricing in. Bitwise is shutting down its Dogecoin ETF — last trade Oct 14, barely $800K in assets, nobody showed up. Sounds bearish? The other spot DOGE ETFs just posted RECORD ~$2.9M weekly inflows, led by Grayscale's GDOG which now owns ~81% of the DOGE ETF market. The money didn't leave DOGE. It consolidated behind the winner. Add SEC/CFTC guidance classifying DOGE as a digital commodity, plus the DogeOS Chikyū smart-contract testnet going live Oct 5 — the "just a meme" story is getting harder to tell.
The honest side, because you deserve both: DOGE is still ~88% below its $0.74 ATH from May 2021. Inflation never sleeps — ~5B new coins enter circulation every year. And when memes rotate, the smaller names eat first: on the Sept 22 rotation, PEPE ripped +20% and WIF +22% while DOGE managed +7%. Whale buying is a signal, not a guarantee.
So what's my read? Everyone is bored of $DOGE at $0.09. The whales clearly aren't. When the crowd goes quiet and the big wallets get loud — I listen.
Are you buying this dip, or waiting for $0.10 to break first?
Not financial advice. DYOR.
Meanwhile, the wallets holding billions of coins are treating this dip like Black Friday.
Here's the setup. $DOGE is sitting at ~$0.09 today, down about 3-4% with a wick down to $0.0882. $BTC 's flush dragged the whole meme sector down 3-5% — SHIB, PEPE, WIF, BONK all red. Nobody's excited. That's usually when you should pay attention.
Because here's what the chain data shows.
Around September 26-27, wallets holding 100M-1B DOGE swallowed 1.14 BILLION DOGE — roughly $112M — in just 96 hours. That's Santiment data via analyst Ali Martinez, and it pushed this cohort's share of total supply from 20.75% to 21.55%. Follow-up reports say another 310M+ DOGE got added by large wallets in early October. This isn't retail FOMO. It's positioning.
The technicals are setting up too. Analysts are watching $0.095 — a 4-hour close above it confirms a breakout toward $0.106 (Martinez, Oct 4). And per Oct 5 reports, DOGE just printed its first daily golden cross since August 2025. Support sits at the 200-day EMA near $0.0932. Lose that, and sellers take the wheel.
Now the ETF twist nobody's pricing in. Bitwise is shutting down its Dogecoin ETF — last trade Oct 14, barely $800K in assets, nobody showed up. Sounds bearish? The other spot DOGE ETFs just posted RECORD ~$2.9M weekly inflows, led by Grayscale's GDOG which now owns ~81% of the DOGE ETF market. The money didn't leave DOGE. It consolidated behind the winner. Add SEC/CFTC guidance classifying DOGE as a digital commodity, plus the DogeOS Chikyū smart-contract testnet going live Oct 5 — the "just a meme" story is getting harder to tell.
The honest side, because you deserve both: DOGE is still ~88% below its $0.74 ATH from May 2021. Inflation never sleeps — ~5B new coins enter circulation every year. And when memes rotate, the smaller names eat first: on the Sept 22 rotation, PEPE ripped +20% and WIF +22% while DOGE managed +7%. Whale buying is a signal, not a guarantee.
So what's my read? Everyone is bored of $DOGE at $0.09. The whales clearly aren't. When the crowd goes quiet and the big wallets get loud — I listen.
Are you buying this dip, or waiting for $0.10 to break first?
Not financial advice. DYOR.
68
Standard Chartered called LINK $200 by 2030. It's already ahead of scheduleStandard Chartered put a $200 price target on $LINK by 2030.
Here's the part the market seems to have missed: LINK has already beaten the bank's 2026 milestone — three months early.
**The bank's DeFi playbook is undefeated**
This isn't StanChart's first rodeo. In June, they covered $UNI ($100 target) and Aave ($3,500 target). What happened next? UNI ripped ~210%. Aave ripped ~122%. The bank's own September review claimed a 100% hit rate on its altcoin calls.
LINK got the same treatment on August 10 — $200 by end-2030. The spot reaction was quiet (+4.5%), but under the surface it was loud: futures open interest jumped 16%, whale transactions hit a 5-month high, and smart money started piling in.
UNI had its moment. AAVE had its moment. LINK hasn't had its vertical move yet.
**Meanwhile, the fundamentals keep stacking**
This isn't just an old coverage note. In the last two weeks alone: Chainlink launched Fulcrum, the first cross-chain repo platform for banks — demoed with DTCC at Sibos 2026. CCIP 2.0 went live, and $15B+ in token value is now migrating to it as projects abandon older bridges. Spot LINK ETFs just posted their best week since August ($8.3M inflows). CCIP is processing ~$18B in monthly volume.
On-chain, the picture rhymes: the Chainlink Reserve has quietly stacked ~6.12M LINK (~$88M), converting enterprise revenue into LINK every single week with a multi-year timelock. Exchange balances keep draining. Whales accumulated 2.5M+ LINK in a 10-day span through late September.
Geoff Kendrick's thesis in one line: Chainlink is "the only end-to-end platform capable of supporting the full lifecycle of tokenized assets across both DeFi and TradFi." If tokenization grows the way the bank models ($340B → $4T by 2028), that's the thesis in a sentence.
**The honest risks**
The contrarian view deserves space. LINK is still ~74% below its $53 all-time high. The $200 target requires a 12x tokenization boom that may never arrive, and LINK trades at roughly 170x annualized fee revenue. Pyth is eating at the edges — Nasdaq just made Pyth, not Chainlink, an official distributor of its equity data. Positioning is crowded too: 62% of Binance accounts are long, and Bitcoin wicked to $83.6K today.
Technically, everything hinges on a tight range: hold the $13.25 20-day EMA and the late-September $15.75 high stays in play — a daily close above $15.80 puts $18–$20 in view. Lose $13.25, and $11.95 comes fast.
**The take**
Standard Chartered's DeFi coverage has a pattern — pop, fade, then a slow institutional re-rating over months. LINK is the last name in that basket that hasn't had its pop yet, sitting right at the level that decides. The catalysts (Fulcrum, CCIP 2.0, ETF flows) are fresh, the on-chain accumulation is real, and the risk is clearly marked below $13.25.
So — is $LINK the last cheap infrastructure bet in the bank's basket, or does 2030 just look good on paper?
Not financial advice. DYOR.
#DeFi #Chainlink
Standard Chartered called LINK $200 by 2030. It's already ahead of schedule
Standard Chartered put a $200 price target on $LINK by 2030.
Here's the part the market seems to have missed: LINK has already beaten the bank's 2026 milestone — three months early.
**The bank's DeFi playbook is undefeated**
This isn't StanChart's first rodeo. In June, they covered $UNI ($100 target) and Aave ($3,500 target). What happened next? UNI ripped ~210%. Aave ripped ~122%. The bank's own September review claimed a 100% hit rate on its altcoin calls.
LINK got the same treatment on August 10 — $200 by end-2030. The spot reaction was quiet (+4.5%), but under the surface it was loud: futures open interest jumped 16%, whale transactions hit a 5-month high, and smart money started piling in.
UNI had its moment. AAVE had its moment. LINK hasn't had its vertical move yet.
**Meanwhile, the fundamentals keep stacking**
This isn't just an old coverage note. In the last two weeks alone: Chainlink launched Fulcrum, the first cross-chain repo platform for banks — demoed with DTCC at Sibos 2026. CCIP 2.0 went live, and $15B+ in token value is now migrating to it as projects abandon older bridges. Spot LINK ETFs just posted their best week since August ($8.3M inflows). CCIP is processing ~$18B in monthly volume.
On-chain, the picture rhymes: the Chainlink Reserve has quietly stacked ~6.12M LINK (~$88M), converting enterprise revenue into LINK every single week with a multi-year timelock. Exchange balances keep draining. Whales accumulated 2.5M+ LINK in a 10-day span through late September.
Geoff Kendrick's thesis in one line: Chainlink is "the only end-to-end platform capable of supporting the full lifecycle of tokenized assets across both DeFi and TradFi." If tokenization grows the way the bank models ($340B → $4T by 2028), that's the thesis in a sentence.
**The honest risks**
The contrarian view deserves space. LINK is still ~74% below its $53 all-time high. The $200 target requires a 12x tokenization boom that may never arrive, and LINK trades at roughly 170x annualized fee revenue. Pyth is eating at the edges — Nasdaq just made Pyth, not Chainlink, an official distributor of its equity data. Positioning is crowded too: 62% of Binance accounts are long, and Bitcoin wicked to $83.6K today.
Technically, everything hinges on a tight range: hold the $13.25 20-day EMA and the late-September $15.75 high stays in play — a daily close above $15.80 puts $18–$20 in view. Lose $13.25, and $11.95 comes fast.
**The take**
Standard Chartered's DeFi coverage has a pattern — pop, fade, then a slow institutional re-rating over months. LINK is the last name in that basket that hasn't had its pop yet, sitting right at the level that decides. The catalysts (Fulcrum, CCIP 2.0, ETF flows) are fresh, the on-chain accumulation is real, and the risk is clearly marked below $13.25.
So — is $LINK the last cheap infrastructure bet in the bank's basket, or does 2030 just look good on paper?
Not financial advice. DYOR.
#DeFi #Chainlink
Here's the part the market seems to have missed: LINK has already beaten the bank's 2026 milestone — three months early.
**The bank's DeFi playbook is undefeated**
This isn't StanChart's first rodeo. In June, they covered $UNI ($100 target) and Aave ($3,500 target). What happened next? UNI ripped ~210%. Aave ripped ~122%. The bank's own September review claimed a 100% hit rate on its altcoin calls.
LINK got the same treatment on August 10 — $200 by end-2030. The spot reaction was quiet (+4.5%), but under the surface it was loud: futures open interest jumped 16%, whale transactions hit a 5-month high, and smart money started piling in.
UNI had its moment. AAVE had its moment. LINK hasn't had its vertical move yet.
**Meanwhile, the fundamentals keep stacking**
This isn't just an old coverage note. In the last two weeks alone: Chainlink launched Fulcrum, the first cross-chain repo platform for banks — demoed with DTCC at Sibos 2026. CCIP 2.0 went live, and $15B+ in token value is now migrating to it as projects abandon older bridges. Spot LINK ETFs just posted their best week since August ($8.3M inflows). CCIP is processing ~$18B in monthly volume.
On-chain, the picture rhymes: the Chainlink Reserve has quietly stacked ~6.12M LINK (~$88M), converting enterprise revenue into LINK every single week with a multi-year timelock. Exchange balances keep draining. Whales accumulated 2.5M+ LINK in a 10-day span through late September.
Geoff Kendrick's thesis in one line: Chainlink is "the only end-to-end platform capable of supporting the full lifecycle of tokenized assets across both DeFi and TradFi." If tokenization grows the way the bank models ($340B → $4T by 2028), that's the thesis in a sentence.
**The honest risks**
The contrarian view deserves space. LINK is still ~74% below its $53 all-time high. The $200 target requires a 12x tokenization boom that may never arrive, and LINK trades at roughly 170x annualized fee revenue. Pyth is eating at the edges — Nasdaq just made Pyth, not Chainlink, an official distributor of its equity data. Positioning is crowded too: 62% of Binance accounts are long, and Bitcoin wicked to $83.6K today.
Technically, everything hinges on a tight range: hold the $13.25 20-day EMA and the late-September $15.75 high stays in play — a daily close above $15.80 puts $18–$20 in view. Lose $13.25, and $11.95 comes fast.
**The take**
Standard Chartered's DeFi coverage has a pattern — pop, fade, then a slow institutional re-rating over months. LINK is the last name in that basket that hasn't had its pop yet, sitting right at the level that decides. The catalysts (Fulcrum, CCIP 2.0, ETF flows) are fresh, the on-chain accumulation is real, and the risk is clearly marked below $13.25.
So — is $LINK the last cheap infrastructure bet in the bank's basket, or does 2030 just look good on paper?
Not financial advice. DYOR.
#DeFi #Chainlink
326
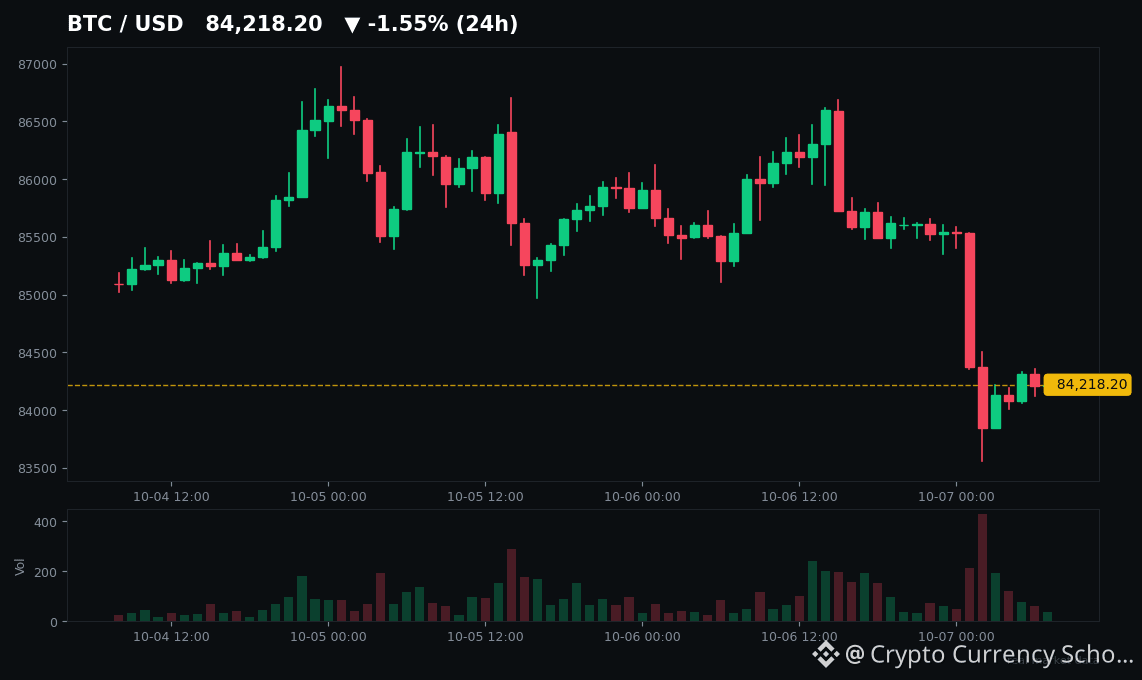
Мақала
$BTC Just Wicked to $83.6K on Massive Volume — Buyers Ate Every CoinOne red candle. $403 million in longs vaporized in a single hour. And yet — $BTC refused to die below $83.6K.
If you felt your stomach drop this morning, you weren't alone. Bitcoin sliced from $86.7K straight down to $83,577 in hours, on the kind of high-volume red candle that usually marks real panic. But watch what happened next — because the bounce is telling you everything.
Here's what actually caused it, and it's not what the timeline is screaming. On-chain data shows this was NOT whales dumping on you. Exchange balances were net falling into the drop. Whale transaction volume was down 58% from average. What really happened: leveraged longs got too greedy. Funding rates had tripled to 10% annualized. Open interest ballooned. The market was a coiled spring of overleveraged longs — and $83.6K was the pin being pulled. Nearly $490 million in longs got liquidated in 24 hours. That's a leverage reset, not a trend change.
And here's the part nobody's talking about: buyers were waiting. Glassnode data shows roughly 1.59 million BTC changed hands between $83,300 and $84,600 — one of the densest on-chain support zones in this entire range. The moment price wicked into it, spot buyers absorbed everything. Spot CVD flipped from -$102M to +$33M. Binance just printed its largest daily BTC outflow in 3 years — coins leaving exchanges, not entering. That's accumulation behavior, not distribution.
So what's the take? Dips are being bought aggressively. Every test of $83.5K gets eaten. But here's the honest part: $85K just flipped from support to resistance, and $87K remains the triple-rejection ceiling. History warns us too — the last two times BTC pulled the violent-dump-then-instant-bounce routine, the bounce was a bull trap before lower lows.
So here's the line in the sand: $83.5K holds, and the dip-buyers are right — a squeeze toward $86.7K stays live. $83.5K breaks, and the trapdoor opens toward $82K and below.
Are the dip-buyers right this time?
Not financial advice. DYOR.
$BTC Just Wicked to $83.6K on Massive Volume — Buyers Ate Every Coin
One red candle. $403 million in longs vaporized in a single hour. And yet — $BTC refused to die below $83.6K.
If you felt your stomach drop this morning, you weren't alone. Bitcoin sliced from $86.7K straight down to $83,577 in hours, on the kind of high-volume red candle that usually marks real panic. But watch what happened next — because the bounce is telling you everything.
Here's what actually caused it, and it's not what the timeline is screaming. On-chain data shows this was NOT whales dumping on you. Exchange balances were net falling into the drop. Whale transaction volume was down 58% from average. What really happened: leveraged longs got too greedy. Funding rates had tripled to 10% annualized. Open interest ballooned. The market was a coiled spring of overleveraged longs — and $83.6K was the pin being pulled. Nearly $490 million in longs got liquidated in 24 hours. That's a leverage reset, not a trend change.
And here's the part nobody's talking about: buyers were waiting. Glassnode data shows roughly 1.59 million BTC changed hands between $83,300 and $84,600 — one of the densest on-chain support zones in this entire range. The moment price wicked into it, spot buyers absorbed everything. Spot CVD flipped from -$102M to +$33M. Binance just printed its largest daily BTC outflow in 3 years — coins leaving exchanges, not entering. That's accumulation behavior, not distribution.
So what's the take? Dips are being bought aggressively. Every test of $83.5K gets eaten. But here's the honest part: $85K just flipped from support to resistance, and $87K remains the triple-rejection ceiling. History warns us too — the last two times BTC pulled the violent-dump-then-instant-bounce routine, the bounce was a bull trap before lower lows.
So here's the line in the sand: $83.5K holds, and the dip-buyers are right — a squeeze toward $86.7K stays live. $83.5K breaks, and the trapdoor opens toward $82K and below.
Are the dip-buyers right this time?
Not financial advice. DYOR.
If you felt your stomach drop this morning, you weren't alone. Bitcoin sliced from $86.7K straight down to $83,577 in hours, on the kind of high-volume red candle that usually marks real panic. But watch what happened next — because the bounce is telling you everything.
Here's what actually caused it, and it's not what the timeline is screaming. On-chain data shows this was NOT whales dumping on you. Exchange balances were net falling into the drop. Whale transaction volume was down 58% from average. What really happened: leveraged longs got too greedy. Funding rates had tripled to 10% annualized. Open interest ballooned. The market was a coiled spring of overleveraged longs — and $83.6K was the pin being pulled. Nearly $490 million in longs got liquidated in 24 hours. That's a leverage reset, not a trend change.
And here's the part nobody's talking about: buyers were waiting. Glassnode data shows roughly 1.59 million BTC changed hands between $83,300 and $84,600 — one of the densest on-chain support zones in this entire range. The moment price wicked into it, spot buyers absorbed everything. Spot CVD flipped from -$102M to +$33M. Binance just printed its largest daily BTC outflow in 3 years — coins leaving exchanges, not entering. That's accumulation behavior, not distribution.
So what's the take? Dips are being bought aggressively. Every test of $83.5K gets eaten. But here's the honest part: $85K just flipped from support to resistance, and $87K remains the triple-rejection ceiling. History warns us too — the last two times BTC pulled the violent-dump-then-instant-bounce routine, the bounce was a bull trap before lower lows.
So here's the line in the sand: $83.5K holds, and the dip-buyers are right — a squeeze toward $86.7K stays live. $83.5K breaks, and the trapdoor opens toward $82K and below.
Are the dip-buyers right this time?
Not financial advice. DYOR.
66
ETF Money Just Walked Away From SOL. The Whales Didn't.$SOL is sitting at $119 and nobody can agree what it means.
ETF investors just walked away — Solana ETF inflows collapsed 97% last week to a mere $2.4M, down from a record $188M the week before. Two straight days of outflows since. Social sentiment just hit its most bearish reading of the year.
And yet whales bought over $50 million in days.
One whale pulled 134,628 SOL (~$32.4M) off Binance in six hours. A high-win-rate trader opened a $19.8M 5x long. DeFi Development Corp added 26,203 SOL to its treasury.
So who's right — the ETFs walking away, or the whales loading up?
The chart says SOL is coiling. Rejected at $120–$125 again and again, but still holding above every major moving average. Longs are crowded — 64% of accounts are long — which usually means a violent move is coming either way. A daily close above $125 opens the path to $135–$150. Lose $114, and it gets ugly fast: $95–$100.
Meanwhile the real rails keep getting laid. The Solana Foundation just launched Solana DvP — atomic settlement built for banks, with JPMorgan giving input on institutional practices. Tokenized stocks on Solana hit a record $4.4B in September — 97% of all on-chain tokenized-equity volume. Solana also just posted its 15th straight month as the #1 DEX chain ($74B in September). $ETH can keep the narrative. The actual flow is going through Solana.
Here's my take: this is the most interesting $SOL setup of the year, and almost nobody's watching. History is honest about October — it's a coin flip for SOL. But the two biggest October rallies (2021 and 2023) both started exactly like this: strong rails, weak price, everyone looking elsewhere.
The risk is real. If $125 rejects again while ETF money keeps leaving, those crowded longs get flushed to $95. Respect the levels.
But whales buying the dip while Wall Street builds the rails and retail is depressed? That's the setup contrarians dream about.
Is $125 the wall, or the slingshot? Comment your take. 👇
Not financial advice. DYOR.
$BTC $ETH
ETF Money Just Walked Away From SOL. The Whales Didn't.
$SOL is sitting at $119 and nobody can agree what it means.
ETF investors just walked away — Solana ETF inflows collapsed 97% last week to a mere $2.4M, down from a record $188M the week before. Two straight days of outflows since. Social sentiment just hit its most bearish reading of the year.
And yet whales bought over $50 million in days.
One whale pulled 134,628 SOL (~$32.4M) off Binance in six hours. A high-win-rate trader opened a $19.8M 5x long. DeFi Development Corp added 26,203 SOL to its treasury.
So who's right — the ETFs walking away, or the whales loading up?
The chart says SOL is coiling. Rejected at $120–$125 again and again, but still holding above every major moving average. Longs are crowded — 64% of accounts are long — which usually means a violent move is coming either way. A daily close above $125 opens the path to $135–$150. Lose $114, and it gets ugly fast: $95–$100.
Meanwhile the real rails keep getting laid. The Solana Foundation just launched Solana DvP — atomic settlement built for banks, with JPMorgan giving input on institutional practices. Tokenized stocks on Solana hit a record $4.4B in September — 97% of all on-chain tokenized-equity volume. Solana also just posted its 15th straight month as the #1 DEX chain ($74B in September). $ETH can keep the narrative. The actual flow is going through Solana.
Here's my take: this is the most interesting $SOL setup of the year, and almost nobody's watching. History is honest about October — it's a coin flip for SOL. But the two biggest October rallies (2021 and 2023) both started exactly like this: strong rails, weak price, everyone looking elsewhere.
The risk is real. If $125 rejects again while ETF money keeps leaving, those crowded longs get flushed to $95. Respect the levels.
But whales buying the dip while Wall Street builds the rails and retail is depressed? That's the setup contrarians dream about.
Is $125 the wall, or the slingshot? Comment your take. 👇
Not financial advice. DYOR.
$BTC $ETH
ETF investors just walked away — Solana ETF inflows collapsed 97% last week to a mere $2.4M, down from a record $188M the week before. Two straight days of outflows since. Social sentiment just hit its most bearish reading of the year.
And yet whales bought over $50 million in days.
One whale pulled 134,628 SOL (~$32.4M) off Binance in six hours. A high-win-rate trader opened a $19.8M 5x long. DeFi Development Corp added 26,203 SOL to its treasury.
So who's right — the ETFs walking away, or the whales loading up?
The chart says SOL is coiling. Rejected at $120–$125 again and again, but still holding above every major moving average. Longs are crowded — 64% of accounts are long — which usually means a violent move is coming either way. A daily close above $125 opens the path to $135–$150. Lose $114, and it gets ugly fast: $95–$100.
Meanwhile the real rails keep getting laid. The Solana Foundation just launched Solana DvP — atomic settlement built for banks, with JPMorgan giving input on institutional practices. Tokenized stocks on Solana hit a record $4.4B in September — 97% of all on-chain tokenized-equity volume. Solana also just posted its 15th straight month as the #1 DEX chain ($74B in September). $ETH can keep the narrative. The actual flow is going through Solana.
Here's my take: this is the most interesting $SOL setup of the year, and almost nobody's watching. History is honest about October — it's a coin flip for SOL. But the two biggest October rallies (2021 and 2023) both started exactly like this: strong rails, weak price, everyone looking elsewhere.
The risk is real. If $125 rejects again while ETF money keeps leaving, those crowded longs get flushed to $95. Respect the levels.
But whales buying the dip while Wall Street builds the rails and retail is depressed? That's the setup contrarians dream about.
Is $125 the wall, or the slingshot? Comment your take. 👇
Not financial advice. DYOR.
$BTC $ETH
86

Мақала
$ETH at $2,650: Five Days of ETF Outflows, Record Crowd Hate — and a Squeeze Building**$ETH is pinned at ~$2,650, and the crowd has never hated it more. That's exactly what makes this interesting.**
Look at the setup: US spot Ether ETFs just logged five straight days of net outflows — about $206M — while retail sentiment on $ETH collapsed to its lowest since June. Shorts on Bitfinex exploded from a few hundred to over 100,000 ETH in two weeks. Everybody is positioned for failure. And yet price is still holding above the 20-day EMA at ~$2,650. This is what a coiled market looks like.
📊 **The squeeze setup**
$ETH is trapped between $2,650 support and the $2,775–$2,800 wall that has rejected every rally attempt since late September. Here's the tension: 71% of Binance accounts are long, funding is neutral, and levered longs are getting flushed just under $2,700 — over $12M in a single day earlier this week. The shorts think they own this range. But every rejection keeps holding higher lows, and the 50-day EMA at ~$2,492 is where the bullish structure breaks. A daily close above $2,800 — the September high analysts keep circling — and those stacked shorts become fuel.
🐋 **Whales are fighting over this level**
On-chain is a genuine tug-of-war. An ICO-era whale moved 133,298 ETH (~$356M) on October 1 — wallet to wallet, not a sale — while another OG wallet dumped 13,330 ETH (~$36M) into Coinbase at ~$2,728. Meanwhile fresh buyers stepped in: one whale scooped 14,750 ETH (~$34M) through FalconX and Coinbase, and another bought $23.7M near $2,794. Whale exchange outflows hit roughly $1.86B net over the last month. Big money disagrees with itself — direction is about to get decided, not drift.
⚠️ **The honest risk**
I won't pretend this is one-sided. That ETF bleed is real money leaving, and macro is unfriendly: September FOMC minutes drop today, September CPI hits October 14, and the October 28–29 Fed meeting could bring another hike. Meanwhile the MetaMask security incident forced ~767,000 ETH (~$2.1B) into a 13-day unstaking queue; Lido says it will restake, not sell, but that's $2B of locked ETH about to become liquid. And history rhymes: ETH got rejected at $4,000 three times in 2024 before sliding 60%+. Failed breakouts at psychological walls can hurt.
**Here's my take:** fundamentals quietly improved this week — Ethereum's Glamsterdam upgrade went live on the Sepolia testnet with a 200M gas-limit trial, and Citi raised its 12-month $ETH target to $3,028 — while positioning got as bearish as it's been all year. Bearish crowds + improving protocol news + a tight range above support is the classic recipe for a violent resolution in *either* direction. I'm not calling the top or bottom. I'm saying the next real move out of $2,650–$2,800 will be fast, and it'll catch the complacent side — long or short — off guard. $BTC dominance at ~58.6% means alts like $SOL are watching too: $ETH leads, alts follow.
Are you treating $2,800 as the line in the sand, or is $2,492 the real tell? Drop your level below 👇
$ETH $BTC $SOL
Not financial advice. DYOR.
$ETH at $2,650: Five Days of ETF Outflows, Record Crowd Hate — and a Squeeze Building
**$ETH is pinned at ~$2,650, and the crowd has never hated it more. That's exactly what makes this interesting.**
Look at the setup: US spot Ether ETFs just logged five straight days of net outflows — about $206M — while retail sentiment on $ETH collapsed to its lowest since June. Shorts on Bitfinex exploded from a few hundred to over 100,000 ETH in two weeks. Everybody is positioned for failure. And yet price is still holding above the 20-day EMA at ~$2,650. This is what a coiled market looks like.
📊 **The squeeze setup**
$ETH is trapped between $2,650 support and the $2,775–$2,800 wall that has rejected every rally attempt since late September. Here's the tension: 71% of Binance accounts are long, funding is neutral, and levered longs are getting flushed just under $2,700 — over $12M in a single day earlier this week. The shorts think they own this range. But every rejection keeps holding higher lows, and the 50-day EMA at ~$2,492 is where the bullish structure breaks. A daily close above $2,800 — the September high analysts keep circling — and those stacked shorts become fuel.
🐋 **Whales are fighting over this level**
On-chain is a genuine tug-of-war. An ICO-era whale moved 133,298 ETH (~$356M) on October 1 — wallet to wallet, not a sale — while another OG wallet dumped 13,330 ETH (~$36M) into Coinbase at ~$2,728. Meanwhile fresh buyers stepped in: one whale scooped 14,750 ETH (~$34M) through FalconX and Coinbase, and another bought $23.7M near $2,794. Whale exchange outflows hit roughly $1.86B net over the last month. Big money disagrees with itself — direction is about to get decided, not drift.
⚠️ **The honest risk**
I won't pretend this is one-sided. That ETF bleed is real money leaving, and macro is unfriendly: September FOMC minutes drop today, September CPI hits October 14, and the October 28–29 Fed meeting could bring another hike. Meanwhile the MetaMask security incident forced ~767,000 ETH (~$2.1B) into a 13-day unstaking queue; Lido says it will restake, not sell, but that's $2B of locked ETH about to become liquid. And history rhymes: ETH got rejected at $4,000 three times in 2024 before sliding 60%+. Failed breakouts at psychological walls can hurt.
**Here's my take:** fundamentals quietly improved this week — Ethereum's Glamsterdam upgrade went live on the Sepolia testnet with a 200M gas-limit trial, and Citi raised its 12-month $ETH target to $3,028 — while positioning got as bearish as it's been all year. Bearish crowds + improving protocol news + a tight range above support is the classic recipe for a violent resolution in *either* direction. I'm not calling the top or bottom. I'm saying the next real move out of $2,650–$2,800 will be fast, and it'll catch the complacent side — long or short — off guard. $BTC dominance at ~58.6% means alts like $SOL are watching too: $ETH leads, alts follow.
Are you treating $2,800 as the line in the sand, or is $2,492 the real tell? Drop your level below 👇
$ETH $BTC $SOL
Not financial advice. DYOR.
Look at the setup: US spot Ether ETFs just logged five straight days of net outflows — about $206M — while retail sentiment on $ETH collapsed to its lowest since June. Shorts on Bitfinex exploded from a few hundred to over 100,000 ETH in two weeks. Everybody is positioned for failure. And yet price is still holding above the 20-day EMA at ~$2,650. This is what a coiled market looks like.
📊 **The squeeze setup**
$ETH is trapped between $2,650 support and the $2,775–$2,800 wall that has rejected every rally attempt since late September. Here's the tension: 71% of Binance accounts are long, funding is neutral, and levered longs are getting flushed just under $2,700 — over $12M in a single day earlier this week. The shorts think they own this range. But every rejection keeps holding higher lows, and the 50-day EMA at ~$2,492 is where the bullish structure breaks. A daily close above $2,800 — the September high analysts keep circling — and those stacked shorts become fuel.
🐋 **Whales are fighting over this level**
On-chain is a genuine tug-of-war. An ICO-era whale moved 133,298 ETH (~$356M) on October 1 — wallet to wallet, not a sale — while another OG wallet dumped 13,330 ETH (~$36M) into Coinbase at ~$2,728. Meanwhile fresh buyers stepped in: one whale scooped 14,750 ETH (~$34M) through FalconX and Coinbase, and another bought $23.7M near $2,794. Whale exchange outflows hit roughly $1.86B net over the last month. Big money disagrees with itself — direction is about to get decided, not drift.
⚠️ **The honest risk**
I won't pretend this is one-sided. That ETF bleed is real money leaving, and macro is unfriendly: September FOMC minutes drop today, September CPI hits October 14, and the October 28–29 Fed meeting could bring another hike. Meanwhile the MetaMask security incident forced ~767,000 ETH (~$2.1B) into a 13-day unstaking queue; Lido says it will restake, not sell, but that's $2B of locked ETH about to become liquid. And history rhymes: ETH got rejected at $4,000 three times in 2024 before sliding 60%+. Failed breakouts at psychological walls can hurt.
**Here's my take:** fundamentals quietly improved this week — Ethereum's Glamsterdam upgrade went live on the Sepolia testnet with a 200M gas-limit trial, and Citi raised its 12-month $ETH target to $3,028 — while positioning got as bearish as it's been all year. Bearish crowds + improving protocol news + a tight range above support is the classic recipe for a violent resolution in *either* direction. I'm not calling the top or bottom. I'm saying the next real move out of $2,650–$2,800 will be fast, and it'll catch the complacent side — long or short — off guard. $BTC dominance at ~58.6% means alts like $SOL are watching too: $ETH leads, alts follow.
Are you treating $2,800 as the line in the sand, or is $2,492 the real tell? Drop your level below 👇
$ETH $BTC $SOL
Not financial advice. DYOR.
111

Мақала
$BTC Rejected at $87K Again — While Whales Quietly Pulled $3B Off Exchanges$BTC just got rejected at $87K for the third time since September 23 — yet whales quietly pulled $3B worth of Bitcoin off exchanges in the same window. One of these two facts is lying. Let's look at the data.
**The setup**
Bitcoin is trading around $85.6K after sellers defended the $87K–$87.3K zone once again. Price is coiling near the apex of a triangle: rising support underneath, the $87K ceiling above. These compressions don't last — they resolve with volatility. The levels are clean: resistance at $87.3K, then $89K and $90K; support at the $84.7K session low, the 20-day EMA near $82.9K, and the $82.3K breakout zone. Lose $82K and the 100-week EMA at $78.7K comes into play.
**What the bulls see**
The on-chain picture is quietly aggressive. Binance's BTC reserves plunged by ~41,700 BTC (over $3B) since September 20 — the exchange's largest withdrawal in three years. The exchange inflow/outflow ratio dropped to 0.97, meaning more coins are leaving exchanges than arriving — a classic bullish setup as sell-side supply thins. Whale holdings are up ~75,000 BTC over the last 30 days. Add record Q3 ETF inflows ($6.34B), steady corporate buying — Strategy added 334 BTC, Strive bought 2,000 BTC for $169M — plus the SEC approving the first 3x leveraged Bitcoin and $ETH ETFs, and the structural bid looks real. A weak September jobs print (29K vs ~84K expected) also collapsed October Fed hike odds, which risk assets love.
**What the bears see**
Honesty requires the other side. ETF momentum is cooling: after the record quarter, October 5 saw ~$89.9M in net outflows. On Hyperliquid, large addresses hold ~$830M in BTC shorts against ~$518M in longs — big money is positioned for downside. And while exchange outflows look bullish, they don't prove accumulation; coins could be moving to custody rather than cold-storage conviction. The macro calendar is loaded: Fed minutes land Wednesday, CPI on October 14, and the FOMC meeting on October 27–28.
**What the data actually says**
Three rejections at $87K with thinning sell-side supply is exactly how the 2020 $10K battle looked before the breakout — and how this cycle's $65K ceiling looked in August before September's 40%+ rally. Breakouts need volume, and that's the missing ingredient: watch for expanding green volume on any push through $87.3K. Until then, $82K is the line in the sand.
Is $87K the launchpad or the ceiling? The supply data says launchpad — but the market gets the final vote.
Not financial advice. DYOR.
$BTC Rejected at $87K Again — While Whales Quietly Pulled $3B Off Exchanges
$BTC just got rejected at $87K for the third time since September 23 — yet whales quietly pulled $3B worth of Bitcoin off exchanges in the same window. One of these two facts is lying. Let's look at the data.
**The setup**
Bitcoin is trading around $85.6K after sellers defended the $87K–$87.3K zone once again. Price is coiling near the apex of a triangle: rising support underneath, the $87K ceiling above. These compressions don't last — they resolve with volatility. The levels are clean: resistance at $87.3K, then $89K and $90K; support at the $84.7K session low, the 20-day EMA near $82.9K, and the $82.3K breakout zone. Lose $82K and the 100-week EMA at $78.7K comes into play.
**What the bulls see**
The on-chain picture is quietly aggressive. Binance's BTC reserves plunged by ~41,700 BTC (over $3B) since September 20 — the exchange's largest withdrawal in three years. The exchange inflow/outflow ratio dropped to 0.97, meaning more coins are leaving exchanges than arriving — a classic bullish setup as sell-side supply thins. Whale holdings are up ~75,000 BTC over the last 30 days. Add record Q3 ETF inflows ($6.34B), steady corporate buying — Strategy added 334 BTC, Strive bought 2,000 BTC for $169M — plus the SEC approving the first 3x leveraged Bitcoin and $ETH ETFs, and the structural bid looks real. A weak September jobs print (29K vs ~84K expected) also collapsed October Fed hike odds, which risk assets love.
**What the bears see**
Honesty requires the other side. ETF momentum is cooling: after the record quarter, October 5 saw ~$89.9M in net outflows. On Hyperliquid, large addresses hold ~$830M in BTC shorts against ~$518M in longs — big money is positioned for downside. And while exchange outflows look bullish, they don't prove accumulation; coins could be moving to custody rather than cold-storage conviction. The macro calendar is loaded: Fed minutes land Wednesday, CPI on October 14, and the FOMC meeting on October 27–28.
**What the data actually says**
Three rejections at $87K with thinning sell-side supply is exactly how the 2020 $10K battle looked before the breakout — and how this cycle's $65K ceiling looked in August before September's 40%+ rally. Breakouts need volume, and that's the missing ingredient: watch for expanding green volume on any push through $87.3K. Until then, $82K is the line in the sand.
Is $87K the launchpad or the ceiling? The supply data says launchpad — but the market gets the final vote.
Not financial advice. DYOR.
**The setup**
Bitcoin is trading around $85.6K after sellers defended the $87K–$87.3K zone once again. Price is coiling near the apex of a triangle: rising support underneath, the $87K ceiling above. These compressions don't last — they resolve with volatility. The levels are clean: resistance at $87.3K, then $89K and $90K; support at the $84.7K session low, the 20-day EMA near $82.9K, and the $82.3K breakout zone. Lose $82K and the 100-week EMA at $78.7K comes into play.
**What the bulls see**
The on-chain picture is quietly aggressive. Binance's BTC reserves plunged by ~41,700 BTC (over $3B) since September 20 — the exchange's largest withdrawal in three years. The exchange inflow/outflow ratio dropped to 0.97, meaning more coins are leaving exchanges than arriving — a classic bullish setup as sell-side supply thins. Whale holdings are up ~75,000 BTC over the last 30 days. Add record Q3 ETF inflows ($6.34B), steady corporate buying — Strategy added 334 BTC, Strive bought 2,000 BTC for $169M — plus the SEC approving the first 3x leveraged Bitcoin and $ETH ETFs, and the structural bid looks real. A weak September jobs print (29K vs ~84K expected) also collapsed October Fed hike odds, which risk assets love.
**What the bears see**
Honesty requires the other side. ETF momentum is cooling: after the record quarter, October 5 saw ~$89.9M in net outflows. On Hyperliquid, large addresses hold ~$830M in BTC shorts against ~$518M in longs — big money is positioned for downside. And while exchange outflows look bullish, they don't prove accumulation; coins could be moving to custody rather than cold-storage conviction. The macro calendar is loaded: Fed minutes land Wednesday, CPI on October 14, and the FOMC meeting on October 27–28.
**What the data actually says**
Three rejections at $87K with thinning sell-side supply is exactly how the 2020 $10K battle looked before the breakout — and how this cycle's $65K ceiling looked in August before September's 40%+ rally. Breakouts need volume, and that's the missing ingredient: watch for expanding green volume on any push through $87.3K. Until then, $82K is the line in the sand.
Is $87K the launchpad or the ceiling? The supply data says launchpad — but the market gets the final vote.
Not financial advice. DYOR.
32
Bitcoin Whales Pull Supply Off Exchanges While $87K Blocks the RallyWhales are quietly pulling Bitcoin off exchanges — while price refuses to break $87K.
On-chain data from the past 24–48 hours tells a two-sided story. Bitcoin closed the weekend at $85,413, trading in a tight band between $84,500 and $87,000, and repeated rejections near $87,000 have kept the $90K milestone out of reach. Yet underneath that consolidation, supply is leaving exchanges, not arriving.
Whale flows: The clearest supply-side signal
Tracked exchange flows show roughly 4,655 BTC left exchanges versus only 2,482 BTC arriving — a net outflow of about 2,172 BTC ($185.5M) in a single day. This is part of a broader shift: a three-month period of net whale deposits into exchanges ended in late August, and whale exchange flows have been negative since. Large holders are currently moving more Bitcoin into self-custody than toward potential sale points.
Whale behavior is rebalancing, not one-directional. Data shows 512 tracked whales flipped toward accumulation (net +259,822 BTC) while 472 moved toward distribution (net −221,686 BTC). Separately, on-chain analysts note whales have added roughly 14,335 BTC (~$1.22B) since October 1.
The caution flag: whale activity is rising.
Bitcoin's Exchange Whale Ratio has climbed toward 0.30–0.35, with transfers above $100,000 staying elevated. Transfers in the 10–100 BTC bucket are taking a growing share of exchange inflows. Elevated whale activity while price stalls below resistance means sell-side risk stays on the table — deposits don't always equal selling (custody moves, OTC settlement, collateral), but the timing warrants respect.
Sentiment and institutional demand
The Crypto Fear & Greed Index sits in "Greed" at 65–70, cooling from 74 — constructive but not euphoric. Spot Bitcoin ETFs posted a third straight week of net inflows ($241.1M), while Ether ETFs flipped to $138M in weekly outflows after pulling in $690M the week before. $BTC dominance holds around 59%, keeping the market's weight on Bitcoin's next move.
What to watch next
- Whether daily exchange outflows continue or flip back to inflows
- The $86,700 breakout level versus the $83,300–$84,600 support zone, where 1.59M BTC changed hands
- $ETH ETF flows recovering from this week's redemptions
The takeaway: supply keeps tightening while sentiment cools — a setup that rewards patience, not chasing. Not financial advice. DYOR.
Bitcoin Whales Pull Supply Off Exchanges While $87K Blocks the Rally
Whales are quietly pulling Bitcoin off exchanges — while price refuses to break $87K.
On-chain data from the past 24–48 hours tells a two-sided story. Bitcoin closed the weekend at $85,413, trading in a tight band between $84,500 and $87,000, and repeated rejections near $87,000 have kept the $90K milestone out of reach. Yet underneath that consolidation, supply is leaving exchanges, not arriving.
Whale flows: The clearest supply-side signal
Tracked exchange flows show roughly 4,655 BTC left exchanges versus only 2,482 BTC arriving — a net outflow of about 2,172 BTC ($185.5M) in a single day. This is part of a broader shift: a three-month period of net whale deposits into exchanges ended in late August, and whale exchange flows have been negative since. Large holders are currently moving more Bitcoin into self-custody than toward potential sale points.
Whale behavior is rebalancing, not one-directional. Data shows 512 tracked whales flipped toward accumulation (net +259,822 BTC) while 472 moved toward distribution (net −221,686 BTC). Separately, on-chain analysts note whales have added roughly 14,335 BTC (~$1.22B) since October 1.
The caution flag: whale activity is rising.
Bitcoin's Exchange Whale Ratio has climbed toward 0.30–0.35, with transfers above $100,000 staying elevated. Transfers in the 10–100 BTC bucket are taking a growing share of exchange inflows. Elevated whale activity while price stalls below resistance means sell-side risk stays on the table — deposits don't always equal selling (custody moves, OTC settlement, collateral), but the timing warrants respect.
Sentiment and institutional demand
The Crypto Fear & Greed Index sits in "Greed" at 65–70, cooling from 74 — constructive but not euphoric. Spot Bitcoin ETFs posted a third straight week of net inflows ($241.1M), while Ether ETFs flipped to $138M in weekly outflows after pulling in $690M the week before. $BTC dominance holds around 59%, keeping the market's weight on Bitcoin's next move.
What to watch next
- Whether daily exchange outflows continue or flip back to inflows
- The $86,700 breakout level versus the $83,300–$84,600 support zone, where 1.59M BTC changed hands
- $ETH ETF flows recovering from this week's redemptions
The takeaway: supply keeps tightening while sentiment cools — a setup that rewards patience, not chasing. Not financial advice. DYOR.
On-chain data from the past 24–48 hours tells a two-sided story. Bitcoin closed the weekend at $85,413, trading in a tight band between $84,500 and $87,000, and repeated rejections near $87,000 have kept the $90K milestone out of reach. Yet underneath that consolidation, supply is leaving exchanges, not arriving.
Whale flows: The clearest supply-side signal
Tracked exchange flows show roughly 4,655 BTC left exchanges versus only 2,482 BTC arriving — a net outflow of about 2,172 BTC ($185.5M) in a single day. This is part of a broader shift: a three-month period of net whale deposits into exchanges ended in late August, and whale exchange flows have been negative since. Large holders are currently moving more Bitcoin into self-custody than toward potential sale points.
Whale behavior is rebalancing, not one-directional. Data shows 512 tracked whales flipped toward accumulation (net +259,822 BTC) while 472 moved toward distribution (net −221,686 BTC). Separately, on-chain analysts note whales have added roughly 14,335 BTC (~$1.22B) since October 1.
The caution flag: whale activity is rising.
Bitcoin's Exchange Whale Ratio has climbed toward 0.30–0.35, with transfers above $100,000 staying elevated. Transfers in the 10–100 BTC bucket are taking a growing share of exchange inflows. Elevated whale activity while price stalls below resistance means sell-side risk stays on the table — deposits don't always equal selling (custody moves, OTC settlement, collateral), but the timing warrants respect.
Sentiment and institutional demand
The Crypto Fear & Greed Index sits in "Greed" at 65–70, cooling from 74 — constructive but not euphoric. Spot Bitcoin ETFs posted a third straight week of net inflows ($241.1M), while Ether ETFs flipped to $138M in weekly outflows after pulling in $690M the week before. $BTC dominance holds around 59%, keeping the market's weight on Bitcoin's next move.
What to watch next
- Whether daily exchange outflows continue or flip back to inflows
- The $86,700 breakout level versus the $83,300–$84,600 support zone, where 1.59M BTC changed hands
- $ETH ETF flows recovering from this week's redemptions
The takeaway: supply keeps tightening while sentiment cools — a setup that rewards patience, not chasing. Not financial advice. DYOR.
67
Funding Rates Explained: The Hidden Cost Every Futures Beginner Must KnowEver wondered why crypto perpetual futures never drift far from the real spot price? The answer is a quiet little payment called the funding rate — and understanding it will save you money on your very first futures trade.
What is a funding rate?
Unlike regular futures, perpetual futures never expire. So nothing naturally forces their price to match the spot market. The funding rate is the clever mechanism that does that job: a periodic payment exchanged between long and short traders, usually settled every 8 hours.
The rule is simple:
- When the futures price trades ABOVE spot, too many traders are crowded on the long side. The funding rate turns positive, and longs pay shorts.
- When the futures price trades BELOW spot, shorts are the crowded side. The rate turns negative, and shorts pay longs.
- When both prices are roughly in line, the rate sits near zero.
Important detail: this payment goes from trader to trader. The exchange takes nothing. It simply makes the crowded side pay the other side, nudging prices back in line.
A simple example
Say you open a $10,000 long on $BTC with a funding rate of 0.01% per interval. You pay 0.01% × $10,000 = $1 every 8 hours — tiny. But in a frenzied bull market, funding on $ETH or $BTC can spike to 0.1% per interval. That's $10 every 8 hours, roughly $30 a day, just for keeping the position open. Run that for a month and funding alone costs you around $900 — even if the price never moves.
Why beginners should care
1. Funding is a hidden holding cost. Fees are charged when you open and close, but funding ticks away while you sleep, quietly draining your margin and pushing you closer to liquidation.
2. It reveals crowd sentiment. Extremely positive funding means longs are overcrowded and paying a premium — historically a sign the market is overheated. Deeply negative funding means the opposite.
3. Sometimes you can be paid. If you're long while funding is negative, you collect small payments from shorts the whole time you hold.
Check the funding rate before you open any futures position, and factor it into your trade plan like any other fee.
Not financial advice. DYOR.
Funding Rates Explained: The Hidden Cost Every Futures Beginner Must Know
Ever wondered why crypto perpetual futures never drift far from the real spot price? The answer is a quiet little payment called the funding rate — and understanding it will save you money on your very first futures trade.
What is a funding rate?
Unlike regular futures, perpetual futures never expire. So nothing naturally forces their price to match the spot market. The funding rate is the clever mechanism that does that job: a periodic payment exchanged between long and short traders, usually settled every 8 hours.
The rule is simple:
- When the futures price trades ABOVE spot, too many traders are crowded on the long side. The funding rate turns positive, and longs pay shorts.
- When the futures price trades BELOW spot, shorts are the crowded side. The rate turns negative, and shorts pay longs.
- When both prices are roughly in line, the rate sits near zero.
Important detail: this payment goes from trader to trader. The exchange takes nothing. It simply makes the crowded side pay the other side, nudging prices back in line.
A simple example
Say you open a $10,000 long on $BTC with a funding rate of 0.01% per interval. You pay 0.01% × $10,000 = $1 every 8 hours — tiny. But in a frenzied bull market, funding on $ETH or $BTC can spike to 0.1% per interval. That's $10 every 8 hours, roughly $30 a day, just for keeping the position open. Run that for a month and funding alone costs you around $900 — even if the price never moves.
Why beginners should care
1. Funding is a hidden holding cost. Fees are charged when you open and close, but funding ticks away while you sleep, quietly draining your margin and pushing you closer to liquidation.
2. It reveals crowd sentiment. Extremely positive funding means longs are overcrowded and paying a premium — historically a sign the market is overheated. Deeply negative funding means the opposite.
3. Sometimes you can be paid. If you're long while funding is negative, you collect small payments from shorts the whole time you hold.
Check the funding rate before you open any futures position, and factor it into your trade plan like any other fee.
Not financial advice. DYOR.
What is a funding rate?
Unlike regular futures, perpetual futures never expire. So nothing naturally forces their price to match the spot market. The funding rate is the clever mechanism that does that job: a periodic payment exchanged between long and short traders, usually settled every 8 hours.
The rule is simple:
- When the futures price trades ABOVE spot, too many traders are crowded on the long side. The funding rate turns positive, and longs pay shorts.
- When the futures price trades BELOW spot, shorts are the crowded side. The rate turns negative, and shorts pay longs.
- When both prices are roughly in line, the rate sits near zero.
Important detail: this payment goes from trader to trader. The exchange takes nothing. It simply makes the crowded side pay the other side, nudging prices back in line.
A simple example
Say you open a $10,000 long on $BTC with a funding rate of 0.01% per interval. You pay 0.01% × $10,000 = $1 every 8 hours — tiny. But in a frenzied bull market, funding on $ETH or $BTC can spike to 0.1% per interval. That's $10 every 8 hours, roughly $30 a day, just for keeping the position open. Run that for a month and funding alone costs you around $900 — even if the price never moves.
Why beginners should care
1. Funding is a hidden holding cost. Fees are charged when you open and close, but funding ticks away while you sleep, quietly draining your margin and pushing you closer to liquidation.
2. It reveals crowd sentiment. Extremely positive funding means longs are overcrowded and paying a premium — historically a sign the market is overheated. Deeply negative funding means the opposite.
3. Sometimes you can be paid. If you're long while funding is negative, you collect small payments from shorts the whole time you hold.
Check the funding rate before you open any futures position, and factor it into your trade plan like any other fee.
Not financial advice. DYOR.
67
VanEck's BNB ETF Drew 7M in One Day as 1inch Lists 77 Tokenized Stocks on BNB ChainWall Street knocked on BNB's door twice this week — and $BNB barely blinked. That disconnect is the real story.
The $97 million question
VanEck reported that its BNB ETF took in $97 million in a single session last Friday, a large figure for a fund tied to a token outside the bitcoin and ether pair. Independent flow trackers reported noticeably quieter numbers for the same session, and the gap has not been reconciled publicly. As Crypto Briefing flagged, the cause is usually timing or methodology, and until the numbers converge, $97 million is best read as the issuer's reported figure, not a settled tally.
Still, the direction matters. A nine-figure day would be a notable data point for issuers weighing products beyond $BTC and $ETH, and one outlet framed it as a possible sign of rising investor interest in altcoin ETFs. That is their interpretation, not a confirmed trend.
77 tokenized stocks land on BNB Chain
In the same stretch, swap aggregator 1inch listed 77 bStocks products on its BNB Chain deployment — a mix of tokenized US equities and ETFs. Users can now route into those products the same way they swap any other token on the chain. The reporting frames it as widening retail access to US stocks, though the measured effect on volumes or chain activity has not yet been reported.
Together, the two developments show traditional finance moving onto the chain while traditional investment money moves into the token. Yet $BNB traded at $781.35, down 1.47% over 24 hours — no surge, no sell-off.
What to watch
BNB is up 36.2% over the past 90 days, though still about 10% below where it stood a year ago. The past month has been flatter, with a 2.44% gain. The open question now is whether Friday's ETF figure holds up once both sides reconcile their numbers, and whether tokenized equities translate into sustained chain activity. Those answers will come from data, not headlines.
Not financial advice. DYOR.
VanEck's BNB ETF Drew 7M in One Day as 1inch Lists 77 Tokenized Stocks on BNB Chain
Wall Street knocked on BNB's door twice this week — and $BNB barely blinked. That disconnect is the real story.
The $97 million question
VanEck reported that its BNB ETF took in $97 million in a single session last Friday, a large figure for a fund tied to a token outside the bitcoin and ether pair. Independent flow trackers reported noticeably quieter numbers for the same session, and the gap has not been reconciled publicly. As Crypto Briefing flagged, the cause is usually timing or methodology, and until the numbers converge, $97 million is best read as the issuer's reported figure, not a settled tally.
Still, the direction matters. A nine-figure day would be a notable data point for issuers weighing products beyond $BTC and $ETH , and one outlet framed it as a possible sign of rising investor interest in altcoin ETFs. That is their interpretation, not a confirmed trend.
77 tokenized stocks land on BNB Chain
In the same stretch, swap aggregator 1inch listed 77 bStocks products on its BNB Chain deployment — a mix of tokenized US equities and ETFs. Users can now route into those products the same way they swap any other token on the chain. The reporting frames it as widening retail access to US stocks, though the measured effect on volumes or chain activity has not yet been reported.
Together, the two developments show traditional finance moving onto the chain while traditional investment money moves into the token. Yet $BNB traded at $781.35, down 1.47% over 24 hours — no surge, no sell-off.
What to watch
BNB is up 36.2% over the past 90 days, though still about 10% below where it stood a year ago. The past month has been flatter, with a 2.44% gain. The open question now is whether Friday's ETF figure holds up once both sides reconcile their numbers, and whether tokenized equities translate into sustained chain activity. Those answers will come from data, not headlines.
Not financial advice. DYOR.
The $97 million question
VanEck reported that its BNB ETF took in $97 million in a single session last Friday, a large figure for a fund tied to a token outside the bitcoin and ether pair. Independent flow trackers reported noticeably quieter numbers for the same session, and the gap has not been reconciled publicly. As Crypto Briefing flagged, the cause is usually timing or methodology, and until the numbers converge, $97 million is best read as the issuer's reported figure, not a settled tally.
Still, the direction matters. A nine-figure day would be a notable data point for issuers weighing products beyond $BTC and $ETH , and one outlet framed it as a possible sign of rising investor interest in altcoin ETFs. That is their interpretation, not a confirmed trend.
77 tokenized stocks land on BNB Chain
In the same stretch, swap aggregator 1inch listed 77 bStocks products on its BNB Chain deployment — a mix of tokenized US equities and ETFs. Users can now route into those products the same way they swap any other token on the chain. The reporting frames it as widening retail access to US stocks, though the measured effect on volumes or chain activity has not yet been reported.
Together, the two developments show traditional finance moving onto the chain while traditional investment money moves into the token. Yet $BNB traded at $781.35, down 1.47% over 24 hours — no surge, no sell-off.
What to watch
BNB is up 36.2% over the past 90 days, though still about 10% below where it stood a year ago. The past month has been flatter, with a 2.44% gain. The open question now is whether Friday's ETF figure holds up once both sides reconcile their numbers, and whether tokenized equities translate into sustained chain activity. Those answers will come from data, not headlines.
Not financial advice. DYOR.
82
Көбірек контент көру үшін кіріңіз
Binance Square платформасында әлемдік криптоқоғамдастыққа қосылыңыз
⚡️ Криптовалюта туралы ең соңғы және пайдалы ақпаратты алыңыз.
💬 Әлемдегі ең ірі криптобиржаның сеніміне ие.
👍 Расталған авторлардың нақты пікірлерін табыңыз.
Электрондық пошта/телефон нөмірі
Трендтегі тақырыптар
FedMinutesFocusOnOctoberPause
55,445 рет көрілді
785 адам талқылап жатыр
The latest Federal Reserve meeting minutes are under intense scrutiny, with the market desperately searching for any indication of a potential pause in interest rate hikes for October. This focus highlights the significant impact Fed policy has on cryptocurrency markets, as higher rates often lead to reduced liquidity and investor appetite for riskier assets like digital currencies. Traders and analysts are dissecting every word for signals that could influence market sentiment and potential price movements across major cryptocurrencies. The anticipation itself is creating volatility as participants position themselves ahead of any definitive announcement.
Disclaimer: This is not investment advice. Always do your own research.
#FedMinutesFocusOnOctoberPause $BTC $ETH
Luong Nguyen Ba
·1 лайк
·3.9k рет көрілді
BinanceLaunchesBinanceIntelligence
1M рет көрілді
6,051 адам талқылап жатыр
EvernorthDelaysNasdaqDebutToOct12
2,308 рет көрілді
118 адам талқылап жатыр