

#fibonacci
fibonacci
535,910 рет көрілді
1,059 адам талқылап жатыр
Қызу саудада
Ең соңғы

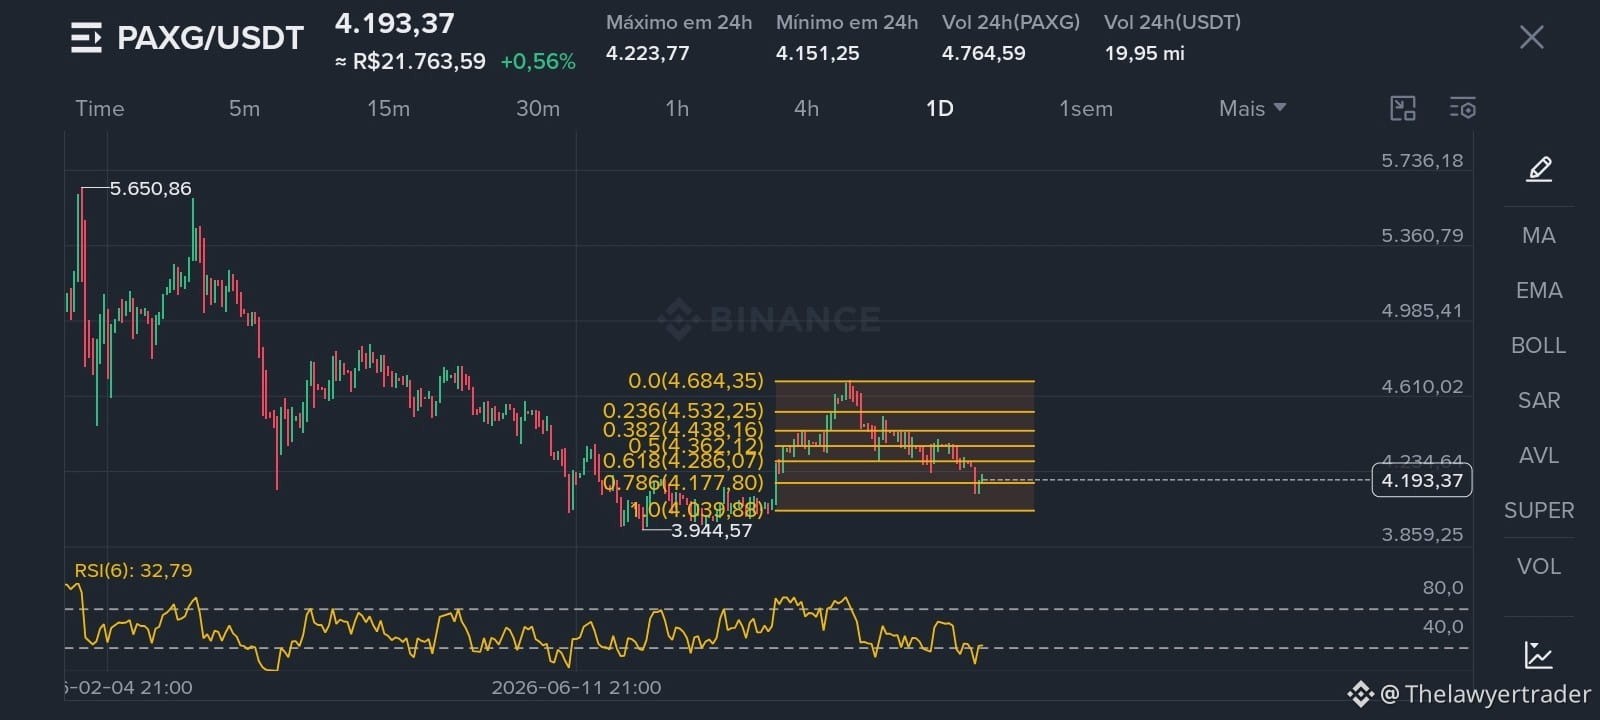
Análise PAXG/USDT — Gráfico Diário (1D)
O PAXG (ouro tokenizado) está em fase de correção após tocar a máxima recente de 4.684,35. O preço atual de 4.193,37 opera com leve alta de +0,56% no dia, buscando estabilidade dentro do range de Fibonacci aplicado.
Padrão gráfico visível: retração dentro de uma tendência de alta mais ampla. O ativo testa neste momento a zona entre os níveis de 0.618 (4.286,07) e 0.786 (4.177,80) da ferramenta de Retração de Fibonacci. A perda sustentada do nível 0.786 pode indicar retorno ao suporte da base (4.039,88 a 3.944,57).
Indicadores: o RSI (6) está em 32,79, próximo da zona de sobrevenda (abaixo de 30). Isso sugere pressão vendedora intensa no curto prazo, mas também que o ativo pode estar se aproximando de uma exaustão de venda, abrindo espaço para um possível alívio técnico.
Probabilidade: cenário de consolidação com viés neutro a levemente positivo no curto prazo, condicionado à manutenção do suporte de 0.786. A confirmação de reversão dependeria de um fechamento acima de 4.286,07 (0.618).
⚠️ Aviso: esta é uma análise técnica informativa, não uma recomendação de investimento. Criptoativos são voláteis. Faça sua própria pesquisa e gerencie seu risco.
#PAXG #Fibonacci $PAXG
Análise PAXG/USDT — Gráfico Diário (1D)
O PAXG (ouro tokenizado) está em fase de correção após tocar a máxima recente de 4.684,35. O preço atual de 4.193,37 opera com leve alta de +0,56% no dia, buscando estabilidade dentro do range de Fibonacci aplicado.
Padrão gráfico visível: retração dentro de uma tendência de alta mais ampla. O ativo testa neste momento a zona entre os níveis de 0.618 (4.286,07) e 0.786 (4.177,80) da ferramenta de Retração de Fibonacci. A perda sustentada do nível 0.786 pode indicar retorno ao suporte da base (4.039,88 a 3.944,57).
Indicadores: o RSI (6) está em 32,79, próximo da zona de sobrevenda (abaixo de 30). Isso sugere pressão vendedora intensa no curto prazo, mas também que o ativo pode estar se aproximando de uma exaustão de venda, abrindo espaço para um possível alívio técnico.
Probabilidade: cenário de consolidação com viés neutro a levemente positivo no curto prazo, condicionado à manutenção do suporte de 0.786. A confirmação de reversão dependeria de um fechamento acima de 4.286,07 (0.618).
⚠️ Aviso: esta é uma análise técnica informativa, não uma recomendação de investimento. Criptoativos são voláteis. Faça sua própria pesquisa e gerencie seu risco.
#PAXG #Fibonacci $PAXG
O PAXG (ouro tokenizado) está em fase de correção após tocar a máxima recente de 4.684,35. O preço atual de 4.193,37 opera com leve alta de +0,56% no dia, buscando estabilidade dentro do range de Fibonacci aplicado.
Padrão gráfico visível: retração dentro de uma tendência de alta mais ampla. O ativo testa neste momento a zona entre os níveis de 0.618 (4.286,07) e 0.786 (4.177,80) da ferramenta de Retração de Fibonacci. A perda sustentada do nível 0.786 pode indicar retorno ao suporte da base (4.039,88 a 3.944,57).
Indicadores: o RSI (6) está em 32,79, próximo da zona de sobrevenda (abaixo de 30). Isso sugere pressão vendedora intensa no curto prazo, mas também que o ativo pode estar se aproximando de uma exaustão de venda, abrindo espaço para um possível alívio técnico.
Probabilidade: cenário de consolidação com viés neutro a levemente positivo no curto prazo, condicionado à manutenção do suporte de 0.786. A confirmação de reversão dependeria de um fechamento acima de 4.286,07 (0.618).
⚠️ Aviso: esta é uma análise técnica informativa, não uma recomendação de investimento. Criptoativos são voláteis. Faça sua própria pesquisa e gerencie seu risco.
#PAXG #Fibonacci $PAXG
296
·
--
Мақала
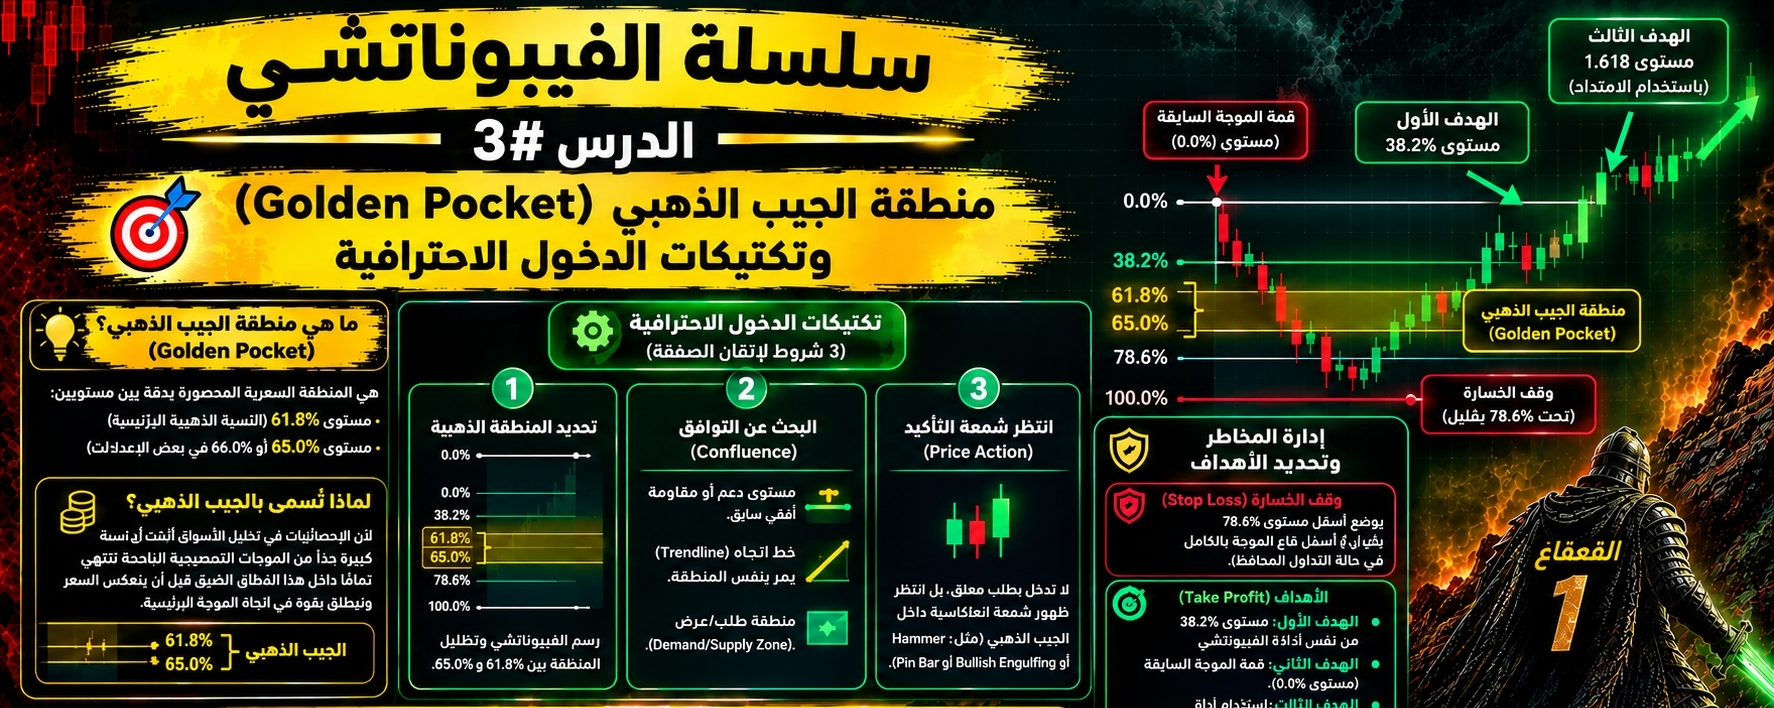
📌 سلسلة الفيبوناتشي | الدرس #3: منطقة الجيب الذهبي (Golden Pocket) وتكتيكات الدخول الاحترافيةمرحباً بكم زملائي المتداولين! بعد أن تعلمنا في الدرسين السابقين الرياضيات التي تقف خلف المستويات وطريقة الرسم الصحيحة، نصل اليوم إلى أهم منطقة تداول على الإطلاق باستخدام الفيبوناتشي: منطقة الجيب الذهبي أو ما يُعرف بـ Golden Pocket.
إذا كنت تتساءل أين يضع كبار المتداولين والمؤسسات أوامر الشراء والبيع الخاصة بهم أثناء التصحيح، فهذا الدرس هو إجابتك.
---
🎯 القاعدة #3: "لا تتداول عند أي خط مستمر.. تداول في المنطقة التي يتجمع فيها كبار الحيتان وصناع السوق"
---
💡 1️⃣ ما هي منطقة الجيب الذهبي (Golden Pocket)؟
هي المنطقة السعرية المحصورة بدقة بين مستويين:
• مستوى 61.8% (النسبة الذهبية الرئيسية)
• مستوى 65.0% (أو 66.0% في بعض الإعدادات)
لماذا تُسمى "الجيب الذهبي"؟ لأن الإحصائيات في تحليل الأسواق أثبتت أن نسبة كبيرة جداً من الموجات التصحيحية الناجحة تنتهي تماماً داخل هذا النطاق الضيق قبل أن ينعكس السعر وينطلق بقوة في اتجاه الموجة الرئيسية.
---
🛠️ 2️⃣ تكتيكات الدخول الاحترافية (3 شروط لإتقان الصفقة)
الدخول المباشر بمجرد وصول السعر إلى المنطقة هو خطأ المبتدئين. المتداول المحترف ينتظر التأكيد (Confluence) عبر 3 خطوات:
1. تحديد المنطقة الذهبية: رسم الفيبوناتشي وتظليل المنطقة بين 61.8% و 65.0%.
2. البحث عن التوافق (Confluence): تأكد من وجود عامل إضافي يدعم المنطقة، مثل:
- مستوى دعم أو مقاومة أفقي سابق.
- خط اتجاه (Trendline) يمر بنفس المنطقة.
- منطقة طلب/عرض (Demand/Supply Zone).
3. انتظر شمعة التأكيد (Price Action): لا تدخل بطلب معلق، بل انتظر ظهور شمعة انعكاسية داخل الجيب الذهبي (مثل شمعة Hammer أو Pin Bar أو Bullish Engulfing).
---
📐 3️⃣ إدارة المخاطر وتحديد الأهداف (Stop Loss & Take Profit)
• وقف الخسارة (Stop Loss): يُوضع أسفل مستوى 78.6% بقليل (أو أسفل قاع الموجة بالكامل في حالة التداول المحافظ).
• الأهداف (Take Profit):
- الهدف الأول: مستوى 38.2% من نفس أداة الفيبوناتشي.
- الهدف الثاني: قمة الموجة السابقة (مستوى 0.0%).
- الهدف الثالث: استخدام أداة Fibonacci Extension لاستهداف مستوى 1.618.
---
⚖️ خلاصة الدرس الثالث:
"منطقة الجيب الذهبي هي المغناطيس الذي يجذب السعر أثناء التصحيح؛ انتظر وصوله إليها، وابحث عن التوافق، ثم ادخل مع إشارة التأكيد."
---
💬 شاركونا في التعليقات:
هل أضفتم مستوى 65% إلى أداة الفيبوناتشي على منصتكم لتحديد الجيب الذهبي، أم تعتمدون على 61.8% فقط؟
#Fibonacci #BinanceSquare #cryptotrading #TechnicalAnalysis #القعقاع_1 @mdx1688 @Hawk_lyh68413
$BTC
{spot}(BTCUSDT)
$DEXE
{spot}(DEXEUSDT)
$ETH
{spot}(ETHUSDT)
📌 سلسلة الفيبوناتشي | الدرس #3: منطقة الجيب الذهبي (Golden Pocket) وتكتيكات الدخول الاحترافية
مرحباً بكم زملائي المتداولين! بعد أن تعلمنا في الدرسين السابقين الرياضيات التي تقف خلف المستويات وطريقة الرسم الصحيحة، نصل اليوم إلى أهم منطقة تداول على الإطلاق باستخدام الفيبوناتشي: منطقة الجيب الذهبي أو ما يُعرف بـ Golden Pocket.
إذا كنت تتساءل أين يضع كبار المتداولين والمؤسسات أوامر الشراء والبيع الخاصة بهم أثناء التصحيح، فهذا الدرس هو إجابتك.
---
🎯 القاعدة #3: "لا تتداول عند أي خط مستمر.. تداول في المنطقة التي يتجمع فيها كبار الحيتان وصناع السوق"
---
💡 1️⃣ ما هي منطقة الجيب الذهبي (Golden Pocket)؟
هي المنطقة السعرية المحصورة بدقة بين مستويين:
• مستوى 61.8% (النسبة الذهبية الرئيسية)
• مستوى 65.0% (أو 66.0% في بعض الإعدادات)
لماذا تُسمى "الجيب الذهبي"؟ لأن الإحصائيات في تحليل الأسواق أثبتت أن نسبة كبيرة جداً من الموجات التصحيحية الناجحة تنتهي تماماً داخل هذا النطاق الضيق قبل أن ينعكس السعر وينطلق بقوة في اتجاه الموجة الرئيسية.
---
🛠️ 2️⃣ تكتيكات الدخول الاحترافية (3 شروط لإتقان الصفقة)
الدخول المباشر بمجرد وصول السعر إلى المنطقة هو خطأ المبتدئين. المتداول المحترف ينتظر التأكيد (Confluence) عبر 3 خطوات:
1. تحديد المنطقة الذهبية: رسم الفيبوناتشي وتظليل المنطقة بين 61.8% و 65.0%.
2. البحث عن التوافق (Confluence): تأكد من وجود عامل إضافي يدعم المنطقة، مثل:
- مستوى دعم أو مقاومة أفقي سابق.
- خط اتجاه (Trendline) يمر بنفس المنطقة.
- منطقة طلب/عرض (Demand/Supply Zone).
3. انتظر شمعة التأكيد (Price Action): لا تدخل بطلب معلق، بل انتظر ظهور شمعة انعكاسية داخل الجيب الذهبي (مثل شمعة Hammer أو Pin Bar أو Bullish Engulfing).
---
📐 3️⃣ إدارة المخاطر وتحديد الأهداف (Stop Loss & Take Profit)
• وقف الخسارة (Stop Loss): يُوضع أسفل مستوى 78.6% بقليل (أو أسفل قاع الموجة بالكامل في حالة التداول المحافظ).
• الأهداف (Take Profit):
- الهدف الأول: مستوى 38.2% من نفس أداة الفيبوناتشي.
- الهدف الثاني: قمة الموجة السابقة (مستوى 0.0%).
- الهدف الثالث: استخدام أداة Fibonacci Extension لاستهداف مستوى 1.618.
---
⚖️ خلاصة الدرس الثالث:
"منطقة الجيب الذهبي هي المغناطيس الذي يجذب السعر أثناء التصحيح؛ انتظر وصوله إليها، وابحث عن التوافق، ثم ادخل مع إشارة التأكيد."
---
💬 شاركونا في التعليقات:
هل أضفتم مستوى 65% إلى أداة الفيبوناتشي على منصتكم لتحديد الجيب الذهبي، أم تعتمدون على 61.8% فقط؟
#Fibonacci #BinanceSquare #cryptotrading #TechnicalAnalysis #القعقاع_1 @Hawk自由哥 @HawkLinda
$BTC
$DEXE
$ETH
إذا كنت تتساءل أين يضع كبار المتداولين والمؤسسات أوامر الشراء والبيع الخاصة بهم أثناء التصحيح، فهذا الدرس هو إجابتك.
---
🎯 القاعدة #3: "لا تتداول عند أي خط مستمر.. تداول في المنطقة التي يتجمع فيها كبار الحيتان وصناع السوق"
---
💡 1️⃣ ما هي منطقة الجيب الذهبي (Golden Pocket)؟
هي المنطقة السعرية المحصورة بدقة بين مستويين:
• مستوى 61.8% (النسبة الذهبية الرئيسية)
• مستوى 65.0% (أو 66.0% في بعض الإعدادات)
لماذا تُسمى "الجيب الذهبي"؟ لأن الإحصائيات في تحليل الأسواق أثبتت أن نسبة كبيرة جداً من الموجات التصحيحية الناجحة تنتهي تماماً داخل هذا النطاق الضيق قبل أن ينعكس السعر وينطلق بقوة في اتجاه الموجة الرئيسية.
---
🛠️ 2️⃣ تكتيكات الدخول الاحترافية (3 شروط لإتقان الصفقة)
الدخول المباشر بمجرد وصول السعر إلى المنطقة هو خطأ المبتدئين. المتداول المحترف ينتظر التأكيد (Confluence) عبر 3 خطوات:
1. تحديد المنطقة الذهبية: رسم الفيبوناتشي وتظليل المنطقة بين 61.8% و 65.0%.
2. البحث عن التوافق (Confluence): تأكد من وجود عامل إضافي يدعم المنطقة، مثل:
- مستوى دعم أو مقاومة أفقي سابق.
- خط اتجاه (Trendline) يمر بنفس المنطقة.
- منطقة طلب/عرض (Demand/Supply Zone).
3. انتظر شمعة التأكيد (Price Action): لا تدخل بطلب معلق، بل انتظر ظهور شمعة انعكاسية داخل الجيب الذهبي (مثل شمعة Hammer أو Pin Bar أو Bullish Engulfing).
---
📐 3️⃣ إدارة المخاطر وتحديد الأهداف (Stop Loss & Take Profit)
• وقف الخسارة (Stop Loss): يُوضع أسفل مستوى 78.6% بقليل (أو أسفل قاع الموجة بالكامل في حالة التداول المحافظ).
• الأهداف (Take Profit):
- الهدف الأول: مستوى 38.2% من نفس أداة الفيبوناتشي.
- الهدف الثاني: قمة الموجة السابقة (مستوى 0.0%).
- الهدف الثالث: استخدام أداة Fibonacci Extension لاستهداف مستوى 1.618.
---
⚖️ خلاصة الدرس الثالث:
"منطقة الجيب الذهبي هي المغناطيس الذي يجذب السعر أثناء التصحيح؛ انتظر وصوله إليها، وابحث عن التوافق، ثم ادخل مع إشارة التأكيد."
---
💬 شاركونا في التعليقات:
هل أضفتم مستوى 65% إلى أداة الفيبوناتشي على منصتكم لتحديد الجيب الذهبي، أم تعتمدون على 61.8% فقط؟
#Fibonacci #BinanceSquare #cryptotrading #TechnicalAnalysis #القعقاع_1 @Hawk自由哥 @HawkLinda
$BTC
$DEXE
$ETH
1
358

Picture this: every time $BTC prints a new all-time high, the extension above the old peak has been smaller than the cycle before.
Most traders know the pain of not knowing when to exit. You either sell too early and miss the rest of the move or hold on too long and watch profits evaporate.
The charts show a consistent pattern across cycles. The best sell zone for $BTC has formed between two different .618 Fibonacci extensions. Last time it topped between the 2.618 and 1.618 extensions, landing much closer to the 1.618.
This cycle looks similar. The main difference is the bear market bottom was about 20 to 30 percent shallower than before. That means significantly less upside is required to reach the 1.618 level.
Compare it to the last run when $ETH stretched further alongside $BTC. The lesson is that these Fibonacci maps have held up, and a higher low could bring the top in earlier than many expect.
Where do you think this cycle peaks?
#Bitcoin #Fibonacci #CryptoTrading
Picture this: every time $BTC prints a new all-time high, the extension above the old peak has been smaller than the cycle before.
Most traders know the pain of not knowing when to exit. You either sell too early and miss the rest of the move or hold on too long and watch profits evaporate.
The charts show a consistent pattern across cycles. The best sell zone for $BTC has formed between two different .618 Fibonacci extensions. Last time it topped between the 2.618 and 1.618 extensions, landing much closer to the 1.618.
This cycle looks similar. The main difference is the bear market bottom was about 20 to 30 percent shallower than before. That means significantly less upside is required to reach the 1.618 level.
Compare it to the last run when $ETH stretched further alongside $BTC . The lesson is that these Fibonacci maps have held up, and a higher low could bring the top in earlier than many expect.
Where do you think this cycle peaks?
#Bitcoin #Fibonacci #CryptoTrading
Most traders know the pain of not knowing when to exit. You either sell too early and miss the rest of the move or hold on too long and watch profits evaporate.
The charts show a consistent pattern across cycles. The best sell zone for $BTC has formed between two different .618 Fibonacci extensions. Last time it topped between the 2.618 and 1.618 extensions, landing much closer to the 1.618.
This cycle looks similar. The main difference is the bear market bottom was about 20 to 30 percent shallower than before. That means significantly less upside is required to reach the 1.618 level.
Compare it to the last run when $ETH stretched further alongside $BTC . The lesson is that these Fibonacci maps have held up, and a higher low could bring the top in earlier than many expect.
Where do you think this cycle peaks?
#Bitcoin #Fibonacci #CryptoTrading
11
·
--
Мақала
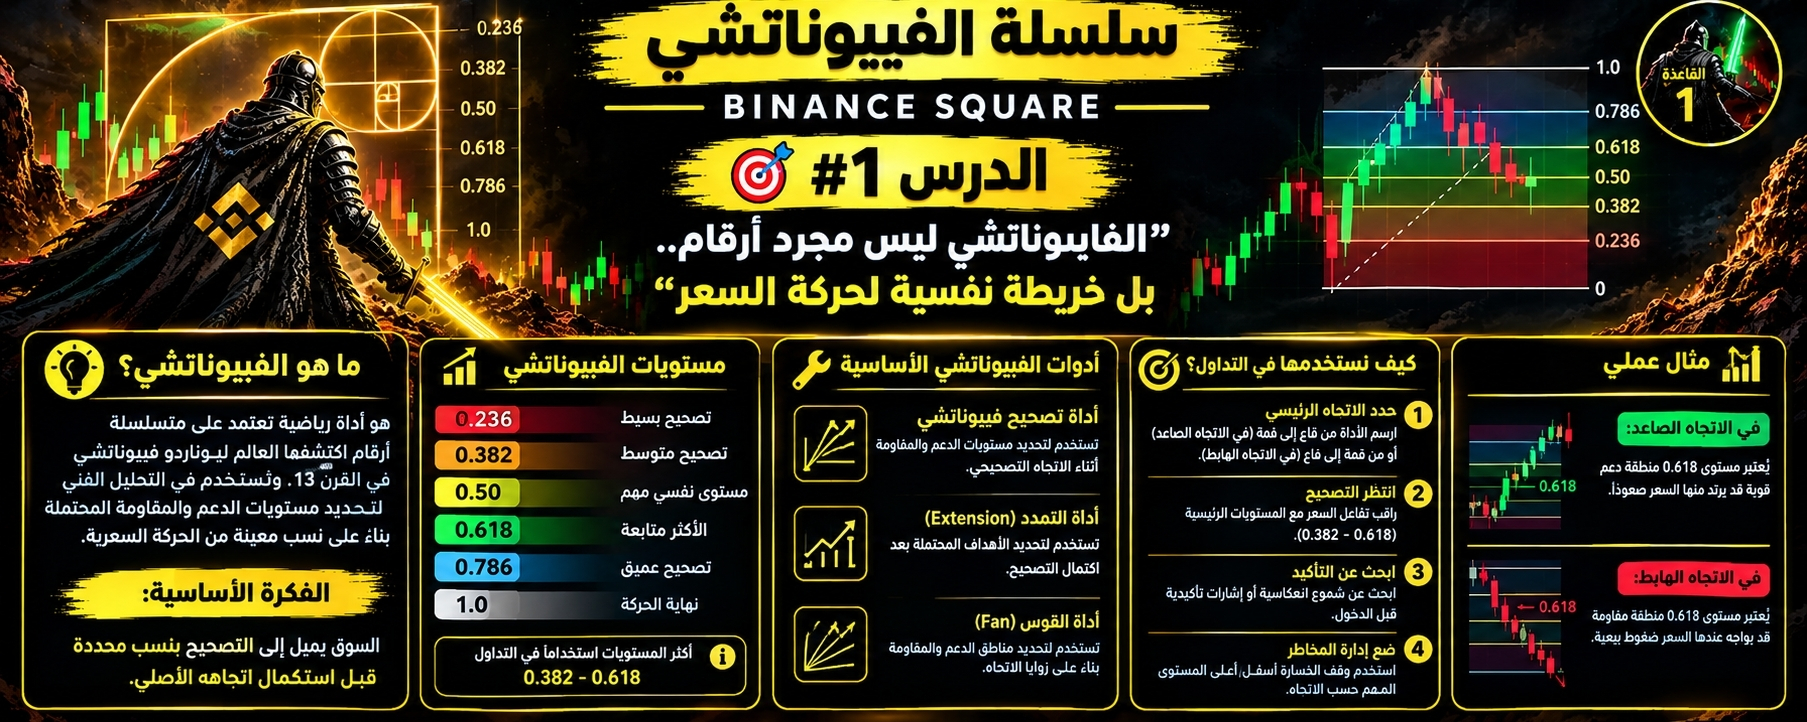
📌 سلسلة الفيبوناتشي | الدرس #1: مرحباً بكم زملائي المتداولين! أهلاً بكم في أولى محطات سلسلتنا الجديدة. لتتداول بأداة الفيبوناتشي كالمحترفين، لا يكفي أن تسحب الأداة على الشارت فقط، بل يجب أن تفهم من أين جاءت هذه الأرقام، وما السحر الرياضي والقانون الطبيعي الذي يكمن خلفها.
---
🎯 القاعدة #1: "الفيبوناتشي ليس أداة اخترعها المتداولون.. بل قانون طبيعي اكتشفه عالم رياضيات واكتشفنا أنه يحكم أسواق المال"
---
💡 1️⃣ من هو فيبوناتشي؟ وما هي السلسلة الشهيرة؟
يرجع أصل الأداة إلى عالم الرياضيات الإيطالي ليوناردو بوناتشي (الملقب بـ فيبوناتشي) في القرن الثالث عشر.
طرح فيبوناتشي متتالية عددية بسيطة جداً، تبدأ بالرقم 0 و1، ثم يقوم كل رقم على جمع الرقمين السابقين له:
0, 1, 1, 2, 3, 5, 8, 13, 21, 34, 55, 89, 144, 233, 377, 610, ...
• 0 + 1 = 1
• 1 + 1 = 2
• 1 + 2 = 3
• 2 + 3 = 5
• 5 + 8 = 13 ... وهكذا إلى ما لا نهاية.
---
🧬 2️⃣ كيف صُنعت مستويات التداول؟ (السر المالي السحري)
المستويات التي نراها على الشارت ليست الأرقام نفسها (8, 13, 21)، بل هي نسب القسمة بين أرقام هذه المتتالية! هنا يكمن السر الرياضي:
• النسبة الذهبية 61.8% (Golden Ratio):
إذا قسمت أي رقم في المتتالية على الرقم الذي يليه مباشرة (ابتداءً من الأرقام الكبيرة):
34 ÷ 55 = 0.618
89 ÷ 144 = 0.618
144 ÷ 233 = 0.618
هذه النسبة تُسمى بـ النسبة الذهبية Phi وتظهر في هندسة المجرات، قواقع المحار، توزيع أوراق الشجر، وجينات جسم الإنسان!
• مستوى 38.2%:
إذا قسمت أي رقم في المتتالية على الرقم الذي يبعد عنه بمقدار منزلتين إلى الأمام:
34 ÷ 89 = 0.382
55 ÷ 144 = 0.382
• مستوى 23.6%:
إذا قسمت أي رقم في المتتالية على الرقم الذي يبعد عنه بمقدار ثلاث منازل إلى الأمام:
34 ÷ 144 = 0.236
55 ÷ 233 = 0.236
• ماذا عن مستوى 50.0% و 78.6%؟
- 50.0%: ليس نسبة فيبوناتشي رياضية، ولكنه يُدرج كعنصر نفسي محوري يمثل منتصف المسافة (Dow Theory).
- 78.6%: هو الجذر التربيعي للنسبة الذهبية (0.786).
---
🔍 3️⃣ ماذا تعني هذه الأرقام في التداول وعلى الشارت؟
في التداول، تعبر أرقام الفيبوناتشي عن النفسية الجماعية للأسواق.
السوق يتحرك دائماً في موجات: موجة دافعة (Impulse) أعقبها موجة تصحيحية (Retracement).
تلك المستويات تعني نسبة التراجع أو "الارتداد" من الموجة السابقة:
• مستوى 38.2%: تعني أن السعر تراجع واسترجع 38.2% فقط من مسافة الحركة السابقة.
• مستوى 61.8%: تعني أن السعر استرجع 61.8% من الموجة السابقة، وهي المنطقة التي تعبر عن أقصى توازن بين العرض والطلب وقيمة سعرية عادلة جداً لدخول كبار المتداولين.
---
⚖️ خلاصة الدرس الأول:
"مستويات الفيبوناتشي ليست مجرد خطوط وهمية؛ بل هي انعكاس للنظام الطبيعي والنسبة الذهبية التي يُحكم بها السلوك البشري والنفسي داخل الشارت."
---
💬 شاركونا في التعليقات:
هل كنت تعلم أن نسبة 61.8% ناتجة عن قسمة أرقام السلسلة على بعضها البعض، أم كنت تعتبرها مجرد أرقام افتراضية على المنصة؟
#BinanceSquare #cryptotrading #Fibonacci #القعقاع #القعقاع_1
$ETH
{spot}(ETHUSDT)
$BTC
{spot}(BTCUSDT)
$HBAR
{spot}(HBARUSDT)
📌 سلسلة الفيبوناتشي | الدرس #1:
مرحباً بكم زملائي المتداولين! أهلاً بكم في أولى محطات سلسلتنا الجديدة. لتتداول بأداة الفيبوناتشي كالمحترفين، لا يكفي أن تسحب الأداة على الشارت فقط، بل يجب أن تفهم من أين جاءت هذه الأرقام، وما السحر الرياضي والقانون الطبيعي الذي يكمن خلفها.
---
🎯 القاعدة #1: "الفيبوناتشي ليس أداة اخترعها المتداولون.. بل قانون طبيعي اكتشفه عالم رياضيات واكتشفنا أنه يحكم أسواق المال"
---
💡 1️⃣ من هو فيبوناتشي؟ وما هي السلسلة الشهيرة؟
يرجع أصل الأداة إلى عالم الرياضيات الإيطالي ليوناردو بوناتشي (الملقب بـ فيبوناتشي) في القرن الثالث عشر.
طرح فيبوناتشي متتالية عددية بسيطة جداً، تبدأ بالرقم 0 و1، ثم يقوم كل رقم على جمع الرقمين السابقين له:
0, 1, 1, 2, 3, 5, 8, 13, 21, 34, 55, 89, 144, 233, 377, 610, ...
• 0 + 1 = 1
• 1 + 1 = 2
• 1 + 2 = 3
• 2 + 3 = 5
• 5 + 8 = 13 ... وهكذا إلى ما لا نهاية.
---
🧬 2️⃣ كيف صُنعت مستويات التداول؟ (السر المالي السحري)
المستويات التي نراها على الشارت ليست الأرقام نفسها (8, 13, 21)، بل هي نسب القسمة بين أرقام هذه المتتالية! هنا يكمن السر الرياضي:
• النسبة الذهبية 61.8% (Golden Ratio):
إذا قسمت أي رقم في المتتالية على الرقم الذي يليه مباشرة (ابتداءً من الأرقام الكبيرة):
34 ÷ 55 = 0.618
89 ÷ 144 = 0.618
144 ÷ 233 = 0.618
هذه النسبة تُسمى بـ النسبة الذهبية Phi وتظهر في هندسة المجرات، قواقع المحار، توزيع أوراق الشجر، وجينات جسم الإنسان!
• مستوى 38.2%:
إذا قسمت أي رقم في المتتالية على الرقم الذي يبعد عنه بمقدار منزلتين إلى الأمام:
34 ÷ 89 = 0.382
55 ÷ 144 = 0.382
• مستوى 23.6%:
إذا قسمت أي رقم في المتتالية على الرقم الذي يبعد عنه بمقدار ثلاث منازل إلى الأمام:
34 ÷ 144 = 0.236
55 ÷ 233 = 0.236
• ماذا عن مستوى 50.0% و 78.6%؟
- 50.0%: ليس نسبة فيبوناتشي رياضية، ولكنه يُدرج كعنصر نفسي محوري يمثل منتصف المسافة (Dow Theory).
- 78.6%: هو الجذر التربيعي للنسبة الذهبية (0.786).
---
🔍 3️⃣ ماذا تعني هذه الأرقام في التداول وعلى الشارت؟
في التداول، تعبر أرقام الفيبوناتشي عن النفسية الجماعية للأسواق.
السوق يتحرك دائماً في موجات: موجة دافعة (Impulse) أعقبها موجة تصحيحية (Retracement).
تلك المستويات تعني نسبة التراجع أو "الارتداد" من الموجة السابقة:
• مستوى 38.2%: تعني أن السعر تراجع واسترجع 38.2% فقط من مسافة الحركة السابقة.
• مستوى 61.8%: تعني أن السعر استرجع 61.8% من الموجة السابقة، وهي المنطقة التي تعبر عن أقصى توازن بين العرض والطلب وقيمة سعرية عادلة جداً لدخول كبار المتداولين.
---
⚖️ خلاصة الدرس الأول:
"مستويات الفيبوناتشي ليست مجرد خطوط وهمية؛ بل هي انعكاس للنظام الطبيعي والنسبة الذهبية التي يُحكم بها السلوك البشري والنفسي داخل الشارت."
---
💬 شاركونا في التعليقات:
هل كنت تعلم أن نسبة 61.8% ناتجة عن قسمة أرقام السلسلة على بعضها البعض، أم كنت تعتبرها مجرد أرقام افتراضية على المنصة؟
#BinanceSquare #cryptotrading #Fibonacci #القعقاع #القعقاع_1
$ETH
$BTC
$HBAR
---
🎯 القاعدة #1: "الفيبوناتشي ليس أداة اخترعها المتداولون.. بل قانون طبيعي اكتشفه عالم رياضيات واكتشفنا أنه يحكم أسواق المال"
---
💡 1️⃣ من هو فيبوناتشي؟ وما هي السلسلة الشهيرة؟
يرجع أصل الأداة إلى عالم الرياضيات الإيطالي ليوناردو بوناتشي (الملقب بـ فيبوناتشي) في القرن الثالث عشر.
طرح فيبوناتشي متتالية عددية بسيطة جداً، تبدأ بالرقم 0 و1، ثم يقوم كل رقم على جمع الرقمين السابقين له:
0, 1, 1, 2, 3, 5, 8, 13, 21, 34, 55, 89, 144, 233, 377, 610, ...
• 0 + 1 = 1
• 1 + 1 = 2
• 1 + 2 = 3
• 2 + 3 = 5
• 5 + 8 = 13 ... وهكذا إلى ما لا نهاية.
---
🧬 2️⃣ كيف صُنعت مستويات التداول؟ (السر المالي السحري)
المستويات التي نراها على الشارت ليست الأرقام نفسها (8, 13, 21)، بل هي نسب القسمة بين أرقام هذه المتتالية! هنا يكمن السر الرياضي:
• النسبة الذهبية 61.8% (Golden Ratio):
إذا قسمت أي رقم في المتتالية على الرقم الذي يليه مباشرة (ابتداءً من الأرقام الكبيرة):
34 ÷ 55 = 0.618
89 ÷ 144 = 0.618
144 ÷ 233 = 0.618
هذه النسبة تُسمى بـ النسبة الذهبية Phi وتظهر في هندسة المجرات، قواقع المحار، توزيع أوراق الشجر، وجينات جسم الإنسان!
• مستوى 38.2%:
إذا قسمت أي رقم في المتتالية على الرقم الذي يبعد عنه بمقدار منزلتين إلى الأمام:
34 ÷ 89 = 0.382
55 ÷ 144 = 0.382
• مستوى 23.6%:
إذا قسمت أي رقم في المتتالية على الرقم الذي يبعد عنه بمقدار ثلاث منازل إلى الأمام:
34 ÷ 144 = 0.236
55 ÷ 233 = 0.236
• ماذا عن مستوى 50.0% و 78.6%؟
- 50.0%: ليس نسبة فيبوناتشي رياضية، ولكنه يُدرج كعنصر نفسي محوري يمثل منتصف المسافة (Dow Theory).
- 78.6%: هو الجذر التربيعي للنسبة الذهبية (0.786).
---
🔍 3️⃣ ماذا تعني هذه الأرقام في التداول وعلى الشارت؟
في التداول، تعبر أرقام الفيبوناتشي عن النفسية الجماعية للأسواق.
السوق يتحرك دائماً في موجات: موجة دافعة (Impulse) أعقبها موجة تصحيحية (Retracement).
تلك المستويات تعني نسبة التراجع أو "الارتداد" من الموجة السابقة:
• مستوى 38.2%: تعني أن السعر تراجع واسترجع 38.2% فقط من مسافة الحركة السابقة.
• مستوى 61.8%: تعني أن السعر استرجع 61.8% من الموجة السابقة، وهي المنطقة التي تعبر عن أقصى توازن بين العرض والطلب وقيمة سعرية عادلة جداً لدخول كبار المتداولين.
---
⚖️ خلاصة الدرس الأول:
"مستويات الفيبوناتشي ليست مجرد خطوط وهمية؛ بل هي انعكاس للنظام الطبيعي والنسبة الذهبية التي يُحكم بها السلوك البشري والنفسي داخل الشارت."
---
💬 شاركونا في التعليقات:
هل كنت تعلم أن نسبة 61.8% ناتجة عن قسمة أرقام السلسلة على بعضها البعض، أم كنت تعتبرها مجرد أرقام افتراضية على المنصة؟
#BinanceSquare #cryptotrading #Fibonacci #القعقاع #القعقاع_1
$ETH
$BTC
$HBAR
T2 to the moon:
مهتم
2
2
1.2k

🚀 $ADA BREAKING ABOVE $0.25 – TARGET $0.315 ON THE RISE! 📈
Entry: $0.255 ⚡
Target: $0.315 🚀
Stop Loss: $0.230862 ⚠️
📊 Cardano is cruising inside a rising yellow channel that launched from the June low, and the latest 4‑day candle sits comfortably above the 23.6% fib at $0.230862. Wave (c) appears to be unfolding, giving smart‑money a clear path toward the $0.315 horizon, which aligns with the 38.2% fib retracement. 🌊 If buyers hold the $0.230 area, the recovery gains momentum; a slip below could force a retest of deeper fib zones. 💡
🤔 Will the $0.230 level hold its ground and let ADA sprint to $0.315, or are we in for a short‑term pullback? 👇
⚠️ Not financial advice. Always manage your risk. 🛡️
🏷️ #ADA #LongSetup #Fibonacci #Crypto
🔥 💎
🚀 $ADA BREAKING ABOVE $0.25 – TARGET $0.315 ON THE RISE! 📈
Entry: $0.255 ⚡
Target: $0.315 🚀
Stop Loss: $0.230862 ⚠️
📊 Cardano is cruising inside a rising yellow channel that launched from the June low, and the latest 4‑day candle sits comfortably above the 23.6% fib at $0.230862. Wave (c) appears to be unfolding, giving smart‑money a clear path toward the $0.315 horizon, which aligns with the 38.2% fib retracement. 🌊 If buyers hold the $0.230 area, the recovery gains momentum; a slip below could force a retest of deeper fib zones. 💡
🤔 Will the $0.230 level hold its ground and let ADA sprint to $0.315, or are we in for a short‑term pullback? 👇
⚠️ Not financial advice. Always manage your risk. 🛡️
🏷️ #ADA #LongSetup #Fibonacci #Crypto
🔥 💎
Entry: $0.255 ⚡
Target: $0.315 🚀
Stop Loss: $0.230862 ⚠️
📊 Cardano is cruising inside a rising yellow channel that launched from the June low, and the latest 4‑day candle sits comfortably above the 23.6% fib at $0.230862. Wave (c) appears to be unfolding, giving smart‑money a clear path toward the $0.315 horizon, which aligns with the 38.2% fib retracement. 🌊 If buyers hold the $0.230 area, the recovery gains momentum; a slip below could force a retest of deeper fib zones. 💡
🤔 Will the $0.230 level hold its ground and let ADA sprint to $0.315, or are we in for a short‑term pullback? 👇
⚠️ Not financial advice. Always manage your risk. 🛡️
🏷️ #ADA #LongSetup #Fibonacci #Crypto
🔥 💎
65

🚨 $ADA REENTERS $0.25 AND CHASES $0.315 TARGET! 📈
Target: 0.315 🚀
📊 ADA is riding the upward‑sloping yellow channel that originated near the June low of $0.13, now perched just above $0.255 on the 4‑day chart. The channel aligns with wave (c) on the analyst’s count, and the 38.2% Fibonacci anchor at $0.315422 gives the next bullish milestone a solid structural footing. 🌊 Smart‑money liquidity pools tend to respect these fib zones, turning them into springboards for the next surge.
📌 The nearer 23.6% Fibonacci level at $0.230862 remains the litmus test; holding above it confirms the recovery’s strength, while a dip below would cast doubt on the $0.315 climb. ⚡ How will ADA’s price react if it tests that support on the next candle? 💬
⚠️ Not financial advice. Always manage your risk. 🛡️
🏷️ #ADA #LongSetup #Fibonacci #Crypto
🔥 💎
🚨 $ADA REENTERS $0.25 AND CHASES $0.315 TARGET! 📈
Target: 0.315 🚀
📊 ADA is riding the upward‑sloping yellow channel that originated near the June low of $0.13, now perched just above $0.255 on the 4‑day chart. The channel aligns with wave (c) on the analyst’s count, and the 38.2% Fibonacci anchor at $0.315422 gives the next bullish milestone a solid structural footing. 🌊 Smart‑money liquidity pools tend to respect these fib zones, turning them into springboards for the next surge.
📌 The nearer 23.6% Fibonacci level at $0.230862 remains the litmus test; holding above it confirms the recovery’s strength, while a dip below would cast doubt on the $0.315 climb. ⚡ How will ADA’s price react if it tests that support on the next candle? 💬
⚠️ Not financial advice. Always manage your risk. 🛡️
🏷️ #ADA #LongSetup #Fibonacci #Crypto
🔥 💎
Target: 0.315 🚀
📊 ADA is riding the upward‑sloping yellow channel that originated near the June low of $0.13, now perched just above $0.255 on the 4‑day chart. The channel aligns with wave (c) on the analyst’s count, and the 38.2% Fibonacci anchor at $0.315422 gives the next bullish milestone a solid structural footing. 🌊 Smart‑money liquidity pools tend to respect these fib zones, turning them into springboards for the next surge.
📌 The nearer 23.6% Fibonacci level at $0.230862 remains the litmus test; holding above it confirms the recovery’s strength, while a dip below would cast doubt on the $0.315 climb. ⚡ How will ADA’s price react if it tests that support on the next candle? 💬
⚠️ Not financial advice. Always manage your risk. 🛡️
🏷️ #ADA #LongSetup #Fibonacci #Crypto
🔥 💎
45

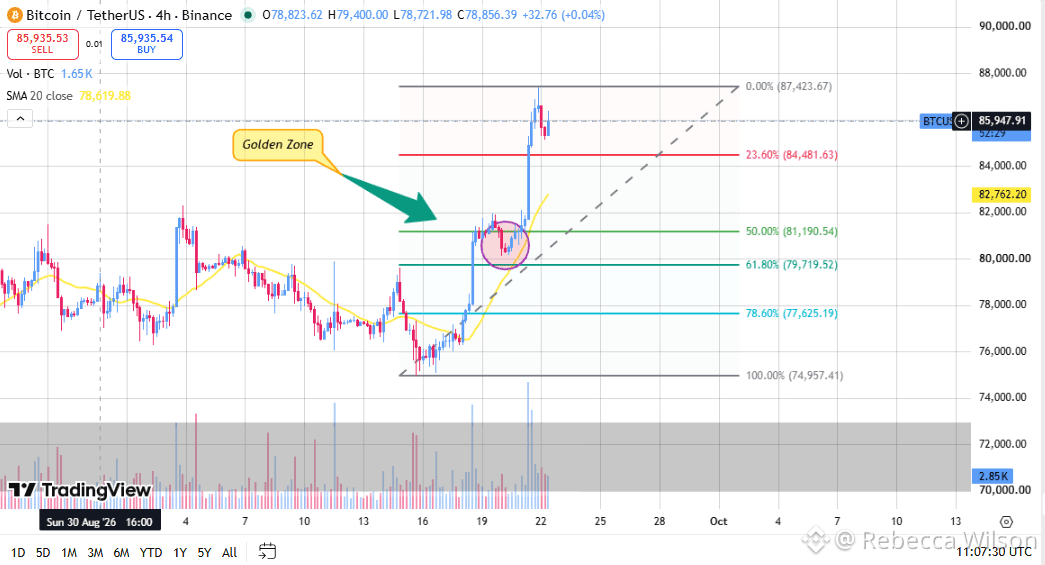
📐 Fibonacci Retracement: Stop Using It Wrong
“Fibonacci isn’t a magic prediction tool.”
If you’re buying simply because BTC touches 0.618, you’re using Fibonacci wrong.
Here’s how traders actually use the key levels 👇
🔹 0.382 — Shallow pullback
Strong trend may hold here. Look for momentum + volume confirmation.
🔹 0.500 — Mid-range
A psychological zone where price can pause or reverse. Wait for structure confirmation.
🔹 0.618 — Golden zone
A deeper retracement watched by many traders. But touching 0.618 ≠ automatic buy.
🔥 Confirmation matters more than the Fibonacci level.
Before entering, look for:
✅ Support/resistance reaction
✅ Volume increase
✅ Bullish/bearish candle confirmation
✅ Market structure holding
✅ Clear invalidation level
$BTC $SOL $SUI
{future}(SUIUSDT)
{future}(SOLUSDT)
{future}(BTCUSDT)
Fibonacci gives you a ZONE — price action gives you the SIGNAL.
Which level do you trust most: 0.382, 0.5 or 0.618? 👇
#Fibonacci #TechnicalAnalysis #BinanceSquare #EducationalContent #trading
📐 Fibonacci Retracement: Stop Using It Wrong
“Fibonacci isn’t a magic prediction tool.”
If you’re buying simply because BTC touches 0.618, you’re using Fibonacci wrong.
Here’s how traders actually use the key levels 👇
🔹 0.382 — Shallow pullback
Strong trend may hold here. Look for momentum + volume confirmation.
🔹 0.500 — Mid-range
A psychological zone where price can pause or reverse. Wait for structure confirmation.
🔹 0.618 — Golden zone
A deeper retracement watched by many traders. But touching 0.618 ≠ automatic buy.
🔥 Confirmation matters more than the Fibonacci level.
Before entering, look for:
✅ Support/resistance reaction
✅ Volume increase
✅ Bullish/bearish candle confirmation
✅ Market structure holding
✅ Clear invalidation level
$BTC $SOL $SUI
Fibonacci gives you a ZONE — price action gives you the SIGNAL.
Which level do you trust most: 0.382, 0.5 or 0.618? 👇
#Fibonacci #TechnicalAnalysis #BinanceSquare #EducationalContent #trading
“Fibonacci isn’t a magic prediction tool.”
If you’re buying simply because BTC touches 0.618, you’re using Fibonacci wrong.
Here’s how traders actually use the key levels 👇
🔹 0.382 — Shallow pullback
Strong trend may hold here. Look for momentum + volume confirmation.
🔹 0.500 — Mid-range
A psychological zone where price can pause or reverse. Wait for structure confirmation.
🔹 0.618 — Golden zone
A deeper retracement watched by many traders. But touching 0.618 ≠ automatic buy.
🔥 Confirmation matters more than the Fibonacci level.
Before entering, look for:
✅ Support/resistance reaction
✅ Volume increase
✅ Bullish/bearish candle confirmation
✅ Market structure holding
✅ Clear invalidation level
$BTC $SOL $SUI
Fibonacci gives you a ZONE — price action gives you the SIGNAL.
Which level do you trust most: 0.382, 0.5 or 0.618? 👇
#Fibonacci #TechnicalAnalysis #BinanceSquare #EducationalContent #trading
4
158


·
--
Мақала
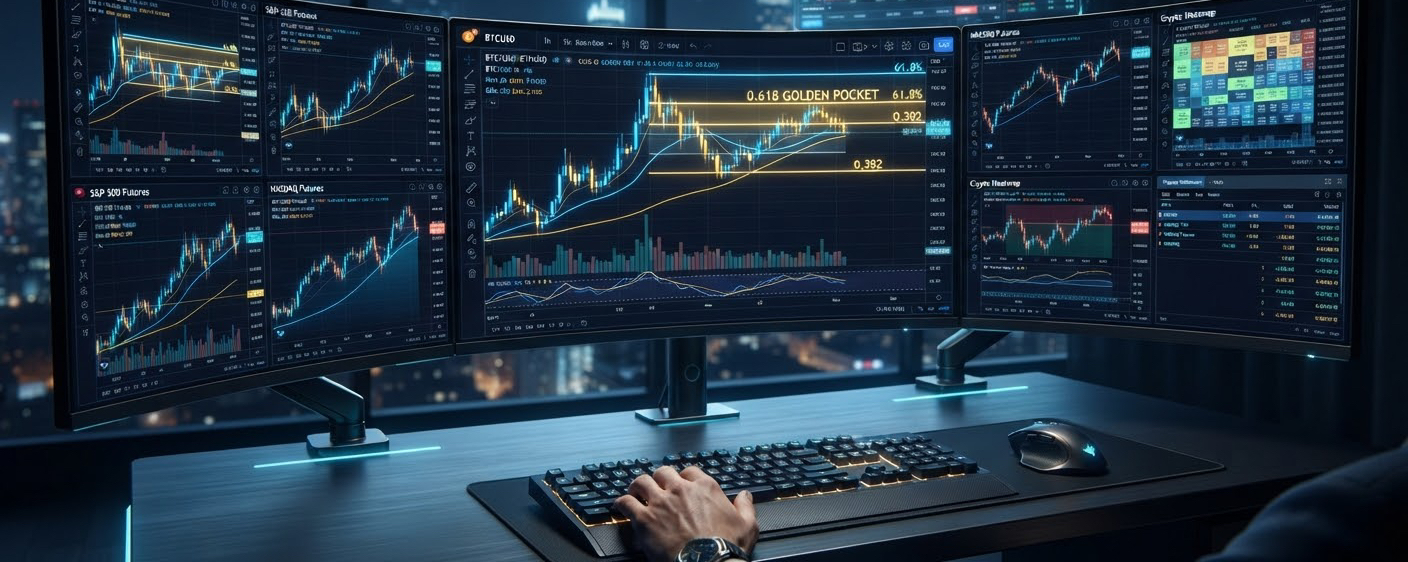
Which Futures Have Pulled Back to Key Fibonacci Levels? 🎯📉When real-time prices fluctuate and deviate from fixed targets, professional futures traders look beyond absolute dollar numbers. Instead, they focus on Fibonacci Retracement Structure Zones relative to active swing highs and lows.
Here is how major futures contracts behave around their primary Fibonacci levels during corrective waves:
1. Shallow Retracements (0.382 Fib Level)
• Behavior: Assets in high-momentum trends typically experience quick, shallow pullbacks that hold near the 38.2% mark.
• Current Context: Strong market leaders (like $BTC / USDT Futures) often respect the 0.382 Fib during brief pullbacks. This reflects aggressive spot absorption and institutional buying before deeper corrections can materialize.
2. Midpoint Equilibrium (0.500 Fib Level)
• Behavior: While not a pure Fibonacci mathematical ratio, the 50% midpoint acts as a critical balance zone between buyers and sellers.
• Current Context: Major index-correlated assets and large-cap futures frequently test the 0.500 Fib alongside Order Blocks or moving averages to establish fair value before continuing their primary trend.
3. The "Golden Pocket" (0.618 Fib Level)
• Behavior: The 61.8% level represents the most watched reversal zone in technical analysis, derived from the Golden Ratio.
• Current Context: Layer-1 and high-beta altcoin futures (such as $ETH and $SOL / USDT Futures) often retrace deeper into the 0.618 Golden Pocket. A validated bounce here offers the optimal risk-to-reward ratio for trend-continuation setups.
Execution Checklist When Prices Shift 💡
* Re-anchor Your Swings: When new local highs or lows are printed, adjust your Fibonacci grid from the most recent explicit Swing Low to Swing High.
* Look for Confluence: Never rely on a Fib line alone. Look for overlapping support/resistance zones, volume POCs, or RSI oversold conditions.
* Wait for Confirmation: Confirm the level with Market Structure Shifts (MSS) on lower timeframes rather than blindly placing limit orders.
Which Fibonacci zone are you executing from today?
#CryptoTrading #TradingStrategy #Fibonacci .
Which Futures Have Pulled Back to Key Fibonacci Levels? 🎯📉
When real-time prices fluctuate and deviate from fixed targets, professional futures traders look beyond absolute dollar numbers. Instead, they focus on Fibonacci Retracement Structure Zones relative to active swing highs and lows.
Here is how major futures contracts behave around their primary Fibonacci levels during corrective waves:
1. Shallow Retracements (0.382 Fib Level)
• Behavior: Assets in high-momentum trends typically experience quick, shallow pullbacks that hold near the 38.2% mark.
• Current Context: Strong market leaders (like $BTC / USDT Futures) often respect the 0.382 Fib during brief pullbacks. This reflects aggressive spot absorption and institutional buying before deeper corrections can materialize.
2. Midpoint Equilibrium (0.500 Fib Level)
• Behavior: While not a pure Fibonacci mathematical ratio, the 50% midpoint acts as a critical balance zone between buyers and sellers.
• Current Context: Major index-correlated assets and large-cap futures frequently test the 0.500 Fib alongside Order Blocks or moving averages to establish fair value before continuing their primary trend.
3. The "Golden Pocket" (0.618 Fib Level)
• Behavior: The 61.8% level represents the most watched reversal zone in technical analysis, derived from the Golden Ratio.
• Current Context: Layer-1 and high-beta altcoin futures (such as $ETH and $SOL / USDT Futures) often retrace deeper into the 0.618 Golden Pocket. A validated bounce here offers the optimal risk-to-reward ratio for trend-continuation setups.
Execution Checklist When Prices Shift 💡
* Re-anchor Your Swings: When new local highs or lows are printed, adjust your Fibonacci grid from the most recent explicit Swing Low to Swing High.
* Look for Confluence: Never rely on a Fib line alone. Look for overlapping support/resistance zones, volume POCs, or RSI oversold conditions.
* Wait for Confirmation: Confirm the level with Market Structure Shifts (MSS) on lower timeframes rather than blindly placing limit orders.
Which Fibonacci zone are you executing from today?
#CryptoTrading #TradingStrategy #Fibonacci .
Here is how major futures contracts behave around their primary Fibonacci levels during corrective waves:
1. Shallow Retracements (0.382 Fib Level)
• Behavior: Assets in high-momentum trends typically experience quick, shallow pullbacks that hold near the 38.2% mark.
• Current Context: Strong market leaders (like $BTC / USDT Futures) often respect the 0.382 Fib during brief pullbacks. This reflects aggressive spot absorption and institutional buying before deeper corrections can materialize.
2. Midpoint Equilibrium (0.500 Fib Level)
• Behavior: While not a pure Fibonacci mathematical ratio, the 50% midpoint acts as a critical balance zone between buyers and sellers.
• Current Context: Major index-correlated assets and large-cap futures frequently test the 0.500 Fib alongside Order Blocks or moving averages to establish fair value before continuing their primary trend.
3. The "Golden Pocket" (0.618 Fib Level)
• Behavior: The 61.8% level represents the most watched reversal zone in technical analysis, derived from the Golden Ratio.
• Current Context: Layer-1 and high-beta altcoin futures (such as $ETH and $SOL / USDT Futures) often retrace deeper into the 0.618 Golden Pocket. A validated bounce here offers the optimal risk-to-reward ratio for trend-continuation setups.
Execution Checklist When Prices Shift 💡
* Re-anchor Your Swings: When new local highs or lows are printed, adjust your Fibonacci grid from the most recent explicit Swing Low to Swing High.
* Look for Confluence: Never rely on a Fib line alone. Look for overlapping support/resistance zones, volume POCs, or RSI oversold conditions.
* Wait for Confirmation: Confirm the level with Market Structure Shifts (MSS) on lower timeframes rather than blindly placing limit orders.
Which Fibonacci zone are you executing from today?
#CryptoTrading #TradingStrategy #Fibonacci .
77
·
--
$BR
BR/USDT 🔥 | قراءة فنية
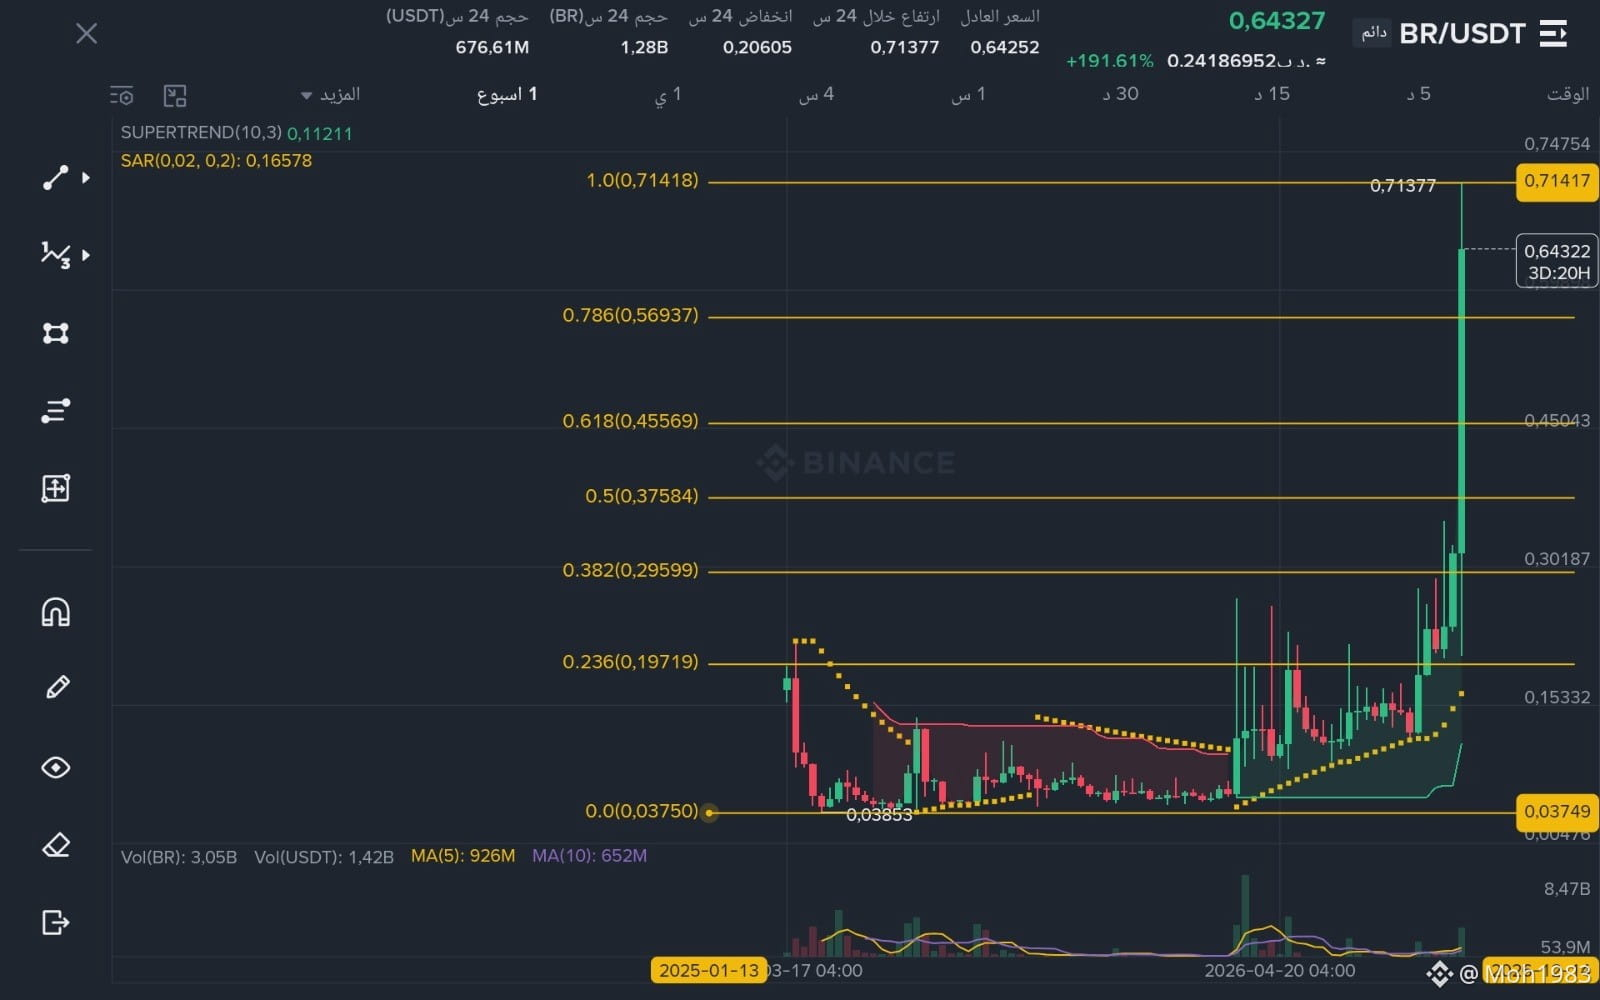
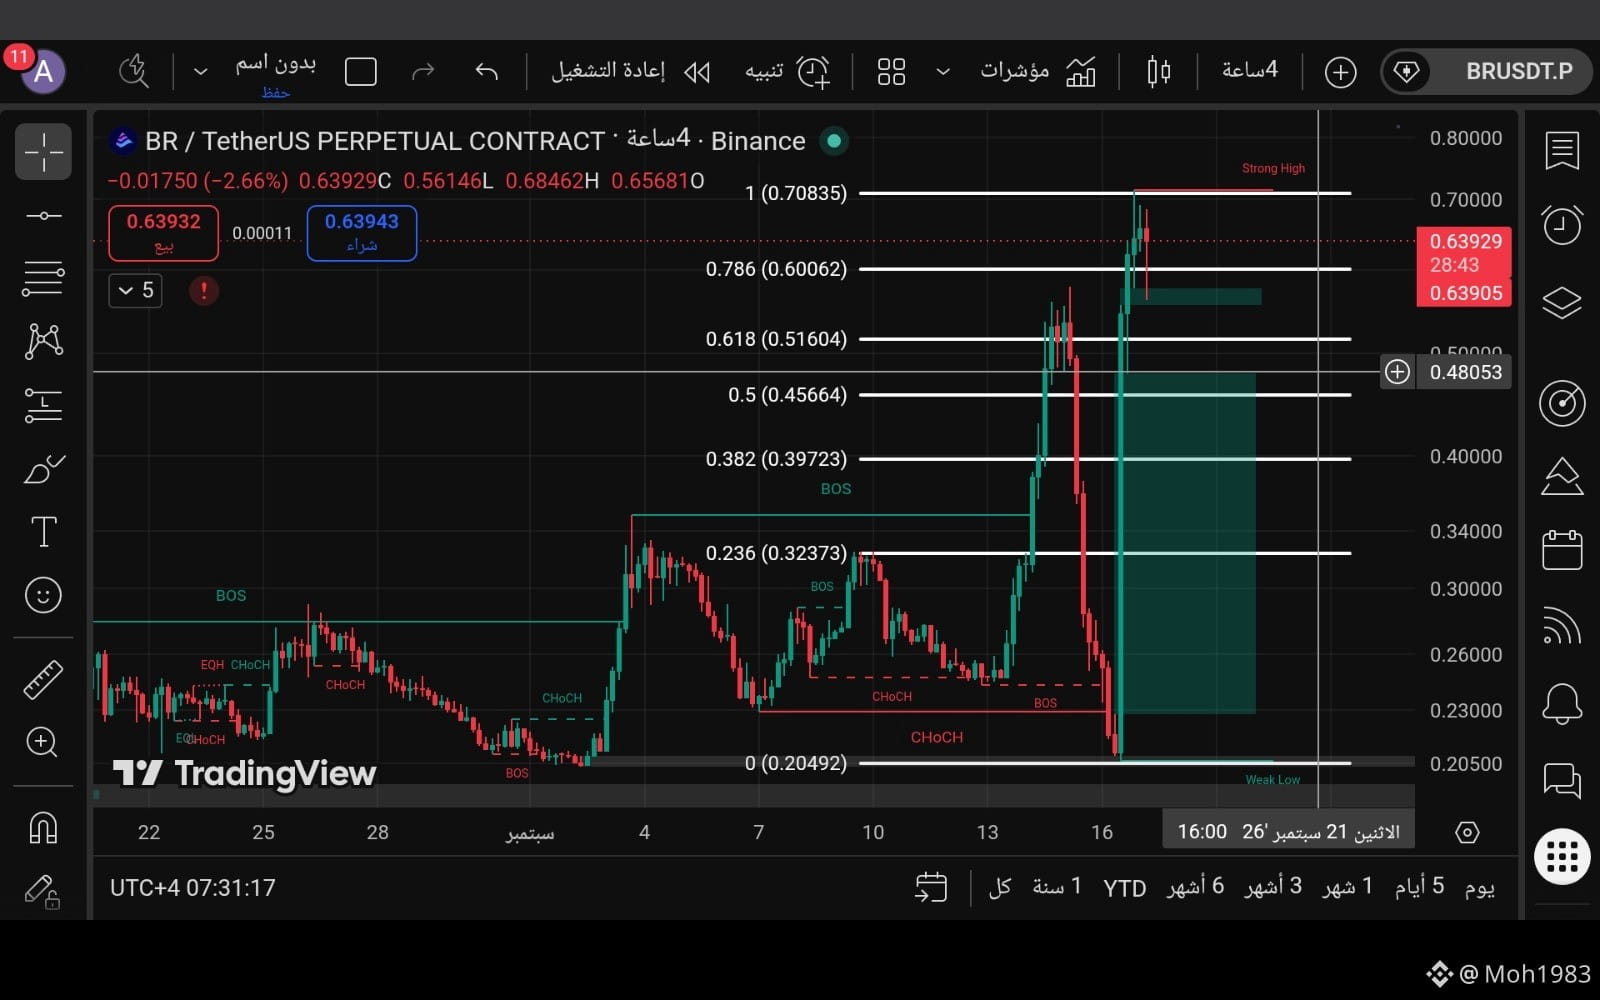
الحركة الحالية بدأت من الدعم الأسبوعي 0.569 – 0.570، وهو مستوى 0.786 Fibonacci، وده أهم جزء في الشارت: السعر لم يكتفِ بملامسة المستوى، بل كوّن منه ارتدادًا قويًا، لذلك قراءة الـWeekly هنا أهم من أي حركة صغيرة على 4H.
على 4H، الصعود كوّن Higher Highs / Higher Lows واستعاد منطقة 0.600، وبالتالي طالما السعر فوق 0.600–0.569 فالاتجاه الصاعد ما زال قائمًا.
لكن السعر الآن أمام منطقة عرض حقيقية 0.708–0.714 وهي القمة السابقة، وبالتالي هنا منطقة الاختبار.
📈 السيناريو الصاعد:
الثبات فوق 0.600 → 0.660 → 0.690 → 0.708–0.714.
اختراق القمة والثبات فوق 0.714 → 0.750 ثم 0.800.
📉 السيناريو التصحيحي:
رفض 0.708–0.714 مع كسر 0.600 → 0.569، وكسرها يفتح الطريق لـ 0.516.
🎯 الخلاصة:
الفيبوناتشي على الفريم الأسبوعي أعطانا منطقة الارتداد قبل الصعود، والـ4H يعطينا تأكيد الهيكل. لذلك 0.600 هو خط الدفاع، و0.714 هو مفتاح استكمال الحركة.
وأي اختراق بدون ثبات وإغلاق واضح يظل مجرد اختراق محتمل وليس تأكيدًا.
#BR #USDT #Crypto #TechnicalAnalysis #Fibonacci
$BR
$BR
BR/USDT 🔥 | قراءة فنية
الحركة الحالية بدأت من الدعم الأسبوعي 0.569 – 0.570، وهو مستوى 0.786 Fibonacci، وده أهم جزء في الشارت: السعر لم يكتفِ بملامسة المستوى، بل كوّن منه ارتدادًا قويًا، لذلك قراءة الـWeekly هنا أهم من أي حركة صغيرة على 4H.
على 4H، الصعود كوّن Higher Highs / Higher Lows واستعاد منطقة 0.600، وبالتالي طالما السعر فوق 0.600–0.569 فالاتجاه الصاعد ما زال قائمًا.
لكن السعر الآن أمام منطقة عرض حقيقية 0.708–0.714 وهي القمة السابقة، وبالتالي هنا منطقة الاختبار.
📈 السيناريو الصاعد:
الثبات فوق 0.600 → 0.660 → 0.690 → 0.708–0.714.
اختراق القمة والثبات فوق 0.714 → 0.750 ثم 0.800.
📉 السيناريو التصحيحي:
رفض 0.708–0.714 مع كسر 0.600 → 0.569، وكسرها يفتح الطريق لـ 0.516.
🎯 الخلاصة:
الفيبوناتشي على الفريم الأسبوعي أعطانا منطقة الارتداد قبل الصعود، والـ4H يعطينا تأكيد الهيكل. لذلك 0.600 هو خط الدفاع، و0.714 هو مفتاح استكمال الحركة.
وأي اختراق بدون ثبات وإغلاق واضح يظل مجرد اختراق محتمل وليس تأكيدًا.
#BR #USDT #Crypto #TechnicalAnalysis #Fibonacci
$BR
BR/USDT 🔥 | قراءة فنية
الحركة الحالية بدأت من الدعم الأسبوعي 0.569 – 0.570، وهو مستوى 0.786 Fibonacci، وده أهم جزء في الشارت: السعر لم يكتفِ بملامسة المستوى، بل كوّن منه ارتدادًا قويًا، لذلك قراءة الـWeekly هنا أهم من أي حركة صغيرة على 4H.
على 4H، الصعود كوّن Higher Highs / Higher Lows واستعاد منطقة 0.600، وبالتالي طالما السعر فوق 0.600–0.569 فالاتجاه الصاعد ما زال قائمًا.
لكن السعر الآن أمام منطقة عرض حقيقية 0.708–0.714 وهي القمة السابقة، وبالتالي هنا منطقة الاختبار.
📈 السيناريو الصاعد:
الثبات فوق 0.600 → 0.660 → 0.690 → 0.708–0.714.
اختراق القمة والثبات فوق 0.714 → 0.750 ثم 0.800.
📉 السيناريو التصحيحي:
رفض 0.708–0.714 مع كسر 0.600 → 0.569، وكسرها يفتح الطريق لـ 0.516.
🎯 الخلاصة:
الفيبوناتشي على الفريم الأسبوعي أعطانا منطقة الارتداد قبل الصعود، والـ4H يعطينا تأكيد الهيكل. لذلك 0.600 هو خط الدفاع، و0.714 هو مفتاح استكمال الحركة.
وأي اختراق بدون ثبات وإغلاق واضح يظل مجرد اختراق محتمل وليس تأكيدًا.
#BR #USDT #Crypto #TechnicalAnalysis #Fibonacci
$BR
8
1
342

·
--
Жоғары (өспелі)
DAILY SIGNAL — SOL/USDT
Date: 13 Sep 2026 Timeframe: 1m Intraday Bias: Support reaction → compression → breakout attempt
📊 Market Bias
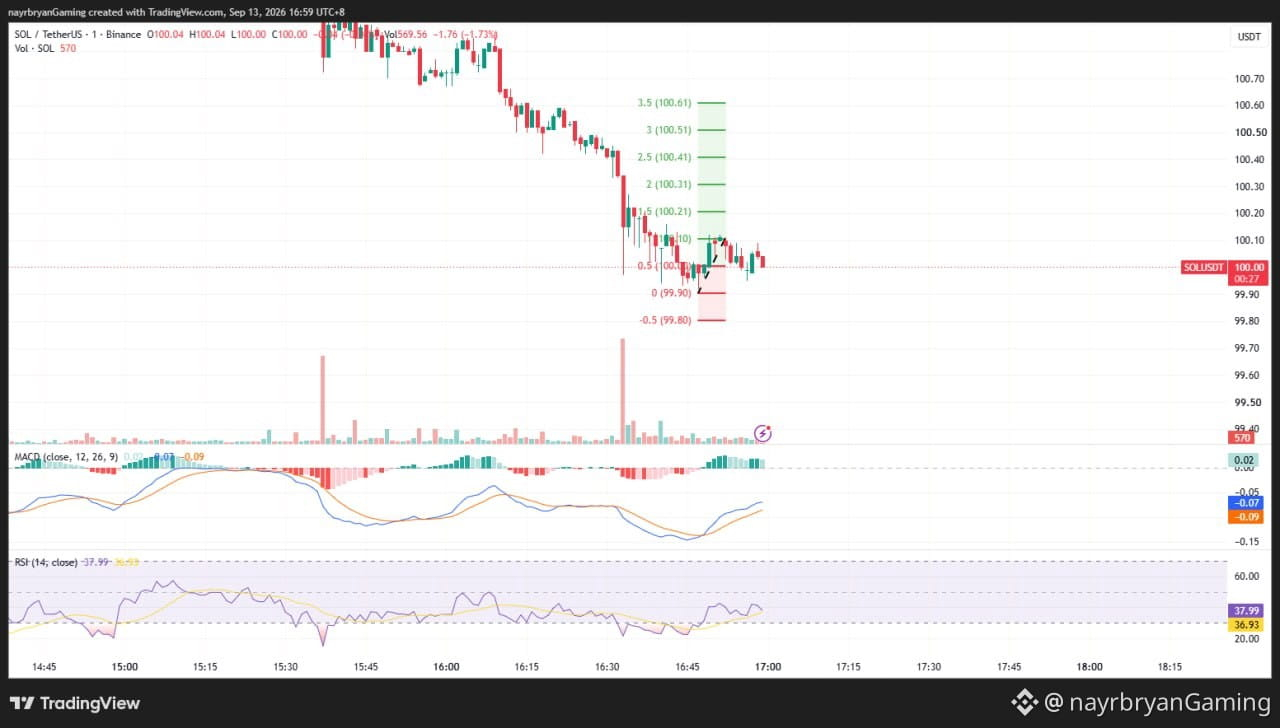
SOL is recovering from the recent sell-off and is currently consolidating around the 99.90–100.00 structure zone.
Price reacted from the lower support area and is now forming a tighter structure beneath the descending trendline.
The latest candles are holding above the 99.90 area, while short-term momentum is gradually improving.
A confirmed break above the local resistance around 100.11 would strengthen the bullish continuation scenario.
🔹 Key Levels From Chart
Entry / Reaction Zone: 99.90 → 100.00
Key Support: 99.90
Breakout Confirmation: 100.11
Invalidation Reference: Below 99.80
🎯 Upside Fibonacci Targets
TP1 → 100.11 (1.0 Fib) TP2 → 100.21 (1.5 Fib) TP3 → 100.31 (2.0 Fib) TP4 → 100.41 (2.5 Fib) TP5 → 100.51 (3.0 Fib) TP6 → 100.61 (3.5 Fib)
🔻 Downside Reference
If the support structure fails:
99.80 (-0.5 Fib)
A sustained move below 99.90 would weaken the current recovery structure.
📈 Technical Breakdown
SOL remains within a broader short-term descending structure after the sharp decline from the 100.70+ area.
However, price has reacted from the 99.90 support region and is now compressing near the upper part of the local structure.
MACD momentum is improving, with the histogram turning positive while the MACD lines are recovering from lower levels.
RSI is around 43.63, showing that momentum is still below the bullish midpoint but recovering from weaker conditions.
The key level to watch is 100.11.
A confirmed reclaim above this level could open the path toward:
100.21 → 100.31 → 100.41 → 100.51 → 100.61
🧠 Quick Insight
“Support gives the setup. Confirmation gives the direction.”
⚠️ Disclaimer
This is personal market analysis, not financial advice. This chart framework is for educational purposes only.
Always DYOR / DYODD, manage risk properly, and avoid emotional trading.
— @nayrbryanGaming #SOL #SOLUSDT #Crypto #Trading #TechnicalAnalysis #PriceAction #Fibonacci
DAILY SIGNAL — SOL/USDT
Date: 13 Sep 2026 Timeframe: 1m Intraday Bias: Support reaction → compression → breakout attempt
📊 Market Bias
SOL is recovering from the recent sell-off and is currently consolidating around the 99.90–100.00 structure zone.
Price reacted from the lower support area and is now forming a tighter structure beneath the descending trendline.
The latest candles are holding above the 99.90 area, while short-term momentum is gradually improving.
A confirmed break above the local resistance around 100.11 would strengthen the bullish continuation scenario.
🔹 Key Levels From Chart
Entry / Reaction Zone: 99.90 → 100.00
Key Support: 99.90
Breakout Confirmation: 100.11
Invalidation Reference: Below 99.80
🎯 Upside Fibonacci Targets
TP1 → 100.11 (1.0 Fib) TP2 → 100.21 (1.5 Fib) TP3 → 100.31 (2.0 Fib) TP4 → 100.41 (2.5 Fib) TP5 → 100.51 (3.0 Fib) TP6 → 100.61 (3.5 Fib)
🔻 Downside Reference
If the support structure fails:
99.80 (-0.5 Fib)
A sustained move below 99.90 would weaken the current recovery structure.
📈 Technical Breakdown
SOL remains within a broader short-term descending structure after the sharp decline from the 100.70+ area.
However, price has reacted from the 99.90 support region and is now compressing near the upper part of the local structure.
MACD momentum is improving, with the histogram turning positive while the MACD lines are recovering from lower levels.
RSI is around 43.63, showing that momentum is still below the bullish midpoint but recovering from weaker conditions.
The key level to watch is 100.11.
A confirmed reclaim above this level could open the path toward:
100.21 → 100.31 → 100.41 → 100.51 → 100.61
🧠 Quick Insight
“Support gives the setup. Confirmation gives the direction.”
⚠️ Disclaimer
This is personal market analysis, not financial advice. This chart framework is for educational purposes only.
Always DYOR / DYODD, manage risk properly, and avoid emotional trading.
— @nayrbryanGaming #SOL #SOLUSDT #Crypto #Trading #TechnicalAnalysis #PriceAction #Fibonacci
Date: 13 Sep 2026 Timeframe: 1m Intraday Bias: Support reaction → compression → breakout attempt
📊 Market Bias
SOL is recovering from the recent sell-off and is currently consolidating around the 99.90–100.00 structure zone.
Price reacted from the lower support area and is now forming a tighter structure beneath the descending trendline.
The latest candles are holding above the 99.90 area, while short-term momentum is gradually improving.
A confirmed break above the local resistance around 100.11 would strengthen the bullish continuation scenario.
🔹 Key Levels From Chart
Entry / Reaction Zone: 99.90 → 100.00
Key Support: 99.90
Breakout Confirmation: 100.11
Invalidation Reference: Below 99.80
🎯 Upside Fibonacci Targets
TP1 → 100.11 (1.0 Fib) TP2 → 100.21 (1.5 Fib) TP3 → 100.31 (2.0 Fib) TP4 → 100.41 (2.5 Fib) TP5 → 100.51 (3.0 Fib) TP6 → 100.61 (3.5 Fib)
🔻 Downside Reference
If the support structure fails:
99.80 (-0.5 Fib)
A sustained move below 99.90 would weaken the current recovery structure.
📈 Technical Breakdown
SOL remains within a broader short-term descending structure after the sharp decline from the 100.70+ area.
However, price has reacted from the 99.90 support region and is now compressing near the upper part of the local structure.
MACD momentum is improving, with the histogram turning positive while the MACD lines are recovering from lower levels.
RSI is around 43.63, showing that momentum is still below the bullish midpoint but recovering from weaker conditions.
The key level to watch is 100.11.
A confirmed reclaim above this level could open the path toward:
100.21 → 100.31 → 100.41 → 100.51 → 100.61
🧠 Quick Insight
“Support gives the setup. Confirmation gives the direction.”
⚠️ Disclaimer
This is personal market analysis, not financial advice. This chart framework is for educational purposes only.
Always DYOR / DYODD, manage risk properly, and avoid emotional trading.
— @nayrbryanGaming #SOL #SOLUSDT #Crypto #Trading #TechnicalAnalysis #PriceAction #Fibonacci
1
372

·
--
Төмен (кемімелі)
$ZEC SHORT — 4H FIBONACCI REVERSAL SETUP
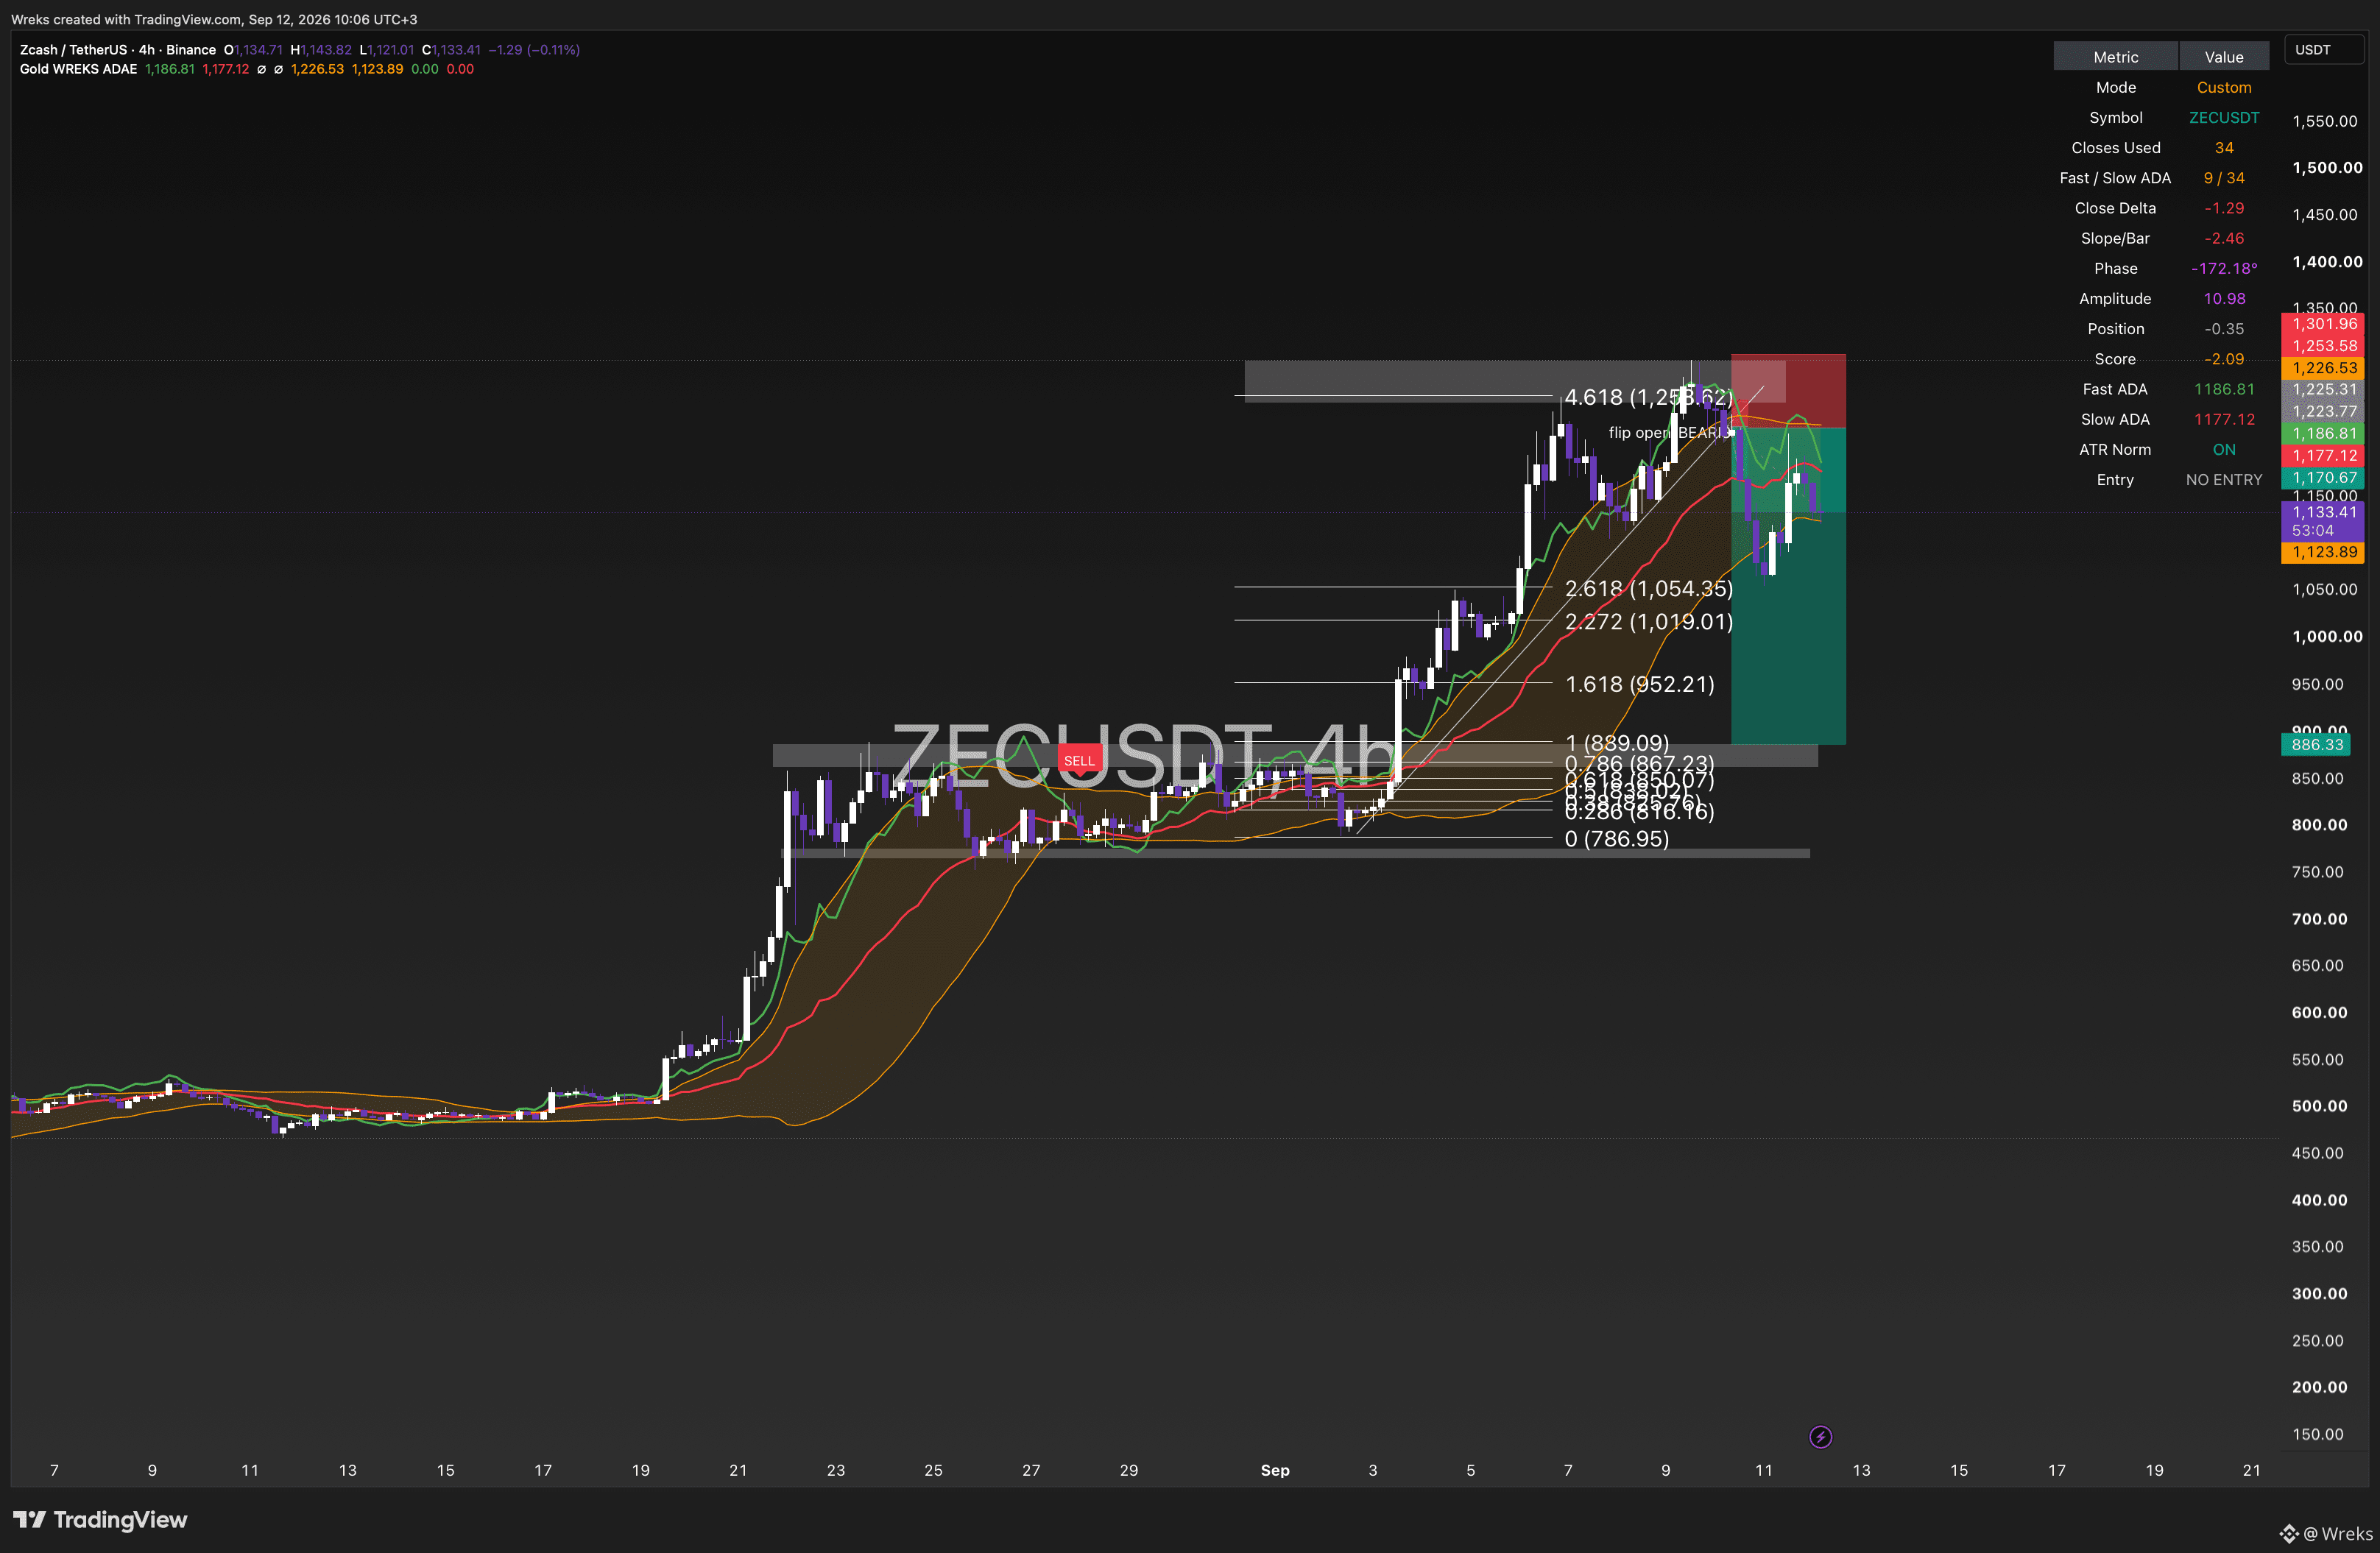
ZEC delivered a strong expansion from the 786–889 structural base, eventually reaching the major 4.618 Fibonacci extension at 1,258.62.
Price rejected this extension zone and failed to maintain the breakout, followed by a sharp bearish displacement toward the 1,050 area. The current rebound is being treated as a corrective move rather than a confirmed bullish reversal.
Short Entry Zone: 1,170–1,225
Stop Loss / Invalidation: 1,301.96
Target 1: 1,054.35 — Fib 2.618
Target 2: 1,019.01 — Fib 2.272
Target 3: 952.21 — Fib 1.618
Extended Target: 889.09–867.23
Final Target: 786.95
The WREKS ADAE model currently supports the corrective bearish scenario with negative Slope (-2.46), negative Score (-2.09), Phase at -172.18°, and Position at -0.35.
The main technical thesis remains simple:
Below 1,225–1,260 → bearish correction remains active.
4H breakdown below 1,054 → strengthens continuation toward 1,019 and 952.
Recovery above 1,260 → weakens the short thesis.
Above 1,301.96 → setup invalidated.
This is a conditional short setup, not a confirmed entry yet. The objective is to trade the rejection and structural confirmation, not predict the top.
Execution Over Prediction.
$ZEC
{future}(ZECUSDT)
#ZEC #ZECUSDT #Fibonacci #TechnicalAnalysis
$ZEC SHORT — 4H FIBONACCI REVERSAL SETUP
ZEC delivered a strong expansion from the 786–889 structural base, eventually reaching the major 4.618 Fibonacci extension at 1,258.62.
Price rejected this extension zone and failed to maintain the breakout, followed by a sharp bearish displacement toward the 1,050 area. The current rebound is being treated as a corrective move rather than a confirmed bullish reversal.
Short Entry Zone: 1,170–1,225
Stop Loss / Invalidation: 1,301.96
Target 1: 1,054.35 — Fib 2.618
Target 2: 1,019.01 — Fib 2.272
Target 3: 952.21 — Fib 1.618
Extended Target: 889.09–867.23
Final Target: 786.95
The WREKS ADAE model currently supports the corrective bearish scenario with negative Slope (-2.46), negative Score (-2.09), Phase at -172.18°, and Position at -0.35.
The main technical thesis remains simple:
Below 1,225–1,260 → bearish correction remains active.
4H breakdown below 1,054 → strengthens continuation toward 1,019 and 952.
Recovery above 1,260 → weakens the short thesis.
Above 1,301.96 → setup invalidated.
This is a conditional short setup, not a confirmed entry yet. The objective is to trade the rejection and structural confirmation, not predict the top.
Execution Over Prediction.
$ZEC
#ZEC #ZECUSDT #Fibonacci #TechnicalAnalysis
ZEC delivered a strong expansion from the 786–889 structural base, eventually reaching the major 4.618 Fibonacci extension at 1,258.62.
Price rejected this extension zone and failed to maintain the breakout, followed by a sharp bearish displacement toward the 1,050 area. The current rebound is being treated as a corrective move rather than a confirmed bullish reversal.
Short Entry Zone: 1,170–1,225
Stop Loss / Invalidation: 1,301.96
Target 1: 1,054.35 — Fib 2.618
Target 2: 1,019.01 — Fib 2.272
Target 3: 952.21 — Fib 1.618
Extended Target: 889.09–867.23
Final Target: 786.95
The WREKS ADAE model currently supports the corrective bearish scenario with negative Slope (-2.46), negative Score (-2.09), Phase at -172.18°, and Position at -0.35.
The main technical thesis remains simple:
Below 1,225–1,260 → bearish correction remains active.
4H breakdown below 1,054 → strengthens continuation toward 1,019 and 952.
Recovery above 1,260 → weakens the short thesis.
Above 1,301.96 → setup invalidated.
This is a conditional short setup, not a confirmed entry yet. The objective is to trade the rejection and structural confirmation, not predict the top.
Execution Over Prediction.
$ZEC
#ZEC #ZECUSDT #Fibonacci #TechnicalAnalysis
233
·
--
Жоғары (өспелі)
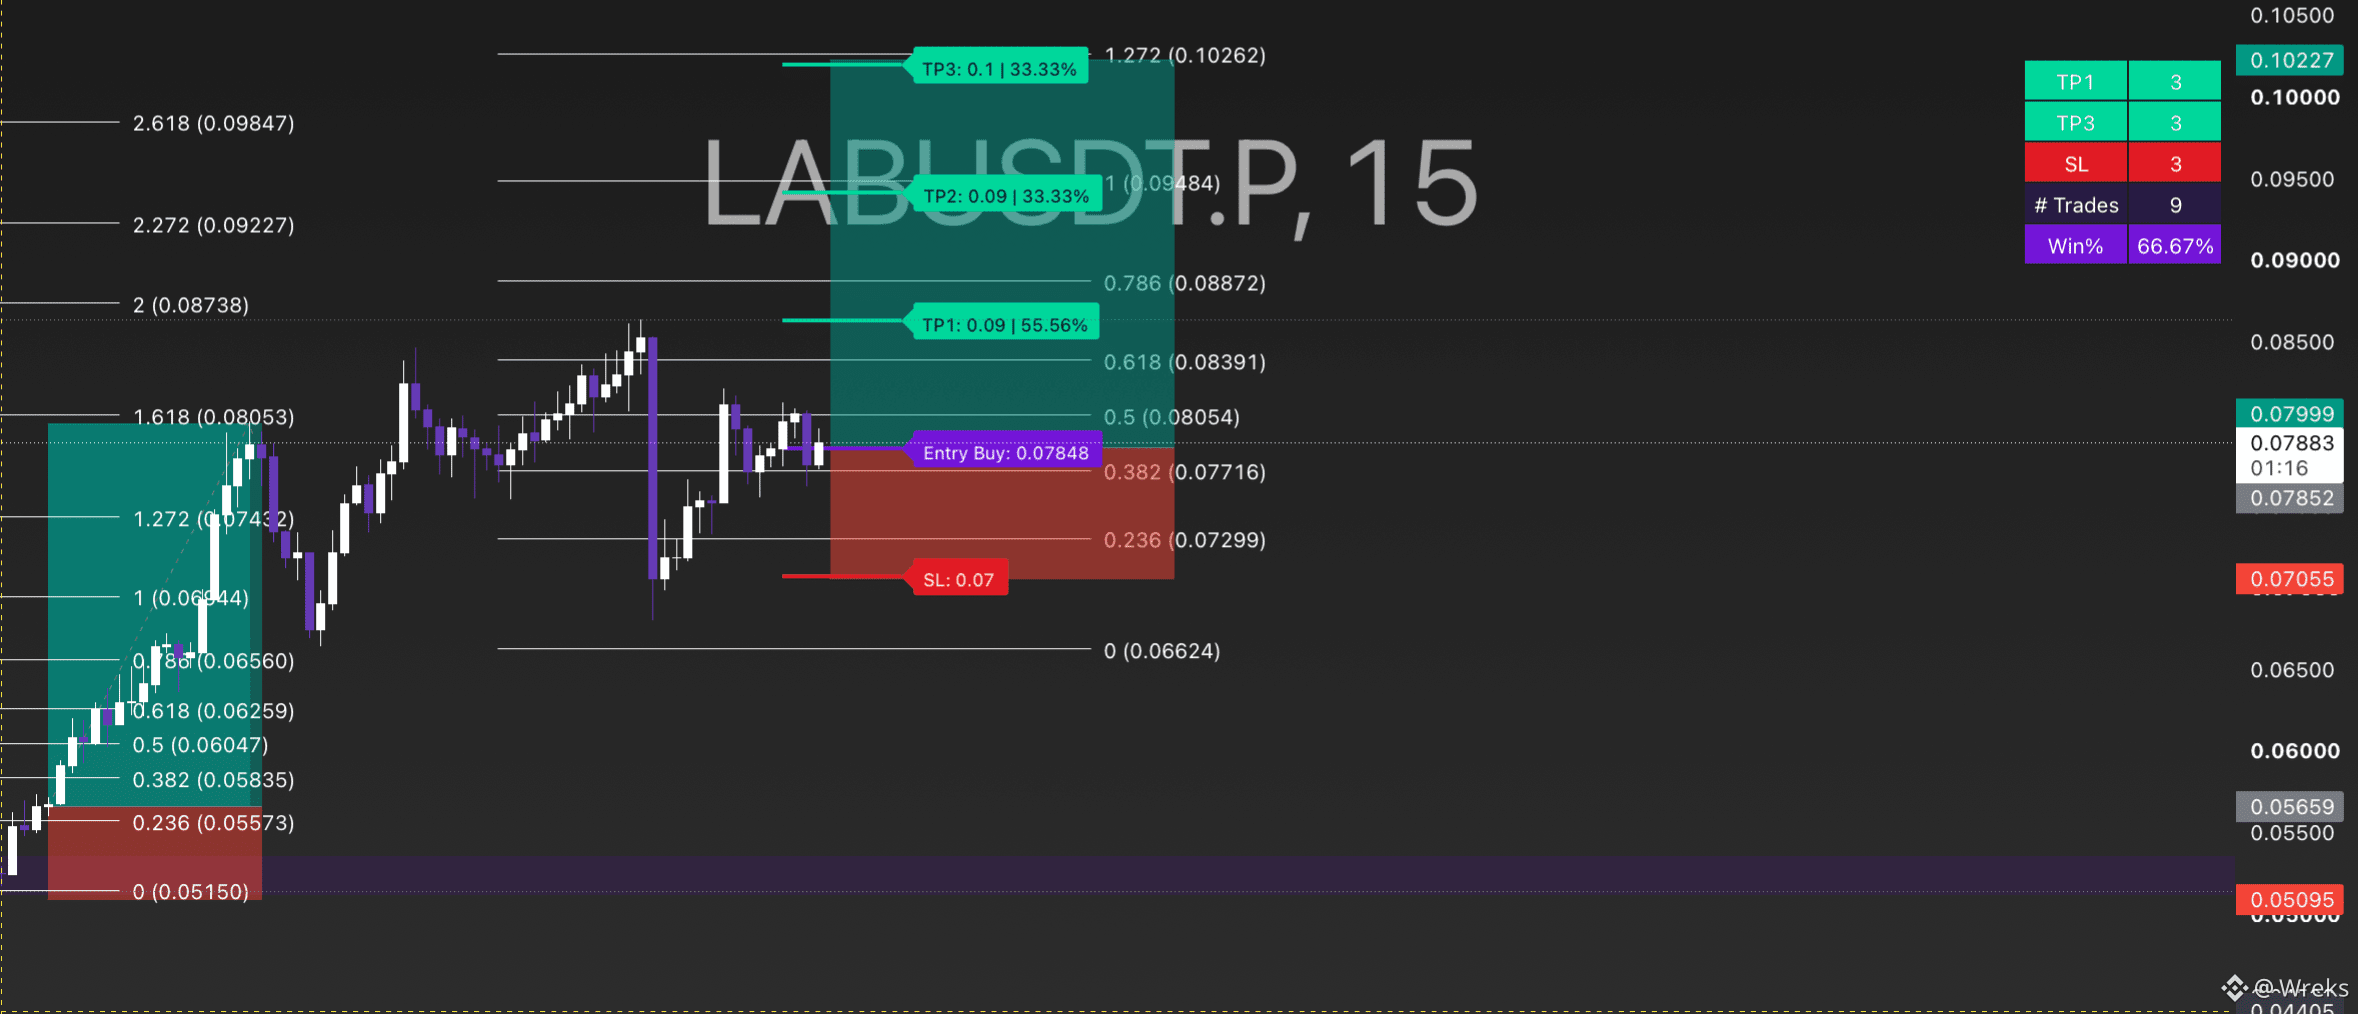
$LAB LONG — FIBONACCI CONTINUATION SETUP
LAB is maintaining its bullish structure after completing a corrective pullback and holding above the key Fibonacci retracement area.
Entry: 0.07848
Stop Loss: 0.07000
TP1: 0.08738
TP2: 0.09484
TP3: 0.10262
The setup is based on the continuation of the bullish structure, with price currently holding around the 0.382 Fibonacci level at 0.07716 and attempting to reclaim the 0.50 level at 0.08054.
A sustained move above 0.08054 strengthens the bullish scenario and opens the path toward 0.08391 → 0.08738, followed by the higher extension targets.
The trade remains technically valid while price holds above the defined invalidation area. If TP1 is reached, partial profit can be secured and risk reduced on the remaining position.
Bias: BULLISH above the invalidation zone.
#LABUSDT #CryptoTrading #Fibonacci #TechnicalAnalysis
{future}(LABUSDT)
$LAB LONG — FIBONACCI CONTINUATION SETUP
LAB is maintaining its bullish structure after completing a corrective pullback and holding above the key Fibonacci retracement area.
Entry: 0.07848
Stop Loss: 0.07000
TP1: 0.08738
TP2: 0.09484
TP3: 0.10262
The setup is based on the continuation of the bullish structure, with price currently holding around the 0.382 Fibonacci level at 0.07716 and attempting to reclaim the 0.50 level at 0.08054.
A sustained move above 0.08054 strengthens the bullish scenario and opens the path toward 0.08391 → 0.08738, followed by the higher extension targets.
The trade remains technically valid while price holds above the defined invalidation area. If TP1 is reached, partial profit can be secured and risk reduced on the remaining position.
Bias: BULLISH above the invalidation zone.
#LABUSDT #CryptoTrading #Fibonacci #TechnicalAnalysis
LAB is maintaining its bullish structure after completing a corrective pullback and holding above the key Fibonacci retracement area.
Entry: 0.07848
Stop Loss: 0.07000
TP1: 0.08738
TP2: 0.09484
TP3: 0.10262
The setup is based on the continuation of the bullish structure, with price currently holding around the 0.382 Fibonacci level at 0.07716 and attempting to reclaim the 0.50 level at 0.08054.
A sustained move above 0.08054 strengthens the bullish scenario and opens the path toward 0.08391 → 0.08738, followed by the higher extension targets.
The trade remains technically valid while price holds above the defined invalidation area. If TP1 is reached, partial profit can be secured and risk reduced on the remaining position.
Bias: BULLISH above the invalidation zone.
#LABUSDT #CryptoTrading #Fibonacci #TechnicalAnalysis
184

·
--
Жоғары (өспелі)
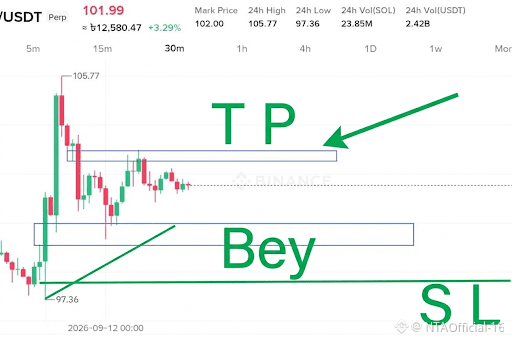
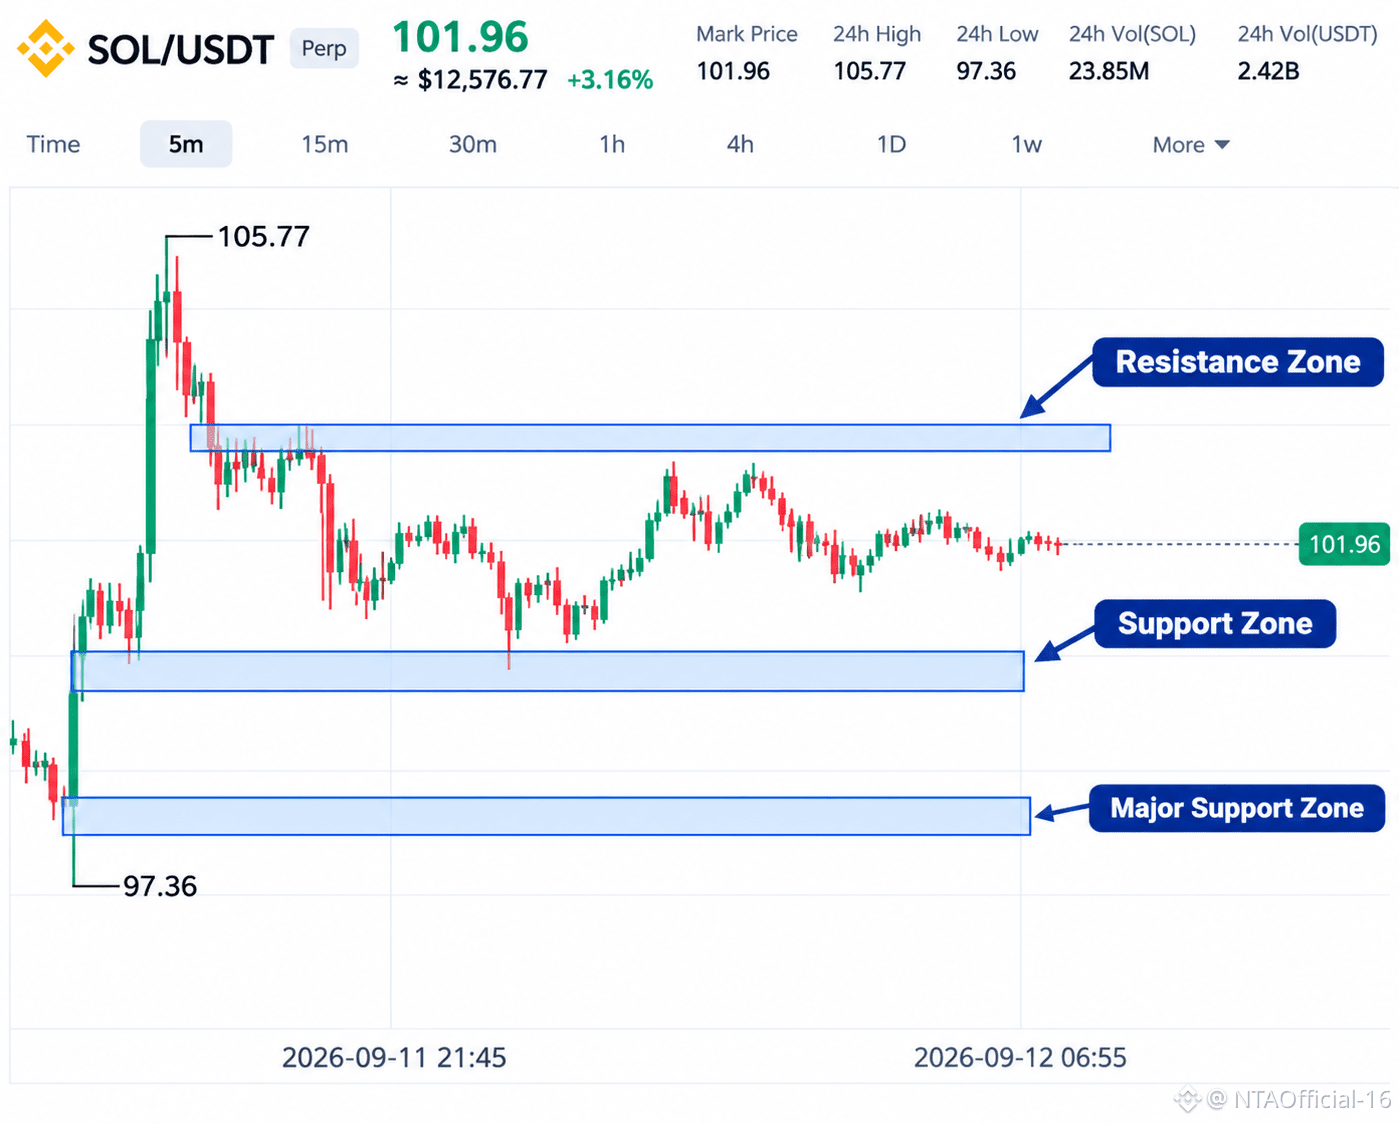
I’m considering a BUY from this area for several reasons.$SOL
🔹 Fibonacci 0.618 Level:
The price is reacting around the Fibonacci 0.618 retracement area, which can act as a potential support zone.
🔹 Liquidity:
There is liquidity around the lower area, which could support a potential bullish reaction.
🔹 15M FVG:
The 15-minute chart has an FVG (Fair Value Gap) around the area, adding another confluence to the setup.
🔹 Target:
My target is the upper liquidity/resistance zone. If the bullish setup plays out, I expect price to move toward that area.
🎯 Trade Setup
BUY: 100.33
TP: 103.03
SL: 99.02
This is only my personal technical analysis, not financial advice. Always manage your risk before entering a trade.
🔥 What do you think? Will SOL reach the TP?
Let me know your opinion in the comments! #SOLUSDT #Binance #crypto #trading #Fibonacci $SOL
I’m considering a BUY from this area for several reasons.$SOL
🔹 Fibonacci 0.618 Level:
The price is reacting around the Fibonacci 0.618 retracement area, which can act as a potential support zone.
🔹 Liquidity:
There is liquidity around the lower area, which could support a potential bullish reaction.
🔹 15M FVG:
The 15-minute chart has an FVG (Fair Value Gap) around the area, adding another confluence to the setup.
🔹 Target:
My target is the upper liquidity/resistance zone. If the bullish setup plays out, I expect price to move toward that area.
🎯 Trade Setup
BUY: 100.33
TP: 103.03
SL: 99.02
This is only my personal technical analysis, not financial advice. Always manage your risk before entering a trade.
🔥 What do you think? Will SOL reach the TP?
Let me know your opinion in the comments! #SOLUSDT #Binance #crypto #trading #Fibonacci $SOL
🔹 Fibonacci 0.618 Level:
The price is reacting around the Fibonacci 0.618 retracement area, which can act as a potential support zone.
🔹 Liquidity:
There is liquidity around the lower area, which could support a potential bullish reaction.
🔹 15M FVG:
The 15-minute chart has an FVG (Fair Value Gap) around the area, adding another confluence to the setup.
🔹 Target:
My target is the upper liquidity/resistance zone. If the bullish setup plays out, I expect price to move toward that area.
🎯 Trade Setup
BUY: 100.33
TP: 103.03
SL: 99.02
This is only my personal technical analysis, not financial advice. Always manage your risk before entering a trade.
🔥 What do you think? Will SOL reach the TP?
Let me know your opinion in the comments! #SOLUSDT #Binance #crypto #trading #Fibonacci $SOL
98

·
--
🚀 $ICP BREAKS $3, EYES $3.68 RESISTANCE ZONE! 🦈
Entry: 3.06 ⚡
Target: 3.68 🚀
Stop Loss: 2.97 ⚠️
📊 The rally past $3 has thrust ICP into the 61.8% Fibonacci pocket, a classic liquidity magnet for smart‑money hunters. ⚡ Momentum remains intact, with volume swelling on the 12‑hour frame as buyers defend the $3‑$3.25 corridor. 📌 A clean break above $3.68 would invalidate the bearish wave‑2 narrative and open the path toward the $4.30‑$4.40 ceiling, a 45% upside from today. 🌊 Conversely, a snap back beneath $2.97 could re‑ignite the descending channel pressure. 💬 Do you see the next push cracking the $3.68 barrier?
⚠️ Not financial advice. Always manage your risk. 🛡️
🏷️ #ICP #LongSetup #Fibonacci #Crypto
🔥 💎
🚀 $ICP BREAKS $3, EYES $3.68 RESISTANCE ZONE! 🦈
Entry: 3.06 ⚡
Target: 3.68 🚀
Stop Loss: 2.97 ⚠️
📊 The rally past $3 has thrust ICP into the 61.8% Fibonacci pocket, a classic liquidity magnet for smart‑money hunters. ⚡ Momentum remains intact, with volume swelling on the 12‑hour frame as buyers defend the $3‑$3.25 corridor. 📌 A clean break above $3.68 would invalidate the bearish wave‑2 narrative and open the path toward the $4.30‑$4.40 ceiling, a 45% upside from today. 🌊 Conversely, a snap back beneath $2.97 could re‑ignite the descending channel pressure. 💬 Do you see the next push cracking the $3.68 barrier?
⚠️ Not financial advice. Always manage your risk. 🛡️
🏷️ #ICP #LongSetup #Fibonacci #Crypto
🔥 💎
Entry: 3.06 ⚡
Target: 3.68 🚀
Stop Loss: 2.97 ⚠️
📊 The rally past $3 has thrust ICP into the 61.8% Fibonacci pocket, a classic liquidity magnet for smart‑money hunters. ⚡ Momentum remains intact, with volume swelling on the 12‑hour frame as buyers defend the $3‑$3.25 corridor. 📌 A clean break above $3.68 would invalidate the bearish wave‑2 narrative and open the path toward the $4.30‑$4.40 ceiling, a 45% upside from today. 🌊 Conversely, a snap back beneath $2.97 could re‑ignite the descending channel pressure. 💬 Do you see the next push cracking the $3.68 barrier?
⚠️ Not financial advice. Always manage your risk. 🛡️
🏷️ #ICP #LongSetup #Fibonacci #Crypto
🔥 💎
115

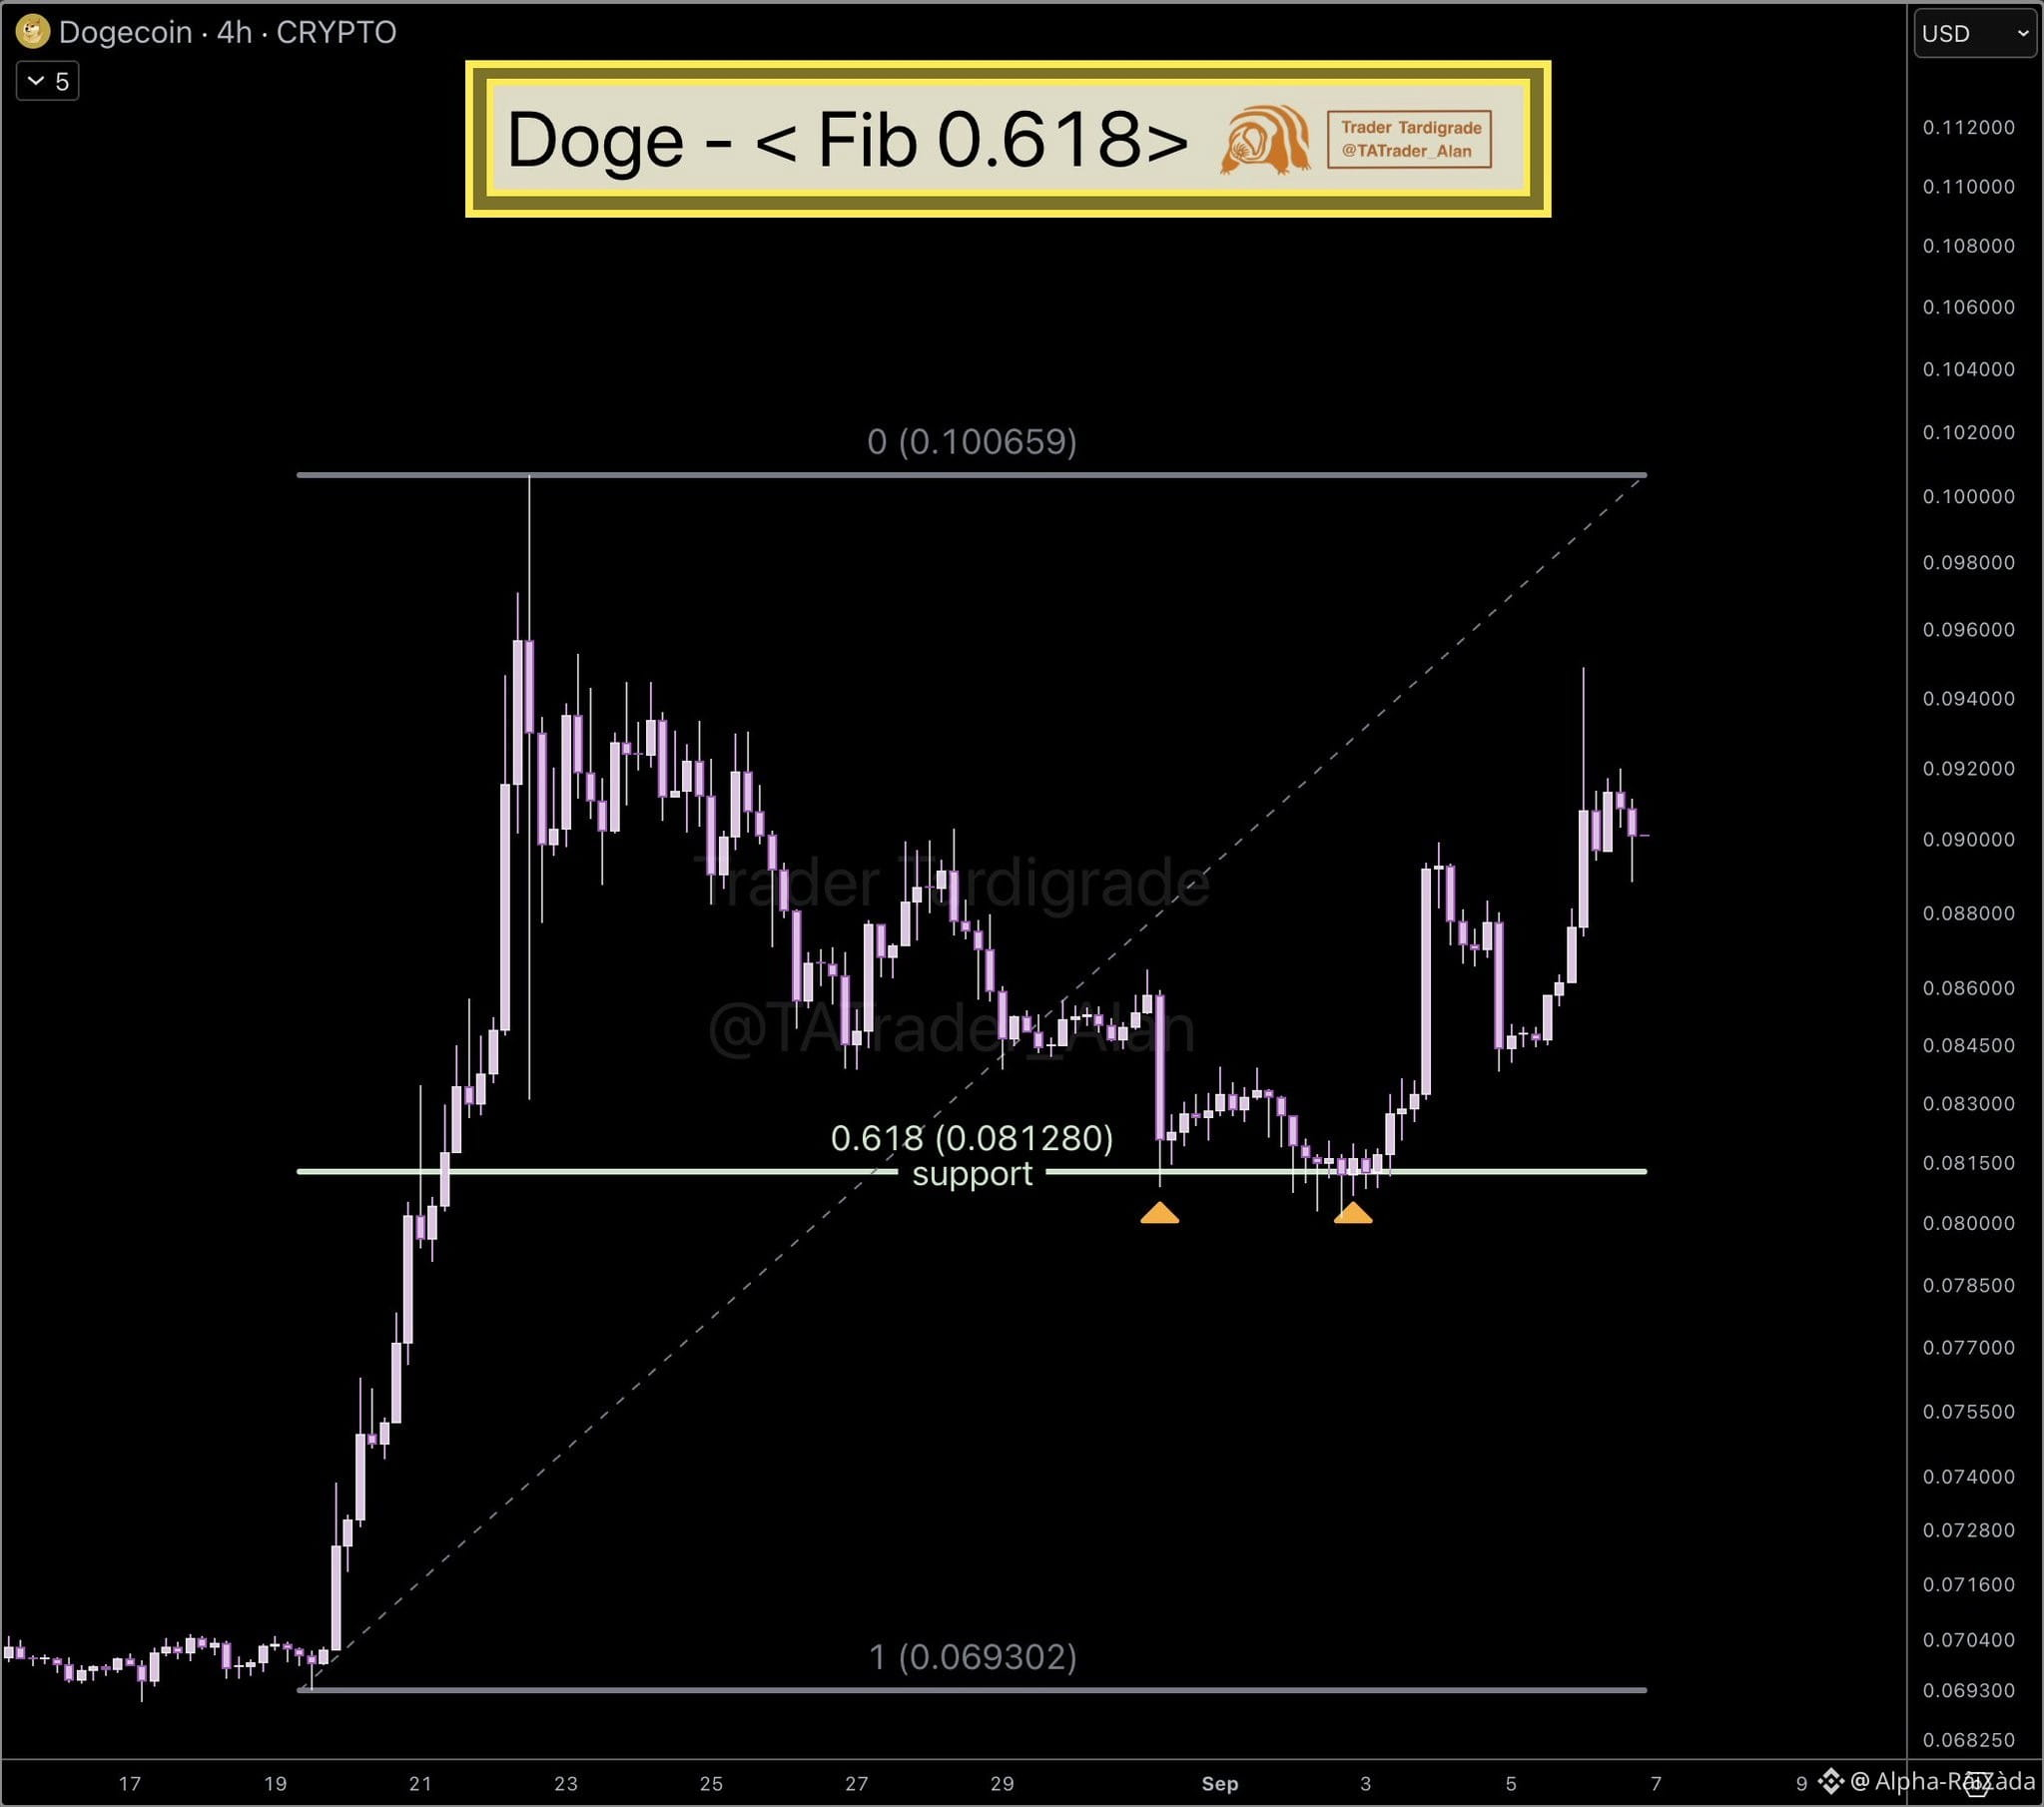
🚀 $DOGE
{spot}(DOGEUSDT)
— 0.618 FIB SUPPORT HOLDS 🔥
$DOGE has tested the 0.618 Fibonacci zone around $0.081 multiple times — and buyers stepped in each time. 📊🟢
🔥 Multiple retests
🛡️ $0.081 defended
📈 Rebound structure developing
When a key Fib level repeatedly holds and price reacts higher, it shows that the zone is attracting demand. The real confirmation now is whether DOGE can maintain the rebound and reclaim nearby resistance.
🔑 Key Support: $0.081
🚀 Bias: Bullish while support holds
⚠️ Support can fail — wait for confirmation before chasing.
LONG BIAS 📈
DYOR • NFA
#DOGE #Dogecoin #Fibonacci #CryptoTrading
🚀 $DOGE
— 0.618 FIB SUPPORT HOLDS 🔥
$DOGE has tested the 0.618 Fibonacci zone around $0.081 multiple times — and buyers stepped in each time. 📊🟢
🔥 Multiple retests
🛡️ $0.081 defended
📈 Rebound structure developing
When a key Fib level repeatedly holds and price reacts higher, it shows that the zone is attracting demand. The real confirmation now is whether DOGE can maintain the rebound and reclaim nearby resistance.
🔑 Key Support: $0.081
🚀 Bias: Bullish while support holds
⚠️ Support can fail — wait for confirmation before chasing.
LONG BIAS 📈
DYOR • NFA
#DOGE #Dogecoin #Fibonacci #CryptoTrading
— 0.618 FIB SUPPORT HOLDS 🔥
$DOGE has tested the 0.618 Fibonacci zone around $0.081 multiple times — and buyers stepped in each time. 📊🟢
🔥 Multiple retests
🛡️ $0.081 defended
📈 Rebound structure developing
When a key Fib level repeatedly holds and price reacts higher, it shows that the zone is attracting demand. The real confirmation now is whether DOGE can maintain the rebound and reclaim nearby resistance.
🔑 Key Support: $0.081
🚀 Bias: Bullish while support holds
⚠️ Support can fail — wait for confirmation before chasing.
LONG BIAS 📈
DYOR • NFA
#DOGE #Dogecoin #Fibonacci #CryptoTrading
29

PREMIUM И DISCOUNT ЗОНЫ: ПОЧЕМУ ТЫ ПОКУПАЕШЬ ПОДДЕЛКУ ПО ЦЕНЕ ОРИГИНАЛА? ⚖️🛍️
Заходить в сделку в середине торгового диапазона — это грубейшая ошибка. Ты должен четко понимать, где цена дорогая, а где дешевая.
• Используй сетку Фибоначчи: все, что выше уровня 0.5 — это зона Premium (дорого), там ищут только шорт.
• Все, что ниже 0.5 — зона Discount (дешево/скидки), и только там можно безопасно искать лонг.
👇 Открывай виджет SOL. Где сейчас находится цена — в зоне покупок или продаж?
#SmartMoney #Fibonacci #Solana $SOL #CryptoFREEMEN
{spot}(SOLUSDT)
PREMIUM И DISCOUNT ЗОНЫ: ПОЧЕМУ ТЫ ПОКУПАЕШЬ ПОДДЕЛКУ ПО ЦЕНЕ ОРИГИНАЛА? ⚖️🛍️
Заходить в сделку в середине торгового диапазона — это грубейшая ошибка. Ты должен четко понимать, где цена дорогая, а где дешевая.
• Используй сетку Фибоначчи: все, что выше уровня 0.5 — это зона Premium (дорого), там ищут только шорт.
• Все, что ниже 0.5 — зона Discount (дешево/скидки), и только там можно безопасно искать лонг.
👇 Открывай виджет SOL. Где сейчас находится цена — в зоне покупок или продаж?
#SmartMoney #Fibonacci #Solana $SOL #CryptoFREEMEN
Заходить в сделку в середине торгового диапазона — это грубейшая ошибка. Ты должен четко понимать, где цена дорогая, а где дешевая.
• Используй сетку Фибоначчи: все, что выше уровня 0.5 — это зона Premium (дорого), там ищут только шорт.
• Все, что ниже 0.5 — зона Discount (дешево/скидки), и только там можно безопасно искать лонг.
👇 Открывай виджет SOL. Где сейчас находится цена — в зоне покупок или продаж?
#SmartMoney #Fibonacci #Solana $SOL #CryptoFREEMEN
1
160

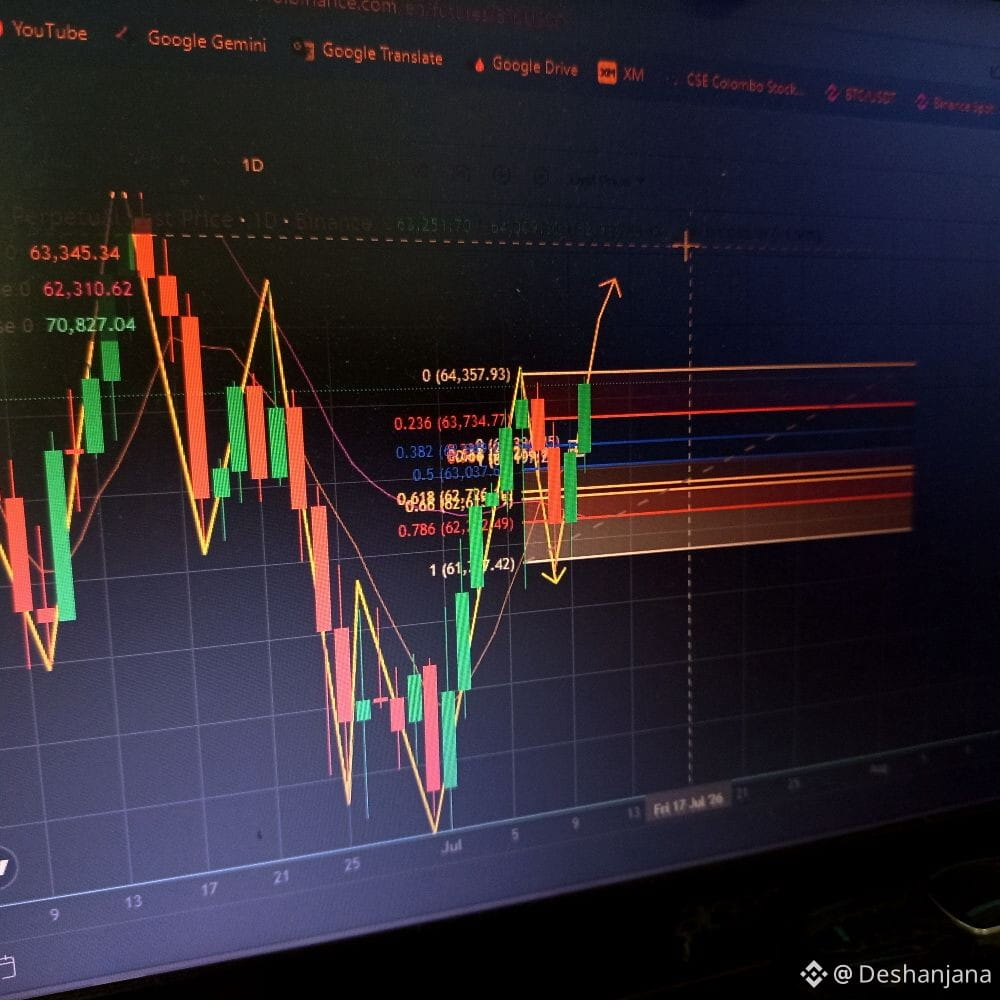
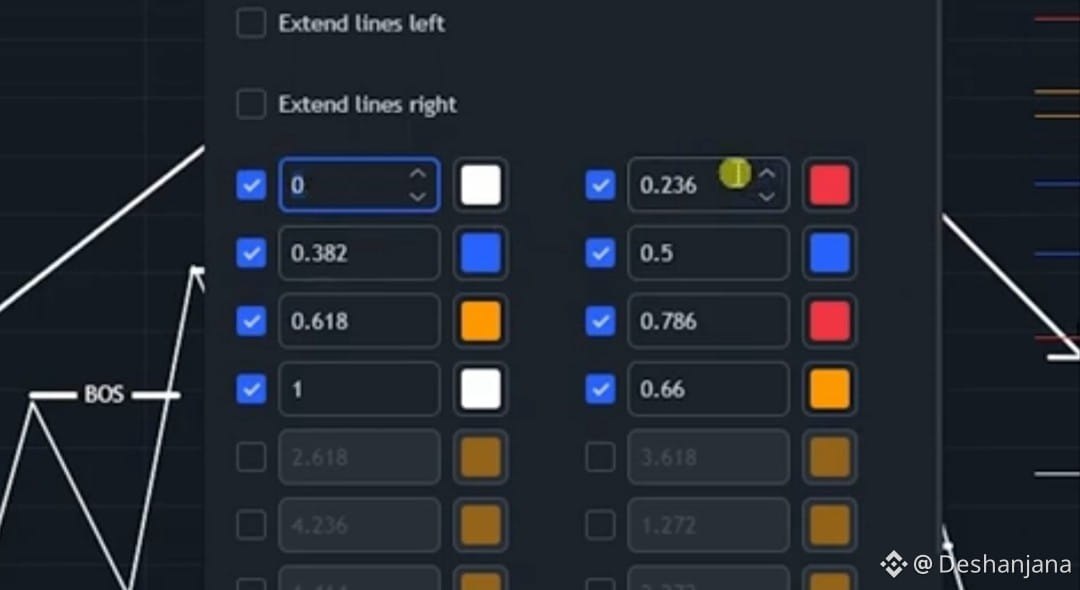
Fibonacci tools are essential instruments in the world of cryptocurrency trading, especially when using a comprehensive platform like the Binance application. By applying these tools to your charts, you can identify potential support and resistance levels based on the mathematical sequences discovered by Leonardo Fibonacci.
Traders typically use Fibonacci Retracements to determine how far a price might pull back after a significant move, allowing them to find optimal entry or exit points. On the other hand, Fibonacci Extensions help project where a price might go after a trend resumes, giving you targets for taking profits.
By combining these with other indicators, you can make much more informed decisions about your investments and refine your trading strategy within the Binance ecosystem. #Fibonacci #BTC
Fibonacci tools are essential instruments in the world of cryptocurrency trading, especially when using a comprehensive platform like the Binance application. By applying these tools to your charts, you can identify potential support and resistance levels based on the mathematical sequences discovered by Leonardo Fibonacci.
Traders typically use Fibonacci Retracements to determine how far a price might pull back after a significant move, allowing them to find optimal entry or exit points. On the other hand, Fibonacci Extensions help project where a price might go after a trend resumes, giving you targets for taking profits.
By combining these with other indicators, you can make much more informed decisions about your investments and refine your trading strategy within the Binance ecosystem. #Fibonacci #BTC
Traders typically use Fibonacci Retracements to determine how far a price might pull back after a significant move, allowing them to find optimal entry or exit points. On the other hand, Fibonacci Extensions help project where a price might go after a trend resumes, giving you targets for taking profits.
By combining these with other indicators, you can make much more informed decisions about your investments and refine your trading strategy within the Binance ecosystem. #Fibonacci #BTC
2
171
·
--
Жоғары (өспелі)
📈 Ke Mana Arah QI Selanjutnya?Setelah mencetak lonjakan besar hari ini, target profit (Take Profit) logis berikutnya untuk koin $QI dapat dipetakan menggunakan rasio Fibonacci Golden Zone. Amankan sebagian modal Anda dan biarkan sisanya berjalan dengan Stop Loss di harga masuk (BEP).#tradingtips $QI
{spot}(QIUSDT)
#QI #Fibonacci #BinanceSquare
📈 Ke Mana Arah QI Selanjutnya?Setelah mencetak lonjakan besar hari ini, target profit (Take Profit) logis berikutnya untuk koin $QI dapat dipetakan menggunakan rasio Fibonacci Golden Zone. Amankan sebagian modal Anda dan biarkan sisanya berjalan dengan Stop Loss di harga masuk (BEP).#tradingtips $QI
#QI #Fibonacci #BinanceSquare
#QI #Fibonacci #BinanceSquare

69

·
--
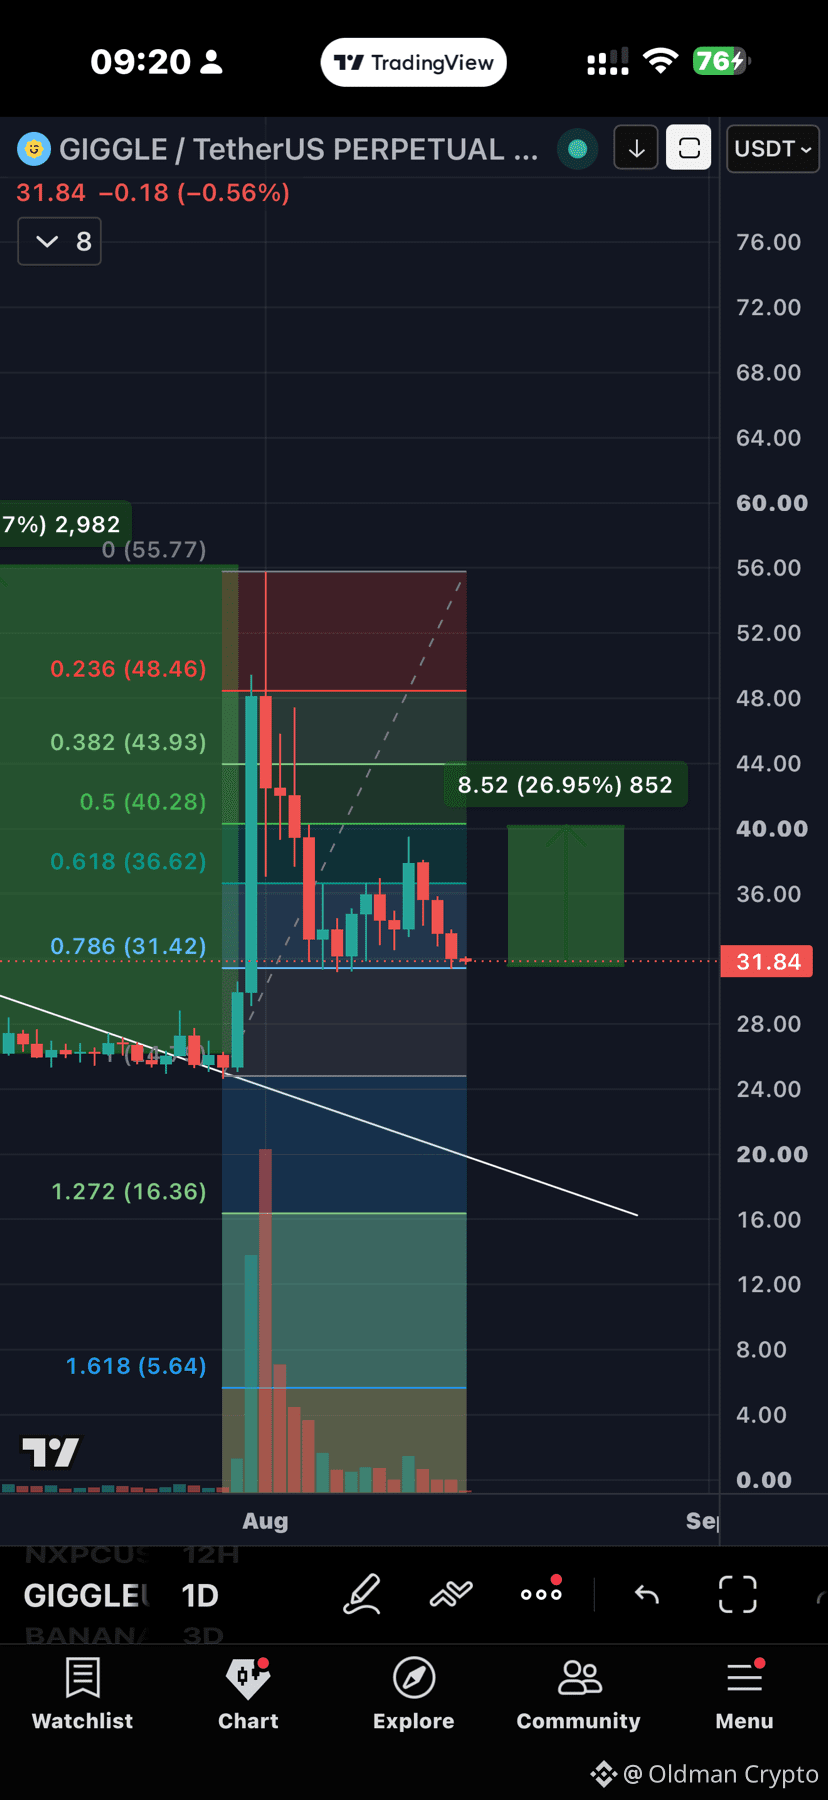
📊 $GIGGLE tested Fibo 0.786 at $31.5 — 3 times. ✅
Triple test = strong support confirmed. 💪
🔄 BNB Chain meme sector loading for recovery wave.
Same pattern as last time — memes bounced hard after accumulation. 👀
🔻 #Giggle #BNBChain #Memecoin #Fibonacci #CryptoTrading #TechnicalAnalysis
📌 Sharing personal opinions only — not financial advice or a recommendation to buy/sell. Crypto is highly risky; DYOR and you are solely responsible. No coin promotion.
📊 $GIGGLE tested Fibo 0.786 at $31.5 — 3 times. ✅
Triple test = strong support confirmed. 💪
🔄 BNB Chain meme sector loading for recovery wave.
Same pattern as last time — memes bounced hard after accumulation. 👀
🔻 #Giggle #BNBChain #Memecoin #Fibonacci #CryptoTrading #TechnicalAnalysis
📌 Sharing personal opinions only — not financial advice or a recommendation to buy/sell. Crypto is highly risky; DYOR and you are solely responsible. No coin promotion.
Triple test = strong support confirmed. 💪
🔄 BNB Chain meme sector loading for recovery wave.
Same pattern as last time — memes bounced hard after accumulation. 👀
🔻 #Giggle #BNBChain #Memecoin #Fibonacci #CryptoTrading #TechnicalAnalysis
📌 Sharing personal opinions only — not financial advice or a recommendation to buy/sell. Crypto is highly risky; DYOR and you are solely responsible. No coin promotion.
1
14
15k

·
--
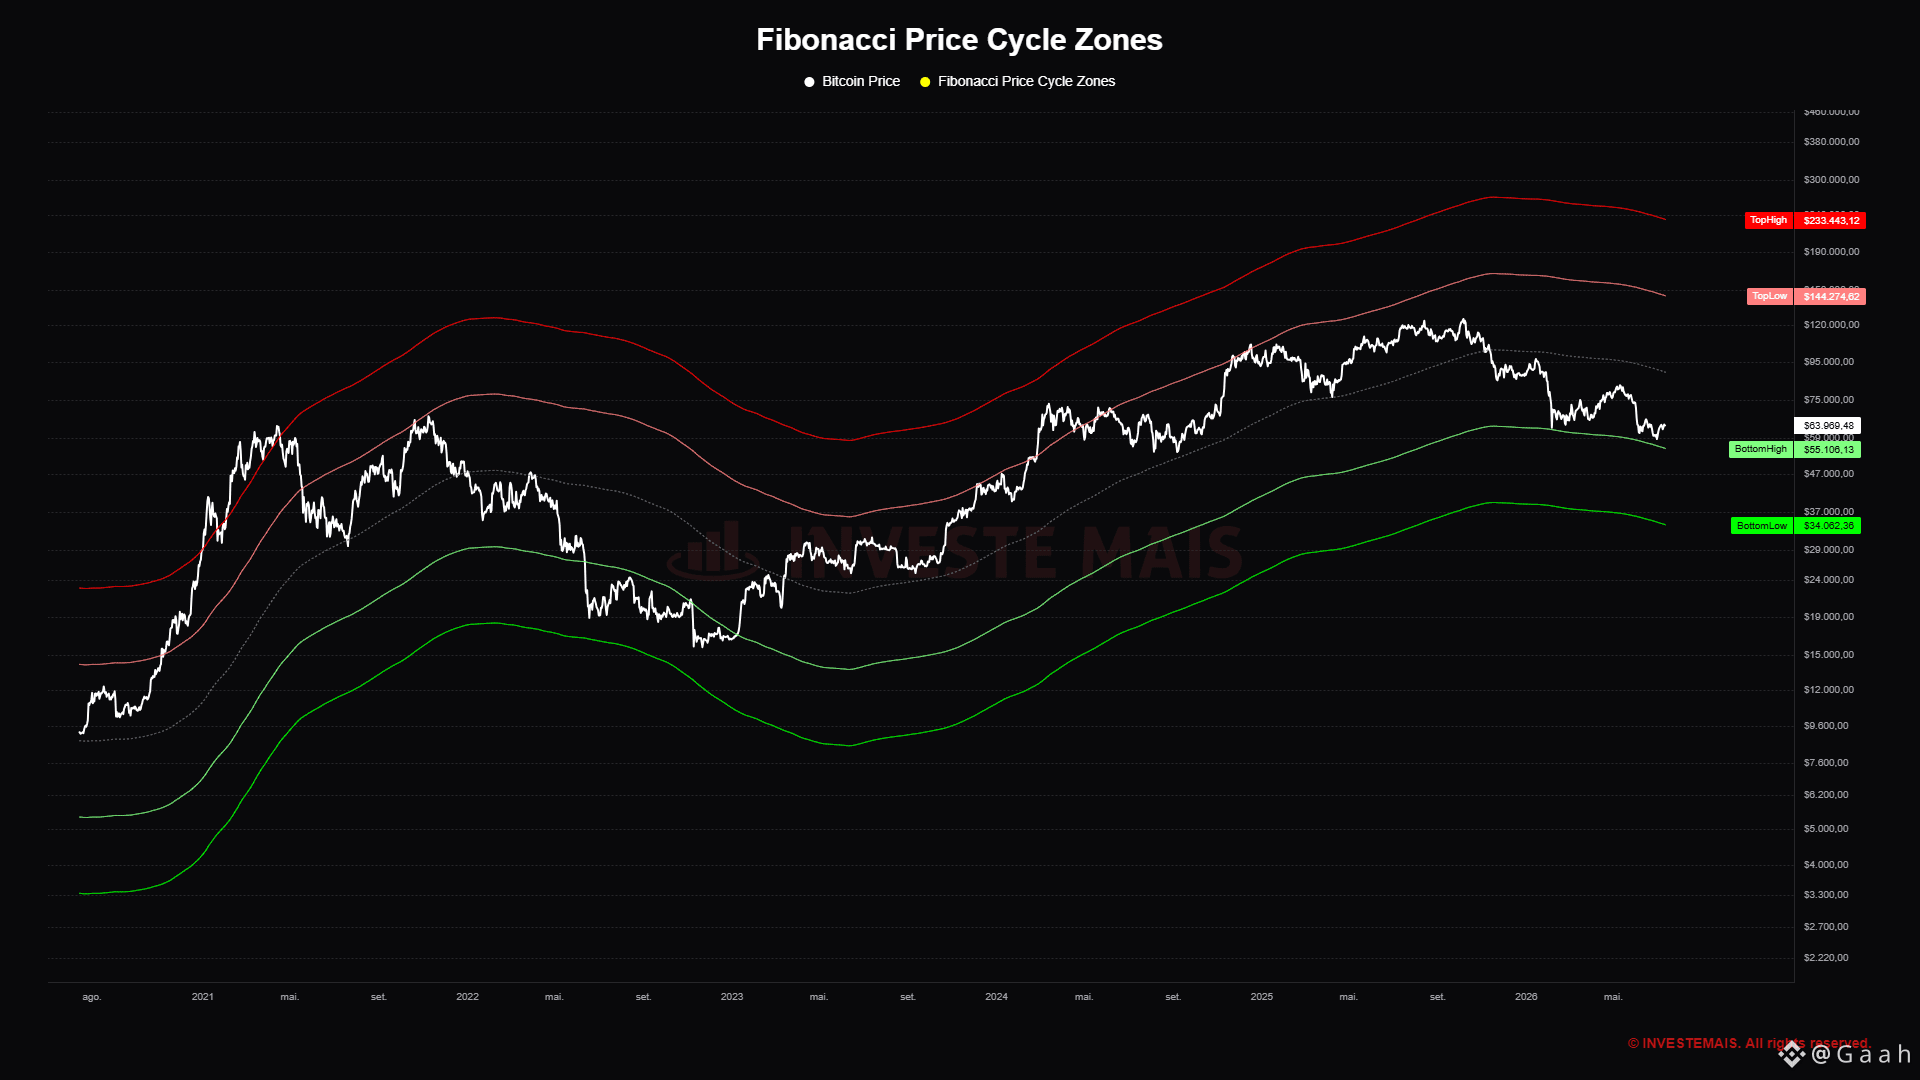
#bitcoin finding support at the High band🟢
This Fibonacci price zone was around $62k at the beginning of the year and as the price is now testing this range, which is currently around $55k
Historically #BTC bottoms have formed within the High-Low range.
However, the peak this cycle did not extend beyond the Top-Low band🔴 deviating from historical pattern and opening up the possibility that same behavior could occur in relation to formation of historical bottom.
#Fibonacci #technicalanalyst $BTC
{spot}(BTCUSDT)
#bitcoin finding support at the High band🟢
This Fibonacci price zone was around $62k at the beginning of the year and as the price is now testing this range, which is currently around $55k
Historically #BTC bottoms have formed within the High-Low range.
However, the peak this cycle did not extend beyond the Top-Low band🔴 deviating from historical pattern and opening up the possibility that same behavior could occur in relation to formation of historical bottom.
#Fibonacci #technicalanalyst $BTC
This Fibonacci price zone was around $62k at the beginning of the year and as the price is now testing this range, which is currently around $55k
Historically #BTC bottoms have formed within the High-Low range.
However, the peak this cycle did not extend beyond the Top-Low band🔴 deviating from historical pattern and opening up the possibility that same behavior could occur in relation to formation of historical bottom.
#Fibonacci #technicalanalyst $BTC
1
122
Көбірек контент көру үшін кіріңіз
Binance Square платформасында әлемдік криптоқоғамдастыққа қосылыңыз
⚡️ Криптовалюта туралы ең соңғы және пайдалы ақпаратты алыңыз.
💬 Әлемдегі ең ірі криптобиржаның сеніміне ие.
👍 Расталған авторлардың нақты пікірлерін табыңыз.
Электрондық пошта/телефон нөмірі
Трендтегі тақырыптар
1
#NFPWatch
10.6M рет көрілді
18,216 адам талқылап жатыр
2
#BitcoinFundingRateTriplesTo10%
26,748 рет көрілді
460 адам талқылап жатыр
3
#BitcoinSurpasses$86KUp2.99%
7,504 рет көрілді
52 адам талқылап жатыр
4
#ZcashFalls21%FromSeptemberPeak
23,896 рет көрілді
419 адам талқылап жатыр
5
#USSeptemberPayrollsAdd29KUnemploymentRises4.2%
18,232 рет көрілді
223 адам талқылап жатыр
6
#XRPPostsFirstThreeGreenMonthsInQ3
20,303 рет көрілді
424 адам талқылап жатыр
7
#BNBChainTokenizedStocksTop$1BAt30%Share
912 рет көрілді
26 адам талқылап жатыр
8
#BitcoinRisesToward$85K
63,674 рет көрілді
130 адам талқылап жатыр
9
#AmazonPlansToSell$8BNvidiaChips
6,339 рет көрілді
82 адам талқылап жатыр
10
#NEARFallsToAround$4.70Down14%
41,894 рет көрілді
107 адам талқылап жатыр