

#marketanalysis
marketanalysis
10.4M рет көрілді
63,029 адам талқылап жатыр
Қызу саудада
Ең соңғы

$INJ — okay, my read still says it still offers the cleaner bullish argument because the price is holding a clear higher-low pattern. The recent dip found support at a key prior base, and momentum readings suggest uptrend strength. A strong upward candle reclaiming that recent high confirms this direction.
The levels matter more than the prediction. Size it accordingly.
Execution plan (INJUSDT — LONG)
Entry: 8.632 - 8.688 | SL: 8.561
Take profit: 8.759 → 8.838 → 8.938
#MarketAnalysis
{future}(INJUSDT)
$INJ — okay, my read still says it still offers the cleaner bullish argument because the price is holding a clear higher-low pattern. The recent dip found support at a key prior base, and momentum readings suggest uptrend strength. A strong upward candle reclaiming that recent high confirms this direction.
The levels matter more than the prediction. Size it accordingly.
Execution plan (INJUSDT — LONG)
Entry: 8.632 - 8.688 | SL: 8.561
Take profit: 8.759 → 8.838 → 8.938
#MarketAnalysis
The levels matter more than the prediction. Size it accordingly.
Execution plan (INJUSDT — LONG)
Entry: 8.632 - 8.688 | SL: 8.561
Take profit: 8.759 → 8.838 → 8.938
#MarketAnalysis
13

·
--
📊 BNB Market Snapshot: Sellers Still Have the Advantage
$BNB BNB is trading around $720, down approximately 3% over the past 24 hours. Recent price action shows continued selling pressure after rejection near the $810 area.
📉 Market Data
• Current price: Around $720
• 24H high: $745
• 24H low: $709
• Market bias: Bearish
🔍 Key Levels to Watch
• Support: $708–700
• Resistance: $730–745
• Stronger resistance: $748–750
📌 What the Data Suggests:
A break below $700 could increase downside risk, while a recovery above $745–750 may signal improving momentum. Confirmation is important before making a trading decision.
⚠️ Data-based analysis is not a guaranteed prediction. Always manage your risk.🤷🏻♀️$BNB
{spot}(BNBUSDT)
#bnb #CryptoMarket #MarketAnalysis #BinanceSquare #cryptotrading
📊 BNB Market Snapshot: Sellers Still Have the Advantage
$BNB BNB is trading around $720, down approximately 3% over the past 24 hours. Recent price action shows continued selling pressure after rejection near the $810 area.
📉 Market Data
• Current price: Around $720
• 24H high: $745
• 24H low: $709
• Market bias: Bearish
🔍 Key Levels to Watch
• Support: $708–700
• Resistance: $730–745
• Stronger resistance: $748–750
📌 What the Data Suggests:
A break below $700 could increase downside risk, while a recovery above $745–750 may signal improving momentum. Confirmation is important before making a trading decision.
⚠️ Data-based analysis is not a guaranteed prediction. Always manage your risk.🤷🏻♀️$BNB
#bnb #CryptoMarket #MarketAnalysis #BinanceSquare #cryptotrading
43
$TAO — honestly, the chart still says it sits on my short-side watchlist as the price chops inside a tight range. The most recent candles show clear rejection at the upper limit, even though the overall daily trend is flat. For this short thesis to strengthen, we need a clean close underneath that range floor on a bearish bar. A strong push above the recent swing high would invalidate the current setup.
My levels for TAOUSDT — SHORT
Entry zone 260.22 - 261.26
Risk line 264.78
Targets 256.70 / 253.47 / 249.44
#MarketAnalysis
{future}(TAOUSDT)
$TAO — honestly, the chart still says it sits on my short-side watchlist as the price chops inside a tight range. The most recent candles show clear rejection at the upper limit, even though the overall daily trend is flat. For this short thesis to strengthen, we need a clean close underneath that range floor on a bearish bar. A strong push above the recent swing high would invalidate the current setup.
My levels for TAOUSDT — SHORT
Entry zone 260.22 - 261.26
Risk line 264.78
Targets 256.70 / 253.47 / 249.44
#MarketAnalysis
My levels for TAOUSDT — SHORT
Entry zone 260.22 - 261.26
Risk line 264.78
Targets 256.70 / 253.47 / 249.44
#MarketAnalysis
15

Мақала
📊 SPECIAL REPORT: The Highs & Lows of Today's Crypto Market(BTC’s Failed Breakout & $LAB Case StudyThe crypto market is always unpredictable, and over the past few hours, we have seen two very different scenarios unfold: on one side, Bitcoin is struggling with a major rejection, and on the other, a low-cap token ($LAB) is facing absolute devastation.
Let's do a deep dive into these two trending topics to keep your capital safe:
📉 Part 1: The Anatomy of a Failed Breakout (Bitcoin $87K ➡️ $81K?)
Bitcoin ($BTC) recently attempted to break out past the $87K mark, but the bulls couldn't hold the pressure, resulting in a failed breakout.
Rejection Details: The price faced a heavy rejection at $87K and is now sliding downward.
The Next Target: According to market analysis, the $81K support level is now the most crucial zone. If BTC dumps back toward $81K, it could become a major re-accumulation or buying zone for smart money.
The Lesson: When the market shows a "fakeout" at top patterns, you should always wait for a re-test instead of panic buying. Trading without a strict stop loss in this phase can be highly dangerous.
⚠️ Part 2: Token Risk Alert — The Downfall of $LAB (.060 Crash)
The second major trending topic exposes the dark reality of low-cap altcoins, with the $LAB token currently in the spotlight for all the wrong reasons.
The Crash: This coin started crashing hard near the .060 level and is now rapidly forming new lows.
Alleged Team Dump: According to community reports and analysts, the project's team has indiscriminately sold off their supply (printed coins) into the market, leaving buyers trapped with massive losses. When developers dump their own holdings to make money from thin air, the chances of a recovery pump are virtually zero.
The Warning Sign: Whenever you trade new or low-cap tokens, verifying their tokenomics (supply distribution) and the team's history is crucial. Never rely solely on hype or paid promotions!
💡 The Trader's Action Plan Today:
1. BTC Trend Watch: Keep a close eye on the $BTC correction and observe how the price action behaves near the $81K support level.
2. DYOR is Key: Only invest capital in low-cap coins that you are fully prepared to lose.
3. Protect Your Portfolio: Always stay away from projects where the founders or teams have a history of dumping on their communities.
💬 Let’s have an honest discussion:
Do you think BTC will bounce from the $81K level, or are we heading even lower? And have you ever suffered a loss due to a low-cap developer scam? Share your stories and thoughts in the comments below so others can stay safe! 👇👇
#Bitcoin #BTC #LAB #AltcoinAlert #MarketAnalysis #CryptoEducation #RiskManagement #BinanceSquare
📊 SPECIAL REPORT: The Highs & Lows of Today's Crypto Market(BTC’s Failed Breakout & $LAB Case Study
The crypto market is always unpredictable, and over the past few hours, we have seen two very different scenarios unfold: on one side, Bitcoin is struggling with a major rejection, and on the other, a low-cap token ($LAB) is facing absolute devastation.
Let's do a deep dive into these two trending topics to keep your capital safe:
📉 Part 1: The Anatomy of a Failed Breakout (Bitcoin $87K ➡️ $81K?)
Bitcoin ($BTC) recently attempted to break out past the $87K mark, but the bulls couldn't hold the pressure, resulting in a failed breakout.
Rejection Details: The price faced a heavy rejection at $87K and is now sliding downward.
The Next Target: According to market analysis, the $81K support level is now the most crucial zone. If BTC dumps back toward $81K, it could become a major re-accumulation or buying zone for smart money.
The Lesson: When the market shows a "fakeout" at top patterns, you should always wait for a re-test instead of panic buying. Trading without a strict stop loss in this phase can be highly dangerous.
⚠️ Part 2: Token Risk Alert — The Downfall of $LAB (.060 Crash)
The second major trending topic exposes the dark reality of low-cap altcoins, with the $LAB token currently in the spotlight for all the wrong reasons.
The Crash: This coin started crashing hard near the .060 level and is now rapidly forming new lows.
Alleged Team Dump: According to community reports and analysts, the project's team has indiscriminately sold off their supply (printed coins) into the market, leaving buyers trapped with massive losses. When developers dump their own holdings to make money from thin air, the chances of a recovery pump are virtually zero.
The Warning Sign: Whenever you trade new or low-cap tokens, verifying their tokenomics (supply distribution) and the team's history is crucial. Never rely solely on hype or paid promotions!
💡 The Trader's Action Plan Today:
1. BTC Trend Watch: Keep a close eye on the $BTC correction and observe how the price action behaves near the $81K support level.
2. DYOR is Key: Only invest capital in low-cap coins that you are fully prepared to lose.
3. Protect Your Portfolio: Always stay away from projects where the founders or teams have a history of dumping on their communities.
💬 Let’s have an honest discussion:
Do you think BTC will bounce from the $81K level, or are we heading even lower? And have you ever suffered a loss due to a low-cap developer scam? Share your stories and thoughts in the comments below so others can stay safe! 👇👇
#Bitcoin #BTC #LAB #AltcoinAlert #MarketAnalysis #CryptoEducation #RiskManagement #BinanceSquare
390
$AVAX — ngl, the cleanest read is that it is one rejection away from a cleaner short as it holds tight inside its current consolidation box. Upper wicks bumping into resistance on the fifteen-minute chart, combined with lower volume activity, suggests sellers are in control here. A sustained break below the range floor would give this bearish bias more weight.
Would you take it here, or wait for one more confirmation candle?
AVAXUSDT SHORT map
Entry → 9.621 - 9.655
SL → 9.758
TP → 9.518 · 9.422 · 9.302
#MarketAnalysis
{future}(AVAXUSDT)
$AVAX — ngl, the cleanest read is that it is one rejection away from a cleaner short as it holds tight inside its current consolidation box. Upper wicks bumping into resistance on the fifteen-minute chart, combined with lower volume activity, suggests sellers are in control here. A sustained break below the range floor would give this bearish bias more weight.
Would you take it here, or wait for one more confirmation candle?
AVAXUSDT SHORT map
Entry → 9.621 - 9.655
SL → 9.758
TP → 9.518 · 9.422 · 9.302
#MarketAnalysis
Would you take it here, or wait for one more confirmation candle?
AVAXUSDT SHORT map
Entry → 9.621 - 9.655
SL → 9.758
TP → 9.518 · 9.422 · 9.302
#MarketAnalysis
5

·
--
🌙 CRYPTO NIGHT WATCH: IS THE MARKET READY FOR ITS NEXT MOVE? 👀
Bitcoin briefly moved above $84K before settling near $83K, while market uncertainty continues to keep traders alert. A rebound is encouraging, but confirmation matters more than a single price move. 📊
🔎 3 ALTCOINS ON MY RADAR TONIGHT
🔹 $RENDER — Can buyers regain momentum after recent volatility?
🔹 $ADA — Will buyers step in to support the next move?
🔹 $INJ — Can it show relative strength if market sentiment improves?
⚡ WHAT I'M WATCHING • Bitcoin's ability to hold above $83K
• Trading volume behind any breakout
• Whether altcoins follow through or fade
💬 TONIGHT'S QUESTION: Are we seeing the start of a recovery, or is this just a temporary bounce? What’s your view?
Need market analysis? Comment below. 👇
#CryptoMarket #AltcoinWatch #MarketAnalysis #TradingInsights #BinanceSquare
{future}(RENDERUSDT)
{future}(ADAUSDT)
{future}(INJUSDT)
🌙 CRYPTO NIGHT WATCH: IS THE MARKET READY FOR ITS NEXT MOVE? 👀
Bitcoin briefly moved above $84K before settling near $83K, while market uncertainty continues to keep traders alert. A rebound is encouraging, but confirmation matters more than a single price move. 📊
🔎 3 ALTCOINS ON MY RADAR TONIGHT
🔹 $RENDER — Can buyers regain momentum after recent volatility?
🔹 $ADA — Will buyers step in to support the next move?
🔹 $INJ — Can it show relative strength if market sentiment improves?
⚡ WHAT I'M WATCHING • Bitcoin's ability to hold above $83K
• Trading volume behind any breakout
• Whether altcoins follow through or fade
💬 TONIGHT'S QUESTION: Are we seeing the start of a recovery, or is this just a temporary bounce? What’s your view?
Need market analysis? Comment below. 👇
#CryptoMarket #AltcoinWatch #MarketAnalysis #TradingInsights #BinanceSquare
1
305
📊 BTC Market Update - 14 Oct
$BTC is holding $111k-$112k zone strongly!
Key Levels to Watch:
Support: $110,500
Resistance: $113,000
If BTC breaks $113K, next target $115K
If breaks $110.5K, we may see $108K
Altcoins are waiting for BTC breakout, don't panic sell!
What's your target for today? 👇
#BTC #bitcoin #MarketAnalysis #CryptoUpdate #Trading
{spot}(BTCUSDT)
📊 BTC Market Update - 14 Oct
$BTC is holding $111k-$112k zone strongly!
Key Levels to Watch:
Support: $110,500
Resistance: $113,000
If BTC breaks $113K, next target $115K
If breaks $110.5K, we may see $108K
Altcoins are waiting for BTC breakout, don't panic sell!
What's your target for today? 👇
#BTC #bitcoin #MarketAnalysis #CryptoUpdate #Trading
79
$FIL needs the buy-side reaction to confirm momentum is picking up after forming higher lows within its trading zone. The strong bullish body on the most recent candle suggests buying pressure is taking over, aligning with the overall bullish view on the longer timeframes. A close above the local swing high would solidify this directional move.
No chase outside the zone; the stop defines the whole idea.
FILUSDT | LONG
Entry 1.1486 - 1.1556
Invalidation 1.1369
Targets 1.1673 / 1.1794 / 1.1945
#MarketAnalysis
{future}(FILUSDT)
$FIL needs the buy-side reaction to confirm momentum is picking up after forming higher lows within its trading zone. The strong bullish body on the most recent candle suggests buying pressure is taking over, aligning with the overall bullish view on the longer timeframes. A close above the local swing high would solidify this directional move.
No chase outside the zone; the stop defines the whole idea.
FILUSDT | LONG
Entry 1.1486 - 1.1556
Invalidation 1.1369
Targets 1.1673 / 1.1794 / 1.1945
#MarketAnalysis
No chase outside the zone; the stop defines the whole idea.
FILUSDT | LONG
Entry 1.1486 - 1.1556
Invalidation 1.1369
Targets 1.1673 / 1.1794 / 1.1945
#MarketAnalysis
24
$AVAX — ngl, the cleanest read is that it keeps me focused on the downside response as the short-term swings trace out lower highs against a bearish four-hour backdrop. The most recent price action shows clear rejection at the upper limit, and momentum is leaning negative in the shorter timeframes. A close falling below the immediate short-term support would confirm the bearish bias.
Levels — AVAXUSDT
Zone: 10.304 - 10.344
Cut: 10.390
Scale: 10.258 | 10.206 | 10.140
#MarketAnalysis
{future}(AVAXUSDT)
$AVAX — ngl, the cleanest read is that it keeps me focused on the downside response as the short-term swings trace out lower highs against a bearish four-hour backdrop. The most recent price action shows clear rejection at the upper limit, and momentum is leaning negative in the shorter timeframes. A close falling below the immediate short-term support would confirm the bearish bias.
Levels — AVAXUSDT
Zone: 10.304 - 10.344
Cut: 10.390
Scale: 10.258 | 10.206 | 10.140
#MarketAnalysis
Levels — AVAXUSDT
Zone: 10.304 - 10.344
Cut: 10.390
Scale: 10.258 | 10.206 | 10.140
#MarketAnalysis
15
$HOME has my attention on the sell side because the structure shows lower highs developing as we respect a descending trendline. Chasing upward feels unattractive given the bearish tilt across the short-term charts. We need a decisive close breaking below the consolidation floor to confirm the path, otherwise a strong close over resistance invalidates the setup.
A clean invalidation ends the thesis — no averaging into it.
SHORT plan for HOMEUSDT
0.005272 - 0.005298 entry | 0.005321 stop
0.005249 → 0.005220 → 0.005184
#MarketAnalysis
{future}(HOMEUSDT)
$HOME has my attention on the sell side because the structure shows lower highs developing as we respect a descending trendline. Chasing upward feels unattractive given the bearish tilt across the short-term charts. We need a decisive close breaking below the consolidation floor to confirm the path, otherwise a strong close over resistance invalidates the setup.
A clean invalidation ends the thesis — no averaging into it.
SHORT plan for HOMEUSDT
0.005272 - 0.005298 entry | 0.005321 stop
0.005249 → 0.005220 → 0.005184
#MarketAnalysis
A clean invalidation ends the thesis — no averaging into it.
SHORT plan for HOMEUSDT
0.005272 - 0.005298 entry | 0.005321 stop
0.005249 → 0.005220 → 0.005184
#MarketAnalysis
15
$INJ requires patience before the long is actionable. The price made a clear low and is now showing a sequence of higher lows on lower timeframes. Strength here depends on taking out the recent swing high to confirm the shift.
A clean invalidation ends the thesis — no averaging into it.
INJUSDT LONG map
Entry → 8.024 - 8.072
SL → 7.936
TP → 8.160 · 8.250 · 8.363
#MarketAnalysis
{future}(INJUSDT)
$INJ requires patience before the long is actionable. The price made a clear low and is now showing a sequence of higher lows on lower timeframes. Strength here depends on taking out the recent swing high to confirm the shift.
A clean invalidation ends the thesis — no averaging into it.
INJUSDT LONG map
Entry → 8.024 - 8.072
SL → 7.936
TP → 8.160 · 8.250 · 8.363
#MarketAnalysis
A clean invalidation ends the thesis — no averaging into it.
INJUSDT LONG map
Entry → 8.024 - 8.072
SL → 7.936
TP → 8.160 · 8.250 · 8.363
#MarketAnalysis
66
$INJ is still tilted toward buyers as the daily trend maintains a clear upward slant. We are above the recent low and the four-hour trend supports holding ground, though shorter timeframes show some weakness. A strong move up above the recent short-term resistance would confirm buying interest, while a close beneath the range floor would suggest sellers have taken over.
I am tracking the reaction inside the entry zone. What would make you pass on it?
Execution plan (INJUSDT — LONG)
Entry: 7.283 - 7.333 | SL: 7.198
Take profit: 7.418 → 7.505 → 7.615
#MarketAnalysis
{future}(INJUSDT)
$INJ is still tilted toward buyers as the daily trend maintains a clear upward slant. We are above the recent low and the four-hour trend supports holding ground, though shorter timeframes show some weakness. A strong move up above the recent short-term resistance would confirm buying interest, while a close beneath the range floor would suggest sellers have taken over.
I am tracking the reaction inside the entry zone. What would make you pass on it?
Execution plan (INJUSDT — LONG)
Entry: 7.283 - 7.333 | SL: 7.198
Take profit: 7.418 → 7.505 → 7.615
#MarketAnalysis
I am tracking the reaction inside the entry zone. What would make you pass on it?
Execution plan (INJUSDT — LONG)
Entry: 7.283 - 7.333 | SL: 7.198
Take profit: 7.418 → 7.505 → 7.615
#MarketAnalysis
17

·
--
Bunker Mode Holds Steady in a Quiet Market 🌐
Price action: $BUNKER is trading around $0.0478 on Binance Spot, up 2.1 % in the last 24 hours with roughly $4.2 M of volume. The token has been inching sideways after a modest rally, reflecting the broader neutral sentiment across Asian crypto desks.
Key levels: Immediate resistance clusters near $0.052‑$0.055, while the current price sits at the mid‑range pivot around $0.0478. Primary support is anchored at $0.043, a level that held during the previous pull‑back; a secondary cushion lies near $0.039. A break below $0.043 could open the path to the next support zone, whereas holding above it keeps the current consolidation intact.
Outlook: With market sentiment flat and no clear catalyst, $BUNKER is likely to remain in a tight range. Traders should watch for a decisive break either above $0.055 or below $0.039 to signal the next directional move. Until then, a cautious wait‑and‑see approach is advisable.
#CryptoUpdate #BunkerMode #MarketAnalysis
4
$AAVE needs the buy-side reaction to confirm the bias because it is currently building a higher low after pulling back into a key consolidation zone. The positive structure is the underlying bullish trend on the daily chart. This thesis weakens if the price fails to hold that newly established higher low.
AAVEUSDT LONG
IN 171.67 - 172.01
OUT 170.86
TP 172.82 · 173.60 · 174.58
#MarketAnalysis
{future}(AAVEUSDT)
$AAVE needs the buy-side reaction to confirm the bias because it is currently building a higher low after pulling back into a key consolidation zone. The positive structure is the underlying bullish trend on the daily chart. This thesis weakens if the price fails to hold that newly established higher low.
AAVEUSDT LONG
IN 171.67 - 172.01
OUT 170.86
TP 172.82 · 173.60 · 174.58
#MarketAnalysis
AAVEUSDT LONG
IN 171.67 - 172.01
OUT 170.86
TP 172.82 · 173.60 · 174.58
#MarketAnalysis
7

$WDCB 📊 WDCB — MARKET ANALYSIS
WDCB, a tokenized Western Digital stock product, is showing a possible recovery after recent selling pressure.
🔴 Resistance: $400–$405
🔴 Next Resistance: $415–$420
🟢 Support: $390–$395
🟢 Lower Support: $380–$385
📈 Bullish scenario: A strong move above $405 with volume could open the way toward $415–$420.
📉 Bearish scenario: Losing the $390 support zone could bring $380–$385 into focus.
Key takeaway: Watch the $390–$405 range for confirmation. These are approximate technical zones, not guaranteed targets.
Verify the latest Binance price and candles before posting.
#WDCB #TokenizedStocks
#MarketAnalysis #Binance
{future}(WDCUSDT)
$WDCB 📊 WDCB — MARKET ANALYSIS
WDCB, a tokenized Western Digital stock product, is showing a possible recovery after recent selling pressure.
🔴 Resistance: $400–$405
🔴 Next Resistance: $415–$420
🟢 Support: $390–$395
🟢 Lower Support: $380–$385
📈 Bullish scenario: A strong move above $405 with volume could open the way toward $415–$420.
📉 Bearish scenario: Losing the $390 support zone could bring $380–$385 into focus.
Key takeaway: Watch the $390–$405 range for confirmation. These are approximate technical zones, not guaranteed targets.
Verify the latest Binance price and candles before posting.
#WDCB #TokenizedStocks
#MarketAnalysis #Binance
79

🎯 Bitcoin Holds Steady Near $83K: Eyes Shift to Solana's Next Move!
Good afternoon, Traders! 🔍
Bitcoin ($BTC ) continues to trade in a tight range around $83,000, creating stability across the wider crypto market. When BTC consolidates at high valuation levels, market capital frequently rotates into major altcoins.
Solana ($SOL ) is testing key resistance near $205, supported by steady DEX volume. A sustained move above $208 could spark fresh altcoin buying momentum.
📊 Market Outlook:
1️⃣ BTC Range: $82,500 - $84,000
2️⃣ SOL Target: $210+
3️⃣ Market Dynamic: Capital rotation from BTC to high-cap altcoins.
💬 Question: Which altcoin are you expecting to lead the next rally? Share your pick! 👇
{future}(BTCUSDT)
{future}(SOLUSDT)
#Bitcoin #Solana #CryptoNews #MarketAnalysis #BinanceSquare
🎯 Bitcoin Holds Steady Near $83K: Eyes Shift to Solana's Next Move!
Good afternoon, Traders! 🔍
Bitcoin ($BTC ) continues to trade in a tight range around $83,000, creating stability across the wider crypto market. When BTC consolidates at high valuation levels, market capital frequently rotates into major altcoins.
Solana ($SOL ) is testing key resistance near $205, supported by steady DEX volume. A sustained move above $208 could spark fresh altcoin buying momentum.
📊 Market Outlook:
1️⃣ BTC Range: $82,500 - $84,000
2️⃣ SOL Target: $210+
3️⃣ Market Dynamic: Capital rotation from BTC to high-cap altcoins.
💬 Question: Which altcoin are you expecting to lead the next rally? Share your pick! 👇
#Bitcoin #Solana #CryptoNews #MarketAnalysis #BinanceSquare
113

🚀 BTC Market Analysis: What’s Next for Bitcoin? 📈
Bitcoin is showing strong momentum after holding key support at $60,000–$62,000, with the next major resistance zone at $68,000–$70,000; the short-term trend may remain bullish if BTC holds above support, but always confirm your setup and manage risk before trading. #Bitcoin #BTC #CryptoTrading #BinanceSquare #MarketAnalysis #CryptoNews #tradingStrategy
Bitcoin is showing strong momentum after holding key support at $60,000–$62,000, with the next major resistance zone at $68,000–$70,000; the short-term trend may remain bullish if BTC holds above support, but always confirm your setup and manage risk before trading. #Bitcoin #BTC #CryptoTrading #BinanceSquare #MarketAnalysis #CryptoNews #tradingStrategy
72

·
--
Жоғары (өспелі)
#BitcoinRecoversTo$82K Bitcoin just reclaimed $82k, and if you’ve tracked the order flow, this recovery wasn’t random. Let’s break down the mechanics behind this move and what it signals for current market structure.
The Context:
Earlier this week, we saw a classic liquidity sweep below $79k. Retail was shaken out while institutions accumulated. The push back above $82k is a structural reclaim of a major psychological pivot, not just a relief rally.
Technical Outlook:
Holding $82k is critical. It flipped from heavy resistance to immediate support. However, watch for sustained volume on the daily close. If volume dries up, we risk a bull trap back into the $78k-$80k demand zone.
Trader’s Playbook:
1. Avoid FOMOing into green candles. The market rewards patience.
2. Watch $84.5k resistance. A high-volume break opens the path to price discovery.
3. Manage risk tightly. Volatility is expanding, and wicks will hunt over-leveraged positions.
The macro trend remains intact, but respect the chop. Capital preservation is your true edge.
What’s your next key level for BTC? Marching to $85k or consolidating? Drop your analysis below. 👇
Educational purposes only. Not financial advice. Always DYOR and manage risk.
#Bitcoin #BTC #CryptoTrading #MarketAnalysis
$ARB $MARSCOIN $SOLV
{future}(SOLVUSDT)
{future}(MARSCOINUSDT)
{future}(ARBUSDT)
#BitcoinRecoversTo$82K Bitcoin just reclaimed $82k, and if you’ve tracked the order flow, this recovery wasn’t random. Let’s break down the mechanics behind this move and what it signals for current market structure.
The Context:
Earlier this week, we saw a classic liquidity sweep below $79k. Retail was shaken out while institutions accumulated. The push back above $82k is a structural reclaim of a major psychological pivot, not just a relief rally.
Technical Outlook:
Holding $82k is critical. It flipped from heavy resistance to immediate support. However, watch for sustained volume on the daily close. If volume dries up, we risk a bull trap back into the $78k-$80k demand zone.
Trader’s Playbook:
1. Avoid FOMOing into green candles. The market rewards patience.
2. Watch $84.5k resistance. A high-volume break opens the path to price discovery.
3. Manage risk tightly. Volatility is expanding, and wicks will hunt over-leveraged positions.
The macro trend remains intact, but respect the chop. Capital preservation is your true edge.
What’s your next key level for BTC? Marching to $85k or consolidating? Drop your analysis below. 👇
Educational purposes only. Not financial advice. Always DYOR and manage risk.
#Bitcoin #BTC #CryptoTrading #MarketAnalysis
$ARB $MARSCOIN $SOLV
1
327

·
--
BTC 反弹了,就代表安全了吗?先别急着开香槟
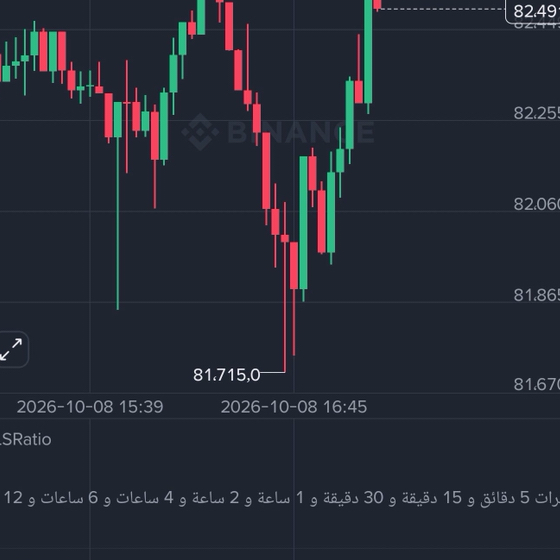
BTC 曾短暂跌破 $80,000,随后迅速反弹至 $82,000 上方
看起来,买盘出手了
价格反弹,只能证明有人愿意买,不代表市场已经重新转强
这次下跌背后,有几个值得关注的因素:
📌 1. 通胀压力还没消失
美国 9 月 CPI 年增 3.7%,高于市场预期。通胀如果持续偏热,美联储的降息空间可能受限,甚至重新引发加息担忧
对 BTC 这样的风险资产来说,宏观环境依然重要
📌 2. $80K 是观察位,不是魔法防护罩
BTC 跌破 $80K 后迅速收复,说明这个区域出现了买盘
但真正值得观察的是:价格能不能持续站稳 $80K–$81.5K,并进一步挑战 $83K–$84K 一带的阻力
收复关键位置是一回事,站稳并延续上涨是另一回事
📌 3. 接下来,看三种情景
🟢 Bullish:守住支撑,持续出现买盘,并有效突破上方阻力,反弹才更有说服力
🟡 Neutral:*在支撑与阻力之间反复震荡,说明多空还在拉扯
🔴 Bearish:再次跌破 $80K,且无法快速收复,就要提防卖压重新扩大
我的观点很简单:
不要因为一根反弹 K 线,就急着宣布趋势反转
市场最会做的事情,就是在你刚刚建立信心的时候,再给你上一课
比起猜 BTC 下一秒涨还是跌,我更在意的是:关键位置有没有守住,买盘有没有持续,以及价格突破后能不能站稳
交易不是比谁最乐观,而是比谁能在判断错误时及时修正
大家觉得这次 BTC 的反弹,是 Real Recovery 还是暂时的 Relief Rally ?
#BTC #bitcoin #MarketAnalysis
66

Көбірек контент көру үшін кіріңіз
Binance Square платформасында әлемдік криптоқоғамдастыққа қосылыңыз
⚡️ Криптовалюта туралы ең соңғы және пайдалы ақпаратты алыңыз.
💬 Әлемдегі ең ірі криптобиржаның сеніміне ие.
👍 Расталған авторлардың нақты пікірлерін табыңыз.
Электрондық пошта/телефон нөмірі
Трендтегі тақырыптар
1
#BitcoinShortTermHoldersReach4.08MBTC
10,472 рет көрілді
286 адам талқылап жатыр
2
#BitcoinRecoversTo$82K
50,362 рет көрілді
99 адам талқылап жатыр
3
#OctoberFedHikeOddsFallToAround17%
5,982 рет көрілді
196 адам талқылап жатыр
4
#NEARRisesNearly10%
86,999 рет көрілді
761 адам талқылап жатыр
5
#SouthKoreaTightensOversightOfOverseasPerpetualContracts
2,663 рет көрілді
47 адам талқылап жатыр
6
#RiksbankUrgesLawmakersToPrepareDigitalKronaLegislation
2,608 рет көрілді
57 адам талқылап жатыр
7
#AIAndSemiconductorStocksLoseOver$1TThisWeek
3,691 рет көрілді
52 адам талқылап жатыр
8
#AustraliaProposesCryptoTransactionReportingLaw
62,892 рет көрілді
866 адам талқылап жатыр
9
#SolanaAlpenglowUpgradeToActivateOnOct21
41,161 рет көрілді
710 адам талқылап жатыр
10
#USSeptemberPPIRisesTo6.3%
33,654 рет көрілді
566 адам талқылап жатыр