

#bitcoinslipsbelow$80kagain
bitcoinslipsbelow$80kagain
Қызу саудада
Ең соңғы

·
--
Жоғары (өспелі)
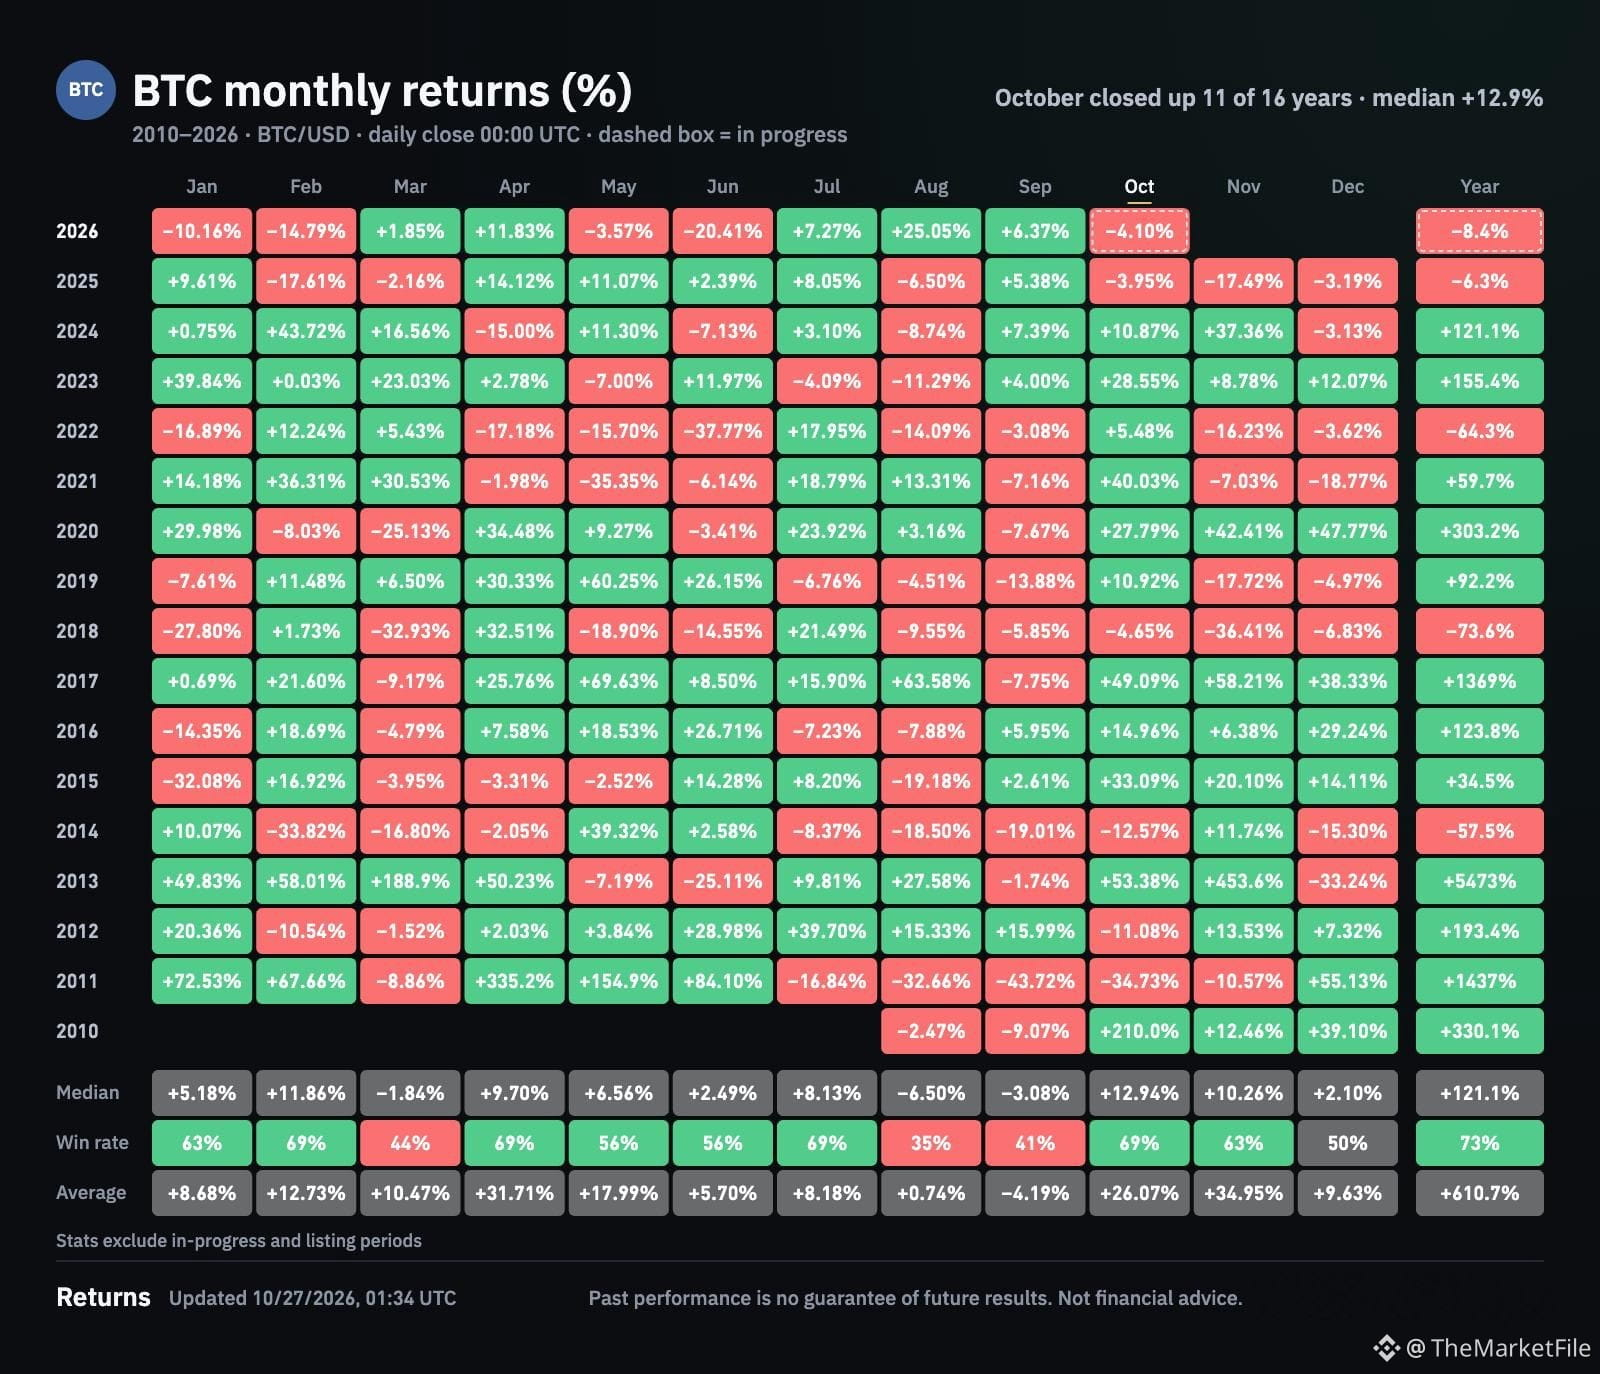
🚨 Bitcoin is heading for a red October.
Our thesis: the bear-market bottom is behind us.
Are sellers exhausted—or are bulls ignoring a weak chart?
THE MARKET FILE — RED MONTH, BULLISH THESIS
October 27, 2026
BTC is down roughly 4.1% this month. October hasn’t closed yet.
Four arguments support the bullish case. Each has limits. 👇
📊 1️⃣ LONG-TERM STRUCTURE
BTC reclaimed its 50-week moving average after 44 weeks below it, then posted five weekly closes above it through October 18.
Four comparable historical cases support the thesis—but remain a small sample.
🏦 2️⃣ POSITIONING RESET
Asset managers’ net long exposure in CME BTC futures fell 57% from the all-time-high week.
U.S. spot ETFs added about 87,000 BTC from the June low through the report’s cutoff.
Demand persisted as speculative positions unwound. That doesn’t prove selling is over.
👥 3️⃣ POSSIBLE CAPITULATION
Roughly 30,000 fewer addresses held BTC balances since October 16.
A potential contrarian bottom signal—but addresses aren’t individual investors. Transfers and consolidation also affect the count.
💵 4️⃣ MACRO SUPPORT
High U.S. debt and persistent deficits strengthen the long-term case for a scarce asset.
This thesis plays out over years, not days.
⚠️ HISTORY ISN’T A PROMISE
October was positive in 10 of 13 years from 2013–2025. Yet October 2025 lost 3.95%.
Seasonality won’t save a weak trade.
👀 THE MARKET FILE’S TEST
• Hold $80K and reclaim ~$82.5K: stronger bottom case.
• Sustained break below $79K: weaker case.
These are conditions, not guaranteed floors or targets.
📖 MY READ:
A bullish thesis needs to explain what would prove it wrong.
💬 Accumulation—or a bullish story to justify falling prices?
Name ONE signal that would change your mind.
$BTC
{future}(BTCUSDT)
#bitcoin #BTCanalysis #CryptoMarket #BitcoinSlipsBelow$80KAgain
🚨 Bitcoin is heading for a red October.
Our thesis: the bear-market bottom is behind us.
Are sellers exhausted—or are bulls ignoring a weak chart?
THE MARKET FILE — RED MONTH, BULLISH THESIS
October 27, 2026
BTC is down roughly 4.1% this month. October hasn’t closed yet.
Four arguments support the bullish case. Each has limits. 👇
📊 1️⃣ LONG-TERM STRUCTURE
BTC reclaimed its 50-week moving average after 44 weeks below it, then posted five weekly closes above it through October 18.
Four comparable historical cases support the thesis—but remain a small sample.
🏦 2️⃣ POSITIONING RESET
Asset managers’ net long exposure in CME BTC futures fell 57% from the all-time-high week.
U.S. spot ETFs added about 87,000 BTC from the June low through the report’s cutoff.
Demand persisted as speculative positions unwound. That doesn’t prove selling is over.
👥 3️⃣ POSSIBLE CAPITULATION
Roughly 30,000 fewer addresses held BTC balances since October 16.
A potential contrarian bottom signal—but addresses aren’t individual investors. Transfers and consolidation also affect the count.
💵 4️⃣ MACRO SUPPORT
High U.S. debt and persistent deficits strengthen the long-term case for a scarce asset.
This thesis plays out over years, not days.
⚠️ HISTORY ISN’T A PROMISE
October was positive in 10 of 13 years from 2013–2025. Yet October 2025 lost 3.95%.
Seasonality won’t save a weak trade.
👀 THE MARKET FILE’S TEST
• Hold $80K and reclaim ~$82.5K: stronger bottom case.
• Sustained break below $79K: weaker case.
These are conditions, not guaranteed floors or targets.
📖 MY READ:
A bullish thesis needs to explain what would prove it wrong.
💬 Accumulation—or a bullish story to justify falling prices?
Name ONE signal that would change your mind.
$BTC
#bitcoin #BTCanalysis #CryptoMarket #BitcoinSlipsBelow$80KAgain
ABO3ZAM:
تحليلك واقعي، السوق حالياً يختبر صبرنا عند الـ 79 ألف، كسرها يعني بنشوف سيولة تطلع من السوق والوضع بيصير حرج. ننتظر إغلاق الشمعة ونشوف الوضع 🤝
2
2
861

·
--

Мақала
Will Bitcoin Slip Below $80K Again? Analyzing the Post-ATH Liquidity ShiftAs the dust settles on Bitcoin’s explosive price discovery phase, the market is navigating a complex period of consolidation. The overarching question on every trader's mind is no longer how high it will go, but whether we will re-test the critical $80,000 psychological and technical support zone. The market setup is unique, following a surge that left significant "gaps" and liquidity imbalances, leading to a subtle but distinct shift toward altcoins as capital begins to rotate into perceived higher-beta opportunities.
Analyzing the current chart, a classic pattern is emerging. After breaching major resistance, a period of liquidity building is visible across top-tier layer protocols and established DeFi ecosystems. This trend signals that while the Bitcoin narrative remains strong, capital momentum is being diverted, increasing the risk of a technical "sweep" of lower levels to clean up leveraged positions. Market volatility, often suppressed during a relentless grind up, is now building. Technical indicators suggest that any failure to reclaim immediate overhead resistance could trigger a re-distribution phase, a scenario that historically sees Bitcoin test previous support levels to establish a firmer foundation for the next leg.
This is where the significance of the $80,000 level comes into play. It represents not just a critical round number but is also a major Fibonacci confluence area and a cluster of high trading volume in the original leg up. A slip below this mark, even a brief wick, would likely trigger a domino effect of liquidation cascades, flushing out recent momentum buyers. However, from a macro perspective, such a movement would be considered healthy. It allows the market to reset its leverage and, importantly, presents the kind of well-researched macro insight that creators on Binance Square are now incentivized to cover, thanks to the newly updated Write to Earn model which rewards organic community engagement alongside trading fee commissions.#BitcoinSlipsBelow$80KAgain $
In conclusion, the probability of a Bitcoin re-test below $80K is not to be dismissed. The market has left footprints of liquidity that smart money often seeks out before committing to a larger, sustained move. While a correction to this level might cause short-term panic, it is a vital part of the cycle. For creators and traders alike, this volatile environment offers unique opportunities for both analysis and reward. What key technical indicators are guiding your entries during this phase, and are you actively using a $80K test as a primary buying signal, or focusing on altcoin rotation opportunities? Share your strategy in the comments! #CryptoAnalysis #BinanceSquare #WriteToEarn #Bitcoin #MarketUpdate
Will Bitcoin Slip Below $80K Again? Analyzing the Post-ATH Liquidity Shift
As the dust settles on Bitcoin’s explosive price discovery phase, the market is navigating a complex period of consolidation. The overarching question on every trader's mind is no longer how high it will go, but whether we will re-test the critical $80,000 psychological and technical support zone. The market setup is unique, following a surge that left significant "gaps" and liquidity imbalances, leading to a subtle but distinct shift toward altcoins as capital begins to rotate into perceived higher-beta opportunities.
Analyzing the current chart, a classic pattern is emerging. After breaching major resistance, a period of liquidity building is visible across top-tier layer protocols and established DeFi ecosystems. This trend signals that while the Bitcoin narrative remains strong, capital momentum is being diverted, increasing the risk of a technical "sweep" of lower levels to clean up leveraged positions. Market volatility, often suppressed during a relentless grind up, is now building. Technical indicators suggest that any failure to reclaim immediate overhead resistance could trigger a re-distribution phase, a scenario that historically sees Bitcoin test previous support levels to establish a firmer foundation for the next leg.
This is where the significance of the $80,000 level comes into play. It represents not just a critical round number but is also a major Fibonacci confluence area and a cluster of high trading volume in the original leg up. A slip below this mark, even a brief wick, would likely trigger a domino effect of liquidation cascades, flushing out recent momentum buyers. However, from a macro perspective, such a movement would be considered healthy. It allows the market to reset its leverage and, importantly, presents the kind of well-researched macro insight that creators on Binance Square are now incentivized to cover, thanks to the newly updated Write to Earn model which rewards organic community engagement alongside trading fee commissions.#BitcoinSlipsBelow$80KAgain $
In conclusion, the probability of a Bitcoin re-test below $80K is not to be dismissed. The market has left footprints of liquidity that smart money often seeks out before committing to a larger, sustained move. While a correction to this level might cause short-term panic, it is a vital part of the cycle. For creators and traders alike, this volatile environment offers unique opportunities for both analysis and reward. What key technical indicators are guiding your entries during this phase, and are you actively using a $80K test as a primary buying signal, or focusing on altcoin rotation opportunities? Share your strategy in the comments! #CryptoAnalysis #BinanceSquare #WriteToEarn #Bitcoin #MarketUpdate
316

·
--
Төмен (кемімелі)
BTC Is Bleeding While the Whale W Move Out — Stacked Against a Corporate Bid
Seven days of downside, and it wasn't retail that drove.
The: BTC closed ~79,796 on Oct27, down ~2.6% over 7 days and ~5.2% over 30 days. Daily RSI(12) sits at 39.8. The week's range: high ~84,377 (Oct 22), low ~79,220 (Oct 24). No capitulation candle. No reclaim of 84K. Just grind.
The supply side is doing the talking. Dormant wallets moved 2,571 BTC (~$206.5M) toward institutional exchanges. That is supply arriving at the venue, not leaving it. Treasury appetite also cooled — Strategy redirected $204.9M into share buybacks instead of BTC.
The bid underneath is corporate, not speculative. Strive acquired 6,182 BTC (~$511.4M); public firms added 6,200+ BTC combined. That is a real floor argument near $79.7K — but it is a floor, not a breakout catalyst.
Momentum is not on the bulls' side. MACD histogram at −23.99, price under the 99 EMA. Upside is capped below ~$80.5K until that structure fl.
Positioning is mildly bullish, not euphoric. Square community poll: 2,116 bullish vs 1,714 bearish of 3,830 votes A limited sample — worth knowing, not worth trading on alone.
My read: this is distribution into a corporate bid. The floor is real; the momentum is not there. Watching whether the 79.2K–79.7K zone absorbs the exchange inflow is the whole story this week.
{spot}(BTCUSDT)
#BitcoinSlipsBelow$80KAgain
BTC Is Bleeding While the Whale W Move Out — Stacked Against a Corporate Bid
Seven days of downside, and it wasn't retail that drove.
The: BTC closed ~79,796 on Oct27, down ~2.6% over 7 days and ~5.2% over 30 days. Daily RSI(12) sits at 39.8. The week's range: high ~84,377 (Oct 22), low ~79,220 (Oct 24). No capitulation candle. No reclaim of 84K. Just grind.
The supply side is doing the talking. Dormant wallets moved 2,571 BTC (~$206.5M) toward institutional exchanges. That is supply arriving at the venue, not leaving it. Treasury appetite also cooled — Strategy redirected $204.9M into share buybacks instead of BTC.
The bid underneath is corporate, not speculative. Strive acquired 6,182 BTC (~$511.4M); public firms added 6,200+ BTC combined. That is a real floor argument near $79.7K — but it is a floor, not a breakout catalyst.
Momentum is not on the bulls' side. MACD histogram at −23.99, price under the 99 EMA. Upside is capped below ~$80.5K until that structure fl.
Positioning is mildly bullish, not euphoric. Square community poll: 2,116 bullish vs 1,714 bearish of 3,830 votes A limited sample — worth knowing, not worth trading on alone.
My read: this is distribution into a corporate bid. The floor is real; the momentum is not there. Watching whether the 79.2K–79.7K zone absorbs the exchange inflow is the whole story this week.
#BitcoinSlipsBelow$80KAgain
ABO3ZAM:
تحليل واقعي يا صديقي، 79 ألف منطقة مفصلية للمضارب. إذا ما تماسك السعر فوقها، السيولة بتسحبنا لمناطق أعمق تحت، خلنا نراقب إغلاق الشمعة الحالية بحذر 🤝
1
1
945

Мақала
🚨 THE CORRECTION EQUATION: $BTC LOSES $80K 🚨#bitcoinslipsbelow$80kagain
The bulls have officially lost the psychological line in the sand! Let’s break down the latest Bitcoin breakdown using pure math 🧮👇
(Moving Average Loss) + (Risk-Off Selling) = Key Support Test 📉
Here is the exact technical formula driving the market today:
The Price Input:
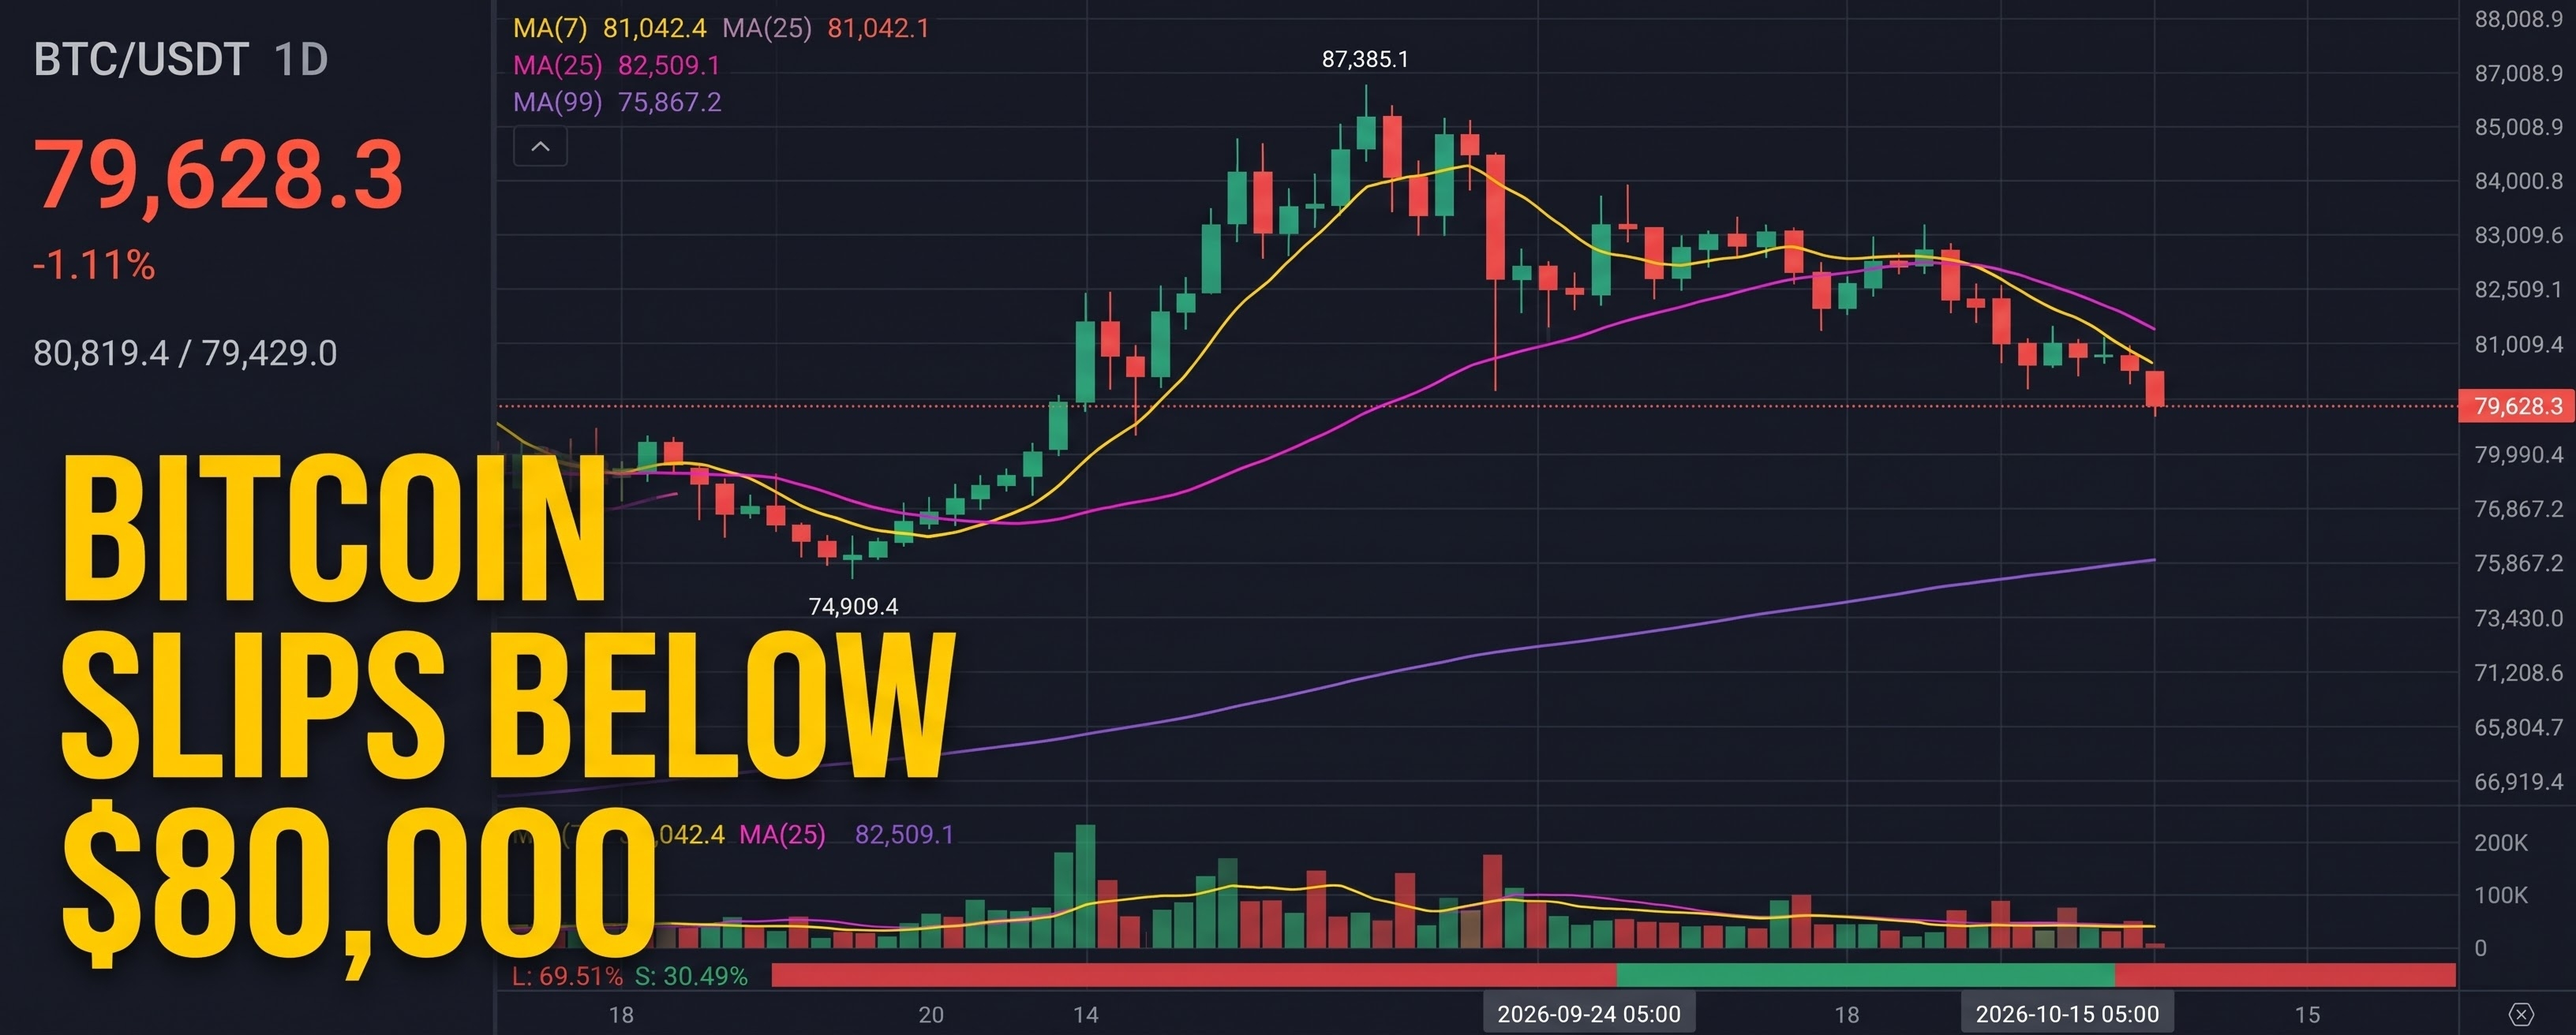
(The Breakdown) = Bitcoin has officially slipped below the critical $80,000 level, currently trading at $79,628 on the Binance Perpetual chart.
The Chart Reality:
(Technical Damage) ➔ Based on the chart data, BTC has decisively lost its short-term momentum indicators, falling below both the MA(7) at $81,042 and the MA(25) at $82,509.
The Breakdown:
With the 24-hour low tagging $79,429, the bears are firmly in control of the immediate trend. The price is now trapped in a downward trajectory, making the longer-term MA(99) sitting all the way down at $75,867 the next major structural defense line for the bulls. If buyers cannot rapidly reclaim the $81K zone, a deeper flush becomes highly probable.
Are you buying this dip or waiting for lower levels? Let's debate! 👇💬
$BTC $AIN $HUMA
{future}(HUMAUSDT)
{future}(BTCUSDT)
{future}(AINUSDT)
#BTC #cryptotrading #Binance #TechnicalAnalysis
🚨 THE CORRECTION EQUATION: $BTC LOSES $80K 🚨
#bitcoinslipsbelow$80kagain
The bulls have officially lost the psychological line in the sand! Let’s break down the latest Bitcoin breakdown using pure math 🧮👇
(Moving Average Loss) + (Risk-Off Selling) = Key Support Test 📉
Here is the exact technical formula driving the market today:
The Price Input:
(The Breakdown) = Bitcoin has officially slipped below the critical $80,000 level, currently trading at $79,628 on the Binance Perpetual chart.
The Chart Reality:
(Technical Damage) ➔ Based on the chart data, BTC has decisively lost its short-term momentum indicators, falling below both the MA(7) at $81,042 and the MA(25) at $82,509.
The Breakdown:
With the 24-hour low tagging $79,429, the bears are firmly in control of the immediate trend. The price is now trapped in a downward trajectory, making the longer-term MA(99) sitting all the way down at $75,867 the next major structural defense line for the bulls. If buyers cannot rapidly reclaim the $81K zone, a deeper flush becomes highly probable.
Are you buying this dip or waiting for lower levels? Let's debate! 👇💬
$BTC $AIN $HUMA
#BTC #cryptotrading #Binance #TechnicalAnalysis
ABO3ZAM:
تحليل موفق يا فيصل، الشارت فعلاً يوضح الضغط تحت الـ 80 ألف. نصيحتي للشباب لا تهملوا تأمين الأرباح ووقف الخسارة، السوق ما يرحم وقت التقلبات. 🤝
22
25
53.6k


Мақала
LA ECUACIÓN DE LA CORRECCIÓN: $BTC PIERDE LOS $80K 🚨#bitcoinslipsbelow$80kagain
¡Los alcistas han perdido oficialmente la línea psicológica que no debían cruzar! Analicemos la última caída de Bitcoin usando matemáticas puras 🧮👇
(Pérdida de la media móvil) + (Ventas por aversión al riesgo) = Prueba de soporte clave 📉
Esta es la fórmula técnica exacta que impulsa el mercado hoy:
El precio:
(La ruptura) = Bitcoin ha caído oficialmente por debajo del nivel crítico de $80,000 y actualmente cotiza a $79,628 en el gráfico de perpetuos de Binance.
La realidad del gráfico:
(Daño técnico) ➔ Según los datos del gráfico, BTC ha perdido de forma decisiva sus indicadores de impulso a corto plazo, cayendo por debajo tanto de la MA(7), en $81,042, como de la MA(25), en $82,509.
El análisis:
Con el mínimo de las últimas 24 horas tocando los $79,429, los bajistas tienen firmemente el control de la tendencia inmediata. El precio está ahora atrapado en una trayectoria descendente, lo que convierte a la MA(99) de largo plazo, situada en $75,867, en la próxima línea de defensa estructural importante para los alcistas. Si los compradores no logran recuperar rápidamente la zona de los $81K, es muy probable que se produzca una caída más profunda.
¿Estás comprando esta caída o esperando a que baje más? ¡Debatamos! 👇💬
LA ECUACIÓN DE LA CORRECCIÓN: $BTC PIERDE LOS $80K 🚨
#bitcoinslipsbelow$80kagain
¡Los alcistas han perdido oficialmente la línea psicológica que no debían cruzar! Analicemos la última caída de Bitcoin usando matemáticas puras 🧮👇
(Pérdida de la media móvil) + (Ventas por aversión al riesgo) = Prueba de soporte clave 📉
Esta es la fórmula técnica exacta que impulsa el mercado hoy:
El precio:
(La ruptura) = Bitcoin ha caído oficialmente por debajo del nivel crítico de $80,000 y actualmente cotiza a $79,628 en el gráfico de perpetuos de Binance.
La realidad del gráfico:
(Daño técnico) ➔ Según los datos del gráfico, BTC ha perdido de forma decisiva sus indicadores de impulso a corto plazo, cayendo por debajo tanto de la MA(7), en $81,042, como de la MA(25), en $82,509.
El análisis:
Con el mínimo de las últimas 24 horas tocando los $79,429, los bajistas tienen firmemente el control de la tendencia inmediata. El precio está ahora atrapado en una trayectoria descendente, lo que convierte a la MA(99) de largo plazo, situada en $75,867, en la próxima línea de defensa estructural importante para los alcistas. Si los compradores no logran recuperar rápidamente la zona de los $81K, es muy probable que se produzca una caída más profunda.
¿Estás comprando esta caída o esperando a que baje más? ¡Debatamos! 👇💬
ABO3ZAM:
وجهة نظر تحترم؛ السوق متقلب والالتزام بوقف الخسارة دايم هو الأمان 👍
5
2
6.4k

Расталды

Мақала
Pipo🇺🇸#🇧🇷🇦🇴BINANCE HOJE : Mercado em alerta antes do FED >> $79k segura ou Cai?😎RESUMO Do MERCADO BINANCE>> 27 e 28 OUTUBRO /Família Angola🇦🇴#🇺🇸#🇧🇷
HOJE 27/10:
- BTC: $79.700 - $80.600 (lutando nos $80k) - Baleia sacou $902M da Binance
- ETH: $2.322 (+1.28%) - mais compradores que vendedores
- BNB: $740 (+0.19%)
- Sentimento: Neutro (48)
Motivos da Queda>>FED começa reunião hoje + dinheiro indo pra IA (Meta $95B)
Amanhã $ 28/10 - ATENÇÃO:
- Decisão do FED às 19h Angola - vai ter volatilidade forte
- Suporte BTC: $79k / Resistência: $80.800
- Se perder $79k cai pra $78k / Se passar $80.800 sobe pra $81k+
- Max pain $80k
Visao: Não opera alavancado hoje/amanhã. Espera FED. Compra boa só se BTC cair pra $78k-$79k.
$BTC $ETH
{spot}(BTCUSDT)
Pipo🇺🇸#🇧🇷🇦🇴BINANCE HOJE : Mercado em alerta antes do FED >> $79k segura ou Cai?😎
RESUMO Do MERCADO BINANCE>> 27 e 28 OUTUBRO /Família Angola🇦🇴#🇺🇸#🇧🇷
HOJE 27/10:
- BTC: $79.700 - $80.600 (lutando nos $80k) - Baleia sacou $902M da Binance
- ETH: $2.322 (+1.28%) - mais compradores que vendedores
- BNB: $740 (+0.19%)
- Sentimento: Neutro (48)
Motivos da Queda>>FED começa reunião hoje + dinheiro indo pra IA (Meta $95B)
Amanhã $ 28/10 - ATENÇÃO:
- Decisão do FED às 19h Angola - vai ter volatilidade forte
- Suporte BTC: $79k / Resistência: $80.800
- Se perder $79k cai pra $78k / Se passar $80.800 sobe pra $81k+
- Max pain $80k
Visao: Não opera alavancado hoje/amanhã. Espera FED. Compra boa só se BTC cair pra $78k-$79k.
$BTC $ETH
2
1.2k

🚨 Bitcoin Falls Below $80,000 Again — What Comes Next?
$BTC faces renewed selling pressure as market uncertainty and profit-taking weigh on sentiment. Traders are watching key support levels, trading volume, and macroeconomic signals to assess whether this is a temporary pullback or a deeper correction.
📊 Will Bitcoin recover $80K, or could sellers push prices lower?
$BTC $ETH $BNB
#BitcoinSlipsBelow$80KAgain

1

·
--
#BitcoinSlipsBelow$80KAgain
📉 THE CORRECTION EQUATION: Bitcoin Slips Below $80K Again! ⚠️
The market is facing a tense structural test as Bitcoin officially loses the crucial psychological $80,000 support level, currently trading around the $79.6K zone on Binance. Let’s break down the exact technical equation driving today’s price action:
LostMovingAverages+Risk-OffSellingPressure=BearishBreakdown
Here is the current technical breakdown on the charts:
The Price Action: BTC failed to maintain support above the $80K milestone, with daily lows testing down toward $79.2K–$79.4K, confirming short-term seller dominance.
The Indicator Damage: Momentum has flipped heavily to the bears as price sits both below the short-term MA(7) at $81,042 and the MA(25) at $82,509.
The Next Major Support: All eyes are now locked on the MA(99) sitting at $75,867. Unless the bulls can muster a strong volume push to rapidly reclaim the $81K overhead resistance, a deeper liquidity flush becomes increasingly probable.
My Take: While panic selling shakes out overleveraged positions, structural support near the high-$70k region is facing intense scrutiny from both retail sentiment and corporate bids. Patience, strict risk management, and proper stop-losses are critical in this volatility window.
👇 Are you viewing this drop as a healthy accumulation dip or waiting for a deeper test near $75K? Let's discuss in the comments! 💬
$BTC #Bitcoin #CryptoAnalysis #BinanceSquare

14

·
--
Мақала
BITCOIN BREAKS $80K: THE MATH BEHIND THE DIP$80K is gone. The most important psychological support just broke.
Here's my breakdown in one simple equation:
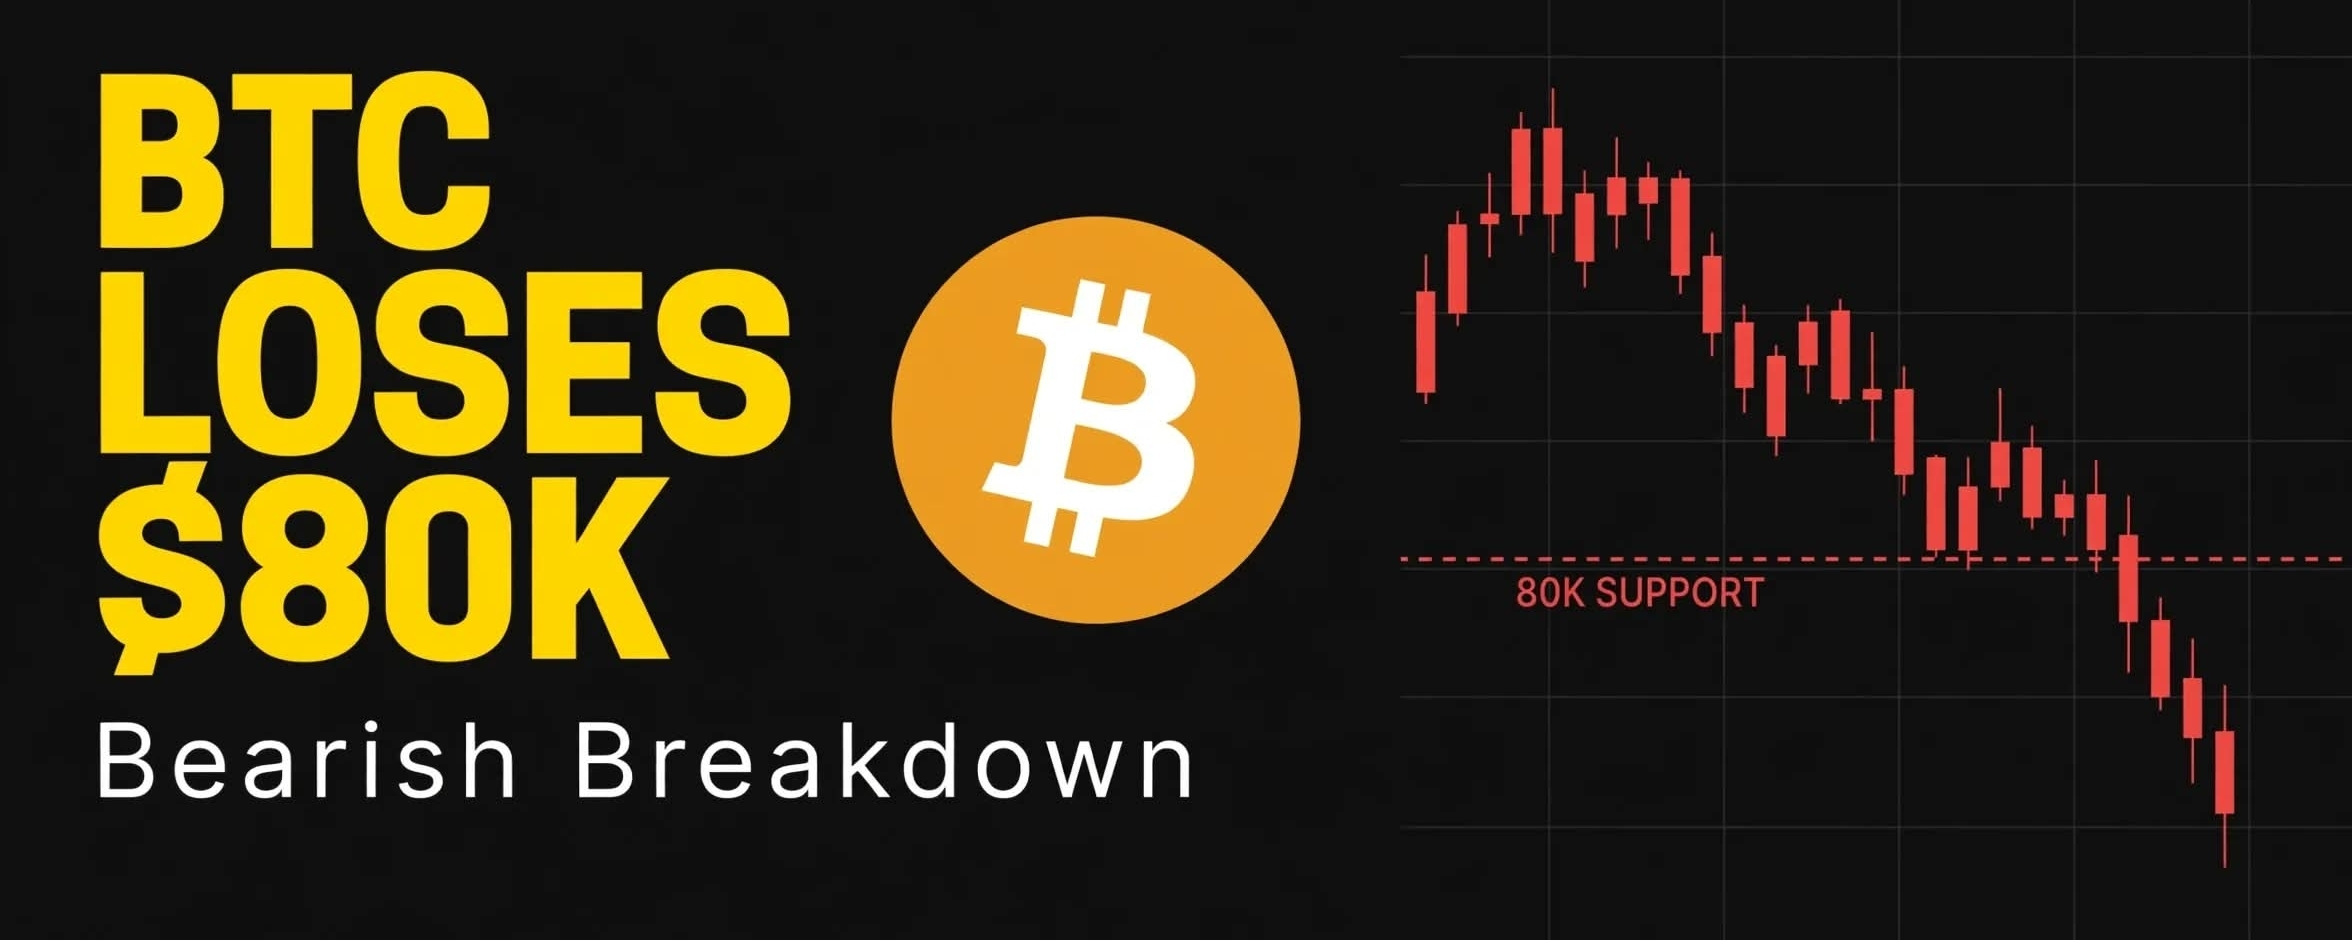
Lost MAs + Heavy Selling Pressure = Bearish Breakdown
The Situation Right Now:
$BTC is trading around $79.6K after failing to hold $80K on Binance Futures. The daily low touched *$79.4K*, confirming seller dominance.
Technical Picture:
This is not just a wick, it's a structural breakdown:
> Price < MA7 ($81,042)
> Price < MA25 ($82,509)
Momentum has completely flipped to the bears.
The Next Level to Watch:
All eyes on $75.8K. That's where the MA99 sits — the last major support before a deeper flush.
Unless $BTC reclaims $81K fast, we could see more downside.
Is this a buy-the-dip opportunity or are you waiting for $75K? Comment below 👇
{spot}(BTCUSDT)
#BTC #bitcoin #cryptocrash #BitcoinSlipsBelow$80KAgain
BITCOIN BREAKS $80K: THE MATH BEHIND THE DIP
$80K is gone. The most important psychological support just broke.
Here's my breakdown in one simple equation:
Lost MAs + Heavy Selling Pressure = Bearish Breakdown
The Situation Right Now:
$BTC is trading around $79.6K after failing to hold $80K on Binance Futures. The daily low touched *$79.4K*, confirming seller dominance.
Technical Picture:
This is not just a wick, it's a structural breakdown:
> Price < MA7 ($81,042)
> Price < MA25 ($82,509)
Momentum has completely flipped to the bears.
The Next Level to Watch:
All eyes on $75.8K. That's where the MA99 sits — the last major support before a deeper flush.
Unless $BTC reclaims $81K fast, we could see more downside.
Is this a buy-the-dip opportunity or are you waiting for $75K? Comment below 👇
#BTC #bitcoin #cryptocrash #BitcoinSlipsBelow$80KAgain
101

·
--
Жоғары (өспелі)
📊 $BTC # Short Analysis — 27 October 2026
💰 Current Price: Approximately $80,400 USD.
📉 Market Trend: Short-term bearish to sideways. Bitcoin has been trading below $80,000 recently as investors await the US Federal Reserve’s interest-rate decision.
🔑 Key Price Levels
* Support: $79,000 and $78,000
* Resistance: $80,800 and $82,000
* Bullish signal: A sustained move above $82,000.
* Bearish signal: A break below $78,000.
🔮 Short-Term Outlook: Bitcoin may consolidate between $79,000 and $81,000. A breakout in either direction could trigger a stronger move.
⚠️ Risk Warning: Bitcoin is highly volatile. These levels are indicative, not guaranteed. This is market analysis, not financial advice.
Analysis date: 27 October 2026. Prices can change rapidly.
#BitcoinSlipsBelow$80KAgain #CanMicrosoftDeliverOnAI #CanGoogleDefindItsCore #FOMCWatch
$BTC
{future}(BTCUSDT)
📊 $BTC # Short Analysis — 27 October 2026
💰 Current Price: Approximately $80,400 USD.
📉 Market Trend: Short-term bearish to sideways. Bitcoin has been trading below $80,000 recently as investors await the US Federal Reserve’s interest-rate decision.
🔑 Key Price Levels
* Support: $79,000 and $78,000
* Resistance: $80,800 and $82,000
* Bullish signal: A sustained move above $82,000.
* Bearish signal: A break below $78,000.
🔮 Short-Term Outlook: Bitcoin may consolidate between $79,000 and $81,000. A breakout in either direction could trigger a stronger move.
⚠️ Risk Warning: Bitcoin is highly volatile. These levels are indicative, not guaranteed. This is market analysis, not financial advice.
Analysis date: 27 October 2026. Prices can change rapidly.
#BitcoinSlipsBelow$80KAgain #CanMicrosoftDeliverOnAI #CanGoogleDefindItsCore #FOMCWatch
$BTC
107

#BitcoinSlipsBelow$80KAgain
🚨 THE $80K BATTLE Is Bitcoin Shaking Out Longs or Preparing for a Deeper Drop? 📉
Bitcoin ($BTC) has officially slipped below the psychological $80,000 threshold again, currently grinding around the $79,600 – $79,800 zone. The short-term momentum indicators are flashing red as BTC fell below its MA(7) and MA(25) lines, leaving traders wondering: Is this a trap, or the perfect buy-the-dip window?
Here is the exact market breakdown you need to know today:
🔍 Technical Reality Check: Key Support & Resistance
• The Floor to Watch: Buyers urgently need to defend the $79,000 – $79,200 support zone. A clean breakdown below this could accelerate selling pressure down to the next major demand area near $75,800 (MA(99)).
• The Bullish Reclaim: To completely invalidate this immediate bearish structure, bulls must reclaim the $80,800 – $82,500 area with high volume.
📊 Behind the Scenes: What's Driving the Move?
• Macro Caution: Traders are actively cutting risk ahead of the upcoming Fed interest rate decision.
• Liquidation Wave: Over $400M+ in over-leveraged long positions were flushed out recently, wiping out speculative froth and cooling down funding rates.
• The Corporate Bid vs. AI Rotation: While institutional whales and public firms continue to bid and set a solid long-term floor, massive liquidity is temporarily rotating into massive tech AI capital plays.
💡 The Strategy
This looks more like a healthy macro-driven consolidation and risk-off positioning rather than absolute panic. Avoid chasing high-leverage trades in this volatility and focus on spot accumulation zones.
💬 Let's Debate Below:
Are you aggressively buying this $79K dip, or are you sitting on cash waiting for lower levels? Drop your strategy in the comments! 👇
#BTC #cryptotrading #Binance #TechnicalAnalysis
$BTC $HUMA $AIN
{future}(AINUSDT)
{future}(HUMAUSDT)
{future}(BTCUSDT)
#BitcoinSlipsBelow$80KAgain
🚨 THE $80K BATTLE Is Bitcoin Shaking Out Longs or Preparing for a Deeper Drop? 📉
Bitcoin ($BTC ) has officially slipped below the psychological $80,000 threshold again, currently grinding around the $79,600 – $79,800 zone. The short-term momentum indicators are flashing red as BTC fell below its MA(7) and MA(25) lines, leaving traders wondering: Is this a trap, or the perfect buy-the-dip window?
Here is the exact market breakdown you need to know today:
🔍 Technical Reality Check: Key Support & Resistance
• The Floor to Watch: Buyers urgently need to defend the $79,000 – $79,200 support zone. A clean breakdown below this could accelerate selling pressure down to the next major demand area near $75,800 (MA(99)).
• The Bullish Reclaim: To completely invalidate this immediate bearish structure, bulls must reclaim the $80,800 – $82,500 area with high volume.
📊 Behind the Scenes: What's Driving the Move?
• Macro Caution: Traders are actively cutting risk ahead of the upcoming Fed interest rate decision.
• Liquidation Wave: Over $400M+ in over-leveraged long positions were flushed out recently, wiping out speculative froth and cooling down funding rates.
• The Corporate Bid vs. AI Rotation: While institutional whales and public firms continue to bid and set a solid long-term floor, massive liquidity is temporarily rotating into massive tech AI capital plays.
💡 The Strategy
This looks more like a healthy macro-driven consolidation and risk-off positioning rather than absolute panic. Avoid chasing high-leverage trades in this volatility and focus on spot accumulation zones.
💬 Let's Debate Below:
Are you aggressively buying this $79K dip, or are you sitting on cash waiting for lower levels? Drop your strategy in the comments! 👇
#BTC #cryptotrading #Binance #TechnicalAnalysis
$BTC $HUMA $AIN

178

·
--
$BTC
is under short-term bearish pressure. Watch the $77,000–$78,000 support zone and the Federal Reserve's October 28 decision for potential market-moving developments.
This is market analysis, not financial advice. Cryptocurrency prices are volatile; confirm live prices before trading.
#CanMicrosoftDeliverOnAI #FOMCWatch #CanGoogleDefindItsCore #EthereumDropsBelow$2300 #BitcoinSlipsBelow$80KAgain
{spot}(BTCUSDT)
$BTC
is under short-term bearish pressure. Watch the $77,000–$78,000 support zone and the Federal Reserve's October 28 decision for potential market-moving developments.
This is market analysis, not financial advice. Cryptocurrency prices are volatile; confirm live prices before trading.
#CanMicrosoftDeliverOnAI #FOMCWatch #CanGoogleDefindItsCore #EthereumDropsBelow$2300 #BitcoinSlipsBelow$80KAgain
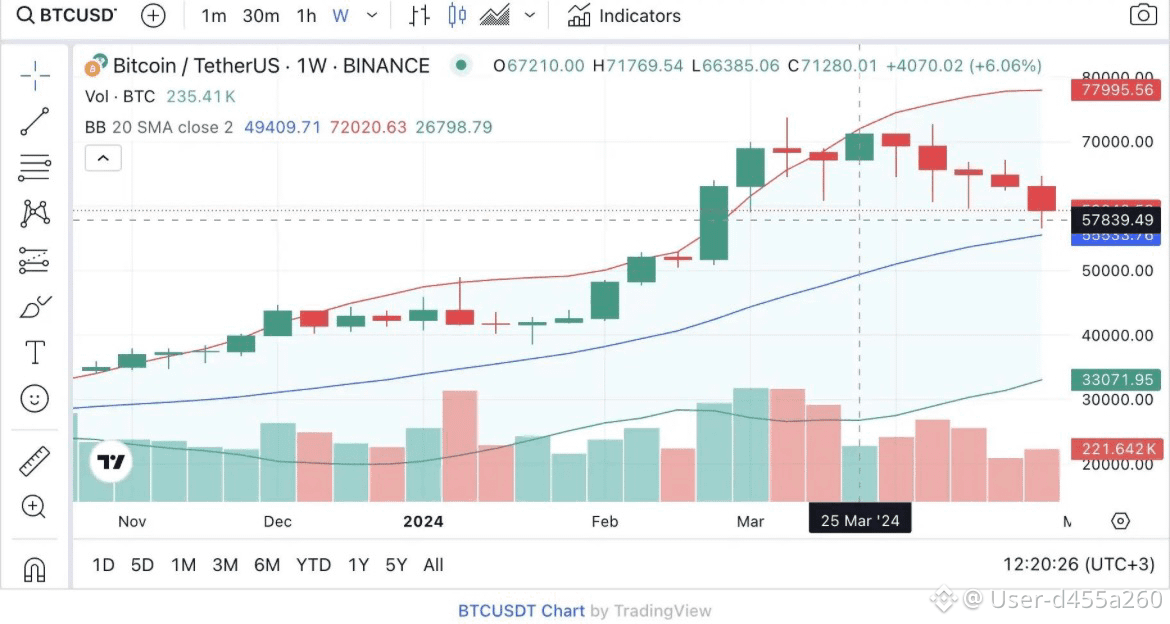
114


·
--
Bitcoin Slips Below $80K Again: Is $79K the Level That Decides the Next Move?#BitcoinSlipsBelow$80KAgain
$BTC
{spot}(BTCUSDT)
Bitcoin slipped below $80K again, dipping to around $79.3K on Monday, its lowest level in over a month. Three things are weighing on the price: roughly $770M left US spot Bitcoin ETFs on Thursday and Friday, leveraged longs were flushed over the weekend, and traders are cutting risk ahead of Wednesday's Fed decision. Strategy also paused its buying after five straight weeks of additions.
My take: this looks more like cautious positioning than panic. The $80K level has been tested several times, and $79K is the key support I'm watching on the daily close. A sustained break below it could open the door to $75K, while reclaiming $82K would ease the selling pressure. Until the Fed decision is out, I expect choppy, range-bound price action, and I'd rather wait for confirmation than chase a move in either direction.
What's your view: bounce from $79K or a deeper drop? Tell me below 👇
Follow me for more trading content and market updates.
#BTC #CryptoMarkets #BinanceSquare
Bitcoin Slips Below $80K Again: Is $79K the Level That Decides the Next Move?
#BitcoinSlipsBelow$80KAgain
$BTC
Bitcoin slipped below $80K again, dipping to around $79.3K on Monday, its lowest level in over a month. Three things are weighing on the price: roughly $770M left US spot Bitcoin ETFs on Thursday and Friday, leveraged longs were flushed over the weekend, and traders are cutting risk ahead of Wednesday's Fed decision. Strategy also paused its buying after five straight weeks of additions.
My take: this looks more like cautious positioning than panic. The $80K level has been tested several times, and $79K is the key support I'm watching on the daily close. A sustained break below it could open the door to $75K, while reclaiming $82K would ease the selling pressure. Until the Fed decision is out, I expect choppy, range-bound price action, and I'd rather wait for confirmation than chase a move in either direction.
What's your view: bounce from $79K or a deeper drop? Tell me below 👇
Follow me for more trading content and market updates.
#BTC #CryptoMarkets #BinanceSquare
1
9.1k
💡 Bitcoin Dip: Strategy Matters More Than Emotion
A drop below $80K can create fear, but reacting impulsively may lead to costly decisions.
📊 Before making a move, consider your entry price, available capital, risk tolerance, and the possibility of further downside.
₿ Long-term conviction should still be supported by research and a realistic plan.
Are you accumulating gradually, waiting for confirmation, or staying on the sidelines? Share your approach! 👇 #BitcoinSlipsBelow$80KAgain
9
📉 Bitcoin Slips Below $80K Again — What Comes Next? ₿
$BTC is facing renewed selling pressure as traders watch key support levels and changing market sentiment. Is this a temporary dip or the beginning of a deeper correction? 🔍
Stay focused on market data, manage risk wisely, and avoid emotional decisions. 📊
What’s your outlook for Bitcoin: recovery above $80K or further downside? Share your analysis below! 👇 #BitcoinSlipsBelow$80KAgain
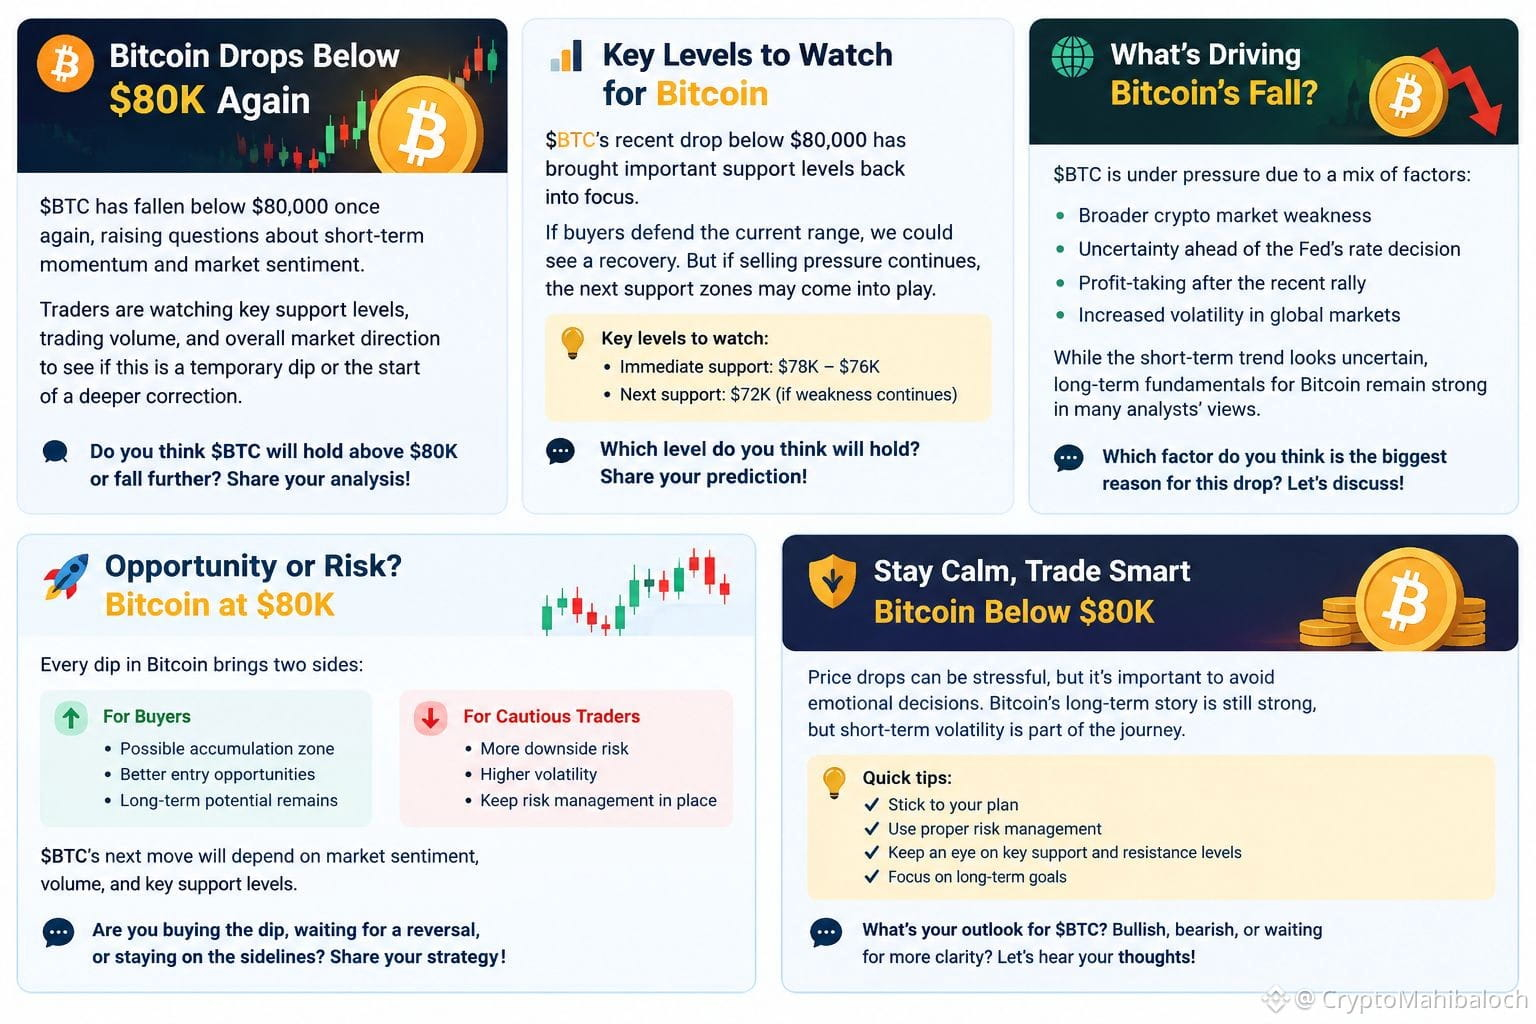
3
🎯 The $80K Battle: Support or Resistance?
When $BTC falls below a major price level, that level can become an important area to watch during a recovery attempt.
📈 A move back above $80K could improve short-term sentiment, while repeated rejection may keep sellers in control.
Remember, no level guarantees a bounce.
Are you watching for a breakout or waiting for confirmation? #BitcoinSlipsBelow$80KAgain
9
🐻 Is Bitcoin Entering a Deeper Correction?
Bitcoin’s move below $80K has traders reconsidering their short-term outlook. A brief breakdown can reverse quickly, but sustained selling may signal further weakness.
🔍 The important signals are price structure, market liquidity, and buying demand.
Will $BTC recover its lost level, or will bearish momentum continue? 👇 #BitcoinSlipsBelow$80KAgain
8
📉 Bitcoin Below $80K: Can Buyers Fight Back?
$BTC slipping below $80,000 has put market sentiment under pressure. Now the focus shifts to whether buyers will step in or sellers will push prices lower.
📊 Watch trading volume, support levels, and any recovery above $80K before drawing conclusions.
₿ Do you expect a rebound or another leg down? Share your analysis! #BitcoinSlipsBelow$80KAgain
6

·
--
Төмен (кемімелі)
#BitcoinSlipsBelow$80KAgain
🚨 BITCOIN SLIPS BELOW $80,000 AGAIN — WILL BEARS TAKE CONTROL?
Bitcoin ($BTC) has fallen below the psychologically important $80,000 level again, putting traders on alert as the market heads into a crucial Federal Reserve policy meeting on October 28.
📉 What’s Behind the Decline?
Several factors are weighing on market sentiment:
Fed uncertainty: Traders are reducing risk exposure while waiting for signals on interest rates and future monetary policy.
ETF outflows: U.S. spot Bitcoin ETFs experienced significant withdrawals late last week, adding pressure to sentiment.
Broader market weakness: Concerns surrounding technology stocks and risk appetite are also affecting crypto markets.
According to recent market reports, BTC traded below $80,000, with prices briefly falling toward $79,300 before recovering some losses.
📊 What Should Traders Watch?
🔴 Bearish scenario: If BTC remains below $80,000 and selling pressure continues, the market could test lower support levels.
🟢 Bullish scenario: A convincing move back above $80,000, followed by sustained buying volume, could signal that buyers are regaining control.
⚠️ The Bigger Picture
Bitcoin’s next move may depend less on headlines alone and more on the Federal Reserve’s messaging, ETF flows, and whether buyers can defend nearby support.
Trader takeaway: Avoid chasing the breakdown. Watch price action around $80,000, confirm the trend with volume, and manage leverage carefully. A break below support is not automatically a guaranteed crash, just as a recovery is not proof of a new rally.
#bitcoin #BTC #CryptoMarket #BitcoinNews
$PLAY $FOGO $CVX
{future}(CVXUSDT)
{future}(FOGOUSDT)
{future}(PLAYUSDT)
#BitcoinSlipsBelow$80KAgain
🚨 BITCOIN SLIPS BELOW $80,000 AGAIN — WILL BEARS TAKE CONTROL?
Bitcoin ($BTC) has fallen below the psychologically important $80,000 level again, putting traders on alert as the market heads into a crucial Federal Reserve policy meeting on October 28.
📉 What’s Behind the Decline?
Several factors are weighing on market sentiment:
Fed uncertainty: Traders are reducing risk exposure while waiting for signals on interest rates and future monetary policy.
ETF outflows: U.S. spot Bitcoin ETFs experienced significant withdrawals late last week, adding pressure to sentiment.
Broader market weakness: Concerns surrounding technology stocks and risk appetite are also affecting crypto markets.
According to recent market reports, BTC traded below $80,000, with prices briefly falling toward $79,300 before recovering some losses.
📊 What Should Traders Watch?
🔴 Bearish scenario: If BTC remains below $80,000 and selling pressure continues, the market could test lower support levels.
🟢 Bullish scenario: A convincing move back above $80,000, followed by sustained buying volume, could signal that buyers are regaining control.
⚠️ The Bigger Picture
Bitcoin’s next move may depend less on headlines alone and more on the Federal Reserve’s messaging, ETF flows, and whether buyers can defend nearby support.
Trader takeaway: Avoid chasing the breakdown. Watch price action around $80,000, confirm the trend with volume, and manage leverage carefully. A break below support is not automatically a guaranteed crash, just as a recovery is not proof of a new rally.
#bitcoin #BTC #CryptoMarket #BitcoinNews
$PLAY $FOGO $CVX

476

·
--
Жоғары (өспелі)
#BitcoinSlipsBelow$80KAgain bitcoinslipsbelow$80kagain Bitcoin vuelve a caer por debajo de los $80K. La volatilidad regresa al mercado mientras los inversores evalúan las condiciones macroeconómicas y los flujos de los ETF. ¿Corrección temporal o inicio de una nueva fase? 👀📉 #Bitcoin #BTC $BTC
{spot}(BTCUSDT)
#BitcoinSlipsBelow$80KAgain bitcoinslipsbelow$80kagain Bitcoin vuelve a caer por debajo de los $80K. La volatilidad regresa al mercado mientras los inversores evalúan las condiciones macroeconómicas y los flujos de los ETF. ¿Corrección temporal o inicio de una nueva fase? 👀📉 #Bitcoin #BTC $BTC
18
Көбірек контент көру үшін кіріңіз
Binance Square платформасында әлемдік криптоқоғамдастыққа қосылыңыз
⚡️ Криптовалюта туралы ең соңғы және пайдалы ақпаратты алыңыз.
💬 Әлемдегі ең ірі криптобиржаның сеніміне ие.
👍 Расталған авторлардың нақты пікірлерін табыңыз.
Электрондық пошта/телефон нөмірі
Трендтегі тақырыптар
1
#CanMicrosoftDeliverOnAI
182,841 рет көрілді
1,469 адам талқылап жатыр
2
#CanGoogleDefindItsCore
91,955 рет көрілді
1,054 адам талқылап жатыр
3
#FOMCWatch
9.2M рет көрілді
28,734 адам талқылап жатыр
4
#HKPlacesTokenizedFundSecondaryTradingUnderETFLikeFramework
14 рет көрілді
6 адам талқылап жатыр
5
#USGovSellsFTXLinkedAnthropicSharesFor$627M
273 рет көрілді
18 адам талқылап жатыр
6
#MoodysAssignsRLUSDA2LongTermDepositRating
16 рет көрілді
24 адам талқылап жатыр
7
#SKHynixUnveils$45BShareholderReturns
708 рет көрілді
22 адам талқылап жатыр
8
#OSMOPlansToBurn100MTokensFromCommunityPool
7,825 рет көрілді
244 адам талқылап жатыр
9
#EthereumDropsBelow$2300
12,982 рет көрілді
174 адам талқылап жатыр
10
#BitcoinSlipsBelow$80KAgain
37,194 рет көрілді
141 адам талқылап жатыр