
#btcanalysis
btcanalysis
2.2M рет көрілді
5,174 адам талқылап жатыр
Қызу саудада
Ең соңғы

Мақала
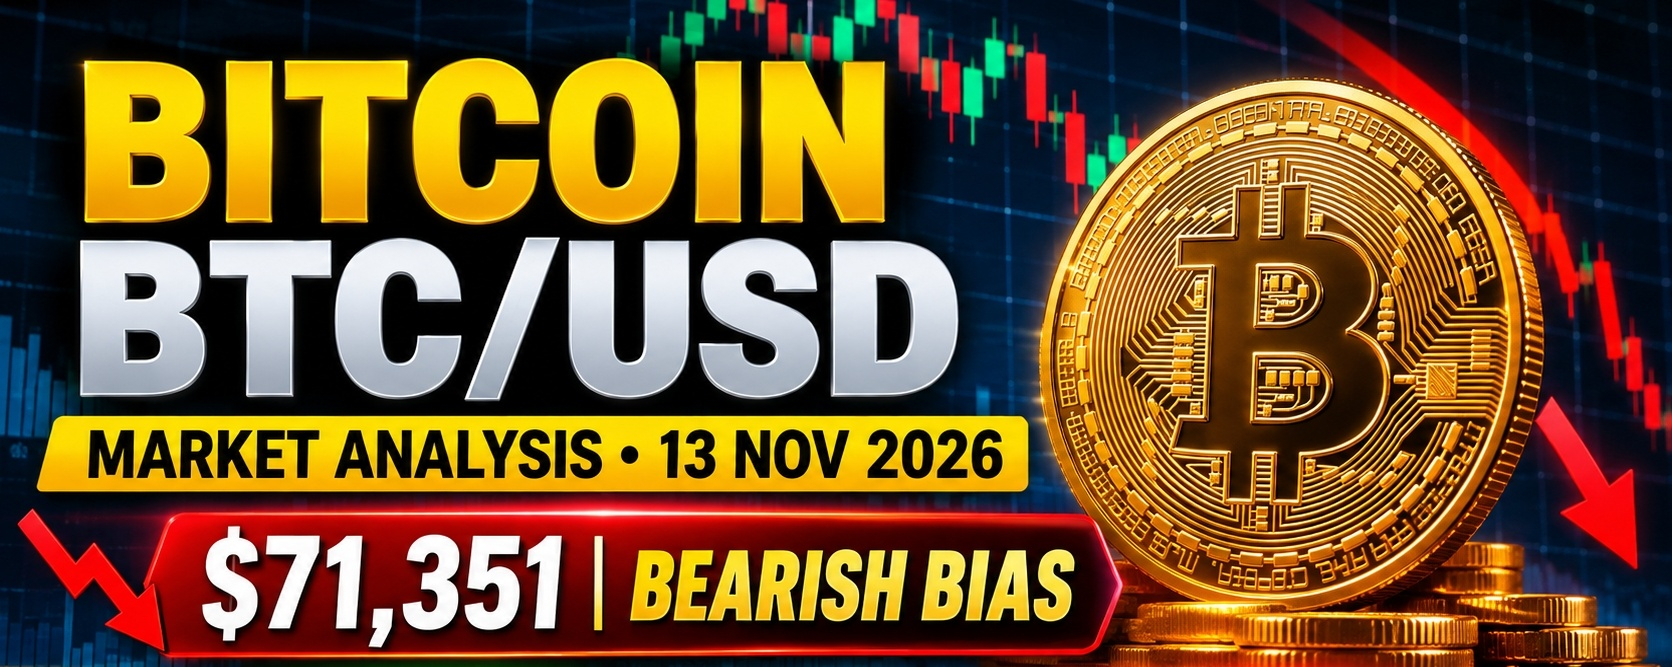
Bitcoin (BTC/USD) Complete Market Analysis 13 November 2026Bitcoin ($BTC /USD) Complete Market Analysis 13 November 2026
1\. Current BTC/USD market overview
Bitcoin is facing significant selling pressure. The latest available market report showed BTC trading around $71,445, down approximately 3.44% in that reported session.
{spot}(BTCUSDT)
Bitcoin has also broken below its important daily 200-day simple moving average near $73,150. Investing.com Australia +1
Latest reported $BTC price
### $71,445
Reported November 12; not a live exchange quote.
Market direction
Bearish
Momentum
Weak
Daily RSI
29.7
Daily 200 SMA
$73,150
Source: Investing.com market technical report. Investing.com Australia
### 2\. Technical analysis
Trend analysis
* Short-term: Bearish.
* Medium-term: Bearish.
* Long-term: Under pressure, with important weekly support zones still ahead.
* Sellers currently have the advantage.
RSI indicator
The reported daily RSI is 29.7.
This is below 30, indicating oversold conditions.
What this means:
* A temporary bullish bounce is possible.
* Selling pressure remains strong.
* Oversold does not automatically mean the market has reached its bottom.
Moving averages
The daily moving averages are reporting sell signals. The break below the 200-day SMA is particularly important because that level had previously provided support. Investing.com Australia
### 3\. Important support levels
These are the key price zones to watch.
| Support | Importance |
| --------------- | ---------------------- |
| $71,150–$71,300 | Immediate support |
| $70,000 | Psychological support |
| $67,300–$68,000 | Major support |
| $66,000–$67,000 | Strong historical zone |
| $63,000–$65,000 | Deeper support |
| $57,877 | Previous cycle low |
Investing.com Australia +1Critical level: $70,000
A convincing daily close below $70,000 could increase the risk of a deeper correction toward $68,000.
### 4\. Important resistance levels
| Resistance | Importance |
| --------------- | ------------------------------ |
| $72,500–$73,150 | First recovery hurdle |
| $74,000–$75,500 | Strong resistance |
| $77,000 | Important trend recovery level |
| $80,000–$81,000 | Major resistance |
| $84,800–$87,000 | Higher recovery target |
Investing.com Australia +2
Bitcoin needs to recover and hold above $73,150 before the immediate bearish structure starts improving.
### 5\. Fundamental analysis
Three major factors are affecting Bitcoin.
1\. US Federal Reserve
Hotter-than-expected US inflation has increased expectations of tighter monetary policy. Higher interest rates can reduce demand for riskier investments such as Bitcoin. DailyForex +1
2\. US dollar strength
A stronger dollar is creating additional pressure on cryptocurrency prices.
3\. Bitcoin ETF flows
Recent spot Bitcoin ETF outflows indicate weaker institutional demand, although the reported pace of withdrawals has shown some signs of easing. DailyForex
### 6\. Bullish vs bearish scenarios
Bullish scenario
Recovery
### $75,500
If Bitcoin holds above $70,000 and recovers $73,150, buyers could attempt:
* $74,000
* $75,500
* $77,000
* $80,000
Confirmation: sustained price recovery and stronger buying volume.
Bearish scenario
Further decline
### $68,000
If Bitcoin breaks below $70,000 and confirms the breakdown:
* $68,000
* $66,000
* $63,000–$65,000
* $57,877
Confirmation: daily candle closes below support with increasing selling volume.
### 7\. Trading strategy
The following are conditional trading setups, not guaranteed signals.
| Strategy | Entry condition | Target |
| -------- | ------------------------------------ | --------------- |
| Buy | Reclaim $73,150 and confirm | $74,500–$75,500 |
| Buy | Strong bullish reversal near $68,000 | $70,000–$72,000 |
| Sell | Rejection around $73,150–$75,000 | $71,000–$70,000 |
| Sell | Confirmed breakdown below $70,000 | $68,000–$66,000 |
Risk management:
* Risk no more than 0.5–1% of trading capital per trade.
* Always use a stop-loss.
* Avoid excessive leverage.
* Wait for candle confirmation.
* Do not buy simply because RSI is oversold.
### 8\. Best timeframes to monitor
| Timeframe | What to watch |
| ---------- | ---------------------------- |
| 5 minutes | Quick scalping |
| 15 minutes | Short-term entries |
| 1 hour | Entry confirmation |
| 4 hours | Trend direction |
| Daily | Major support and resistance |
| Weekly | Long-term market structure |
### 9\. Final BTC/USD prediction
Current bias: Bearish
My assessment based on the latest available market information:
* Next 24 hours: Bearish pressure with potential relief rallies.
* Next 3–7 days: $70,000 is the key level to monitor.
* Bullish reversal confirmation: Recovery above $73,150, followed by $75,500.
* Bearish continuation: Confirmed breakdown below $70,000 could expose $68,000.
These are scenario levels, not guaranteed future prices.
My conclusion: Bitcoin is currently showing a weak technical structure. I would avoid aggressive long positions until buyers demonstrate strength above resistance. Oversold conditions make a temporary bounce possible, so chasing short positions at the bottom is also risky.
This is educational market analysi
s, not personalized financial advice.
If you want, I can also create a professional Bitcoin $BTC /USD trading analysis image with support, resistance, bullish and bearish targets for your article.
#bitcoin #BTCanalysis #BTCUSD #TrendingPredictions #viralpost
Bitcoin (BTC/USD) Complete Market Analysis 13 November 2026
Bitcoin ($BTC /USD) Complete Market Analysis 13 November 2026
1\. Current BTC/USD market overview
Bitcoin is facing significant selling pressure. The latest available market report showed BTC trading around $71,445, down approximately 3.44% in that reported session.
Bitcoin has also broken below its important daily 200-day simple moving average near $73,150. Investing.com Australia +1
Latest reported $BTC price
### $71,445
Reported November 12; not a live exchange quote.
Market direction
Bearish
Momentum
Weak
Daily RSI
29.7
Daily 200 SMA
$73,150
Source: Investing.com market technical report. Investing.com Australia
### 2\. Technical analysis
Trend analysis
* Short-term: Bearish.
* Medium-term: Bearish.
* Long-term: Under pressure, with important weekly support zones still ahead.
* Sellers currently have the advantage.
RSI indicator
The reported daily RSI is 29.7.
This is below 30, indicating oversold conditions.
What this means:
* A temporary bullish bounce is possible.
* Selling pressure remains strong.
* Oversold does not automatically mean the market has reached its bottom.
Moving averages
The daily moving averages are reporting sell signals. The break below the 200-day SMA is particularly important because that level had previously provided support. Investing.com Australia
### 3\. Important support levels
These are the key price zones to watch.
| Support | Importance |
| --------------- | ---------------------- |
| $71,150–$71,300 | Immediate support |
| $70,000 | Psychological support |
| $67,300–$68,000 | Major support |
| $66,000–$67,000 | Strong historical zone |
| $63,000–$65,000 | Deeper support |
| $57,877 | Previous cycle low |
Investing.com Australia +1Critical level: $70,000
A convincing daily close below $70,000 could increase the risk of a deeper correction toward $68,000.
### 4\. Important resistance levels
| Resistance | Importance |
| --------------- | ------------------------------ |
| $72,500–$73,150 | First recovery hurdle |
| $74,000–$75,500 | Strong resistance |
| $77,000 | Important trend recovery level |
| $80,000–$81,000 | Major resistance |
| $84,800–$87,000 | Higher recovery target |
Investing.com Australia +2
Bitcoin needs to recover and hold above $73,150 before the immediate bearish structure starts improving.
### 5\. Fundamental analysis
Three major factors are affecting Bitcoin.
1\. US Federal Reserve
Hotter-than-expected US inflation has increased expectations of tighter monetary policy. Higher interest rates can reduce demand for riskier investments such as Bitcoin. DailyForex +1
2\. US dollar strength
A stronger dollar is creating additional pressure on cryptocurrency prices.
3\. Bitcoin ETF flows
Recent spot Bitcoin ETF outflows indicate weaker institutional demand, although the reported pace of withdrawals has shown some signs of easing. DailyForex
### 6\. Bullish vs bearish scenarios
Bullish scenario
Recovery
### $75,500
If Bitcoin holds above $70,000 and recovers $73,150, buyers could attempt:
* $74,000
* $75,500
* $77,000
* $80,000
Confirmation: sustained price recovery and stronger buying volume.
Bearish scenario
Further decline
### $68,000
If Bitcoin breaks below $70,000 and confirms the breakdown:
* $68,000
* $66,000
* $63,000–$65,000
* $57,877
Confirmation: daily candle closes below support with increasing selling volume.
### 7\. Trading strategy
The following are conditional trading setups, not guaranteed signals.
| Strategy | Entry condition | Target |
| -------- | ------------------------------------ | --------------- |
| Buy | Reclaim $73,150 and confirm | $74,500–$75,500 |
| Buy | Strong bullish reversal near $68,000 | $70,000–$72,000 |
| Sell | Rejection around $73,150–$75,000 | $71,000–$70,000 |
| Sell | Confirmed breakdown below $70,000 | $68,000–$66,000 |
Risk management:
* Risk no more than 0.5–1% of trading capital per trade.
* Always use a stop-loss.
* Avoid excessive leverage.
* Wait for candle confirmation.
* Do not buy simply because RSI is oversold.
### 8\. Best timeframes to monitor
| Timeframe | What to watch |
| ---------- | ---------------------------- |
| 5 minutes | Quick scalping |
| 15 minutes | Short-term entries |
| 1 hour | Entry confirmation |
| 4 hours | Trend direction |
| Daily | Major support and resistance |
| Weekly | Long-term market structure |
### 9\. Final BTC/USD prediction
Current bias: Bearish
My assessment based on the latest available market information:
* Next 24 hours: Bearish pressure with potential relief rallies.
* Next 3–7 days: $70,000 is the key level to monitor.
* Bullish reversal confirmation: Recovery above $73,150, followed by $75,500.
* Bearish continuation: Confirmed breakdown below $70,000 could expose $68,000.
These are scenario levels, not guaranteed future prices.
My conclusion: Bitcoin is currently showing a weak technical structure. I would avoid aggressive long positions until buyers demonstrate strength above resistance. Oversold conditions make a temporary bounce possible, so chasing short positions at the bottom is also risky.
This is educational market analysi
s, not personalized financial advice.
If you want, I can also create a professional Bitcoin $BTC /USD trading analysis image with support, resistance, bullish and bearish targets for your article.
#bitcoin #BTCanalysis #BTCUSD #TrendingPredictions #viralpost
1\. Current BTC/USD market overview
Bitcoin is facing significant selling pressure. The latest available market report showed BTC trading around $71,445, down approximately 3.44% in that reported session.
Bitcoin has also broken below its important daily 200-day simple moving average near $73,150. Investing.com Australia +1
Latest reported $BTC price
### $71,445
Reported November 12; not a live exchange quote.
Market direction
Bearish
Momentum
Weak
Daily RSI
29.7
Daily 200 SMA
$73,150
Source: Investing.com market technical report. Investing.com Australia
### 2\. Technical analysis
Trend analysis
* Short-term: Bearish.
* Medium-term: Bearish.
* Long-term: Under pressure, with important weekly support zones still ahead.
* Sellers currently have the advantage.
RSI indicator
The reported daily RSI is 29.7.
This is below 30, indicating oversold conditions.
What this means:
* A temporary bullish bounce is possible.
* Selling pressure remains strong.
* Oversold does not automatically mean the market has reached its bottom.
Moving averages
The daily moving averages are reporting sell signals. The break below the 200-day SMA is particularly important because that level had previously provided support. Investing.com Australia
### 3\. Important support levels
These are the key price zones to watch.
| Support | Importance |
| --------------- | ---------------------- |
| $71,150–$71,300 | Immediate support |
| $70,000 | Psychological support |
| $67,300–$68,000 | Major support |
| $66,000–$67,000 | Strong historical zone |
| $63,000–$65,000 | Deeper support |
| $57,877 | Previous cycle low |
Investing.com Australia +1Critical level: $70,000
A convincing daily close below $70,000 could increase the risk of a deeper correction toward $68,000.
### 4\. Important resistance levels
| Resistance | Importance |
| --------------- | ------------------------------ |
| $72,500–$73,150 | First recovery hurdle |
| $74,000–$75,500 | Strong resistance |
| $77,000 | Important trend recovery level |
| $80,000–$81,000 | Major resistance |
| $84,800–$87,000 | Higher recovery target |
Investing.com Australia +2
Bitcoin needs to recover and hold above $73,150 before the immediate bearish structure starts improving.
### 5\. Fundamental analysis
Three major factors are affecting Bitcoin.
1\. US Federal Reserve
Hotter-than-expected US inflation has increased expectations of tighter monetary policy. Higher interest rates can reduce demand for riskier investments such as Bitcoin. DailyForex +1
2\. US dollar strength
A stronger dollar is creating additional pressure on cryptocurrency prices.
3\. Bitcoin ETF flows
Recent spot Bitcoin ETF outflows indicate weaker institutional demand, although the reported pace of withdrawals has shown some signs of easing. DailyForex
### 6\. Bullish vs bearish scenarios
Bullish scenario
Recovery
### $75,500
If Bitcoin holds above $70,000 and recovers $73,150, buyers could attempt:
* $74,000
* $75,500
* $77,000
* $80,000
Confirmation: sustained price recovery and stronger buying volume.
Bearish scenario
Further decline
### $68,000
If Bitcoin breaks below $70,000 and confirms the breakdown:
* $68,000
* $66,000
* $63,000–$65,000
* $57,877
Confirmation: daily candle closes below support with increasing selling volume.
### 7\. Trading strategy
The following are conditional trading setups, not guaranteed signals.
| Strategy | Entry condition | Target |
| -------- | ------------------------------------ | --------------- |
| Buy | Reclaim $73,150 and confirm | $74,500–$75,500 |
| Buy | Strong bullish reversal near $68,000 | $70,000–$72,000 |
| Sell | Rejection around $73,150–$75,000 | $71,000–$70,000 |
| Sell | Confirmed breakdown below $70,000 | $68,000–$66,000 |
Risk management:
* Risk no more than 0.5–1% of trading capital per trade.
* Always use a stop-loss.
* Avoid excessive leverage.
* Wait for candle confirmation.
* Do not buy simply because RSI is oversold.
### 8\. Best timeframes to monitor
| Timeframe | What to watch |
| ---------- | ---------------------------- |
| 5 minutes | Quick scalping |
| 15 minutes | Short-term entries |
| 1 hour | Entry confirmation |
| 4 hours | Trend direction |
| Daily | Major support and resistance |
| Weekly | Long-term market structure |
### 9\. Final BTC/USD prediction
Current bias: Bearish
My assessment based on the latest available market information:
* Next 24 hours: Bearish pressure with potential relief rallies.
* Next 3–7 days: $70,000 is the key level to monitor.
* Bullish reversal confirmation: Recovery above $73,150, followed by $75,500.
* Bearish continuation: Confirmed breakdown below $70,000 could expose $68,000.
These are scenario levels, not guaranteed future prices.
My conclusion: Bitcoin is currently showing a weak technical structure. I would avoid aggressive long positions until buyers demonstrate strength above resistance. Oversold conditions make a temporary bounce possible, so chasing short positions at the bottom is also risky.
This is educational market analysi
s, not personalized financial advice.
If you want, I can also create a professional Bitcoin $BTC /USD trading analysis image with support, resistance, bullish and bearish targets for your article.
#bitcoin #BTCanalysis #BTCUSD #TrendingPredictions #viralpost
1
567

·
--
Bitcoin at $68K – Recovery Coming or More Downside Ahead?$BITCOIN is currently facing strong selling pressure, with its price dropping towards the $68K–$69K zone. The recent decline has created uncertainty in the crypto market, and investors are closely watching BTC's next move.
Important Levels to Watch
Support: $68K and $66K
Resistance: $70K and $72K–$73K
🔍 My Market View
In my opinion, $BITCOIN still looks weak in the short term. If BTC manages to hold its support and recover above $70K, we could see a positive move.
However, if selling pressure continues, another downside move is possible.
💭 Final Thoughts
I think this is a time to stay patient and watch the market carefully. $BITCOIN can recover, but we should not ignore the possibility of further correction.
What do you think? Is BTC ready for a comeback or more downside ahead? 👀
#Bitcoin #BTC #CryptoMarketAlert #BTCAnalysis
Bitcoin at $68K – Recovery Coming or More Downside Ahead?
$BITCOIN is currently facing strong selling pressure, with its price dropping towards the $68K–$69K zone. The recent decline has created uncertainty in the crypto market, and investors are closely watching BTC's next move.
Important Levels to Watch
Support: $68K and $66K
Resistance: $70K and $72K–$73K
🔍 My Market View
In my opinion, $BITCOIN still looks weak in the short term. If BTC manages to hold its support and recover above $70K, we could see a positive move.
However, if selling pressure continues, another downside move is possible.
💭 Final Thoughts
I think this is a time to stay patient and watch the market carefully. $BITCOIN can recover, but we should not ignore the possibility of further correction.
What do you think? Is BTC ready for a comeback or more downside ahead? 👀
#Bitcoin #BTC #CryptoMarketAlert #BTCAnalysis
Important Levels to Watch
Support: $68K and $66K
Resistance: $70K and $72K–$73K
🔍 My Market View
In my opinion, $BITCOIN still looks weak in the short term. If BTC manages to hold its support and recover above $70K, we could see a positive move.
However, if selling pressure continues, another downside move is possible.
💭 Final Thoughts
I think this is a time to stay patient and watch the market carefully. $BITCOIN can recover, but we should not ignore the possibility of further correction.
What do you think? Is BTC ready for a comeback or more downside ahead? 👀
#Bitcoin #BTC #CryptoMarketAlert #BTCAnalysis
32

·
--
🚨 $BTC — BITCOIN FACES A MAJOR MARKET SHAKE-UP! 📉
Bitcoin is under heavy selling pressure as bearish momentum takes control of the crypto market.
After losing key price levels, BTC is now testing an important support zone.
📉 **What’s Happening?**
• Sellers are dominating short-term price action.
• Market volatility is increasing.
• Investors are becoming more cautious.
• Oversold conditions could trigger a temporary bounce.
🎯 **Key Levels to Watch:**
🔴 Resistance: $72,000 – $73,600
🟢 Support: $68,150 – $65,000
⚠️ **My Market Outlook:**
If BTC fails to hold its support, another downside move could follow.
However, a strong recovery above $72K could bring bullish momentum back.
I'm watching closely before taking any major position.
**One question remains: Is this the beginning of a deeper correction, or a golden buying opportunity?** 👀
#BTC走势分析 TC #Crypto #CryptoMarke t #trading #BTCAnalysis
🚨 $BTC — BITCOIN FACES A MAJOR MARKET SHAKE-UP! 📉
Bitcoin is under heavy selling pressure as bearish momentum takes control of the crypto market.
After losing key price levels, BTC is now testing an important support zone.
📉 **What’s Happening?**
• Sellers are dominating short-term price action.
• Market volatility is increasing.
• Investors are becoming more cautious.
• Oversold conditions could trigger a temporary bounce.
🎯 **Key Levels to Watch:**
🔴 Resistance: $72,000 – $73,600
🟢 Support: $68,150 – $65,000
⚠️ **My Market Outlook:**
If BTC fails to hold its support, another downside move could follow.
However, a strong recovery above $72K could bring bullish momentum back.
I'm watching closely before taking any major position.
**One question remains: Is this the beginning of a deeper correction, or a golden buying opportunity?** 👀
#BTC走势分析 TC #Crypto #CryptoMarke t #trading #BTCAnalysis
Bitcoin is under heavy selling pressure as bearish momentum takes control of the crypto market.
After losing key price levels, BTC is now testing an important support zone.
📉 **What’s Happening?**
• Sellers are dominating short-term price action.
• Market volatility is increasing.
• Investors are becoming more cautious.
• Oversold conditions could trigger a temporary bounce.
🎯 **Key Levels to Watch:**
🔴 Resistance: $72,000 – $73,600
🟢 Support: $68,150 – $65,000
⚠️ **My Market Outlook:**
If BTC fails to hold its support, another downside move could follow.
However, a strong recovery above $72K could bring bullish momentum back.
I'm watching closely before taking any major position.
**One question remains: Is this the beginning of a deeper correction, or a golden buying opportunity?** 👀
#BTC走势分析 TC #Crypto #CryptoMarke t #trading #BTCAnalysis
36

🚨 BITCOIN WARNING! ⚠️ Is BTC Preparing for Another Drop or a Big Rebound?
Bitcoin is currently trading around $72,132, and the weekly chart is showing some weakness. 📉
Here’s what I'm watching:
🔴 BTC is below the 7-week Moving Average. 🟡 The $72,400 zone is an important level to watch. 📉 If selling pressure continues, $65,000 could become the next area to watch. 🚀 A strong recovery above $74,300 could bring bullish momentum back.
But the big question is...
Are we heading towards $65K or will Bitcoin recover towards $80K?
👇 Share your prediction!
🐂 BULLISH or 🐻 BEARISH?
Let's discuss!
#BTC #Crypto #BinanceSquare #BTCAnalysis #CryptoTrading
$BTC
{spot}(BTCUSDT)
🚨 BITCOIN WARNING! ⚠️ Is BTC Preparing for Another Drop or a Big Rebound?
Bitcoin is currently trading around $72,132, and the weekly chart is showing some weakness. 📉
Here’s what I'm watching:
🔴 BTC is below the 7-week Moving Average. 🟡 The $72,400 zone is an important level to watch. 📉 If selling pressure continues, $65,000 could become the next area to watch. 🚀 A strong recovery above $74,300 could bring bullish momentum back.
But the big question is...
Are we heading towards $65K or will Bitcoin recover towards $80K?
👇 Share your prediction!
🐂 BULLISH or 🐻 BEARISH?
Let's discuss!
#BTC #Crypto #BinanceSquare #BTCAnalysis #CryptoTrading
$BTC
Bitcoin is currently trading around $72,132, and the weekly chart is showing some weakness. 📉
Here’s what I'm watching:
🔴 BTC is below the 7-week Moving Average. 🟡 The $72,400 zone is an important level to watch. 📉 If selling pressure continues, $65,000 could become the next area to watch. 🚀 A strong recovery above $74,300 could bring bullish momentum back.
But the big question is...
Are we heading towards $65K or will Bitcoin recover towards $80K?
👇 Share your prediction!
🐂 BULLISH or 🐻 BEARISH?
Let's discuss!
#BTC #Crypto #BinanceSquare #BTCAnalysis #CryptoTrading
$BTC

126
Мақала
BTC/USD Complete Analysis — 12 November 2026$BTC /USD Complete Analysis — 12 November 2026
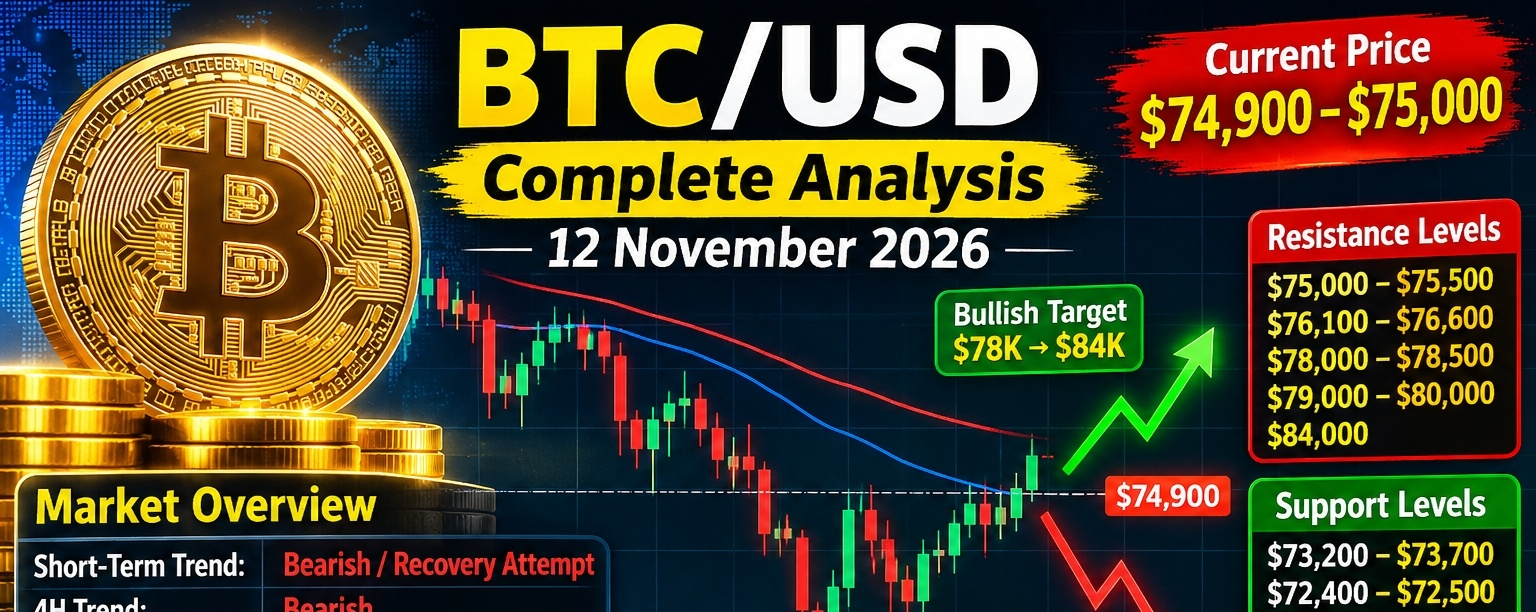
Current price: approximately $74,900–$75,000. $BTC has bounced from the ~$73.2K area, but remains about 7% lower over the past week, so the broader short-term structure is still under pressure.
{spot}(BTCUSDT)
Short-term trend: 🔴 Bearish / recovery attempt
4H trend: Bearish
Daily trend: Bearish
Momentum: Weak, but improving from oversold conditions
Key psychological level: $75,000
$BTC is still trading below important moving-average resistance. Recent technical data put the 200-session average around $78.2K, while the 20- and 50-period averages were around $77.7K and $79.1K, respectively.
🔑 Important Support Levels
Support Importance
$73,200–$73,700 Immediate support
$72,400–$72,500 Strong short-term support
$71,200–$71,300 Major support
$69,700–$70,000 Critical psychological zone
$65,000 Major bearish target if $70K breaks
The $73K–$75K region is currently particularly important because BTC recently reached its lowest level since August.
🚧 Resistance Levels
$75,000–$75,500: Immediate resistance
$76,100–$76,600: Strong resistance
$78,000–$78,500: Major resistance / 200-day area
$79,000–$80,000: Major breakout zone
$84,000: Larger trend-reversal confirmation area
A move above $76.5K would materially improve the short-term structure. Above $78K–$80K, the probability of a larger recovery increases.
📈 Bullish Scenario
If BTC can achieve a 4H/daily close above $76,500, I would watch:
$78,000 → $80,000 → $82,000 → $84,000
A sustained move above $80K would be much more convincing than a simple intraday spike.
📉 Bearish Scenario
If BTC loses $73,000, downside could accelerate toward:
$72,400 → $71,200 → $69,800 → $68,000
A decisive daily close below $70K would make the $65K–$68K region increasingly relevant. Recent market analysis has specifically put $65K back in focus after five consecutive weeks of selling.
📰 Fundamental/Macro Picture
The biggest current problem for BTC is institutional outflows + inflation/rate pressure. U.S. spot Bitcoin ETFs experienced roughly $968.5M of net outflows across November 4–9, while stronger-than-expected October CPI increased concerns about further Fed tightening.
At the same time, derivatives remain very active: BTC futures volume was recently around $44.5B, with approximately $51.6B open interest.
That means a breakout or breakdown can produce large, fast moves because leverage remains substantial.
🎯 My BTC/USD Outlook
Current bias: 🔴 Bearish, but attempting a relief bounce
- 🟢 Above $76.5K: bullish recovery signal
- 🟢 Above $80K: stronger trend reversal
- 🟡 $73K–$76.5K: high-volatility range
- 🔴 Below $73K: bearish continuation
- 🔴 Below $70K: significant downside risk
- 🎯 Bearish target: $65K–$68K
- 🎯 Bullish targets: $78K → $80K → $84K
Trading idea: I would avoid chasing BTC in the middle of the $73K–$76.5K range. The cleaner confirmation is either a break/retest above $76.5K for a long setup or a confirmed breakdown below $73K for a bearish setup.
This is market analysis, not financial advice. Crypto and leveraged trading can result in substantial losses.
#BTCanalysis #BTCUSDTAnalysis #BTC走势分析 #TrendingPredictions #viralmypost
BTC/USD Complete Analysis — 12 November 2026
$BTC /USD Complete Analysis — 12 November 2026
Current price: approximately $74,900–$75,000. $BTC has bounced from the ~$73.2K area, but remains about 7% lower over the past week, so the broader short-term structure is still under pressure.
Short-term trend: 🔴 Bearish / recovery attempt
4H trend: Bearish
Daily trend: Bearish
Momentum: Weak, but improving from oversold conditions
Key psychological level: $75,000
$BTC is still trading below important moving-average resistance. Recent technical data put the 200-session average around $78.2K, while the 20- and 50-period averages were around $77.7K and $79.1K, respectively.
🔑 Important Support Levels
Support Importance
$73,200–$73,700 Immediate support
$72,400–$72,500 Strong short-term support
$71,200–$71,300 Major support
$69,700–$70,000 Critical psychological zone
$65,000 Major bearish target if $70K breaks
The $73K–$75K region is currently particularly important because BTC recently reached its lowest level since August.
🚧 Resistance Levels
$75,000–$75,500: Immediate resistance
$76,100–$76,600: Strong resistance
$78,000–$78,500: Major resistance / 200-day area
$79,000–$80,000: Major breakout zone
$84,000: Larger trend-reversal confirmation area
A move above $76.5K would materially improve the short-term structure. Above $78K–$80K, the probability of a larger recovery increases.
📈 Bullish Scenario
If BTC can achieve a 4H/daily close above $76,500, I would watch:
$78,000 → $80,000 → $82,000 → $84,000
A sustained move above $80K would be much more convincing than a simple intraday spike.
📉 Bearish Scenario
If BTC loses $73,000, downside could accelerate toward:
$72,400 → $71,200 → $69,800 → $68,000
A decisive daily close below $70K would make the $65K–$68K region increasingly relevant. Recent market analysis has specifically put $65K back in focus after five consecutive weeks of selling.
📰 Fundamental/Macro Picture
The biggest current problem for BTC is institutional outflows + inflation/rate pressure. U.S. spot Bitcoin ETFs experienced roughly $968.5M of net outflows across November 4–9, while stronger-than-expected October CPI increased concerns about further Fed tightening.
At the same time, derivatives remain very active: BTC futures volume was recently around $44.5B, with approximately $51.6B open interest.
That means a breakout or breakdown can produce large, fast moves because leverage remains substantial.
🎯 My BTC/USD Outlook
Current bias: 🔴 Bearish, but attempting a relief bounce
- 🟢 Above $76.5K: bullish recovery signal
- 🟢 Above $80K: stronger trend reversal
- 🟡 $73K–$76.5K: high-volatility range
- 🔴 Below $73K: bearish continuation
- 🔴 Below $70K: significant downside risk
- 🎯 Bearish target: $65K–$68K
- 🎯 Bullish targets: $78K → $80K → $84K
Trading idea: I would avoid chasing BTC in the middle of the $73K–$76.5K range. The cleaner confirmation is either a break/retest above $76.5K for a long setup or a confirmed breakdown below $73K for a bearish setup.
This is market analysis, not financial advice. Crypto and leveraged trading can result in substantial losses.
#BTCanalysis #BTCUSDTAnalysis #BTC走势分析 #TrendingPredictions #viralmypost
Current price: approximately $74,900–$75,000. $BTC has bounced from the ~$73.2K area, but remains about 7% lower over the past week, so the broader short-term structure is still under pressure.
Short-term trend: 🔴 Bearish / recovery attempt
4H trend: Bearish
Daily trend: Bearish
Momentum: Weak, but improving from oversold conditions
Key psychological level: $75,000
$BTC is still trading below important moving-average resistance. Recent technical data put the 200-session average around $78.2K, while the 20- and 50-period averages were around $77.7K and $79.1K, respectively.
🔑 Important Support Levels
Support Importance
$73,200–$73,700 Immediate support
$72,400–$72,500 Strong short-term support
$71,200–$71,300 Major support
$69,700–$70,000 Critical psychological zone
$65,000 Major bearish target if $70K breaks
The $73K–$75K region is currently particularly important because BTC recently reached its lowest level since August.
🚧 Resistance Levels
$75,000–$75,500: Immediate resistance
$76,100–$76,600: Strong resistance
$78,000–$78,500: Major resistance / 200-day area
$79,000–$80,000: Major breakout zone
$84,000: Larger trend-reversal confirmation area
A move above $76.5K would materially improve the short-term structure. Above $78K–$80K, the probability of a larger recovery increases.
📈 Bullish Scenario
If BTC can achieve a 4H/daily close above $76,500, I would watch:
$78,000 → $80,000 → $82,000 → $84,000
A sustained move above $80K would be much more convincing than a simple intraday spike.
📉 Bearish Scenario
If BTC loses $73,000, downside could accelerate toward:
$72,400 → $71,200 → $69,800 → $68,000
A decisive daily close below $70K would make the $65K–$68K region increasingly relevant. Recent market analysis has specifically put $65K back in focus after five consecutive weeks of selling.
📰 Fundamental/Macro Picture
The biggest current problem for BTC is institutional outflows + inflation/rate pressure. U.S. spot Bitcoin ETFs experienced roughly $968.5M of net outflows across November 4–9, while stronger-than-expected October CPI increased concerns about further Fed tightening.
At the same time, derivatives remain very active: BTC futures volume was recently around $44.5B, with approximately $51.6B open interest.
That means a breakout or breakdown can produce large, fast moves because leverage remains substantial.
🎯 My BTC/USD Outlook
Current bias: 🔴 Bearish, but attempting a relief bounce
- 🟢 Above $76.5K: bullish recovery signal
- 🟢 Above $80K: stronger trend reversal
- 🟡 $73K–$76.5K: high-volatility range
- 🔴 Below $73K: bearish continuation
- 🔴 Below $70K: significant downside risk
- 🎯 Bearish target: $65K–$68K
- 🎯 Bullish targets: $78K → $80K → $84K
Trading idea: I would avoid chasing BTC in the middle of the $73K–$76.5K range. The cleaner confirmation is either a break/retest above $76.5K for a long setup or a confirmed breakdown below $73K for a bearish setup.
This is market analysis, not financial advice. Crypto and leveraged trading can result in substantial losses.
#BTCanalysis #BTCUSDTAnalysis #BTC走势分析 #TrendingPredictions #viralmypost
155

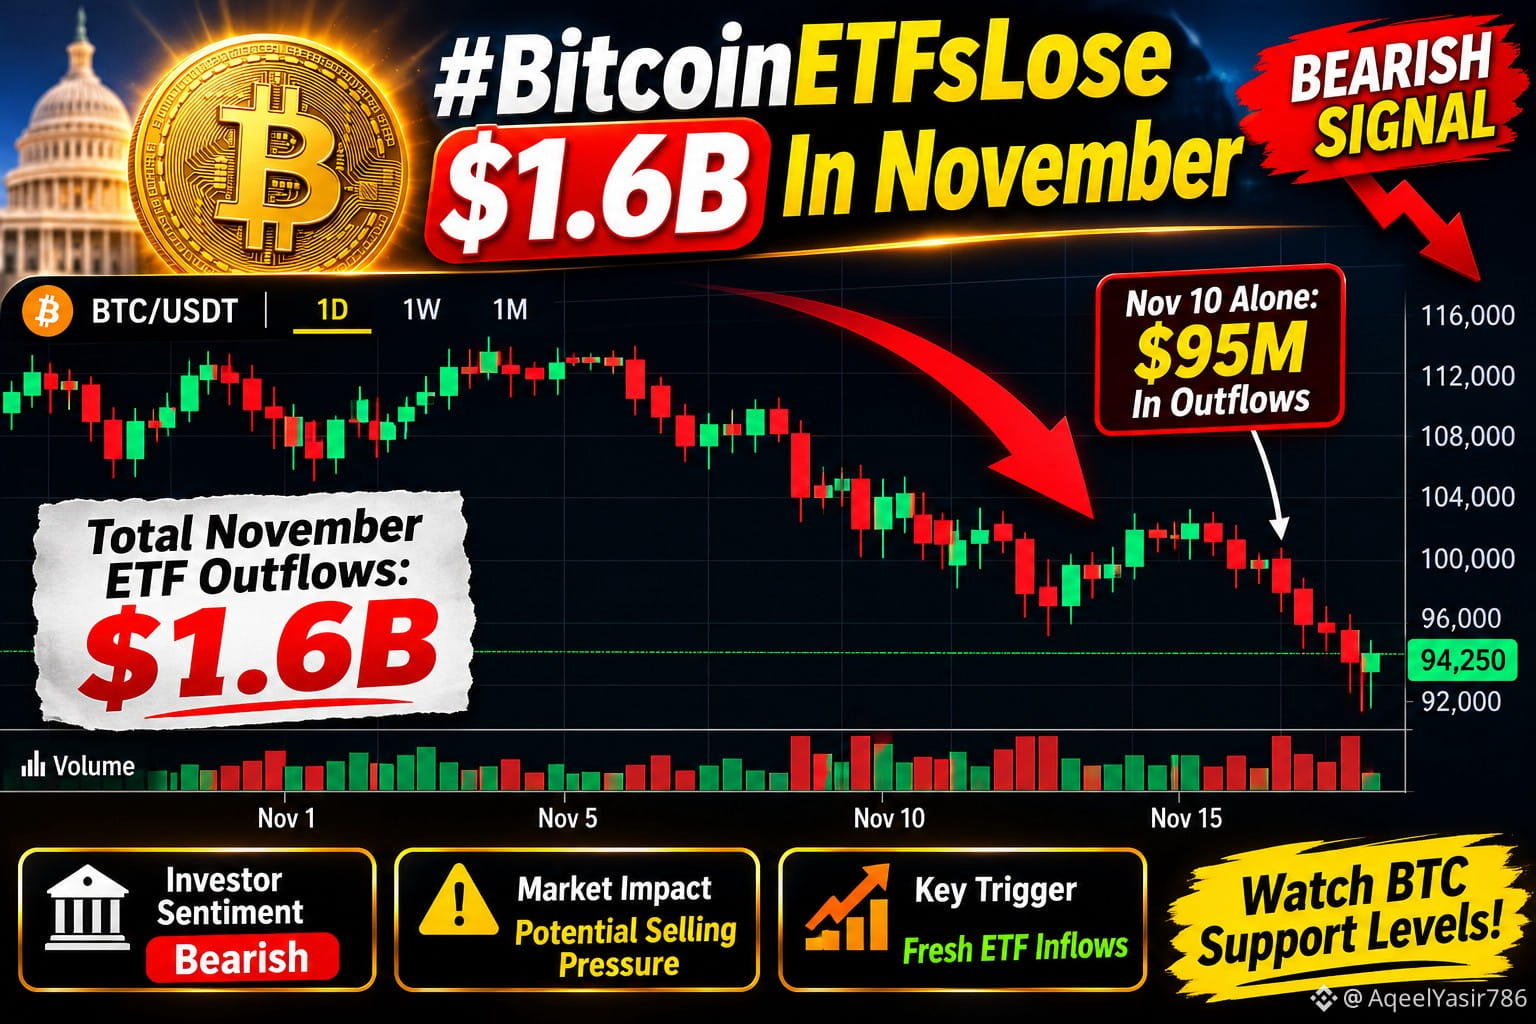
Bitcoin is facing growing institutional selling pressure! US spot Bitcoin ETFs have recorded approximately $1.6 billion in net outflows during November, highlighting weakening investor demand.
According to recent reports, November 10 alone saw another $95 million withdrawn. BlackRock's IBIT also continued its outflow.
streak.
📊 Market Analysis
🔴 ETF Outflows: $1.6 billion
📉 Investor Sentiment: Bearish
⚠️ Market Impact: Potential selling pressure on BTC
🐻 Risk: Further downside if institutional demand remains weak
🚀 Bullish Trigger: Fresh ETF inflows and strong BTC buying volume
My View: Bitcoin needs renewed institutional demand to build a stronger recovery. However, ETF outflows do not guarantee another price drop. Watch support and resistance before making trading decisions.
🔥 Ready-to-post Binance Square caption
Is Institutional Money Leaving Bitcoin? 👀
$BTC | #Bitcoin | #BitcoinETFs! | #CryptoMarkets | #BTCanalysis
ETF outflows are raising concerns, but a reversal in institutional demand could change the market direction.
{alpha}(10x72e4f9f808c49a2a61de9c5896298920dc4eeea9)
{future}(BTCUSDT)
#
Bitcoin is facing growing institutional selling pressure! US spot Bitcoin ETFs have recorded approximately $1.6 billion in net outflows during November, highlighting weakening investor demand.
According to recent reports, November 10 alone saw another $95 million withdrawn. BlackRock's IBIT also continued its outflow.
streak.
📊 Market Analysis
🔴 ETF Outflows: $1.6 billion
📉 Investor Sentiment: Bearish
⚠️ Market Impact: Potential selling pressure on BTC
🐻 Risk: Further downside if institutional demand remains weak
🚀 Bullish Trigger: Fresh ETF inflows and strong BTC buying volume
My View: Bitcoin needs renewed institutional demand to build a stronger recovery. However, ETF outflows do not guarantee another price drop. Watch support and resistance before making trading decisions.
🔥 Ready-to-post Binance Square caption
Is Institutional Money Leaving Bitcoin? 👀
$BTC | #Bitcoin | #BitcoinETFs! | #CryptoMarkets | #BTCanalysis
ETF outflows are raising concerns, but a reversal in institutional demand could change the market direction.
#
According to recent reports, November 10 alone saw another $95 million withdrawn. BlackRock's IBIT also continued its outflow.
streak.
📊 Market Analysis
🔴 ETF Outflows: $1.6 billion
📉 Investor Sentiment: Bearish
⚠️ Market Impact: Potential selling pressure on BTC
🐻 Risk: Further downside if institutional demand remains weak
🚀 Bullish Trigger: Fresh ETF inflows and strong BTC buying volume
My View: Bitcoin needs renewed institutional demand to build a stronger recovery. However, ETF outflows do not guarantee another price drop. Watch support and resistance before making trading decisions.
🔥 Ready-to-post Binance Square caption
Is Institutional Money Leaving Bitcoin? 👀
$BTC | #Bitcoin | #BitcoinETFs! | #CryptoMarkets | #BTCanalysis
ETF outflows are raising concerns, but a reversal in institutional demand could change the market direction.
#
BTC-4,24%
BLKUS+0,05%
105

🚨 BITCOIN: BIG RECOVERY OR ANOTHER CRASH? $80K OR $72K?
The crypto market is at a critical turning point!
Bitcoin is facing selling pressure, Ethereum and altcoins are struggling, and investors are watching every move.
📉 What's happening?
- BTC is testing important support.
- ETH is facing bearish pressure.
- Altcoins remain volatile.
- Traders are watching institutional money flows.
Two Possible Scenarios
Bullish: If BTC breaks above $76K with strong volume, a move toward $80K could become possible.
Bearish: If BTC loses $73K support, another correction toward $72K could follow.
🔥 My Market View
Don't panic. Don't FOMO.
This market rewards patience, smart risk management, and confirmation rather than emotional decisions.
💬 Your prediction?
BTC to $80K?
BTC below $72K?
Comment your target! Let's see who gets it right. 🚀
#Bitcoin #CryptoMarket #BTCanalysis #Ethereum #BİNANCESQUARE
{future}(BTCUSDT)
{future}(XRPUSDT)
🚨 BITCOIN: BIG RECOVERY OR ANOTHER CRASH? $80K OR $72K?
The crypto market is at a critical turning point!
Bitcoin is facing selling pressure, Ethereum and altcoins are struggling, and investors are watching every move.
📉 What's happening?
- BTC is testing important support.
- ETH is facing bearish pressure.
- Altcoins remain volatile.
- Traders are watching institutional money flows.
Two Possible Scenarios
Bullish: If BTC breaks above $76K with strong volume, a move toward $80K could become possible.
Bearish: If BTC loses $73K support, another correction toward $72K could follow.
🔥 My Market View
Don't panic. Don't FOMO.
This market rewards patience, smart risk management, and confirmation rather than emotional decisions.
💬 Your prediction?
BTC to $80K?
BTC below $72K?
Comment your target! Let's see who gets it right. 🚀
#Bitcoin #CryptoMarket #BTCanalysis #Ethereum #BİNANCESQUARE
The crypto market is at a critical turning point!
Bitcoin is facing selling pressure, Ethereum and altcoins are struggling, and investors are watching every move.
📉 What's happening?
- BTC is testing important support.
- ETH is facing bearish pressure.
- Altcoins remain volatile.
- Traders are watching institutional money flows.
Two Possible Scenarios
Bullish: If BTC breaks above $76K with strong volume, a move toward $80K could become possible.
Bearish: If BTC loses $73K support, another correction toward $72K could follow.
🔥 My Market View
Don't panic. Don't FOMO.
This market rewards patience, smart risk management, and confirmation rather than emotional decisions.
💬 Your prediction?
BTC to $80K?
BTC below $72K?
Comment your target! Let's see who gets it right. 🚀
#Bitcoin #CryptoMarket #BTCanalysis #Ethereum #BİNANCESQUARE

320

Мақала
5 semanas de caída: ¿cuándo la espera se convierte en una oportunidad perdida?🚨 Cinco semanas de caída. Bitcoin perdió un 13,5 %. A quienes esperan que baje el precio para comprar... ¿qué están esperando ahora?
📁 Archivo del mercado — ¿mejor precio o mayor certeza? 🤔
📅 10 de noviembre de 2026
📉 El BTC puso fin a cinco semanas consecutivas de pérdidas en Binance. El último cierre semanal fue de 74.851 dólares 💰, por debajo de su media móvil de 50 semanas 📊, que entonces rondaba los 75.535 dólares 🎯.
🏦 La demanda aún tiene que aparecer:
Los ETF al contado de Bitcoin en Estados Unidos registraron salidas netas por valor de 1.282 millones de dólares 💸🚪 entre el 2 y el 6 de noviembre 📅. El lunes 9 de noviembre salieron otros 201 millones de dólares 😬. Esta presión explica por qué quiero ver compras lo bastante fuertes como para respaldar una recuperación 💪📈.
🐻 Una pregunta para los pesimistas:
🔼 Cuando BTC sube, esperan una corrección.
🔽 Y cuando corrige, esperan otra caída.
🌱 Y cuando empieza a recuperarse, vuelven a esperar una corrección.
🎯 Si cada caída del precio te hace bajar otra vez tu precio de entrada objetivo, ¿tienes un plan de compra o estás persiguiendo un mínimo que solo reconocerás cuando ya sea demasiado tarde? ⏳🤷
🎭 El precio que parecía atractivo durante una subida suele dar miedo cuando por fin llega 😨.
📖 Mi opinión:
🧐 Sigo siendo optimista a largo plazo. Perder la media móvil de 50 semanas debilitó mi argumento a favor de una recuperación inmediata ⚠️, y estoy pendiente de esa señal 👀.
🚀 Pero también espero que la demanda regrese. Si aparece una vela alcista fuerte 🟢, algunos de los que hoy piden precios más bajos podrían acabar persiguiendo precios más altos 🏃♂️💨.
📝 Por eso quiero decidir de antemano qué compraré, en qué condiciones y en qué horizonte temporal ⏱️✅.
👀 Lo que quiero ver:
✅ Recuperación de la media móvil de 50 semanas 📈
✅ Compradores que aparezcan en niveles más altos durante los retrocesos 🛒
✅ Que continúen las entradas de capital en los ETF 💰⬆️
💬 Si estás esperando a que baje el precio de Bitcoin antes de comprar, ¿qué condición concreta sigues esperando que se cumpla hoy?
$BTC
#BTCanalysis #bitcoin #bitcoinfiveweeklylosses
5 semanas de caída: ¿cuándo la espera se convierte en una oportunidad perdida?
🚨 Cinco semanas de caída. Bitcoin perdió un 13,5 %. A quienes esperan que baje el precio para comprar... ¿qué están esperando ahora?
📁 Archivo del mercado — ¿mejor precio o mayor certeza? 🤔
📅 10 de noviembre de 2026
📉 El BTC puso fin a cinco semanas consecutivas de pérdidas en Binance. El último cierre semanal fue de 74.851 dólares 💰, por debajo de su media móvil de 50 semanas 📊, que entonces rondaba los 75.535 dólares 🎯.
🏦 La demanda aún tiene que aparecer:
Los ETF al contado de Bitcoin en Estados Unidos registraron salidas netas por valor de 1.282 millones de dólares 💸🚪 entre el 2 y el 6 de noviembre 📅. El lunes 9 de noviembre salieron otros 201 millones de dólares 😬. Esta presión explica por qué quiero ver compras lo bastante fuertes como para respaldar una recuperación 💪📈.
🐻 Una pregunta para los pesimistas:
🔼 Cuando BTC sube, esperan una corrección.
🔽 Y cuando corrige, esperan otra caída.
🌱 Y cuando empieza a recuperarse, vuelven a esperar una corrección.
🎯 Si cada caída del precio te hace bajar otra vez tu precio de entrada objetivo, ¿tienes un plan de compra o estás persiguiendo un mínimo que solo reconocerás cuando ya sea demasiado tarde? ⏳🤷
🎭 El precio que parecía atractivo durante una subida suele dar miedo cuando por fin llega 😨.
📖 Mi opinión:
🧐 Sigo siendo optimista a largo plazo. Perder la media móvil de 50 semanas debilitó mi argumento a favor de una recuperación inmediata ⚠️, y estoy pendiente de esa señal 👀.
🚀 Pero también espero que la demanda regrese. Si aparece una vela alcista fuerte 🟢, algunos de los que hoy piden precios más bajos podrían acabar persiguiendo precios más altos 🏃♂️💨.
📝 Por eso quiero decidir de antemano qué compraré, en qué condiciones y en qué horizonte temporal ⏱️✅.
👀 Lo que quiero ver:
✅ Recuperación de la media móvil de 50 semanas 📈
✅ Compradores que aparezcan en niveles más altos durante los retrocesos 🛒
✅ Que continúen las entradas de capital en los ETF 💰⬆️
💬 Si estás esperando a que baje el precio de Bitcoin antes de comprar, ¿qué condición concreta sigues esperando que se cumpla hoy?
$BTC
#BTCanalysis #bitcoin #bitcoinfiveweeklylosses
📁 Archivo del mercado — ¿mejor precio o mayor certeza? 🤔
📅 10 de noviembre de 2026
📉 El BTC puso fin a cinco semanas consecutivas de pérdidas en Binance. El último cierre semanal fue de 74.851 dólares 💰, por debajo de su media móvil de 50 semanas 📊, que entonces rondaba los 75.535 dólares 🎯.
🏦 La demanda aún tiene que aparecer:
Los ETF al contado de Bitcoin en Estados Unidos registraron salidas netas por valor de 1.282 millones de dólares 💸🚪 entre el 2 y el 6 de noviembre 📅. El lunes 9 de noviembre salieron otros 201 millones de dólares 😬. Esta presión explica por qué quiero ver compras lo bastante fuertes como para respaldar una recuperación 💪📈.
🐻 Una pregunta para los pesimistas:
🔼 Cuando BTC sube, esperan una corrección.
🔽 Y cuando corrige, esperan otra caída.
🌱 Y cuando empieza a recuperarse, vuelven a esperar una corrección.
🎯 Si cada caída del precio te hace bajar otra vez tu precio de entrada objetivo, ¿tienes un plan de compra o estás persiguiendo un mínimo que solo reconocerás cuando ya sea demasiado tarde? ⏳🤷
🎭 El precio que parecía atractivo durante una subida suele dar miedo cuando por fin llega 😨.
📖 Mi opinión:
🧐 Sigo siendo optimista a largo plazo. Perder la media móvil de 50 semanas debilitó mi argumento a favor de una recuperación inmediata ⚠️, y estoy pendiente de esa señal 👀.
🚀 Pero también espero que la demanda regrese. Si aparece una vela alcista fuerte 🟢, algunos de los que hoy piden precios más bajos podrían acabar persiguiendo precios más altos 🏃♂️💨.
📝 Por eso quiero decidir de antemano qué compraré, en qué condiciones y en qué horizonte temporal ⏱️✅.
👀 Lo que quiero ver:
✅ Recuperación de la media móvil de 50 semanas 📈
✅ Compradores que aparezcan en niveles más altos durante los retrocesos 🛒
✅ Que continúen las entradas de capital en los ETF 💰⬆️
💬 Si estás esperando a que baje el precio de Bitcoin antes de comprar, ¿qué condición concreta sigues esperando que se cumpla hoy?
$BTC
#BTCanalysis #bitcoin #bitcoinfiveweeklylosses
Edufds_BA:
Para el que compra con fecha fija, la pregunta se contesta sola: la condición es el calendario, no el precio. Y un dato que matiza lo de que la demanda todavía no aparece: la misma semana de los 1.282 millones de salidas de ETF, Strategy compró 1.036 BTC. Comprador hay; lo que falta es que alcance para tapar a los que se van. Por eso no espero una vela que me dé permiso para entrar. ¿Vos tenés un monto fijo por mes o lo decidís según cómo viene el precio?
1
5
11.4k

·
--
$BTC $BTC $BTC 🚨 BITCOIN ALERT: INSTITUTIONAL SELLING PRESSURE!
Bitcoin is facing a challenging market as institutional ETF outflows increase and major miner MARA sells 13,597 BTC worth approximately $1.1 billion.
📉 ETF outflows raise concerns. 🐻 Market sentiment remains cautious. 🌍 US inflation adds pressure. ⚡ Investors are watching Bitcoin's next move.
BIG QUESTION: Is Bitcoin preparing for another recovery, or could more downside be ahead?
Stay informed. Watch the market. Trade responsibly.
#CryptonewswithJack #BinanceSquareFamily #CryptoMarkets #bitcoinupdate2024 #BTCanalysis
{spot}(BTCUSDT)
$BTC $BTC $BTC 🚨 BITCOIN ALERT: INSTITUTIONAL SELLING PRESSURE!
Bitcoin is facing a challenging market as institutional ETF outflows increase and major miner MARA sells 13,597 BTC worth approximately $1.1 billion.
📉 ETF outflows raise concerns. 🐻 Market sentiment remains cautious. 🌍 US inflation adds pressure. ⚡ Investors are watching Bitcoin's next move.
BIG QUESTION: Is Bitcoin preparing for another recovery, or could more downside be ahead?
Stay informed. Watch the market. Trade responsibly.
#CryptonewswithJack #BinanceSquareFamily #CryptoMarkets #bitcoinupdate2024 #BTCanalysis
Bitcoin is facing a challenging market as institutional ETF outflows increase and major miner MARA sells 13,597 BTC worth approximately $1.1 billion.
📉 ETF outflows raise concerns. 🐻 Market sentiment remains cautious. 🌍 US inflation adds pressure. ⚡ Investors are watching Bitcoin's next move.
BIG QUESTION: Is Bitcoin preparing for another recovery, or could more downside be ahead?
Stay informed. Watch the market. Trade responsibly.
#CryptonewswithJack #BinanceSquareFamily #CryptoMarkets #bitcoinupdate2024 #BTCanalysis

80

Мақала
⏳ 5 أسابيع من الهبوط: متى يتحول الانتظار إلى فرصة ضائعة؟ 🚀🚨 خمسة أسابيع من التراجع. خسر بيتكوين 13.5%. لمن ينتظرون انخفاض السعر للشراء... ما الذي تنتظرونه الآن؟
📁 ملف السوق — سعر أفضل أم يقين أكبر؟ 🤔
📅 10 نوفمبر 2026
📉 أنهى BTC خمسة أسابيع متتالية من الخسائر على منصة Binance. بلغ سعر الإغلاق الأسبوعي الأخير 74,851 دولارًا 💰، دون متوسطه المتحرك لـ50 أسبوعًا 📊، الذي كان آنذاك قرب 75,535 دولارًا 🎯.
🏦 لا يزال الطلب بحاجة إلى الظهور:
سجّلت صناديق بيتكوين المتداولة الفورية في الولايات المتحدة صافي تدفقات خارجة بقيمة 1.282 مليار دولار 💸🚪 خلال الفترة من 2 إلى 6 نوفمبر 📅. وخرج 201 مليون دولار إضافية يوم الاثنين، 9 نوفمبر 😬. يوضح هذا الضغط سبب رغبتي في رؤية شراء قوي بما يكفي لدعم التعافي 💪📈.
🐻 سؤال للمتشائمين:
🔼 عندما يرتفع BTC، ينتظرون تصحيحًا.
🔽 وعندما يصحح، ينتظرون هبوطًا آخر.
🌱 وعندما يبدأ بالتعافي، يعودون إلى انتظار تصحيح.
🎯 إذا كان كل انخفاض في السعر يدفعك إلى خفض سعر دخولك المستهدف مجددًا، فهل لديك خطة للشراء، أم أنك تطارد قاعًا لن تتعرف عليه إلا بعد فوات الأوان؟ ⏳🤷
🎭 غالبًا ما يبدو السعر الذي بدا مغريًا أثناء الارتفاع مخيفًا حين يصل أخيرًا 😨.
📖 وجهة نظري:
🧐 ما زلت متفائلًا على المدى الطويل. خسارة متوسط الحركة لـ50 أسبوعًا أضعفت حجتي بشأن التعافي الفوري ⚠️، وأنا أراقب هذه الإشارة 👀.
🚀 لكنني أتوقع أيضًا عودة الطلب. إذا ظهرت شمعة صعودية قوية 🟢، فقد ينتهي الأمر ببعض من يطالبون اليوم بأسعار أقل إلى ملاحقة أسعار أعلى 🏃♂️💨.
📝 لذلك أريد أن أحدد مسبقًا ما الذي سأشتريه، وتحت أي ظروف، وعلى أي مدى زمني ⏱️✅.
👀 ما أريد رؤيته:
✅ استعادة متوسط الحركة لـ50 أسبوعًا 📈
✅ ظهور مشترين عند مستويات أعلى أثناء التراجعات 🛒
✅ استمرار تدفقات صناديق ETF إلى الداخل 💰⬆️
💬 إذا كنت تنتظر انخفاض سعر بيتكوين قبل الشراء، فما الشرط المحدد الذي لا تزال تنتظر تحققه اليوم؟
$BTC
#BTCanalysis #bitcoin #bitcoinfiveweeklylosses
⏳ 5 أسابيع من الهبوط: متى يتحول الانتظار إلى فرصة ضائعة؟ 🚀
🚨 خمسة أسابيع من التراجع. خسر بيتكوين 13.5%. لمن ينتظرون انخفاض السعر للشراء... ما الذي تنتظرونه الآن؟
📁 ملف السوق — سعر أفضل أم يقين أكبر؟ 🤔
📅 10 نوفمبر 2026
📉 أنهى BTC خمسة أسابيع متتالية من الخسائر على منصة Binance. بلغ سعر الإغلاق الأسبوعي الأخير 74,851 دولارًا 💰، دون متوسطه المتحرك لـ50 أسبوعًا 📊، الذي كان آنذاك قرب 75,535 دولارًا 🎯.
🏦 لا يزال الطلب بحاجة إلى الظهور:
سجّلت صناديق بيتكوين المتداولة الفورية في الولايات المتحدة صافي تدفقات خارجة بقيمة 1.282 مليار دولار 💸🚪 خلال الفترة من 2 إلى 6 نوفمبر 📅. وخرج 201 مليون دولار إضافية يوم الاثنين، 9 نوفمبر 😬. يوضح هذا الضغط سبب رغبتي في رؤية شراء قوي بما يكفي لدعم التعافي 💪📈.
🐻 سؤال للمتشائمين:
🔼 عندما يرتفع BTC، ينتظرون تصحيحًا.
🔽 وعندما يصحح، ينتظرون هبوطًا آخر.
🌱 وعندما يبدأ بالتعافي، يعودون إلى انتظار تصحيح.
🎯 إذا كان كل انخفاض في السعر يدفعك إلى خفض سعر دخولك المستهدف مجددًا، فهل لديك خطة للشراء، أم أنك تطارد قاعًا لن تتعرف عليه إلا بعد فوات الأوان؟ ⏳🤷
🎭 غالبًا ما يبدو السعر الذي بدا مغريًا أثناء الارتفاع مخيفًا حين يصل أخيرًا 😨.
📖 وجهة نظري:
🧐 ما زلت متفائلًا على المدى الطويل. خسارة متوسط الحركة لـ50 أسبوعًا أضعفت حجتي بشأن التعافي الفوري ⚠️، وأنا أراقب هذه الإشارة 👀.
🚀 لكنني أتوقع أيضًا عودة الطلب. إذا ظهرت شمعة صعودية قوية 🟢، فقد ينتهي الأمر ببعض من يطالبون اليوم بأسعار أقل إلى ملاحقة أسعار أعلى 🏃♂️💨.
📝 لذلك أريد أن أحدد مسبقًا ما الذي سأشتريه، وتحت أي ظروف، وعلى أي مدى زمني ⏱️✅.
👀 ما أريد رؤيته:
✅ استعادة متوسط الحركة لـ50 أسبوعًا 📈
✅ ظهور مشترين عند مستويات أعلى أثناء التراجعات 🛒
✅ استمرار تدفقات صناديق ETF إلى الداخل 💰⬆️
💬 إذا كنت تنتظر انخفاض سعر بيتكوين قبل الشراء، فما الشرط المحدد الذي لا تزال تنتظر تحققه اليوم؟
$BTC
#BTCanalysis #bitcoin #bitcoinfiveweeklylosses
📁 ملف السوق — سعر أفضل أم يقين أكبر؟ 🤔
📅 10 نوفمبر 2026
📉 أنهى BTC خمسة أسابيع متتالية من الخسائر على منصة Binance. بلغ سعر الإغلاق الأسبوعي الأخير 74,851 دولارًا 💰، دون متوسطه المتحرك لـ50 أسبوعًا 📊، الذي كان آنذاك قرب 75,535 دولارًا 🎯.
🏦 لا يزال الطلب بحاجة إلى الظهور:
سجّلت صناديق بيتكوين المتداولة الفورية في الولايات المتحدة صافي تدفقات خارجة بقيمة 1.282 مليار دولار 💸🚪 خلال الفترة من 2 إلى 6 نوفمبر 📅. وخرج 201 مليون دولار إضافية يوم الاثنين، 9 نوفمبر 😬. يوضح هذا الضغط سبب رغبتي في رؤية شراء قوي بما يكفي لدعم التعافي 💪📈.
🐻 سؤال للمتشائمين:
🔼 عندما يرتفع BTC، ينتظرون تصحيحًا.
🔽 وعندما يصحح، ينتظرون هبوطًا آخر.
🌱 وعندما يبدأ بالتعافي، يعودون إلى انتظار تصحيح.
🎯 إذا كان كل انخفاض في السعر يدفعك إلى خفض سعر دخولك المستهدف مجددًا، فهل لديك خطة للشراء، أم أنك تطارد قاعًا لن تتعرف عليه إلا بعد فوات الأوان؟ ⏳🤷
🎭 غالبًا ما يبدو السعر الذي بدا مغريًا أثناء الارتفاع مخيفًا حين يصل أخيرًا 😨.
📖 وجهة نظري:
🧐 ما زلت متفائلًا على المدى الطويل. خسارة متوسط الحركة لـ50 أسبوعًا أضعفت حجتي بشأن التعافي الفوري ⚠️، وأنا أراقب هذه الإشارة 👀.
🚀 لكنني أتوقع أيضًا عودة الطلب. إذا ظهرت شمعة صعودية قوية 🟢، فقد ينتهي الأمر ببعض من يطالبون اليوم بأسعار أقل إلى ملاحقة أسعار أعلى 🏃♂️💨.
📝 لذلك أريد أن أحدد مسبقًا ما الذي سأشتريه، وتحت أي ظروف، وعلى أي مدى زمني ⏱️✅.
👀 ما أريد رؤيته:
✅ استعادة متوسط الحركة لـ50 أسبوعًا 📈
✅ ظهور مشترين عند مستويات أعلى أثناء التراجعات 🛒
✅ استمرار تدفقات صناديق ETF إلى الداخل 💰⬆️
💬 إذا كنت تنتظر انخفاض سعر بيتكوين قبل الشراء، فما الشرط المحدد الذي لا تزال تنتظر تحققه اليوم؟
$BTC
#BTCanalysis #bitcoin #bitcoinfiveweeklylosses
El Guardia Ramirez El GR :
yo por ahora sólo veo, que el #Bitcoin va bajando y mi dinero también sólo a espera que vuelva a subir, no pierdo la Esperanza que siendo una de las Criptomoneda más fuerte y estable se RECUPERE y RESURJA cómo El Ave Fénix
1
9
8.6k

·
--
Today is November 11, and two separate Fibonacci time counts land on this exact day, with 74,600 dollars as the line that decides what comes next. 📊
An EdaFace analysis of Bitcoin time cycles points out that 0.618 of the 82 day rally, counted from the September high, and 0.382 of the full 2022 to 2025 bull market, counted from the October 2025 peak, both land on November 11, with the 0.382 fan line sitting near 74,600 dollars. 📰 The same analysis notes Bitcoin bottomed at 57,700 dollars in July, rallied 51 percent in 82 days, and its November 6 low came within 1 percent of that fan line, while the cycle is bottoming now in November and December. My reading is that time counts are a map, not a promise, but when two counts agree on one day and price is sitting just below that line at 73,500 dollars, the day deserves attention, and if 74,600 dollars gives way, the next fan line near 67,700 dollars points toward 68,000 dollars.
Does Bitcoin reclaim 74,600 dollars on the date the cycles point to, or does 68,000 dollars come first? 🤔
Follow for more trades.
#Crypto #Bitcoin #FuturesTrading #TradingSignals #BTCAnalysis
Today is November 11, and two separate Fibonacci time counts land on this exact day, with 74,600 dollars as the line that decides what comes next. 📊
An EdaFace analysis of Bitcoin time cycles points out that 0.618 of the 82 day rally, counted from the September high, and 0.382 of the full 2022 to 2025 bull market, counted from the October 2025 peak, both land on November 11, with the 0.382 fan line sitting near 74,600 dollars. 📰 The same analysis notes Bitcoin bottomed at 57,700 dollars in July, rallied 51 percent in 82 days, and its November 6 low came within 1 percent of that fan line, while the cycle is bottoming now in November and December. My reading is that time counts are a map, not a promise, but when two counts agree on one day and price is sitting just below that line at 73,500 dollars, the day deserves attention, and if 74,600 dollars gives way, the next fan line near 67,700 dollars points toward 68,000 dollars.
Does Bitcoin reclaim 74,600 dollars on the date the cycles point to, or does 68,000 dollars come first? 🤔
Follow for more trades.
#Crypto #Bitcoin #FuturesTrading #TradingSignals #BTCAnalysis
An EdaFace analysis of Bitcoin time cycles points out that 0.618 of the 82 day rally, counted from the September high, and 0.382 of the full 2022 to 2025 bull market, counted from the October 2025 peak, both land on November 11, with the 0.382 fan line sitting near 74,600 dollars. 📰 The same analysis notes Bitcoin bottomed at 57,700 dollars in July, rallied 51 percent in 82 days, and its November 6 low came within 1 percent of that fan line, while the cycle is bottoming now in November and December. My reading is that time counts are a map, not a promise, but when two counts agree on one day and price is sitting just below that line at 73,500 dollars, the day deserves attention, and if 74,600 dollars gives way, the next fan line near 67,700 dollars points toward 68,000 dollars.
Does Bitcoin reclaim 74,600 dollars on the date the cycles point to, or does 68,000 dollars come first? 🤔
Follow for more trades.
#Crypto #Bitcoin #FuturesTrading #TradingSignals #BTCAnalysis

43

BITCOIN UNDER PRESSURE: FIVE RED WEEKS, BILLIONS IN ETF OUTFLOWS — IS THE REAL BUYING OPPORTUNITY H📉 Five consecutive losing weeks. A 13.5% correction. And institutional demand is still struggling to return.
THE MARKET FILE — BUY THE DIP OR WAIT FOR CONFIRMATION?
📅 November 10, 2026
$BTC is facing another difficult test as selling pressure continues to weigh on the crypto market.
Bitcoin recently slipped below $75,000, briefly touching approximately $73,588 as bearish momentum intensified. It is also trading below its 50-week moving average, which sits near $75,488.
🏦 INSTITUTIONAL INVESTORS ARE STILL SELLING
US spot Bitcoin ETFs recorded approximately $1.28 billion in net outflows during the week of November 2–6.
The pressure continued on Monday, November 9, with another $201 million leaving these investment products.
Meanwhile, Bitcoin miner MARA disclosed selling 13,597 BTC over the past six weeks, adding another important supply factor to the market.
📊 INFLATION ADDS ANOTHER CHALLENGE
The latest US October CPI report showed:
🔴 Headline CPI: +0.4% month over month
🔴 Core CPI: +0.3% month over month
Both figures came in above expectations, increasing concerns about inflation and potentially tighter monetary policy.
🐻 ARE THE BEARS GETTING TOO COMFORTABLE?
Some investors keep waiting for Bitcoin to fall further before entering.
But what happens if the market suddenly reverses?
Waiting for a perfect bottom can mean missing the recovery. On the other hand, buying too early during a strong downtrend carries significant risk.
📖 MY MARKET OUTLOOK
I remain interested in Bitcoin's long-term potential, but short-term conditions demand caution.
The loss of the 50-week moving average, persistent ETF withdrawals, and increased liquidations make an immediate bullish reversal less certain.
I want to see genuine buying demand before becoming more confident.
👀 THREE SIGNALS I'M WATCHING
1️⃣ BTC reclaiming the $75,500–$76,000 resistance area.
2️⃣ Bitcoin ETFs returning to sustained positive inflows.
3️⃣ Price forming higher lows with stronger spot buying volume.
🔥 THE BIG QUESTION:
Are you buying Bitcoin at these discounted levels, or waiting for stronger confirmation before entering?
Is $73,000 the beginning of a major accumulation opportunity, or could BTC experience another leg down?
👇 Let's discuss!
$BTC
#bitcoin #BTCanalysis #bitcoinfiveweeklylosses
{spot}(BTCUSDT)
BITCOIN UNDER PRESSURE: FIVE RED WEEKS, BILLIONS IN ETF OUTFLOWS — IS THE REAL BUYING OPPORTUNITY H
📉 Five consecutive losing weeks. A 13.5% correction. And institutional demand is still struggling to return.
THE MARKET FILE — BUY THE DIP OR WAIT FOR CONFIRMATION?
📅 November 10, 2026
$BTC is facing another difficult test as selling pressure continues to weigh on the crypto market.
Bitcoin recently slipped below $75,000, briefly touching approximately $73,588 as bearish momentum intensified. It is also trading below its 50-week moving average, which sits near $75,488.
🏦 INSTITUTIONAL INVESTORS ARE STILL SELLING
US spot Bitcoin ETFs recorded approximately $1.28 billion in net outflows during the week of November 2–6.
The pressure continued on Monday, November 9, with another $201 million leaving these investment products.
Meanwhile, Bitcoin miner MARA disclosed selling 13,597 BTC over the past six weeks, adding another important supply factor to the market.
📊 INFLATION ADDS ANOTHER CHALLENGE
The latest US October CPI report showed:
🔴 Headline CPI: +0.4% month over month
🔴 Core CPI: +0.3% month over month
Both figures came in above expectations, increasing concerns about inflation and potentially tighter monetary policy.
🐻 ARE THE BEARS GETTING TOO COMFORTABLE?
Some investors keep waiting for Bitcoin to fall further before entering.
But what happens if the market suddenly reverses?
Waiting for a perfect bottom can mean missing the recovery. On the other hand, buying too early during a strong downtrend carries significant risk.
📖 MY MARKET OUTLOOK
I remain interested in Bitcoin's long-term potential, but short-term conditions demand caution.
The loss of the 50-week moving average, persistent ETF withdrawals, and increased liquidations make an immediate bullish reversal less certain.
I want to see genuine buying demand before becoming more confident.
👀 THREE SIGNALS I'M WATCHING
1️⃣ BTC reclaiming the $75,500–$76,000 resistance area.
2️⃣ Bitcoin ETFs returning to sustained positive inflows.
3️⃣ Price forming higher lows with stronger spot buying volume.
🔥 THE BIG QUESTION:
Are you buying Bitcoin at these discounted levels, or waiting for stronger confirmation before entering?
Is $73,000 the beginning of a major accumulation opportunity, or could BTC experience another leg down?
👇 Let's discuss!
$BTC
#bitcoin #BTCanalysis #bitcoinfiveweeklylosses
THE MARKET FILE — BUY THE DIP OR WAIT FOR CONFIRMATION?
📅 November 10, 2026
$BTC is facing another difficult test as selling pressure continues to weigh on the crypto market.
Bitcoin recently slipped below $75,000, briefly touching approximately $73,588 as bearish momentum intensified. It is also trading below its 50-week moving average, which sits near $75,488.
🏦 INSTITUTIONAL INVESTORS ARE STILL SELLING
US spot Bitcoin ETFs recorded approximately $1.28 billion in net outflows during the week of November 2–6.
The pressure continued on Monday, November 9, with another $201 million leaving these investment products.
Meanwhile, Bitcoin miner MARA disclosed selling 13,597 BTC over the past six weeks, adding another important supply factor to the market.
📊 INFLATION ADDS ANOTHER CHALLENGE
The latest US October CPI report showed:
🔴 Headline CPI: +0.4% month over month
🔴 Core CPI: +0.3% month over month
Both figures came in above expectations, increasing concerns about inflation and potentially tighter monetary policy.
🐻 ARE THE BEARS GETTING TOO COMFORTABLE?
Some investors keep waiting for Bitcoin to fall further before entering.
But what happens if the market suddenly reverses?
Waiting for a perfect bottom can mean missing the recovery. On the other hand, buying too early during a strong downtrend carries significant risk.
📖 MY MARKET OUTLOOK
I remain interested in Bitcoin's long-term potential, but short-term conditions demand caution.
The loss of the 50-week moving average, persistent ETF withdrawals, and increased liquidations make an immediate bullish reversal less certain.
I want to see genuine buying demand before becoming more confident.
👀 THREE SIGNALS I'M WATCHING
1️⃣ BTC reclaiming the $75,500–$76,000 resistance area.
2️⃣ Bitcoin ETFs returning to sustained positive inflows.
3️⃣ Price forming higher lows with stronger spot buying volume.
🔥 THE BIG QUESTION:
Are you buying Bitcoin at these discounted levels, or waiting for stronger confirmation before entering?
Is $73,000 the beginning of a major accumulation opportunity, or could BTC experience another leg down?
👇 Let's discuss!
$BTC
#bitcoin #BTCanalysis #bitcoinfiveweeklylosses
El Guardia Ramirez El GR :
muy buen punto de vista y muy buena posición de Cautela, y muy buena información
2
4
8.6k

·
--
Жоғары (өспелі)
🚨 Five red weeks. Bitcoin lost 13.5%.
Those waiting for a dip to buy… what are you waiting for now?
THE MARKET FILE — A BETTER PRICE OR MORE CERTAINTY?
November 10, 2026
BTC closed five consecutive losing weeks on Binance.
The latest weekly close was $74,851, below its 50-week moving average, then near $75,535.
🏦 DEMAND STILL NEEDS TO SHOW UP
U.S. spot Bitcoin ETFs recorded $1.282 billion in net outflows from November 2–6.
Another $201 million left on Monday, November 9.
That pressure explains why I want buying strong enough to sustain rebounds.
🐻 A QUESTION FOR THE BEARS
When BTC rises, they wait for a correction.
When it corrects, they wait for another drop.
When it starts recovering, they go back to waiting for a correction.
If every lower price makes you lower your entry again, do you have a buying plan, or are you chasing a bottom you'll only recognize afterward?
The price that looked attractive during the rally often feels frightening when it finally arrives.
📖 MY TAKE
I remain bullish long term. Losing the 50-week moving average weakened my case for an immediate recovery, and I'm watching that signal.
But I also expect demand to return. If a strong bullish candle appears, some of those asking for lower prices today could end up chasing higher prices.
That's why I want to define in advance what I'd buy, under what conditions and over what horizon.
👀 WHAT I WANT TO SEE
A reclaim of the 50-week moving average, pullbacks finding buyers at higher levels and sustained ETF inflows.
💬 If you were waiting for Bitcoin to drop before buying, what specific condition are you still waiting for today?
$BTC
{future}(BTCUSDT)
#bitcoin #BTCanalysis
#bitcoinfiveweeklylosses
🚨 Five red weeks. Bitcoin lost 13.5%.
Those waiting for a dip to buy… what are you waiting for now?
THE MARKET FILE — A BETTER PRICE OR MORE CERTAINTY?
November 10, 2026
BTC closed five consecutive losing weeks on Binance.
The latest weekly close was $74,851, below its 50-week moving average, then near $75,535.
🏦 DEMAND STILL NEEDS TO SHOW UP
U.S. spot Bitcoin ETFs recorded $1.282 billion in net outflows from November 2–6.
Another $201 million left on Monday, November 9.
That pressure explains why I want buying strong enough to sustain rebounds.
🐻 A QUESTION FOR THE BEARS
When BTC rises, they wait for a correction.
When it corrects, they wait for another drop.
When it starts recovering, they go back to waiting for a correction.
If every lower price makes you lower your entry again, do you have a buying plan, or are you chasing a bottom you'll only recognize afterward?
The price that looked attractive during the rally often feels frightening when it finally arrives.
📖 MY TAKE
I remain bullish long term. Losing the 50-week moving average weakened my case for an immediate recovery, and I'm watching that signal.
But I also expect demand to return. If a strong bullish candle appears, some of those asking for lower prices today could end up chasing higher prices.
That's why I want to define in advance what I'd buy, under what conditions and over what horizon.
👀 WHAT I WANT TO SEE
A reclaim of the 50-week moving average, pullbacks finding buyers at higher levels and sustained ETF inflows.
💬 If you were waiting for Bitcoin to drop before buying, what specific condition are you still waiting for today?
$BTC
#bitcoin #BTCanalysis
#bitcoinfiveweeklylosses
Those waiting for a dip to buy… what are you waiting for now?
THE MARKET FILE — A BETTER PRICE OR MORE CERTAINTY?
November 10, 2026
BTC closed five consecutive losing weeks on Binance.
The latest weekly close was $74,851, below its 50-week moving average, then near $75,535.
🏦 DEMAND STILL NEEDS TO SHOW UP
U.S. spot Bitcoin ETFs recorded $1.282 billion in net outflows from November 2–6.
Another $201 million left on Monday, November 9.
That pressure explains why I want buying strong enough to sustain rebounds.
🐻 A QUESTION FOR THE BEARS
When BTC rises, they wait for a correction.
When it corrects, they wait for another drop.
When it starts recovering, they go back to waiting for a correction.
If every lower price makes you lower your entry again, do you have a buying plan, or are you chasing a bottom you'll only recognize afterward?
The price that looked attractive during the rally often feels frightening when it finally arrives.
📖 MY TAKE
I remain bullish long term. Losing the 50-week moving average weakened my case for an immediate recovery, and I'm watching that signal.
But I also expect demand to return. If a strong bullish candle appears, some of those asking for lower prices today could end up chasing higher prices.
That's why I want to define in advance what I'd buy, under what conditions and over what horizon.
👀 WHAT I WANT TO SEE
A reclaim of the 50-week moving average, pullbacks finding buyers at higher levels and sustained ETF inflows.
💬 If you were waiting for Bitcoin to drop before buying, what specific condition are you still waiting for today?
$BTC
#bitcoin #BTCanalysis
#bitcoinfiveweeklylosses

majspace:
Sounds good — let's check back after the weekly close and see if the flows and price are telling the same story.
36
1
16
18.8k

·
--
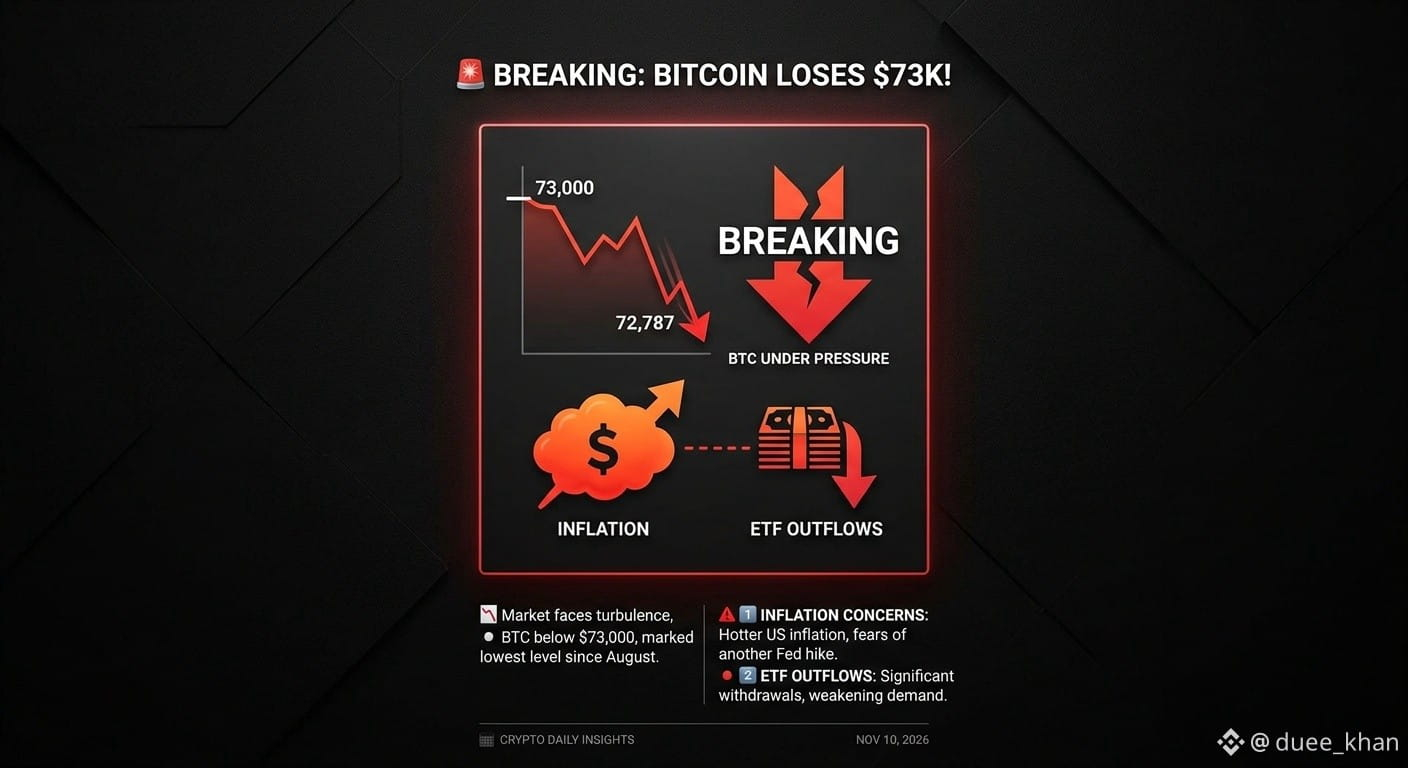
🚨 BREAKING: CRYPTO MARKET UNDER PRESSURE! $BTC LOSES $73K AS SELLING INTENSIFIES! 📉
The crypto market is facing fresh turbulence as $BTC drops below $73,000, marking its lowest level since August.
⚠️ What's Driving the Market Down?
1️⃣ Inflation Concerns: Hotter-than-expected US inflation is increasing fears of another Federal Reserve rate hike.
2️⃣ ETF Outflows: $BTC investment funds are seeing significant withdrawals, showing weakening institutional demand
#BTC #BTCanalysis #CryptoMarket #HotCPIDecemberHikePriced
{spot}(BTCUSDT)
🚨 BREAKING: CRYPTO MARKET UNDER PRESSURE! $BTC LOSES $73K AS SELLING INTENSIFIES! 📉
The crypto market is facing fresh turbulence as $BTC drops below $73,000, marking its lowest level since August.
⚠️ What's Driving the Market Down?
1️⃣ Inflation Concerns: Hotter-than-expected US inflation is increasing fears of another Federal Reserve rate hike.
2️⃣ ETF Outflows: $BTC investment funds are seeing significant withdrawals, showing weakening institutional demand
#BTC #BTCanalysis #CryptoMarket #HotCPIDecemberHikePriced
The crypto market is facing fresh turbulence as $BTC drops below $73,000, marking its lowest level since August.
⚠️ What's Driving the Market Down?
1️⃣ Inflation Concerns: Hotter-than-expected US inflation is increasing fears of another Federal Reserve rate hike.
2️⃣ ETF Outflows: $BTC investment funds are seeing significant withdrawals, showing weakening institutional demand
#BTC #BTCanalysis #CryptoMarket #HotCPIDecemberHikePriced
2
112

·
--
Төмен (кемімелі)
🚨 Cinco semanas en rojo. Bitcoin perdió un 13,5 %.
A quienes esperaban una caída para comprar… ¿qué están esperando ahora?
EL INFORME DEL MERCADO — ¿UN MEJOR PRECIO O MÁS CERTEZA?
10 de noviembre de 2026
BTC cerró cinco semanas consecutivas a la baja en Binance.
El último cierre semanal fue de $74,851, por debajo de su media móvil de 50 semanas, entonces cercana a $75,535.
🏦 LA DEMANDA TODAVÍA TIENE QUE APARECER
Los ETF de Bitcoin al contado de EE. UU. registraron salidas netas de $1.282 millones entre el 2 y el 6 de noviembre.
El lunes 9 de noviembre salieron otros $201 millones.
Esa presión explica por qué quiero que las compras sean lo bastante fuertes como para sostener los rebotes.
🐻 UNA PREGUNTA PARA LOS BAJISTAS
Cuando BTC sube, esperan una corrección.
Cuando corrige, esperan otra caída.
Cuando empieza a recuperarse, vuelven a esperar una corrección.
Si cada precio más bajo hace que vuelvas a bajar tu precio de entrada, ¿tienes un plan de compra o estás persiguiendo un mínimo que solo reconocerás después?
El precio que parecía atractivo durante el repunte suele dar miedo cuando por fin llega.
📖 MI OPINIÓN
Sigo siendo optimista a largo plazo. Perder la media móvil de 50 semanas debilitó mi argumento a favor de una recuperación inmediata, y estoy atento a esa señal.
Pero también espero que la demanda regrese. Si aparece una vela alcista fuerte, algunos de los que hoy piden precios más bajos podrían terminar persiguiendo precios más altos.
Por eso quiero definir de antemano qué compraría, en qué condiciones y en qué horizonte temporal.
👀 LO QUE QUIERO VER
Que recupere la media móvil de 50 semanas, que las caídas encuentren compradores en niveles más altos y que se mantengan las entradas de capital en los ETF.
💬 Si esperabas que Bitcoin bajara antes de comprar, ¿qué condición concreta sigues esperando hoy?
$BTC
{spot}(BTCUSDT)
#bitcoin #BTCanalysis
🚨 Cinco semanas en rojo. Bitcoin perdió un 13,5 %.
A quienes esperaban una caída para comprar… ¿qué están esperando ahora?
EL INFORME DEL MERCADO — ¿UN MEJOR PRECIO O MÁS CERTEZA?
10 de noviembre de 2026
BTC cerró cinco semanas consecutivas a la baja en Binance.
El último cierre semanal fue de $74,851, por debajo de su media móvil de 50 semanas, entonces cercana a $75,535.
🏦 LA DEMANDA TODAVÍA TIENE QUE APARECER
Los ETF de Bitcoin al contado de EE. UU. registraron salidas netas de $1.282 millones entre el 2 y el 6 de noviembre.
El lunes 9 de noviembre salieron otros $201 millones.
Esa presión explica por qué quiero que las compras sean lo bastante fuertes como para sostener los rebotes.
🐻 UNA PREGUNTA PARA LOS BAJISTAS
Cuando BTC sube, esperan una corrección.
Cuando corrige, esperan otra caída.
Cuando empieza a recuperarse, vuelven a esperar una corrección.
Si cada precio más bajo hace que vuelvas a bajar tu precio de entrada, ¿tienes un plan de compra o estás persiguiendo un mínimo que solo reconocerás después?
El precio que parecía atractivo durante el repunte suele dar miedo cuando por fin llega.
📖 MI OPINIÓN
Sigo siendo optimista a largo plazo. Perder la media móvil de 50 semanas debilitó mi argumento a favor de una recuperación inmediata, y estoy atento a esa señal.
Pero también espero que la demanda regrese. Si aparece una vela alcista fuerte, algunos de los que hoy piden precios más bajos podrían terminar persiguiendo precios más altos.
Por eso quiero definir de antemano qué compraría, en qué condiciones y en qué horizonte temporal.
👀 LO QUE QUIERO VER
Que recupere la media móvil de 50 semanas, que las caídas encuentren compradores en niveles más altos y que se mantengan las entradas de capital en los ETF.
💬 Si esperabas que Bitcoin bajara antes de comprar, ¿qué condición concreta sigues esperando hoy?
$BTC
#bitcoin #BTCanalysis
A quienes esperaban una caída para comprar… ¿qué están esperando ahora?
EL INFORME DEL MERCADO — ¿UN MEJOR PRECIO O MÁS CERTEZA?
10 de noviembre de 2026
BTC cerró cinco semanas consecutivas a la baja en Binance.
El último cierre semanal fue de $74,851, por debajo de su media móvil de 50 semanas, entonces cercana a $75,535.
🏦 LA DEMANDA TODAVÍA TIENE QUE APARECER
Los ETF de Bitcoin al contado de EE. UU. registraron salidas netas de $1.282 millones entre el 2 y el 6 de noviembre.
El lunes 9 de noviembre salieron otros $201 millones.
Esa presión explica por qué quiero que las compras sean lo bastante fuertes como para sostener los rebotes.
🐻 UNA PREGUNTA PARA LOS BAJISTAS
Cuando BTC sube, esperan una corrección.
Cuando corrige, esperan otra caída.
Cuando empieza a recuperarse, vuelven a esperar una corrección.
Si cada precio más bajo hace que vuelvas a bajar tu precio de entrada, ¿tienes un plan de compra o estás persiguiendo un mínimo que solo reconocerás después?
El precio que parecía atractivo durante el repunte suele dar miedo cuando por fin llega.
📖 MI OPINIÓN
Sigo siendo optimista a largo plazo. Perder la media móvil de 50 semanas debilitó mi argumento a favor de una recuperación inmediata, y estoy atento a esa señal.
Pero también espero que la demanda regrese. Si aparece una vela alcista fuerte, algunos de los que hoy piden precios más bajos podrían terminar persiguiendo precios más altos.
Por eso quiero definir de antemano qué compraría, en qué condiciones y en qué horizonte temporal.
👀 LO QUE QUIERO VER
Que recupere la media móvil de 50 semanas, que las caídas encuentren compradores en niveles más altos y que se mantengan las entradas de capital en los ETF.
💬 Si esperabas que Bitcoin bajara antes de comprar, ¿qué condición concreta sigues esperando hoy?
$BTC
#bitcoin #BTCanalysis

128

🚨 $BTC AT A CRITICAL LEVEL! IS A BOUNCE COMING OR MORE PAIN AHEAD? 🐻
$BTC is currently trading around $73,948, and the daily chart is sending some interesting signals!
📉 What the 1D chart is telling us:
🔴 BTC has faced strong rejection from the $87,385 high.
⚠️ Price is approaching an important support zone around $73,300.
📊 RSI (6) is sitting at 28.7 — entering oversold territory.
🔥 Stoch RSI is near 9.8, showing extremely weak short-term momentum.
🎯 KEY LEVELS TO WATCH:
* $73,300 — Critical support
* $75,800 — First resistance
* $82,350 — Major resistance
* $87,385 — Previous swing high
💡 MY TAKE:
The market looks weak, but oversold conditions could trigger a relief bounce. However, don’t mistake an oversold indicator for a confirmed reversal.
A daily close below $73,300 could bring more downside pressure. Reclaiming $75,800 could be the first bullish signal.
👀 NOW I WANT YOUR OPINION!
Are you:
🐂 TEAM BULL — Buying this dip?
🐻 TEAM BEAR — Expecting another crash?
Drop your prediction below! 👇
Let’s see who gets BTC right! 🚀
Always DYOR
NFA
#Bitcoin #CryptoTrading #BinanceSquare #BTCAnalysis
{future}(BTCUSDT)
🚨 $BTC AT A CRITICAL LEVEL! IS A BOUNCE COMING OR MORE PAIN AHEAD? 🐻
$BTC is currently trading around $73,948, and the daily chart is sending some interesting signals!
📉 What the 1D chart is telling us:
🔴 BTC has faced strong rejection from the $87,385 high.
⚠️ Price is approaching an important support zone around $73,300.
📊 RSI (6) is sitting at 28.7 — entering oversold territory.
🔥 Stoch RSI is near 9.8, showing extremely weak short-term momentum.
🎯 KEY LEVELS TO WATCH:
* $73,300 — Critical support
* $75,800 — First resistance
* $82,350 — Major resistance
* $87,385 — Previous swing high
💡 MY TAKE:
The market looks weak, but oversold conditions could trigger a relief bounce. However, don’t mistake an oversold indicator for a confirmed reversal.
A daily close below $73,300 could bring more downside pressure. Reclaiming $75,800 could be the first bullish signal.
👀 NOW I WANT YOUR OPINION!
Are you:
🐂 TEAM BULL — Buying this dip?
🐻 TEAM BEAR — Expecting another crash?
Drop your prediction below! 👇
Let’s see who gets BTC right! 🚀
Always DYOR
NFA
#Bitcoin #CryptoTrading #BinanceSquare #BTCAnalysis
$BTC is currently trading around $73,948, and the daily chart is sending some interesting signals!
📉 What the 1D chart is telling us:
🔴 BTC has faced strong rejection from the $87,385 high.
⚠️ Price is approaching an important support zone around $73,300.
📊 RSI (6) is sitting at 28.7 — entering oversold territory.
🔥 Stoch RSI is near 9.8, showing extremely weak short-term momentum.
🎯 KEY LEVELS TO WATCH:
* $73,300 — Critical support
* $75,800 — First resistance
* $82,350 — Major resistance
* $87,385 — Previous swing high
💡 MY TAKE:
The market looks weak, but oversold conditions could trigger a relief bounce. However, don’t mistake an oversold indicator for a confirmed reversal.
A daily close below $73,300 could bring more downside pressure. Reclaiming $75,800 could be the first bullish signal.
👀 NOW I WANT YOUR OPINION!
Are you:
🐂 TEAM BULL — Buying this dip?
🐻 TEAM BEAR — Expecting another crash?
Drop your prediction below! 👇
Let’s see who gets BTC right! 🚀
Always DYOR
NFA
#Bitcoin #CryptoTrading #BinanceSquare #BTCAnalysis
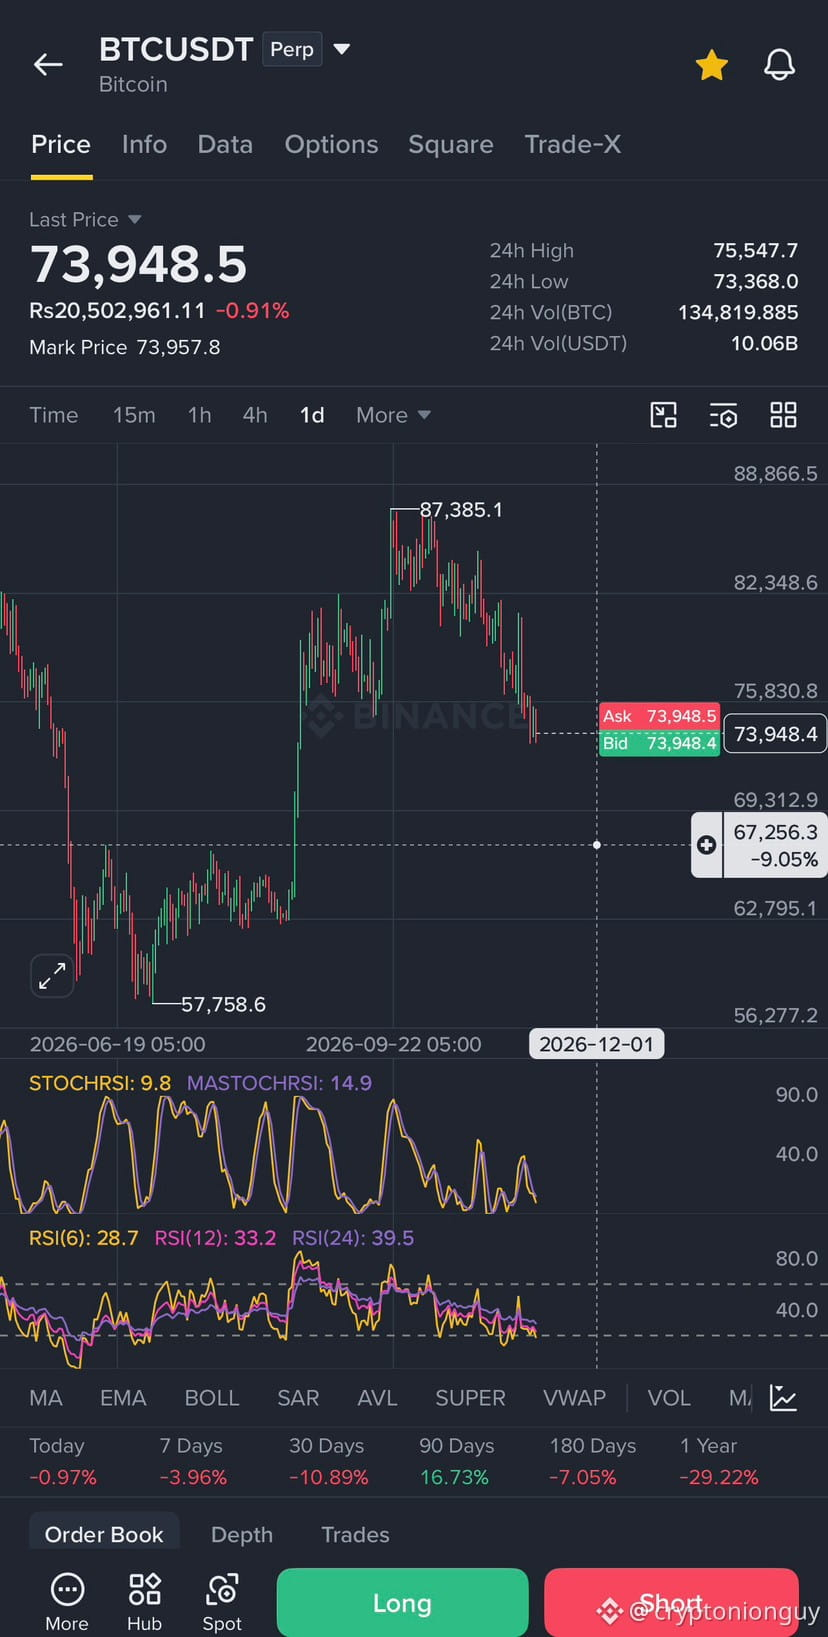
112

🚨 THE CRYPTO MARKET IS TESTING EVERY INVESTOR'S PATIENCE!
Bitcoin is facing pressure, Ethereum is struggling, and market sentiment remains cautious.
$BTC
But here's something worth thinking about:
📉 When the market falls, weak hands panic.
🧠 Experienced investors slow down, study the data, and manage their risk.
$BTC
🔥 The next big opportunity might come when nobody expects it.
Here are 3 things I'm watching right now:
$BTC
1️⃣ Bitcoin's ability to hold key support levels.
2️⃣ Institutional money and Bitcoin ETF flows.
3️⃣ US CPI data and its potential impact on crypto.
Remember: A red market doesn't automatically mean the end of a bull market.
What's your strategy right now?
A) Buying the dip 🟢
B) Holding and waiting 💎
C) Staying in USDT 🛡️
D) Waiting for confirmation 📊
Drop your answer below. Let's discuss! 👇
#Bitcoin #BTC #Ethereum #ETH #CryptoMarket #BinanceSquare #CryptoNews #Altcoins #BTCAnalysis #CryptoTrading
🚨 THE CRYPTO MARKET IS TESTING EVERY INVESTOR'S PATIENCE!
Bitcoin is facing pressure, Ethereum is struggling, and market sentiment remains cautious.
$BTC
But here's something worth thinking about:
📉 When the market falls, weak hands panic.
🧠 Experienced investors slow down, study the data, and manage their risk.
$BTC
🔥 The next big opportunity might come when nobody expects it.
Here are 3 things I'm watching right now:
$BTC
1️⃣ Bitcoin's ability to hold key support levels.
2️⃣ Institutional money and Bitcoin ETF flows.
3️⃣ US CPI data and its potential impact on crypto.
Remember: A red market doesn't automatically mean the end of a bull market.
What's your strategy right now?
A) Buying the dip 🟢
B) Holding and waiting 💎
C) Staying in USDT 🛡️
D) Waiting for confirmation 📊
Drop your answer below. Let's discuss! 👇
#Bitcoin #BTC #Ethereum #ETH #CryptoMarket #BinanceSquare #CryptoNews #Altcoins #BTCAnalysis #CryptoTrading
Bitcoin is facing pressure, Ethereum is struggling, and market sentiment remains cautious.
$BTC
But here's something worth thinking about:
📉 When the market falls, weak hands panic.
🧠 Experienced investors slow down, study the data, and manage their risk.
$BTC
🔥 The next big opportunity might come when nobody expects it.
Here are 3 things I'm watching right now:
$BTC
1️⃣ Bitcoin's ability to hold key support levels.
2️⃣ Institutional money and Bitcoin ETF flows.
3️⃣ US CPI data and its potential impact on crypto.
Remember: A red market doesn't automatically mean the end of a bull market.
What's your strategy right now?
A) Buying the dip 🟢
B) Holding and waiting 💎
C) Staying in USDT 🛡️
D) Waiting for confirmation 📊
Drop your answer below. Let's discuss! 👇
#Bitcoin #BTC #Ethereum #ETH #CryptoMarket #BinanceSquare #CryptoNews #Altcoins #BTCAnalysis #CryptoTrading

103
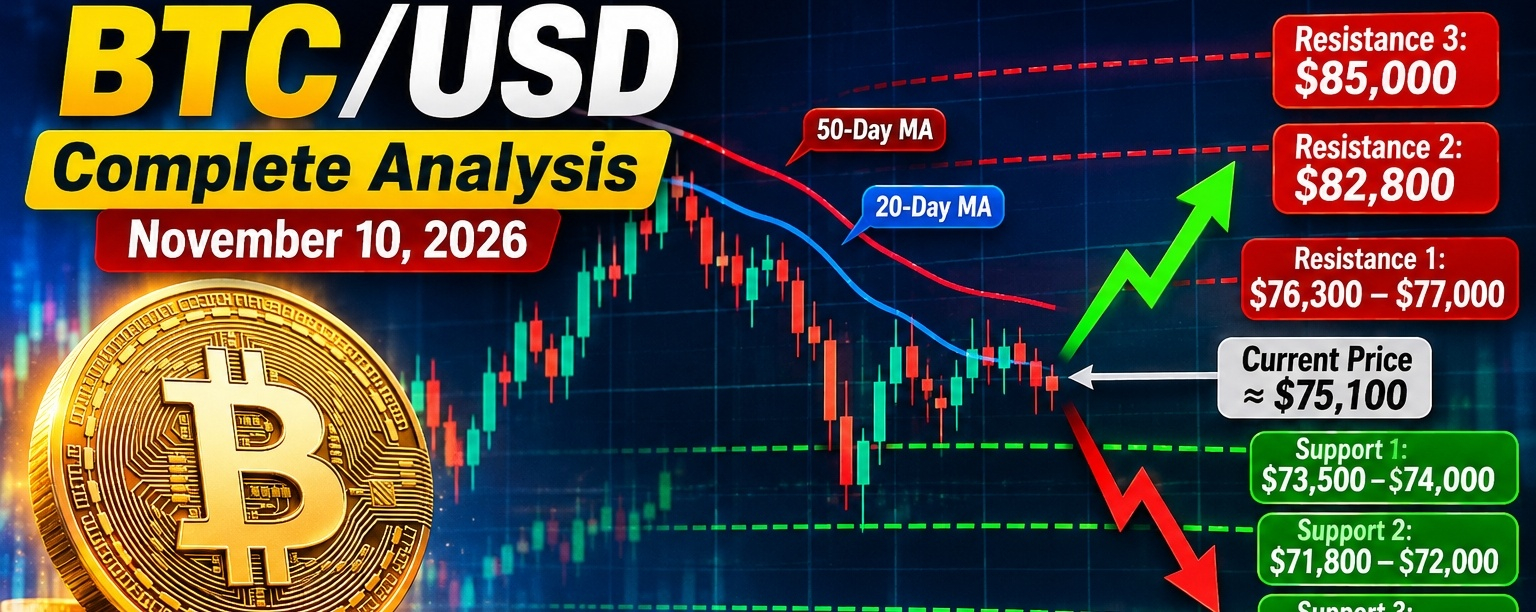
Мақала
BTC/USD Complete Analysis — November 10, 2026$BTC /USD Complete Analysis — November 10, 2026
Current $BTC price: around $75,000–$75,150. Bitcoin is currently in a short-term bearish/corrective structure, with price below important daily moving averages.
{spot}(BTCUSDT)
📊 Technical picture
Level Price
🔴 Resistance 3 $85,000
🔴 Resistance 2 $82,800
🔴 Resistance 1 $76,300–$77,000
⚪ Current ~$75,100
🟢 Support 1 $73,500–$74,000
🟢 Support 2 $71,800–$72,000
🟢 Support 3 $68,600–$69,100
Recent technical data places immediate resistance around $76.3K–$77K and support around $73.5K–$74K. A daily break below that support would expose the $71.8K area and potentially $69K.
📉 Indicators
- RSI: roughly 36–37 — weak, but not yet deeply oversold.
- MACD: bearish, indicating momentum remains under pressure.
- Moving averages: $BTC is trading below the 20-day and 50-day averages, keeping the short-term trend bearish.
- Volatility: elevated, so sharp moves around major support/resistance are possible.
🐻 Bearish scenario
If BTC fails to reclaim $76,000–$77,000 and breaks $73,500, sellers could target:
$72,000 → $69,000 → $67,000
The daily technical setup currently favors downside while BTC remains below the major pivot/resistance region.
🐂 Bullish scenario
For bulls, the first important confirmation would be a strong move above $76,300–$77,000.
If BTC gets a convincing daily close above that area, the next targets are approximately:
$79,000 → $82,800 → $85,000
A recovery through $82.8K would substantially improve the medium-term structure.
⚠️ Today's major catalyst
U.S. CPI is scheduled for November 10, making today particularly important for BTC volatility. Inflation data can quickly move Bitcoin through nearby technical levels.
🎯 My BTC/USD outlook
Short term: 🔴 Bearish
Medium term: 🟡 Cautious / bearish until $79K is reclaimed
Long term: 🟢 Potentially bullish, but BTC needs to establish a new higher-low structure before the bullish case becomes stronger.
Key level to watch: $73,500. Holding this area could produce a relief bounce; losing it on a daily closing basis would increase the probability of a move toward $69K–$72K.
This is market analysis, not financial advice. Crypto can move rapidly and invalidate technical setups.
#BTCanalysis #BTCUSDTAnalysis #analysis #TrendingPredictions #viralpost
BTC/USD Complete Analysis — November 10, 2026
$BTC /USD Complete Analysis — November 10, 2026
Current $BTC price: around $75,000–$75,150. Bitcoin is currently in a short-term bearish/corrective structure, with price below important daily moving averages.
📊 Technical picture
Level Price
🔴 Resistance 3 $85,000
🔴 Resistance 2 $82,800
🔴 Resistance 1 $76,300–$77,000
⚪ Current ~$75,100
🟢 Support 1 $73,500–$74,000
🟢 Support 2 $71,800–$72,000
🟢 Support 3 $68,600–$69,100
Recent technical data places immediate resistance around $76.3K–$77K and support around $73.5K–$74K. A daily break below that support would expose the $71.8K area and potentially $69K.
📉 Indicators
- RSI: roughly 36–37 — weak, but not yet deeply oversold.
- MACD: bearish, indicating momentum remains under pressure.
- Moving averages: $BTC is trading below the 20-day and 50-day averages, keeping the short-term trend bearish.
- Volatility: elevated, so sharp moves around major support/resistance are possible.
🐻 Bearish scenario
If BTC fails to reclaim $76,000–$77,000 and breaks $73,500, sellers could target:
$72,000 → $69,000 → $67,000
The daily technical setup currently favors downside while BTC remains below the major pivot/resistance region.
🐂 Bullish scenario
For bulls, the first important confirmation would be a strong move above $76,300–$77,000.
If BTC gets a convincing daily close above that area, the next targets are approximately:
$79,000 → $82,800 → $85,000
A recovery through $82.8K would substantially improve the medium-term structure.
⚠️ Today's major catalyst
U.S. CPI is scheduled for November 10, making today particularly important for BTC volatility. Inflation data can quickly move Bitcoin through nearby technical levels.
🎯 My BTC/USD outlook
Short term: 🔴 Bearish
Medium term: 🟡 Cautious / bearish until $79K is reclaimed
Long term: 🟢 Potentially bullish, but BTC needs to establish a new higher-low structure before the bullish case becomes stronger.
Key level to watch: $73,500. Holding this area could produce a relief bounce; losing it on a daily closing basis would increase the probability of a move toward $69K–$72K.
This is market analysis, not financial advice. Crypto can move rapidly and invalidate technical setups.
#BTCanalysis #BTCUSDTAnalysis #analysis #TrendingPredictions #viralpost
Current $BTC price: around $75,000–$75,150. Bitcoin is currently in a short-term bearish/corrective structure, with price below important daily moving averages.
📊 Technical picture
Level Price
🔴 Resistance 3 $85,000
🔴 Resistance 2 $82,800
🔴 Resistance 1 $76,300–$77,000
⚪ Current ~$75,100
🟢 Support 1 $73,500–$74,000
🟢 Support 2 $71,800–$72,000
🟢 Support 3 $68,600–$69,100
Recent technical data places immediate resistance around $76.3K–$77K and support around $73.5K–$74K. A daily break below that support would expose the $71.8K area and potentially $69K.
📉 Indicators
- RSI: roughly 36–37 — weak, but not yet deeply oversold.
- MACD: bearish, indicating momentum remains under pressure.
- Moving averages: $BTC is trading below the 20-day and 50-day averages, keeping the short-term trend bearish.
- Volatility: elevated, so sharp moves around major support/resistance are possible.
🐻 Bearish scenario
If BTC fails to reclaim $76,000–$77,000 and breaks $73,500, sellers could target:
$72,000 → $69,000 → $67,000
The daily technical setup currently favors downside while BTC remains below the major pivot/resistance region.
🐂 Bullish scenario
For bulls, the first important confirmation would be a strong move above $76,300–$77,000.
If BTC gets a convincing daily close above that area, the next targets are approximately:
$79,000 → $82,800 → $85,000
A recovery through $82.8K would substantially improve the medium-term structure.
⚠️ Today's major catalyst
U.S. CPI is scheduled for November 10, making today particularly important for BTC volatility. Inflation data can quickly move Bitcoin through nearby technical levels.
🎯 My BTC/USD outlook
Short term: 🔴 Bearish
Medium term: 🟡 Cautious / bearish until $79K is reclaimed
Long term: 🟢 Potentially bullish, but BTC needs to establish a new higher-low structure before the bullish case becomes stronger.
Key level to watch: $73,500. Holding this area could produce a relief bounce; losing it on a daily closing basis would increase the probability of a move toward $69K–$72K.
This is market analysis, not financial advice. Crypto can move rapidly and invalidate technical setups.
#BTCanalysis #BTCUSDTAnalysis #analysis #TrendingPredictions #viralpost
1.1k

·
--
Жоғары (өспелі)
🚨 $BTC — ANOTHER CALL THAT PLAYED OUT AS EXPECTED! 📉🔥
The Bitcoin moves we've been tracking since the $90K region have unfolded almost exactly as anticipated. One step at a time, the market has followed the scenario I shared.
First, I expected $BTC to recover toward $80K before a significant correction. Once the market became overly confident in the bullish move, I warned that a sharp reversal could follow.
Then $BTC dropped toward $76K. While many traders were convinced that the bottom was in, I maintained my bearish outlook and warned that more downside could still be ahead.
And now, we're seeing that scenario develop.
The key is not getting caught up in market emotions. It's about reading price action, staying patient, and being prepared for different possibilities.
What's my next move? 👀
For now, I expect Bitcoin to consolidate around these levels for a while. I'll be watching closely for the next major move before making any fresh predictions.
Stay alert, manage your risk, and don't trade blindly.
DYOR.
#Bitcoin #BTCAnalysis #CryptoTrading #BitcoinPrediction #CryptoMarket
🚨 $BTC — ANOTHER CALL THAT PLAYED OUT AS EXPECTED! 📉🔥
The Bitcoin moves we've been tracking since the $90K region have unfolded almost exactly as anticipated. One step at a time, the market has followed the scenario I shared.
First, I expected $BTC to recover toward $80K before a significant correction. Once the market became overly confident in the bullish move, I warned that a sharp reversal could follow.
Then $BTC dropped toward $76K. While many traders were convinced that the bottom was in, I maintained my bearish outlook and warned that more downside could still be ahead.
And now, we're seeing that scenario develop.
The key is not getting caught up in market emotions. It's about reading price action, staying patient, and being prepared for different possibilities.
What's my next move? 👀
For now, I expect Bitcoin to consolidate around these levels for a while. I'll be watching closely for the next major move before making any fresh predictions.
Stay alert, manage your risk, and don't trade blindly.
DYOR.
#Bitcoin #BTCAnalysis #CryptoTrading #BitcoinPrediction #CryptoMarket
The Bitcoin moves we've been tracking since the $90K region have unfolded almost exactly as anticipated. One step at a time, the market has followed the scenario I shared.
First, I expected $BTC to recover toward $80K before a significant correction. Once the market became overly confident in the bullish move, I warned that a sharp reversal could follow.
Then $BTC dropped toward $76K. While many traders were convinced that the bottom was in, I maintained my bearish outlook and warned that more downside could still be ahead.
And now, we're seeing that scenario develop.
The key is not getting caught up in market emotions. It's about reading price action, staying patient, and being prepared for different possibilities.
What's my next move? 👀
For now, I expect Bitcoin to consolidate around these levels for a while. I'll be watching closely for the next major move before making any fresh predictions.
Stay alert, manage your risk, and don't trade blindly.
DYOR.
#Bitcoin #BTCAnalysis #CryptoTrading #BitcoinPrediction #CryptoMarket
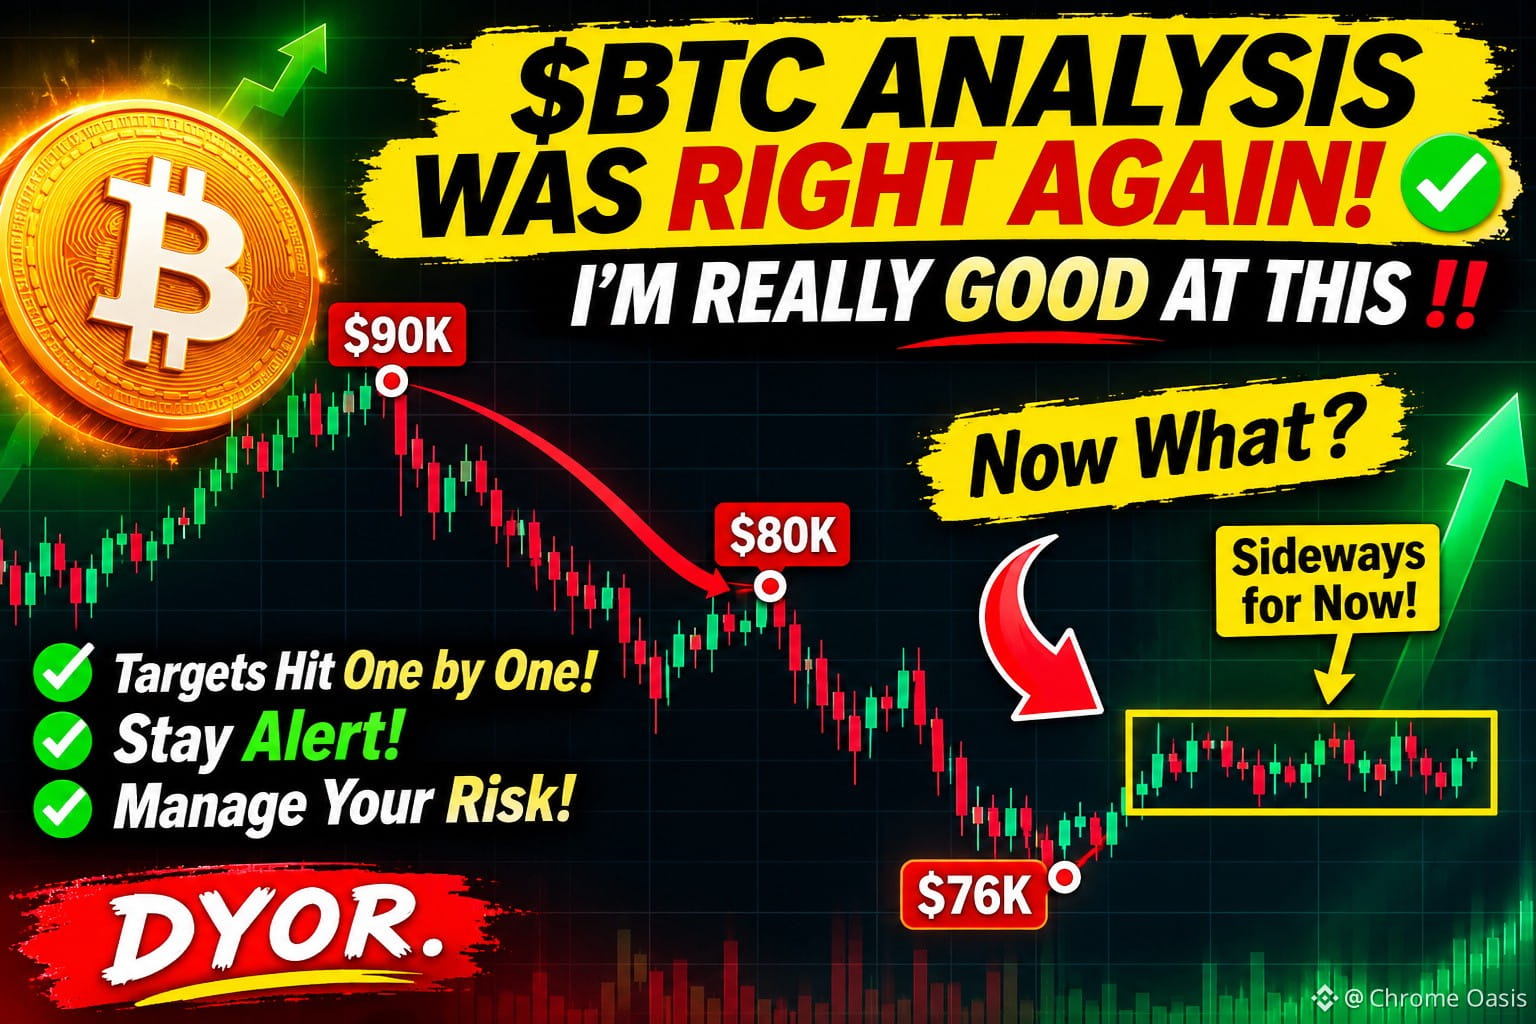
1
82
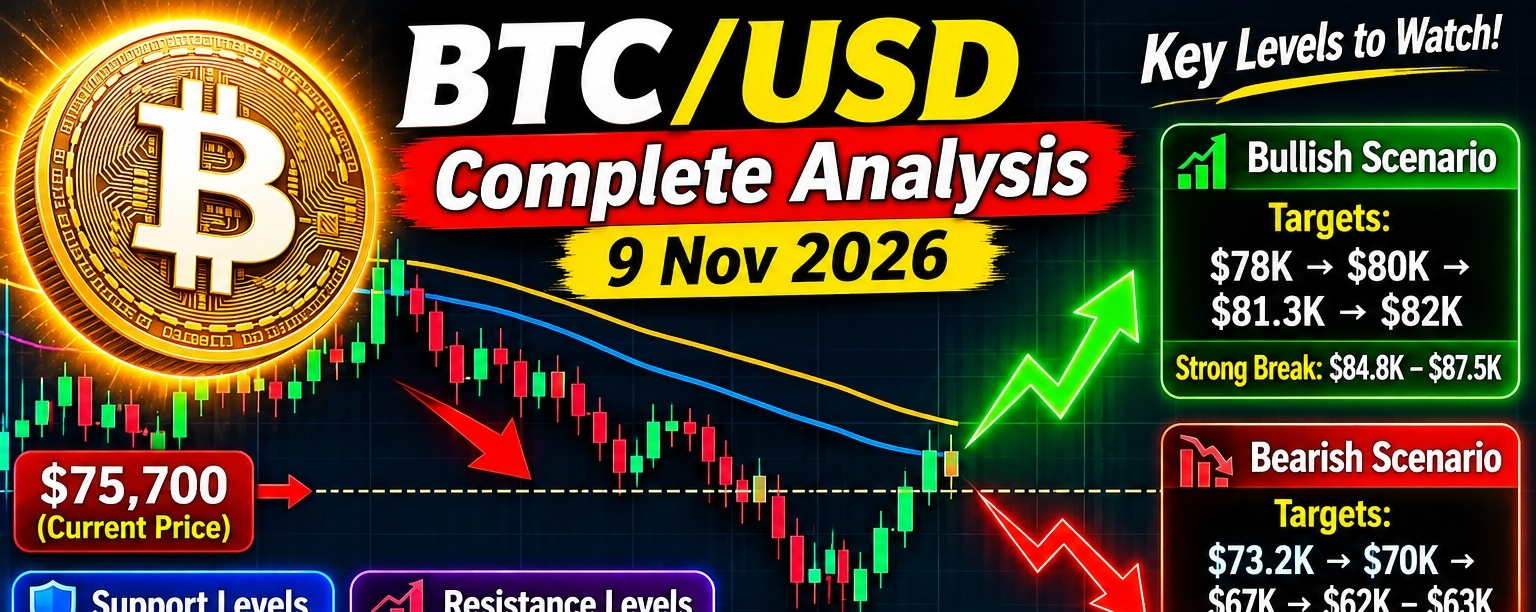
Мақала
BTC/USD Complete Analysis — 9 Nov 2026$BTC /USD Complete Analysis — 9 Nov 2026
**Current $BTC price:** approximately **$75,700–$76,000**. Bitcoin recently fell to around **$73,708**, its lowest level since August, before stabilizing. The short-term structure remains bearish, although the longer-term trend has not completely broken. citeturn664496news32turn664496search0
{spot}(BTCUSDT)
## 📊 Technical picture
| Indicator | Current reading | Signal |
|---|---:|---|
| Price | ~$75.7K | 🔴 Bearish |
| Daily RSI | ~38–39 | 🔴 Weak |
| 20-day MA | ~$79.0K | 🔴 Resistance |
| 50-day MA | ~$81.8K | 🔴 Resistance |
| MACD | Below signal | 🔴 Bearish |
| Short-term trend | Down | 🔴 Bearish |
| Long-term trend | Still constructive | 🟢/🟡 |
$BTC is below its 20-day and 50-day moving averages, while daily MACD remains bearish. However, weekly indicators are less negative, leaving room for a larger recovery if major resistance is reclaimed. citeturn664496search0
## 🟢 Key support levels
**$74,500–$74,100** — immediate critical support
**$73,700–$73,200** — major support / 200-day MA area
**$70,000** — major psychological support
**$62,000–$63,000** — deeper structural support
The $73K–$74K region is particularly important. A decisive daily/weekly break below it would substantially increase downside risk. Reuters has identified approximately **$73,188**, the 200-day moving average, as an important support level. citeturn664496news31
## 🔴 Resistance levels
**$77,200** — first important pivot
**$78,000–$78,500** — immediate recovery resistance
**$79,000–$80,000** — major psychological/technical zone
**$81,300–$82,000** — strong resistance
**$84,800–$85,000** — major breakout area
**$87,500+** — higher resistance
Current technical analysis places the intraday pivot near **$77,239**, with resistance around **$78,011–$78,470**. citeturn664496search0
## 📈 Bullish scenario
The first requirement for bulls is to reclaim **$77.2K–$78K**.
If BTC gets a strong daily close above **$78K**, the next targets become:
**$79K → $80K → $81.3K → $82K**
A sustained move above **$82K** would considerably improve the structure and could bring **$84.8K–$85K** into play.
Above $85K, the market could potentially target **$87.5K–$90K**. Reuters similarly identifies a move above the ~$81.3K 30-day average as a condition that could open the way toward October highs above $84.8K and potentially $90K. citeturn664496news31
## 📉 Bearish scenario
If BTC loses **$74K**, sellers could target:
**$73.2K → $70K → $67K → $62K–$63K**
A weekly close below the **200-day moving average** would be especially concerning because it would weaken the broader market structure. citeturn664496news31turn664496search0
## 🧠 Market fundamentals
Recent selling has been amplified by broader risk-off sentiment, post-U.S.-midterm political uncertainty and crypto-sector security concerns. Bitcoin dropped more than 2% on Nov. 8 to roughly $73.7K as the wider crypto market sold off. citeturn664496news32
ETF flows are another important variable. Recent reporting indicated substantial outflows from U.S.-listed spot Bitcoin ETFs, meaning a sustained recovery would be stronger if institutional/spot demand turns positive again. citeturn664496search1
## 🎯 My BTC/USD outlook
**Short term:** 🔴 **Bearish**
**Medium term:** 🔴 **Bearish/neutral**
**Long term:** 🟡 **Cautiously bullish**
### Most important levels
**Bullish confirmation:** **$78K → $80K**
**Strong bullish confirmation:** **$82K+**
**Critical support:** **$74K–$73K**
**Major bearish confirmation:** **Below $73K**
### Trading bias
At the current price, I would **not consider the market fully bullish yet**. BTC needs to recover $78K and preferably $80K–$82K with strong volume before the downtrend can be considered meaningfully reversed.
Conversely, if **$73K fails**, the probability of a deeper correction toward **$70K and potentially $62K–$63K** increases.
**Bottom line:** BTC is currently in a **high-volatility decision zone**. The $73K–$74K support area and $78K–$82K resistance area are the two zones I would watch most closely. This is te
chnical analysis, not financial advice.
📊 Check BTC/USD again tomorrow Tap to set up.
#BTCanalysis #BTCUSDTAnalysis #analysis #TrendingPredictions #viralpost
BTC/USD Complete Analysis — 9 Nov 2026
$BTC /USD Complete Analysis — 9 Nov 2026
**Current $BTC price:** approximately **$75,700–$76,000**. Bitcoin recently fell to around **$73,708**, its lowest level since August, before stabilizing. The short-term structure remains bearish, although the longer-term trend has not completely broken. citeturn664496news32turn664496search0
## 📊 Technical picture
| Indicator | Current reading | Signal |
|---|---:|---|
| Price | ~$75.7K | 🔴 Bearish |
| Daily RSI | ~38–39 | 🔴 Weak |
| 20-day MA | ~$79.0K | 🔴 Resistance |
| 50-day MA | ~$81.8K | 🔴 Resistance |
| MACD | Below signal | 🔴 Bearish |
| Short-term trend | Down | 🔴 Bearish |
| Long-term trend | Still constructive | 🟢/🟡 |
$BTC is below its 20-day and 50-day moving averages, while daily MACD remains bearish. However, weekly indicators are less negative, leaving room for a larger recovery if major resistance is reclaimed. citeturn664496search0
## 🟢 Key support levels
**$74,500–$74,100** — immediate critical support
**$73,700–$73,200** — major support / 200-day MA area
**$70,000** — major psychological support
**$62,000–$63,000** — deeper structural support
The $73K–$74K region is particularly important. A decisive daily/weekly break below it would substantially increase downside risk. Reuters has identified approximately **$73,188**, the 200-day moving average, as an important support level. citeturn664496news31
## 🔴 Resistance levels
**$77,200** — first important pivot
**$78,000–$78,500** — immediate recovery resistance
**$79,000–$80,000** — major psychological/technical zone
**$81,300–$82,000** — strong resistance
**$84,800–$85,000** — major breakout area
**$87,500+** — higher resistance
Current technical analysis places the intraday pivot near **$77,239**, with resistance around **$78,011–$78,470**. citeturn664496search0
## 📈 Bullish scenario
The first requirement for bulls is to reclaim **$77.2K–$78K**.
If BTC gets a strong daily close above **$78K**, the next targets become:
**$79K → $80K → $81.3K → $82K**
A sustained move above **$82K** would considerably improve the structure and could bring **$84.8K–$85K** into play.
Above $85K, the market could potentially target **$87.5K–$90K**. Reuters similarly identifies a move above the ~$81.3K 30-day average as a condition that could open the way toward October highs above $84.8K and potentially $90K. citeturn664496news31
## 📉 Bearish scenario
If BTC loses **$74K**, sellers could target:
**$73.2K → $70K → $67K → $62K–$63K**
A weekly close below the **200-day moving average** would be especially concerning because it would weaken the broader market structure. citeturn664496news31turn664496search0
## 🧠 Market fundamentals
Recent selling has been amplified by broader risk-off sentiment, post-U.S.-midterm political uncertainty and crypto-sector security concerns. Bitcoin dropped more than 2% on Nov. 8 to roughly $73.7K as the wider crypto market sold off. citeturn664496news32
ETF flows are another important variable. Recent reporting indicated substantial outflows from U.S.-listed spot Bitcoin ETFs, meaning a sustained recovery would be stronger if institutional/spot demand turns positive again. citeturn664496search1
## 🎯 My BTC/USD outlook
**Short term:** 🔴 **Bearish**
**Medium term:** 🔴 **Bearish/neutral**
**Long term:** 🟡 **Cautiously bullish**
### Most important levels
**Bullish confirmation:** **$78K → $80K**
**Strong bullish confirmation:** **$82K+**
**Critical support:** **$74K–$73K**
**Major bearish confirmation:** **Below $73K**
### Trading bias
At the current price, I would **not consider the market fully bullish yet**. BTC needs to recover $78K and preferably $80K–$82K with strong volume before the downtrend can be considered meaningfully reversed.
Conversely, if **$73K fails**, the probability of a deeper correction toward **$70K and potentially $62K–$63K** increases.
**Bottom line:** BTC is currently in a **high-volatility decision zone**. The $73K–$74K support area and $78K–$82K resistance area are the two zones I would watch most closely. This is te
chnical analysis, not financial advice.
📊 Check BTC/USD again tomorrow Tap to set up.
#BTCanalysis #BTCUSDTAnalysis #analysis #TrendingPredictions #viralpost
**Current $BTC price:** approximately **$75,700–$76,000**. Bitcoin recently fell to around **$73,708**, its lowest level since August, before stabilizing. The short-term structure remains bearish, although the longer-term trend has not completely broken. citeturn664496news32turn664496search0
## 📊 Technical picture
| Indicator | Current reading | Signal |
|---|---:|---|
| Price | ~$75.7K | 🔴 Bearish |
| Daily RSI | ~38–39 | 🔴 Weak |
| 20-day MA | ~$79.0K | 🔴 Resistance |
| 50-day MA | ~$81.8K | 🔴 Resistance |
| MACD | Below signal | 🔴 Bearish |
| Short-term trend | Down | 🔴 Bearish |
| Long-term trend | Still constructive | 🟢/🟡 |
$BTC is below its 20-day and 50-day moving averages, while daily MACD remains bearish. However, weekly indicators are less negative, leaving room for a larger recovery if major resistance is reclaimed. citeturn664496search0
## 🟢 Key support levels
**$74,500–$74,100** — immediate critical support
**$73,700–$73,200** — major support / 200-day MA area
**$70,000** — major psychological support
**$62,000–$63,000** — deeper structural support
The $73K–$74K region is particularly important. A decisive daily/weekly break below it would substantially increase downside risk. Reuters has identified approximately **$73,188**, the 200-day moving average, as an important support level. citeturn664496news31
## 🔴 Resistance levels
**$77,200** — first important pivot
**$78,000–$78,500** — immediate recovery resistance
**$79,000–$80,000** — major psychological/technical zone
**$81,300–$82,000** — strong resistance
**$84,800–$85,000** — major breakout area
**$87,500+** — higher resistance
Current technical analysis places the intraday pivot near **$77,239**, with resistance around **$78,011–$78,470**. citeturn664496search0
## 📈 Bullish scenario
The first requirement for bulls is to reclaim **$77.2K–$78K**.
If BTC gets a strong daily close above **$78K**, the next targets become:
**$79K → $80K → $81.3K → $82K**
A sustained move above **$82K** would considerably improve the structure and could bring **$84.8K–$85K** into play.
Above $85K, the market could potentially target **$87.5K–$90K**. Reuters similarly identifies a move above the ~$81.3K 30-day average as a condition that could open the way toward October highs above $84.8K and potentially $90K. citeturn664496news31
## 📉 Bearish scenario
If BTC loses **$74K**, sellers could target:
**$73.2K → $70K → $67K → $62K–$63K**
A weekly close below the **200-day moving average** would be especially concerning because it would weaken the broader market structure. citeturn664496news31turn664496search0
## 🧠 Market fundamentals
Recent selling has been amplified by broader risk-off sentiment, post-U.S.-midterm political uncertainty and crypto-sector security concerns. Bitcoin dropped more than 2% on Nov. 8 to roughly $73.7K as the wider crypto market sold off. citeturn664496news32
ETF flows are another important variable. Recent reporting indicated substantial outflows from U.S.-listed spot Bitcoin ETFs, meaning a sustained recovery would be stronger if institutional/spot demand turns positive again. citeturn664496search1
## 🎯 My BTC/USD outlook
**Short term:** 🔴 **Bearish**
**Medium term:** 🔴 **Bearish/neutral**
**Long term:** 🟡 **Cautiously bullish**
### Most important levels
**Bullish confirmation:** **$78K → $80K**
**Strong bullish confirmation:** **$82K+**
**Critical support:** **$74K–$73K**
**Major bearish confirmation:** **Below $73K**
### Trading bias
At the current price, I would **not consider the market fully bullish yet**. BTC needs to recover $78K and preferably $80K–$82K with strong volume before the downtrend can be considered meaningfully reversed.
Conversely, if **$73K fails**, the probability of a deeper correction toward **$70K and potentially $62K–$63K** increases.
**Bottom line:** BTC is currently in a **high-volatility decision zone**. The $73K–$74K support area and $78K–$82K resistance area are the two zones I would watch most closely. This is te
chnical analysis, not financial advice.
📊 Check BTC/USD again tomorrow Tap to set up.
#BTCanalysis #BTCUSDTAnalysis #analysis #TrendingPredictions #viralpost
1
643
Көбірек контент көру үшін кіріңіз
Binance Square платформасында әлемдік криптоқоғамдастыққа қосылыңыз
⚡️ Криптовалюта туралы ең соңғы және пайдалы ақпаратты алыңыз.
💬 Әлемдегі ең ірі криптобиржаның сеніміне ие.
👍 Расталған авторлардың нақты пікірлерін табыңыз.
Электрондық пошта/телефон нөмірі
Трендтегі тақырыптар
1
#USPPIMissMayEaseBTCPressure
11,472 рет көрілді
367 адам талқылап жатыр
2
#BitcoinCoreDisclosesTorTrafficVulnerability
2,652 рет көрілді
132 адам талқылап жатыр
3
#WhatWillDriveCryptoandStocks’NextRebound?
106,649 рет көрілді
1,332 адам талқылап жатыр
4
#BitcoinBreaksBelow200WeekMovingAverage
24,030 рет көрілді
328 адам талқылап жатыр
5
#SpaceXTeslaMergerTalksWouldCombine30220BTC
8,454 рет көрілді
174 адам талқылап жатыр
6
#Anthropic’s6xIPODemandSignalsPotentialRecordRaise
35,113 рет көрілді
612 адам талқылап жатыр
7
#USCryptoETFsLose$1.48BInFiveDays
1,568 рет көрілді
37 адам талқылап жатыр
8
#KoreaDigitalAssetBasicActFinalDraftExpectedEarlyJanuary
3,215 рет көрілді
18 адам талқылап жатыр
9
#RippleRLUSDMarketCapSurpassesPayPalPYUSD
4,402 рет көрілді
102 адам талқылап жатыр
10
#JaneStreetNearlyOctuplesFidelityBitcoinETFHoldings
12,796 рет көрілді
208 адам талқылап жатыр