

JIMMY EVANS
145 投稿

JIMMY EVANS
報告
ユーザーをブロック
Almost 9 years navigating market cycles. Focused on microstructure, order flow, and deep execution. Pure market mechanics. 😉

BFUSDホルダー
超高頻度トレーダー
8.8年
28 フォロー
71 フォロワー
181 いいね
投稿
すべて
引用
動画
·
--
本人確認中
🛡️Binanceで約9年間取引を続けてきて、責任とは最も重要な場面でこそ証明されるものだと学びました。
最近のセキュリティインシデントを受け、#Binance が#SAFU🙏 基金を通じて影響を受けた資金の100%を補償すると約束したことで、市場にさまざまな憶測が飛び交うのは当然です。著名人がミームを投稿したり、この状況をからかったりする様子も見られます。しかし、現実の危機を注目集めに利用する人がいる一方で、行動を通じて本当の大人が誰なのかを示す人たちもいます。
複数の市場サイクルを乗り越え、このプラットフォームを約9年間、主な活動拠点として利用してきた私の姿勢は明確です。心から安心し、全面的に支持します。
なぜ今回の出来事で、私の信頼はさらに強まったのでしょうか?
迅速な対応:過去に他社が崩れた一方で、BinanceはSAFUと企業資金を通じて、財務上の影響を100%補償する姿勢を示しました。
実行力:24時間足らずで、専門の情報分析企業と連携してオンチェーン上の30億ドルを凍結し、実資産によって損失額の大部分を補填しました。
品格あるリーダーシップ:外部からの挑発に対し、リーダーシップチームは成熟した態度と敬意をもって対応し、ユーザー保護に全力を注いでいます。
徹底した透明性:今後、準備金証明の更新が予定されており、出金も段階的に再開されます。ユーザーの安全が最優先です。
技術的な課題は起こり得ます。しかし、危機への対処に用いる規律と原則こそが、業界をリードする企業の真価を示します。彼らが私たちを守るために24時間体制で取り組んでいると知り、私は自分の活動に集中し続けています。
🤝 リーダーシップチームへのメッセージ:
このプラットフォームが初日から大切にしてきた、毅然とした態度、品格、透明性をもって行動してくれたリーダーシップに、心からの支持と敬意を表します。
@CZ | @heyi | @richardteng
Binanceを利用して何年になりますか?今回の状況にどのように対応していますか?ぜひ下のコメント欄で教えてください 👇
#crypto #BinanceSquare
🛡️Binanceで約9年間取引を続けてきて、責任とは最も重要な場面でこそ証明されるものだと学びました。
最近のセキュリティインシデントを受け、#Binance が#SAFU🙏 基金を通じて影響を受けた資金の100%を補償すると約束したことで、市場にさまざまな憶測が飛び交うのは当然です。著名人がミームを投稿したり、この状況をからかったりする様子も見られます。しかし、現実の危機を注目集めに利用する人がいる一方で、行動を通じて本当の大人が誰なのかを示す人たちもいます。
複数の市場サイクルを乗り越え、このプラットフォームを約9年間、主な活動拠点として利用してきた私の姿勢は明確です。心から安心し、全面的に支持します。
なぜ今回の出来事で、私の信頼はさらに強まったのでしょうか?
迅速な対応:過去に他社が崩れた一方で、BinanceはSAFUと企業資金を通じて、財務上の影響を100%補償する姿勢を示しました。
実行力:24時間足らずで、専門の情報分析企業と連携してオンチェーン上の30億ドルを凍結し、実資産によって損失額の大部分を補填しました。
品格あるリーダーシップ:外部からの挑発に対し、リーダーシップチームは成熟した態度と敬意をもって対応し、ユーザー保護に全力を注いでいます。
徹底した透明性:今後、準備金証明の更新が予定されており、出金も段階的に再開されます。ユーザーの安全が最優先です。
技術的な課題は起こり得ます。しかし、危機への対処に用いる規律と原則こそが、業界をリードする企業の真価を示します。彼らが私たちを守るために24時間体制で取り組んでいると知り、私は自分の活動に集中し続けています。
🤝 リーダーシップチームへのメッセージ:
このプラットフォームが初日から大切にしてきた、毅然とした態度、品格、透明性をもって行動してくれたリーダーシップに、心からの支持と敬意を表します。
@CZ | @Yi He | @Richard Teng
Binanceを利用して何年になりますか?今回の状況にどのように対応していますか?ぜひ下のコメント欄で教えてください 👇
#crypto #BinanceSquare
106
·
--
記事
翻訳参照
Beyond Market Makers: How to Actually Read What’s Happening in Solana MemecoinsIf you’ve spent any time trading memecoins on Solana, you’ve probably asked yourself questions like:
“Why does this token keep recovering in almost the exact same way after every dump?”“How is there so much volume when there are barely any real holders?”“Why do a bunch of wallets buy at almost the exact same second?”“Is this a market maker… or just a bunch of bots… or the team dumping slowly?”
Most people answer these questions with vibes, Twitter threads, or what they heard in a stream.
The problem is that the real activity on Solana is much more layered than “there’s a market maker” or “it’s being manipulated.”
This article is written for the people who actually trade these tokens — not just for on-chain analysts with five monitors. We’re going to break down the patterns you can actually see, explain them in plain language, and show you how to move from raw observation to a smarter interpretation without jumping to conclusions.
1. Why Solana Memecoins Are Different
Solana is extremely fast and extremely cheap. That changes everything.
On Ethereum, high transaction fees and slower confirmation times make it expensive to spam trades or run dozens of wallets. On Solana you can:
Create a tokenAdd liquidityBuy with 20 different walletsSell small amounts over and overMove money between wallets
…all in a matter of seconds and for almost nothing in fees.
This environment creates a unique mix of:
Professional market makers hired by bigger projectsAlgorithmic bots run by developers or private groupsSniper botsCoordinated groups of wallets controlled by the same peopleRegular retail traders
The result is that charts and volume numbers often lie (or at least tell a very incomplete story).
2. The Most Important Rule: Observation vs Interpretation
This is the biggest upgrade you can make in how you look at tokens.
Bad habit (what most people do):
“These 15 wallets all bought at the same time → this is a market maker.”
Better approach:
Observation (what you can actually see on-chain)Behavior (what pattern this activity forms)Hypothesis (what could reasonably explain it)Market Intent (what this might mean for the token’s price action)
Example:
Observation
Wallet A sent 0.8 SOL to Wallet B, C, D and E.
A few minutes later, B, C, D and E all bought the same token with similar size within 4 seconds of each other.
Behavior
Coordinated wallet activity + common funding source.
Hypothesis
These wallets are likely controlled by the same entity or are following the same strategy.
Market Intent
Possible artificial flow, liquidity management, or early accumulation by a coordinated group.
Notice we never said “this is a market maker.” We stayed at the level of evidence.
This way of thinking is much more powerful (and much harder to get wrong).
3. The Main Families of Behavior You Should Watch
Here are the most important patterns, explained from beginner to advanced.
A. Wallet Coordination (The Foundation)
This is one of the strongest signals.
What you look for:
Multiple wallets funded by the same “parent” walletWallets created or activated in a very short time windowWallets that buy or sell almost the same amount at almost the same timeWallets that keep appearing together across different tokensChains of funding (A → B → C → D)
Simple analogy: Imagine 12 people who all got money from the same guy, then all walk into the same store and buy the same product within 10 seconds of each other. That’s not random.
When you see this repeatedly, you’re looking at coordinated activity.
B. Launch Coordination (What Happens in the First Blocks)
At token launch you often see:
Token creationLiquidity pool creationMultiple buysSometimes early sells
…all happening in the same slot or consecutive slots.
This is frequently done with Jito bundles (a way to group transactions so they execute together).
Important: Bundling itself is not automatically “manipulation.” Many legitimate launches use it to protect against snipers. The interesting part is the pattern of who is buying, how the wallets are related, and what happens afterward.
C. Wash Trading & Artificial Volume
Classic pattern:
Wallet A buysWallet B sellsMoney moves between themThey repeat with similar sizes and timing
The volume number on Dexscreener looks huge, but the number of independent economic participants is very low.
Key metric to watch:
Reported volume vs number of unique wallets that are not connected to each other.
$1.2 million in volume with only 40 real independent wallets tells a completely different story than the same volume with 800 unconnected wallets.
D. Algorithmic / Bot-Like Activity
Signs:
Extremely regular time intervals between tradesAlmost identical trade sizesActivity that never sleeps (24/7 with no human-like pauses)Same exact route through the same pools over and overVery low variation in behavior
You don’t need to say “this is a bot.” You can say:
“Algorithmic activity pattern is high — 87 trades, median interval 1.2 seconds, size variance extremely low.”
That’s already very useful information.
E. High-Frequency & Scalping Behavior
Some wallets buy and sell within seconds or minutes, over and over.
Look at:
Average holding timeNumber of round tripsGross volume traded vs net position change
Example:
A wallet traded $48,000 worth of the token but only ended up with +1,200 tokens.
That is high turnover with low net accumulation — classic scalping or HFT-style behavior.
F. Liquidity Management
Who is adding and removing liquidity, and when?
Interesting patterns:
Liquidity added just before a big buyLiquidity removed just before a big sellLiquidity changes that happen at the same time as certain wallet activityLiquidity concentrated in very few wallets
This can reveal who is trying to control price impact.
G. Absorption (One of the Most Important Patterns)
You see heavy selling pressure…
but the price barely drops…
and buying keeps appearing on the other side.
This often means someone is deliberately absorbing the sells (supporting the price).
Later, when the selling pressure decreases, the price starts rising.
The absorption hypothesis becomes stronger.
H. Distribution Patterns
Instead of one big dump (which destroys the chart), you often see:
Gradual / “Ant” distribution
Small sells spread over hours while retail is still buying.
Stair-step distribution
Price rises → whale sells a chunk → price keeps rising → whale sells again → repeat.
Distribution into strength
Selling while demand is still strong.
I. Accumulation
The opposite of distribution:
Price is sideways or slowly decliningSelling pressure is highCertain wallets keep buyingTheir net position is growingPrice does not fall as much as the selling would suggest
J. MEV / Sandwich Activity
On Solana you can see patterns where:
One wallet buys right before a large tradeThen sells right after
This is common MEV (Maximal Extractable Value) behavior. Not every similar sequence is a sandwich, but the pattern is detectable.
K. Arbitrage & Cross-DEX Price Control
When the same token exists on Pump.fun / PumpSwap and Raydium (or other pools), bots constantly buy the cheaper one and sell the more expensive one.
This keeps prices relatively synchronized. Watching who is doing this arbitrage tells you who is keeping the market efficient.
L. Wallet Rotation & Token Rotation
Wallet rotation:
Position moves from Wallet A → Wallet B → Wallet C while the overall exposure stays similar.
Token rotation:
The same cluster of wallets that were early in Token A now appear accumulating Token B, then Token C.
This is extremely valuable once you start tracking wallet clusters across time.
M. New Wallet Inflow
Sudden appearance of many brand new wallets can mean organic interest… or it can mean a new cluster of coordinated wallets being activated.
Always check whether the new wallets are related to each other.
N. Early / Informed-Looking Activity
Wallets that appear right at launch, buy sizeable amounts, and later sell into the first big expansion.
We don’t call them “insiders.” We call it “early informed-looking activity” and note the pattern.
4. Behavioral Transition — The Most Powerful Layer
A single pattern can be normal.
A change in patterns is often much more meaningful.
Example:
Before
Mostly retail buyingLow wallet coordinationNormal trade intervalsStable liquidity
Then something changes
Wallet synchronization increasesA small group of wallets starts accumulatingSell pressure is being absorbedLiquidity becomes more concentrated
Now
Possible coordinated accumulation phase.
This “regime change” thinking is far more useful than trying to label every token as “has a market maker” or “is organic.”
5. Putting It All Together — Market State
Instead of 20 different alarms, the goal is to arrive at a clear, evidence-based summary:
Market State
Accumulation with coordinated activity
Why
Sell pressure is being absorbed8 high-activity wallets increased their net position5 of them show synchronized execution3 share a common funding relationshipPrice stayed relatively stable despite elevated selling
Caution
Activity is concentrated in a small clusterA meaningful portion of volume may not come from independent participants
Confidence
Medium-High
If you want to go deeper, you can expand every bullet into the raw on-chain evidence.
This format is readable, honest about uncertainty, and actually useful for decision-making.
6. Important Limitations (Read This)
Correlation is not proof of control. Common funding + synchronized trading is strong evidence of coordination, but not 100% certainty.Many patterns that look “manipulative” can also appear in legitimate market-making or sophisticated trading.Order-book style spoofing (fake walls that disappear) is much less relevant on pure AMMs like Raydium or Pump.fun than on centralized exchanges.Tools can be wrong or incomplete. Always try to verify key claims yourself on Solscan, Bubblemaps, or similar explorers.
The goal is not to become a conspiracy theorist. The goal is to see the structure of the market more clearly than the average person watching a stream.
Final Thoughts
Most memecoin traders only see the surface: price, volume, and what influencers say.
Underneath there is a rich layer of wallet coordination, algorithmic behavior, liquidity management, absorption, distribution, and regime changes.
You don’t need to detect “the market maker.”
You need to observe the patterns, form careful hypotheses, and understand what those patterns imply for the next moves in the chart.
Once you start looking at Solana tokens this way, the market becomes a lot less mysterious — and a lot more readable.
Trade carefully.
Beyond Market Makers: How to Actually Read What’s Happening in Solana Memecoins
If you’ve spent any time trading memecoins on Solana, you’ve probably asked yourself questions like:
“Why does this token keep recovering in almost the exact same way after every dump?”“How is there so much volume when there are barely any real holders?”“Why do a bunch of wallets buy at almost the exact same second?”“Is this a market maker… or just a bunch of bots… or the team dumping slowly?”
Most people answer these questions with vibes, Twitter threads, or what they heard in a stream.
The problem is that the real activity on Solana is much more layered than “there’s a market maker” or “it’s being manipulated.”
This article is written for the people who actually trade these tokens — not just for on-chain analysts with five monitors. We’re going to break down the patterns you can actually see, explain them in plain language, and show you how to move from raw observation to a smarter interpretation without jumping to conclusions.
1. Why Solana Memecoins Are Different
Solana is extremely fast and extremely cheap. That changes everything.
On Ethereum, high transaction fees and slower confirmation times make it expensive to spam trades or run dozens of wallets. On Solana you can:
Create a tokenAdd liquidityBuy with 20 different walletsSell small amounts over and overMove money between wallets
…all in a matter of seconds and for almost nothing in fees.
This environment creates a unique mix of:
Professional market makers hired by bigger projectsAlgorithmic bots run by developers or private groupsSniper botsCoordinated groups of wallets controlled by the same peopleRegular retail traders
The result is that charts and volume numbers often lie (or at least tell a very incomplete story).
2. The Most Important Rule: Observation vs Interpretation
This is the biggest upgrade you can make in how you look at tokens.
Bad habit (what most people do):
“These 15 wallets all bought at the same time → this is a market maker.”
Better approach:
Observation (what you can actually see on-chain)Behavior (what pattern this activity forms)Hypothesis (what could reasonably explain it)Market Intent (what this might mean for the token’s price action)
Example:
Observation
Wallet A sent 0.8 SOL to Wallet B, C, D and E.
A few minutes later, B, C, D and E all bought the same token with similar size within 4 seconds of each other.
Behavior
Coordinated wallet activity + common funding source.
Hypothesis
These wallets are likely controlled by the same entity or are following the same strategy.
Market Intent
Possible artificial flow, liquidity management, or early accumulation by a coordinated group.
Notice we never said “this is a market maker.” We stayed at the level of evidence.
This way of thinking is much more powerful (and much harder to get wrong).
3. The Main Families of Behavior You Should Watch
Here are the most important patterns, explained from beginner to advanced.
A. Wallet Coordination (The Foundation)
This is one of the strongest signals.
What you look for:
Multiple wallets funded by the same “parent” walletWallets created or activated in a very short time windowWallets that buy or sell almost the same amount at almost the same timeWallets that keep appearing together across different tokensChains of funding (A → B → C → D)
Simple analogy: Imagine 12 people who all got money from the same guy, then all walk into the same store and buy the same product within 10 seconds of each other. That’s not random.
When you see this repeatedly, you’re looking at coordinated activity.
B. Launch Coordination (What Happens in the First Blocks)
At token launch you often see:
Token creationLiquidity pool creationMultiple buysSometimes early sells
…all happening in the same slot or consecutive slots.
This is frequently done with Jito bundles (a way to group transactions so they execute together).
Important: Bundling itself is not automatically “manipulation.” Many legitimate launches use it to protect against snipers. The interesting part is the pattern of who is buying, how the wallets are related, and what happens afterward.
C. Wash Trading & Artificial Volume
Classic pattern:
Wallet A buysWallet B sellsMoney moves between themThey repeat with similar sizes and timing
The volume number on Dexscreener looks huge, but the number of independent economic participants is very low.
Key metric to watch:
Reported volume vs number of unique wallets that are not connected to each other.
$1.2 million in volume with only 40 real independent wallets tells a completely different story than the same volume with 800 unconnected wallets.
D. Algorithmic / Bot-Like Activity
Signs:
Extremely regular time intervals between tradesAlmost identical trade sizesActivity that never sleeps (24/7 with no human-like pauses)Same exact route through the same pools over and overVery low variation in behavior
You don’t need to say “this is a bot.” You can say:
“Algorithmic activity pattern is high — 87 trades, median interval 1.2 seconds, size variance extremely low.”
That’s already very useful information.
E. High-Frequency & Scalping Behavior
Some wallets buy and sell within seconds or minutes, over and over.
Look at:
Average holding timeNumber of round tripsGross volume traded vs net position change
Example:
A wallet traded $48,000 worth of the token but only ended up with +1,200 tokens.
That is high turnover with low net accumulation — classic scalping or HFT-style behavior.
F. Liquidity Management
Who is adding and removing liquidity, and when?
Interesting patterns:
Liquidity added just before a big buyLiquidity removed just before a big sellLiquidity changes that happen at the same time as certain wallet activityLiquidity concentrated in very few wallets
This can reveal who is trying to control price impact.
G. Absorption (One of the Most Important Patterns)
You see heavy selling pressure…
but the price barely drops…
and buying keeps appearing on the other side.
This often means someone is deliberately absorbing the sells (supporting the price).
Later, when the selling pressure decreases, the price starts rising.
The absorption hypothesis becomes stronger.
H. Distribution Patterns
Instead of one big dump (which destroys the chart), you often see:
Gradual / “Ant” distribution
Small sells spread over hours while retail is still buying.
Stair-step distribution
Price rises → whale sells a chunk → price keeps rising → whale sells again → repeat.
Distribution into strength
Selling while demand is still strong.
I. Accumulation
The opposite of distribution:
Price is sideways or slowly decliningSelling pressure is highCertain wallets keep buyingTheir net position is growingPrice does not fall as much as the selling would suggest
J. MEV / Sandwich Activity
On Solana you can see patterns where:
One wallet buys right before a large tradeThen sells right after
This is common MEV (Maximal Extractable Value) behavior. Not every similar sequence is a sandwich, but the pattern is detectable.
K. Arbitrage & Cross-DEX Price Control
When the same token exists on Pump.fun / PumpSwap and Raydium (or other pools), bots constantly buy the cheaper one and sell the more expensive one.
This keeps prices relatively synchronized. Watching who is doing this arbitrage tells you who is keeping the market efficient.
L. Wallet Rotation & Token Rotation
Wallet rotation:
Position moves from Wallet A → Wallet B → Wallet C while the overall exposure stays similar.
Token rotation:
The same cluster of wallets that were early in Token A now appear accumulating Token B, then Token C.
This is extremely valuable once you start tracking wallet clusters across time.
M. New Wallet Inflow
Sudden appearance of many brand new wallets can mean organic interest… or it can mean a new cluster of coordinated wallets being activated.
Always check whether the new wallets are related to each other.
N. Early / Informed-Looking Activity
Wallets that appear right at launch, buy sizeable amounts, and later sell into the first big expansion.
We don’t call them “insiders.” We call it “early informed-looking activity” and note the pattern.
4. Behavioral Transition — The Most Powerful Layer
A single pattern can be normal.
A change in patterns is often much more meaningful.
Example:
Before
Mostly retail buyingLow wallet coordinationNormal trade intervalsStable liquidity
Then something changes
Wallet synchronization increasesA small group of wallets starts accumulatingSell pressure is being absorbedLiquidity becomes more concentrated
Now
Possible coordinated accumulation phase.
This “regime change” thinking is far more useful than trying to label every token as “has a market maker” or “is organic.”
5. Putting It All Together — Market State
Instead of 20 different alarms, the goal is to arrive at a clear, evidence-based summary:
Market State
Accumulation with coordinated activity
Why
Sell pressure is being absorbed8 high-activity wallets increased their net position5 of them show synchronized execution3 share a common funding relationshipPrice stayed relatively stable despite elevated selling
Caution
Activity is concentrated in a small clusterA meaningful portion of volume may not come from independent participants
Confidence
Medium-High
If you want to go deeper, you can expand every bullet into the raw on-chain evidence.
This format is readable, honest about uncertainty, and actually useful for decision-making.
6. Important Limitations (Read This)
Correlation is not proof of control. Common funding + synchronized trading is strong evidence of coordination, but not 100% certainty.Many patterns that look “manipulative” can also appear in legitimate market-making or sophisticated trading.Order-book style spoofing (fake walls that disappear) is much less relevant on pure AMMs like Raydium or Pump.fun than on centralized exchanges.Tools can be wrong or incomplete. Always try to verify key claims yourself on Solscan, Bubblemaps, or similar explorers.
The goal is not to become a conspiracy theorist. The goal is to see the structure of the market more clearly than the average person watching a stream.
Final Thoughts
Most memecoin traders only see the surface: price, volume, and what influencers say.
Underneath there is a rich layer of wallet coordination, algorithmic behavior, liquidity management, absorption, distribution, and regime changes.
You don’t need to detect “the market maker.”
You need to observe the patterns, form careful hypotheses, and understand what those patterns imply for the next moves in the chart.
Once you start looking at Solana tokens this way, the market becomes a lot less mysterious — and a lot more readable.
Trade carefully.
143


·
--
ブリッシュ
数字は言葉よりも雄弁で、私の言いたいことを証明します。
これについて興味があるなら、私のDMは開いています。私が見ていることを喜んで共有します。情報は閉ざされていません。そして、昨日の[HIPPO](https://www.binance.com/en/square/post/296905111224274)の投稿を見ることができます。
数字は言葉よりも雄弁で、私の言いたいことを証明します。
これについて興味があるなら、私のDMは開いています。私が見ていることを喜んで共有します。情報は閉ざされていません。そして、昨日のHIPPOの投稿を見ることができます。
これについて興味があるなら、私のDMは開いています。私が見ていることを喜んで共有します。情報は閉ざされていません。そして、昨日のHIPPOの投稿を見ることができます。

引用されたコンテンツは削除されました
28


·
--

記事
OMG IPストーリー・プロトコルに注意を払ってください$IP 最も洗練された供給側の操作を持つ「完璧な罠」
ペーパー・ハンズのための10億ドルの罠。
$0.91のIPには誰も興味がなく、絶対的なチャドとメガホエールが笑っています。これが詐欺だと思いますか?違います、兄弟、あなたはただスマートマネーに出し抜かれているだけです。
「IPのNvidia」を93%のディスカウントで売ることを想像してみてください。💀私はウォレットの集中、ナスダック上場の自社株買い、そして秘密の韓国RWAメタを掘り下げています。データは嘘をつきません:供給は固定されており、ショートは追い詰められ、そして...
OMG IPストーリー・プロトコルに注意を払ってください
$IP 最も洗練された供給側の操作を持つ「完璧な罠」
ペーパー・ハンズのための10億ドルの罠。
$0.91のIPには誰も興味がなく、絶対的なチャドとメガホエールが笑っています。これが詐欺だと思いますか?違います、兄弟、あなたはただスマートマネーに出し抜かれているだけです。
「IPのNvidia」を93%のディスカウントで売ることを想像してみてください。💀私はウォレットの集中、ナスダック上場の自社株買い、そして秘密の韓国RWAメタを掘り下げています。データは嘘をつきません:供給は固定されており、ショートは追い詰められ、そして...
ペーパー・ハンズのための10億ドルの罠。
$0.91のIPには誰も興味がなく、絶対的なチャドとメガホエールが笑っています。これが詐欺だと思いますか?違います、兄弟、あなたはただスマートマネーに出し抜かれているだけです。
「IPのNvidia」を93%のディスカウントで売ることを想像してみてください。💀私はウォレットの集中、ナスダック上場の自社株買い、そして秘密の韓国RWAメタを掘り下げています。データは嘘をつきません:供給は固定されており、ショートは追い詰められ、そして...
3
531
·
--

記事
私はHIPPOで30,000%を得るつもりですデータが実際に示すもの
信号とノイズを分けるためにオンチェーンメトリクスを掘り下げました。検証されたデータが現在の状態について明らかにしていることは$HIPPO です
1. 集中の現実 🐋
ウォレット分析によると、上位10のウォレットは循環供給の約66.14%を保有しています。これは必ずしも操作とは限りません—構造的なものです。7,212人のアクティブな保有者がいるため、この集中は意味します:
大口保有者は価格の方向性に大きな影響を与える可能性があります
中程度の市場注文でも目立ったスリippageを引き起こします
私はHIPPOで30,000%を得るつもりです
データが実際に示すもの
信号とノイズを分けるためにオンチェーンメトリクスを掘り下げました。検証されたデータが現在の状態について明らかにしていることは$HIPPO です
1. 集中の現実 🐋
ウォレット分析によると、上位10のウォレットは循環供給の約66.14%を保有しています。これは必ずしも操作とは限りません—構造的なものです。7,212人のアクティブな保有者がいるため、この集中は意味します:
大口保有者は価格の方向性に大きな影響を与える可能性があります
中程度の市場注文でも目立ったスリippageを引き起こします
信号とノイズを分けるためにオンチェーンメトリクスを掘り下げました。検証されたデータが現在の状態について明らかにしていることは$HIPPO です
1. 集中の現実 🐋
ウォレット分析によると、上位10のウォレットは循環供給の約66.14%を保有しています。これは必ずしも操作とは限りません—構造的なものです。7,212人のアクティブな保有者がいるため、この集中は意味します:
大口保有者は価格の方向性に大きな影響を与える可能性があります
中程度の市場注文でも目立ったスリippageを引き起こします
4
260
·
--
ブリッシュ
$NAORIS クジラと一緒に購入する(スマートマネーのみ)
{future}(NAORISUSDT)
低リスクで高リターンのエントリーを探しているなら、#Naoris のデータが完璧に一致しました。これは単なる誇大広告ではなく、純粋な市場構造です。
1️⃣ 「クジラのフロア」 🧱
現在、$0.035 - $0.040のゾーンで取引を行っています。これが重要な理由は何ですか?それは、トップ10ホルダーの平均エントリープライスだからです。
ここで購入することは、プロジェクトの最大の支援者と同じレベルでのエントリーを意味します。あなたには「スマートマネー」があなたのフロアを守ってくれています。
2️⃣ 基礎的なこと: 「量子耐性」 🧬
世界は量子コンピューティングに向かってシフトしていますが、現在のほとんどのネットワークは脆弱です。ナオリスプロトコルは、これらの未来の脅威から分散化を守る重要なセキュリティレイヤーです。これはミームではなく、すでにトップアナリストによってフラグが立てられている必須のインフラです。
3️⃣ アルファ確認 🚀
小売業者がまだ眠っている間に、バイナンスアルファはすでに今日+41.95%のキャンドルで叫んでいます。大口の財布は、巨大な緑のキャンドルの前に静かに蓄積しています。
📍 判決: あなたはまだ「小売FOMO」を先取りするのには十分早いです。成功する取引のルール#1: クジラが購入しているときに買うこと。
ウィンドウは急速に閉じています。
#ZOOM360 #JIMMYEVANS
$NAORIS クジラと一緒に購入する(スマートマネーのみ)
低リスクで高リターンのエントリーを探しているなら、#Naoris のデータが完璧に一致しました。これは単なる誇大広告ではなく、純粋な市場構造です。
1️⃣ 「クジラのフロア」 🧱
現在、$0.035 - $0.040のゾーンで取引を行っています。これが重要な理由は何ですか?それは、トップ10ホルダーの平均エントリープライスだからです。
ここで購入することは、プロジェクトの最大の支援者と同じレベルでのエントリーを意味します。あなたには「スマートマネー」があなたのフロアを守ってくれています。
2️⃣ 基礎的なこと: 「量子耐性」 🧬
世界は量子コンピューティングに向かってシフトしていますが、現在のほとんどのネットワークは脆弱です。ナオリスプロトコルは、これらの未来の脅威から分散化を守る重要なセキュリティレイヤーです。これはミームではなく、すでにトップアナリストによってフラグが立てられている必須のインフラです。
3️⃣ アルファ確認 🚀
小売業者がまだ眠っている間に、バイナンスアルファはすでに今日+41.95%のキャンドルで叫んでいます。大口の財布は、巨大な緑のキャンドルの前に静かに蓄積しています。
📍 判決: あなたはまだ「小売FOMO」を先取りするのには十分早いです。成功する取引のルール#1: クジラが購入しているときに買うこと。
ウィンドウは急速に閉じています。
#ZOOM360 #JIMMYEVANS

1
109
·
--
ブリッシュ
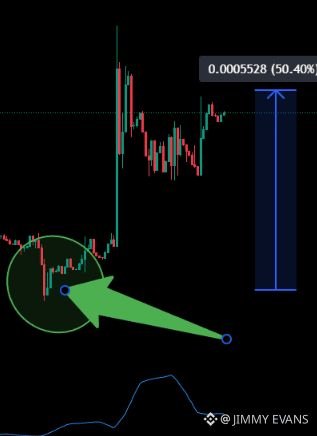
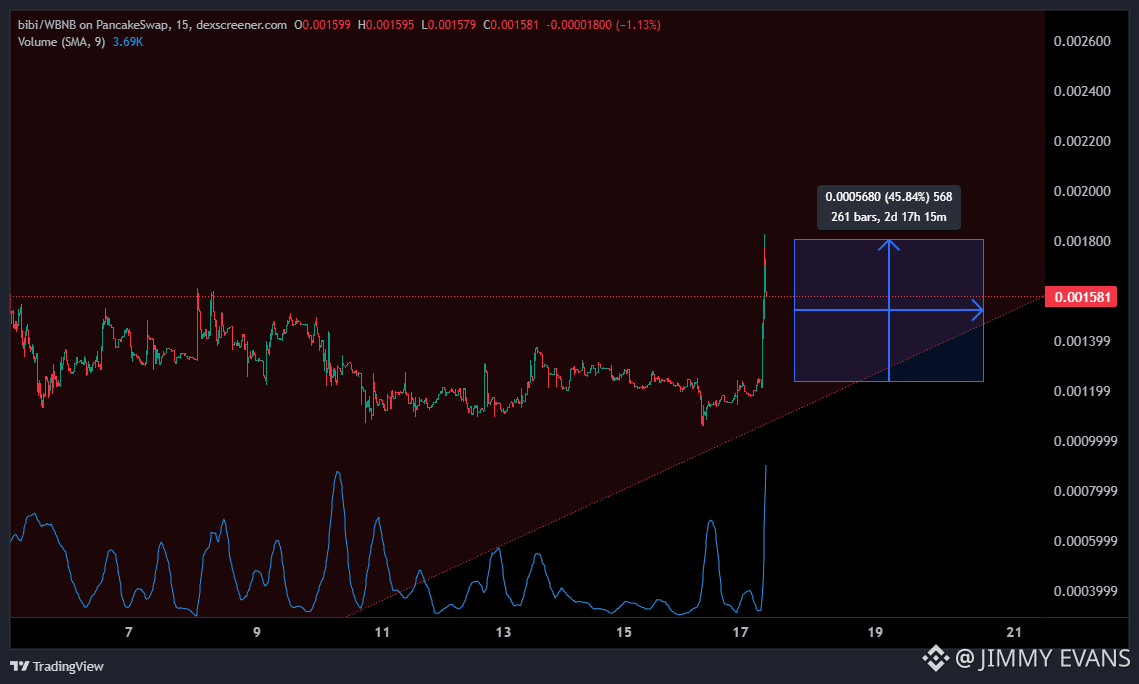
昨日、#BIBI を購入し、すでに50%上昇しました。
{web3_wallet_create}(560x9212cf1f9f4a9c69bb010146ba5b0725169d4444)
行こう!
昨日、#BIBI を購入し、すでに50%上昇しました。
行こう!
行こう!
84
·
--
私のフォロワーの何人かがこれを受け取っていることを願っています。私はここで少なくとも10倍を探しています。
私のフォロワーの何人かがこれを受け取っていることを願っています。私はここで少なくとも10倍を探しています。
JIMMY EVANS
·
--
@Binance BiBi このトークンについてどう思いますか #BIBI #BinanceBiBi 0x9212cF1f9f4A9c69Bb010146Ba5b0725169D4444
1
84
·
--
@trendcoin_org ☝️🏃♂️➡️ @wgocrypto レバレッジなし、購入してTPを設定し、忘れてください👋
@Trend Coin Tasks ☝️🏃♂️➡️ @Trend Coin レバレッジなし、購入してTPを設定し、忘れてください👋
JIMMY EVANS
·
--
ブリッシュ🚀 誰も怖がらせるつもりはないが... 🚨
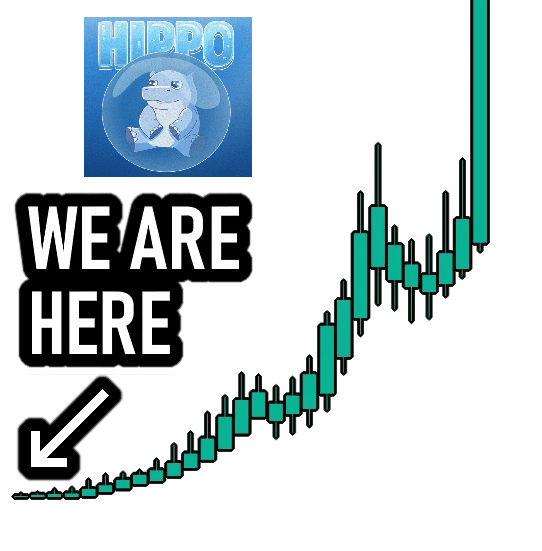
もしあなたが今$HIPPO を持っているなら、これを見なければなりません。私は先物注文書を監査しましたが、そのデータは絶対に狂っています:
「ガラスの壁」:本のすべての売り注文を消し去り、価格を0.01755に引き上げるには、($493,863 USDT) たった493,863ドルで済みます。そう、あなたは正しく読みました。50万ドル未満で、月への道は障害物が全くありません。
純粋な燃料(オープン・インタレスト)⛽:オープン・インタレストは価格とともに急上昇しています。これは単なる運ではありません;新しい資本が市場に流れ込んでいます。新しいプレーヤーが戦いに参入しており、彼らは大量に購入しています。
ショートトラップ:価格が上昇する間、グローバルロング/ショート比率は低下しています。訳すと?小売トレーダーはこのラリーを「ショート」しようとしており、次のレッグアップのための文字通りの燃料になっています。彼らの清算が私たちのロケット船になります。
テイカーアグレッション:テイカー買いボリュームに大きなスパイクを見ています。大きな買いが攻撃的な市場買いで注文書を掃除しています。
判決:売り側の流動性は非常に薄く、「#tothemoon」は過小評価です。もし単独のクジラが100万ドルを落としたら、私たちは単に0.017に到達するだけではなく、チャートを壊すことになるでしょう。
これはただのウォームアップです。しっかり掴んでください、空は限界ではなく、無限があるかもしれません。
家族の皆さん、心に留めておいてください:HIPPOの軌道はSUIのパフォーマンスに強く結びついています。SUIを高速道路、HIPPOをフェラーリと考えてください。SUIがその強気の構造を開始し、重要なサポートレベルを保持している限り、エコシステムに流入する流動性はその50万ドルの売り壁を一瞬で蒸発させるでしょう。私たちは単なるミームを見ているのではなく、SUIネットワークのフラッグシップが大規模な流動性回転の準備をしているのを見ています。もしSUIが次の主要抵抗を突破すれば、HIPPOはただ従うのではなく、無限への突撃を先導します。
#HIPPO #ZOOM360 #JIMMYEVANS
13
ログインして、さらにコンテンツを読む
厳選トピックで世界の暗号資産トレーダーの仲間入り
⚡️ 暗号資産に関する最新かつ有益な情報が見つかります。
💬 世界最大の暗号資産取引所から信頼されています。
👍 認証を受けたクリエイターから、有益なインサイトを得られます。
メール / 電話番号