


If you’ve spent any time trading memecoins on Solana, you’ve probably asked yourself questions like:
“Why does this token keep recovering in almost the exact same way after every dump?”
“How is there so much volume when there are barely any real holders?”
“Why do a bunch of wallets buy at almost the exact same second?”
“Is this a market maker… or just a bunch of bots… or the team dumping slowly?”
Most people answer these questions with vibes, Twitter threads, or what they heard in a stream.
The problem is that the real activity on Solana is much more layered than “there’s a market maker” or “it’s being manipulated.”
This article is written for the people who actually trade these tokens — not just for on-chain analysts with five monitors. We’re going to break down the patterns you can actually see, explain them in plain language, and show you how to move from raw observation to a smarter interpretation without jumping to conclusions.
1. Why Solana Memecoins Are Different
Solana is extremely fast and extremely cheap. That changes everything.
On Ethereum, high transaction fees and slower confirmation times make it expensive to spam trades or run dozens of wallets. On Solana you can:
Create a token
Add liquidity
Buy with 20 different wallets
Sell small amounts over and over
Move money between wallets
…all in a matter of seconds and for almost nothing in fees.
This environment creates a unique mix of:
Professional market makers hired by bigger projects
Algorithmic bots run by developers or private groups
Sniper bots
Coordinated groups of wallets controlled by the same people
Regular retail traders
The result is that charts and volume numbers often lie (or at least tell a very incomplete story).
2. The Most Important Rule: Observation vs Interpretation
This is the biggest upgrade you can make in how you look at tokens.
Bad habit (what most people do):
“These 15 wallets all bought at the same time → this is a market maker.”
Better approach:
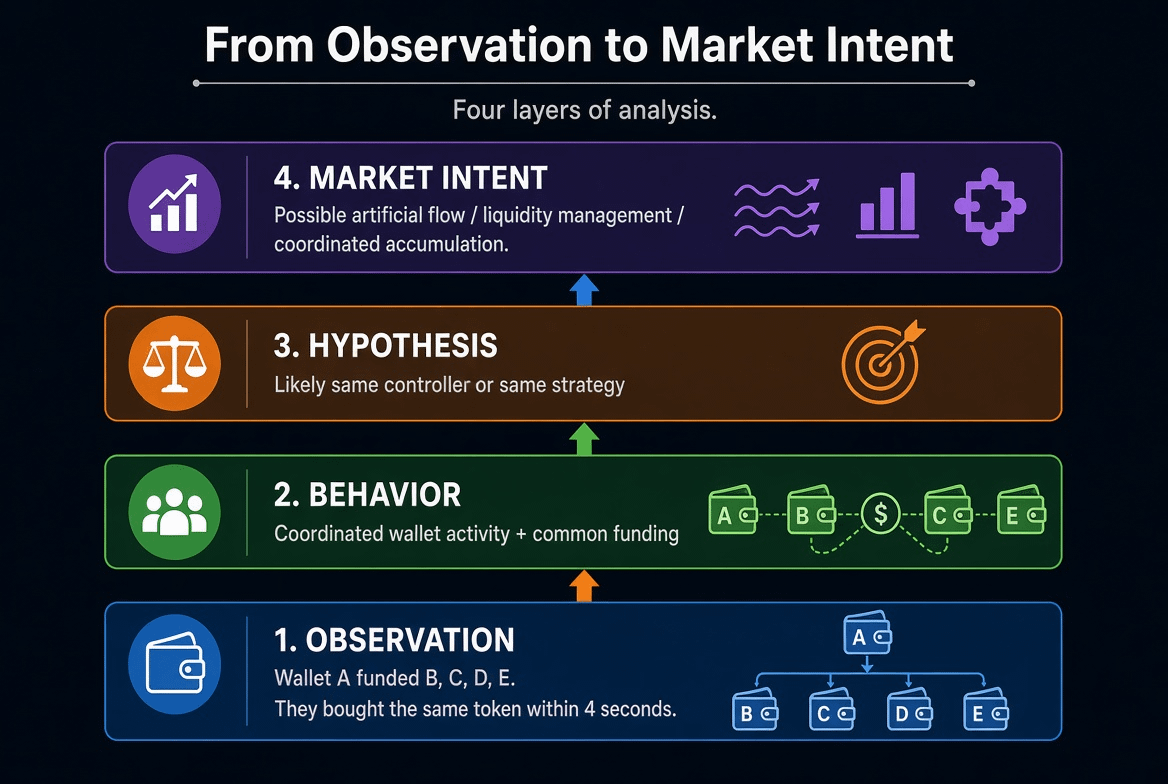
Observation (what you can actually see on-chain)
Behavior (what pattern this activity forms)
Hypothesis (what could reasonably explain it)
Market Intent (what this might mean for the token’s price action)
Example:
Observation
Wallet A sent 0.8 SOL to Wallet B, C, D and E.
A few minutes later, B, C, D and E all bought the same token with similar size within 4 seconds of each other.
Behavior
Coordinated wallet activity + common funding source.
Hypothesis
These wallets are likely controlled by the same entity or are following the same strategy.
Market Intent
Possible artificial flow, liquidity management, or early accumulation by a coordinated group.
Notice we never said “this is a market maker.” We stayed at the level of evidence.
This way of thinking is much more powerful (and much harder to get wrong).
3. The Main Families of Behavior You Should Watch
Here are the most important patterns, explained from beginner to advanced.
A. Wallet Coordination (The Foundation)
This is one of the strongest signals.
What you look for:
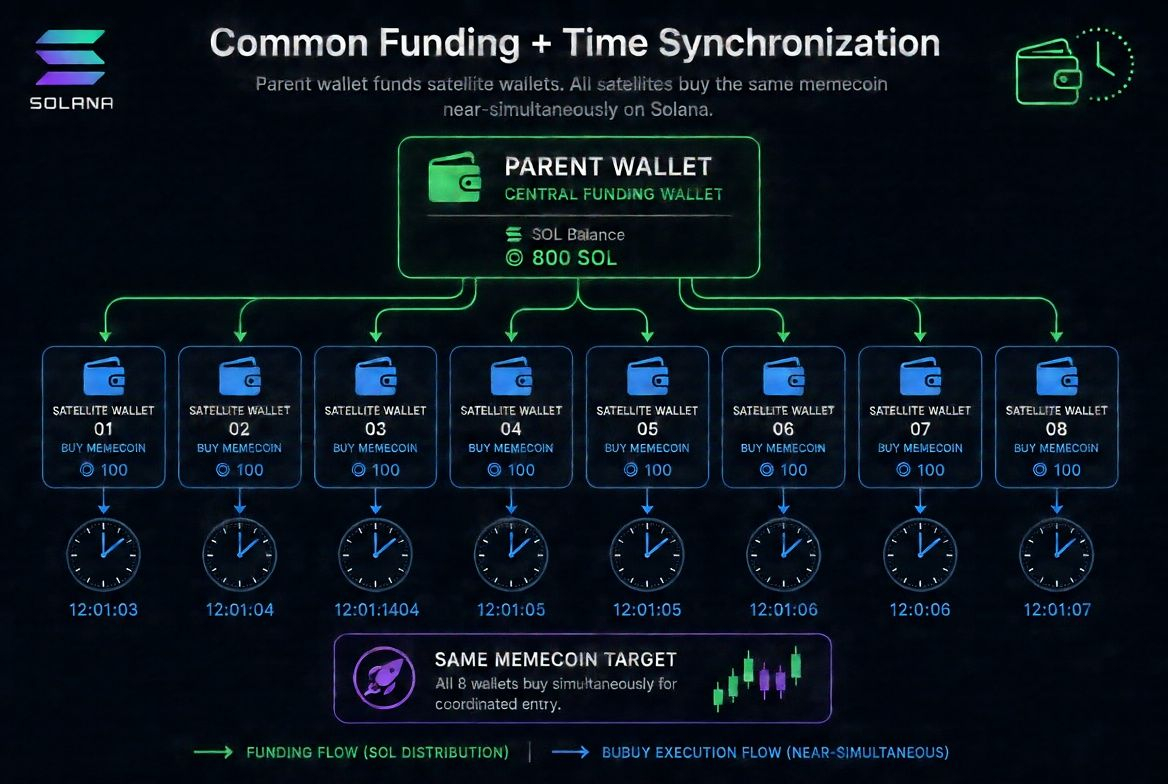
Multiple wallets funded by the same “parent” wallet
Wallets created or activated in a very short time window
Wallets that buy or sell almost the same amount at almost the same time
Wallets that keep appearing together across different tokens
Chains of funding (A → B → C → D)
Simple analogy: Imagine 12 people who all got money from the same guy, then all walk into the same store and buy the same product within 10 seconds of each other. That’s not random.
When you see this repeatedly, you’re looking at coordinated activity.
B. Launch Coordination (What Happens in the First Blocks)
At token launch you often see:
Token creation
Liquidity pool creation
Multiple buys
Sometimes early sells
…all happening in the same slot or consecutive slots.
This is frequently done with Jito bundles (a way to group transactions so they execute together).
Important: Bundling itself is not automatically “manipulation.” Many legitimate launches use it to protect against snipers. The interesting part is the pattern of who is buying, how the wallets are related, and what happens afterward.
C. Wash Trading & Artificial Volume
Classic pattern:
Wallet A buys
Wallet B sells
Money moves between them
They repeat with similar sizes and timing
The volume number on Dexscreener looks huge, but the number of independent economic participants is very low.
Key metric to watch:
Reported volume vs number of unique wallets that are not connected to each other.
$1.2 million in volume with only 40 real independent wallets tells a completely different story than the same volume with 800 unconnected wallets.
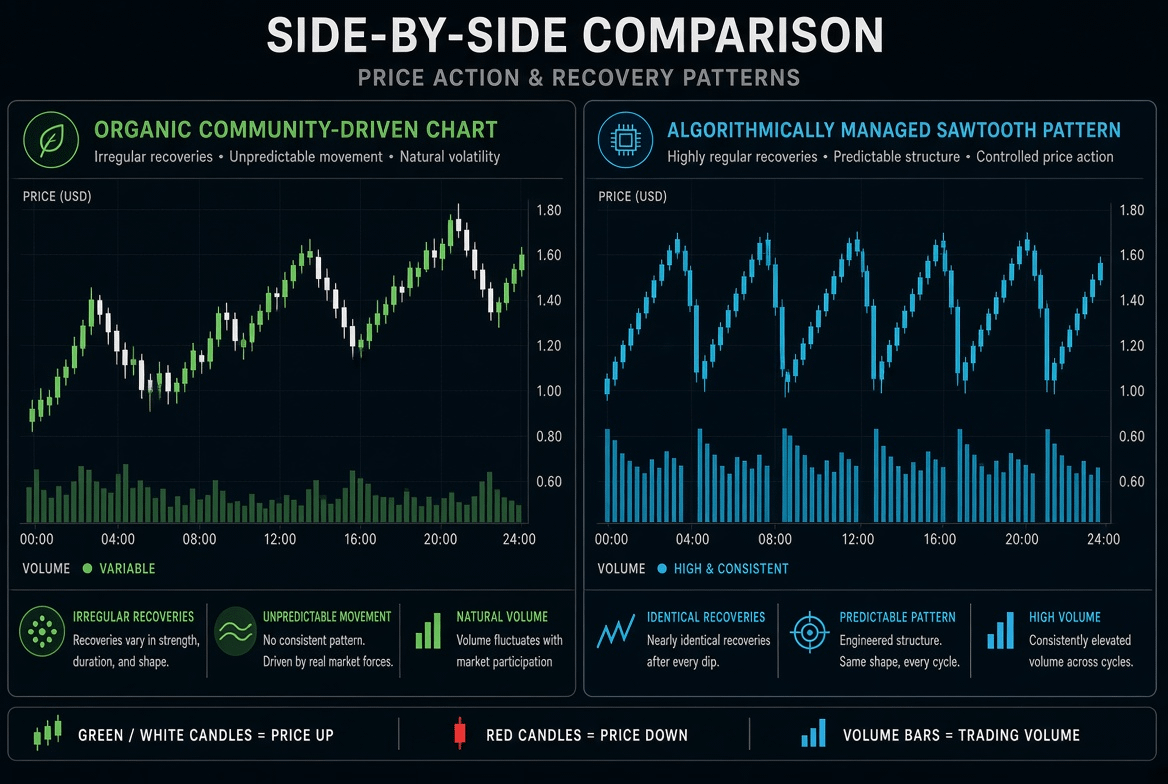
D. Algorithmic / Bot-Like Activity
Signs:
Extremely regular time intervals between trades
Almost identical trade sizes
Activity that never sleeps (24/7 with no human-like pauses)
Same exact route through the same pools over and over
Very low variation in behavior
You don’t need to say “this is a bot.” You can say:
“Algorithmic activity pattern is high — 87 trades, median interval 1.2 seconds, size variance extremely low.”
That’s already very useful information.
E. High-Frequency & Scalping Behavior
Some wallets buy and sell within seconds or minutes, over and over.
Look at:
Average holding time
Number of round trips
Gross volume traded vs net position change
Example:
A wallet traded $48,000 worth of the token but only ended up with +1,200 tokens.
That is high turnover with low net accumulation — classic scalping or HFT-style behavior.
F. Liquidity Management
Who is adding and removing liquidity, and when?
Interesting patterns:
Liquidity added just before a big buy
Liquidity removed just before a big sell
Liquidity changes that happen at the same time as certain wallet activity
Liquidity concentrated in very few wallets
This can reveal who is trying to control price impact.
G. Absorption (One of the Most Important Patterns)
You see heavy selling pressure…
but the price barely drops…
and buying keeps appearing on the other side.
This often means someone is deliberately absorbing the sells (supporting the price).
Later, when the selling pressure decreases, the price starts rising.
The absorption hypothesis becomes stronger.
H. Distribution Patterns
Instead of one big dump (which destroys the chart), you often see:
Gradual / “Ant” distribution
Small sells spread over hours while retail is still buying.
Stair-step distribution
Price rises → whale sells a chunk → price keeps rising → whale sells again → repeat.
Distribution into strength
Selling while demand is still strong.
I. Accumulation
The opposite of distribution:
Price is sideways or slowly declining
Selling pressure is high
Certain wallets keep buying
Their net position is growing
Price does not fall as much as the selling would suggest
J. MEV / Sandwich Activity
On Solana you can see patterns where:
One wallet buys right before a large trade
Then sells right after
This is common MEV (Maximal Extractable Value) behavior. Not every similar sequence is a sandwich, but the pattern is detectable.
K. Arbitrage & Cross-DEX Price Control
When the same token exists on Pump.fun / PumpSwap and Raydium (or other pools), bots constantly buy the cheaper one and sell the more expensive one.
This keeps prices relatively synchronized. Watching who is doing this arbitrage tells you who is keeping the market efficient.
L. Wallet Rotation & Token Rotation
Wallet rotation:
Position moves from Wallet A → Wallet B → Wallet C while the overall exposure stays similar.
Token rotation:
The same cluster of wallets that were early in Token A now appear accumulating Token B, then Token C.
This is extremely valuable once you start tracking wallet clusters across time.
M. New Wallet Inflow
Sudden appearance of many brand new wallets can mean organic interest… or it can mean a new cluster of coordinated wallets being activated.
Always check whether the new wallets are related to each other.
N. Early / Informed-Looking Activity
Wallets that appear right at launch, buy sizeable amounts, and later sell into the first big expansion.
We don’t call them “insiders.” We call it “early informed-looking activity” and note the pattern.
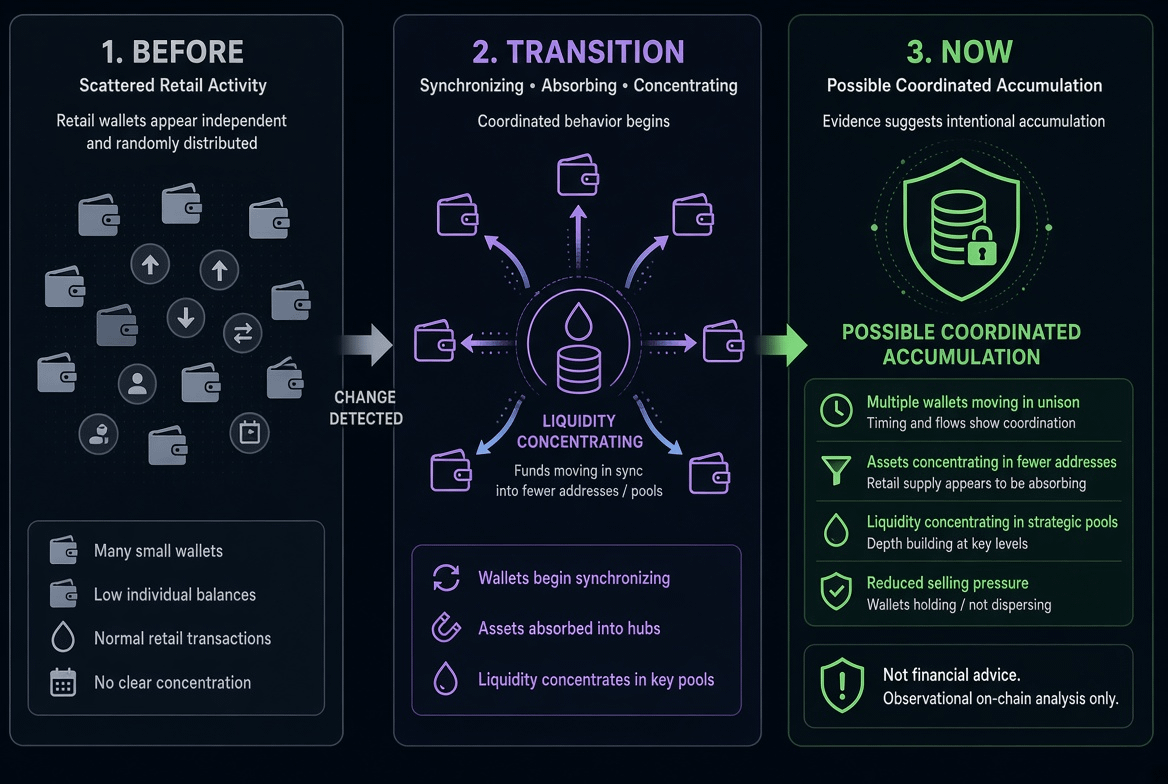
4. Behavioral Transition — The Most Powerful Layer
A single pattern can be normal.
A change in patterns is often much more meaningful.
Example:
Before
Mostly retail buying
Low wallet coordination
Normal trade intervals
Stable liquidity
Then something changes
Wallet synchronization increases
A small group of wallets starts accumulating
Sell pressure is being absorbed
Liquidity becomes more concentrated
Now
Possible coordinated accumulation phase.
This “regime change” thinking is far more useful than trying to label every token as “has a market maker” or “is organic.”
5. Putting It All Together — Market State
Instead of 20 different alarms, the goal is to arrive at a clear, evidence-based summary:
Market State
Accumulation with coordinated activity
Why
Sell pressure is being absorbed
8 high-activity wallets increased their net position
5 of them show synchronized execution
3 share a common funding relationship
Price stayed relatively stable despite elevated selling
Caution
Activity is concentrated in a small cluster
A meaningful portion of volume may not come from independent participants
Confidence
Medium-High
If you want to go deeper, you can expand every bullet into the raw on-chain evidence.
This format is readable, honest about uncertainty, and actually useful for decision-making.
6. Important Limitations (Read This)
Correlation is not proof of control. Common funding + synchronized trading is strong evidence of coordination, but not 100% certainty.
Many patterns that look “manipulative” can also appear in legitimate market-making or sophisticated trading.
Order-book style spoofing (fake walls that disappear) is much less relevant on pure AMMs like Raydium or Pump.fun than on centralized exchanges.
Tools can be wrong or incomplete. Always try to verify key claims yourself on Solscan, Bubblemaps, or similar explorers.
The goal is not to become a conspiracy theorist. The goal is to see the structure of the market more clearly than the average person watching a stream.
Final Thoughts
Most memecoin traders only see the surface: price, volume, and what influencers say.
Underneath there is a rich layer of wallet coordination, algorithmic behavior, liquidity management, absorption, distribution, and regime changes.
You don’t need to detect “the market maker.”
You need to observe the patterns, form careful hypotheses, and understand what those patterns imply for the next moves in the chart.
Once you start looking at Solana tokens this way, the market becomes a lot less mysterious — and a lot more readable.
Trade carefully.