

Crypto Signals and Analysis
61 投稿
Crypto Signals and Analysis
報告
ユーザーをブロック
Crypto trading signals and market analysis. We identify key levels, clear entry points, and defined targets with a disciplined focus on risk management.
取引を発注
高頻度トレーダー
3.4年
2 フォロー
37 フォロワー
55 いいね
投稿
ポートフォリオ
·
--
弱気相場
翻訳参照
$ERA Price Prediction Today: Caldera Crypto Signal & Technical Analysis 📊
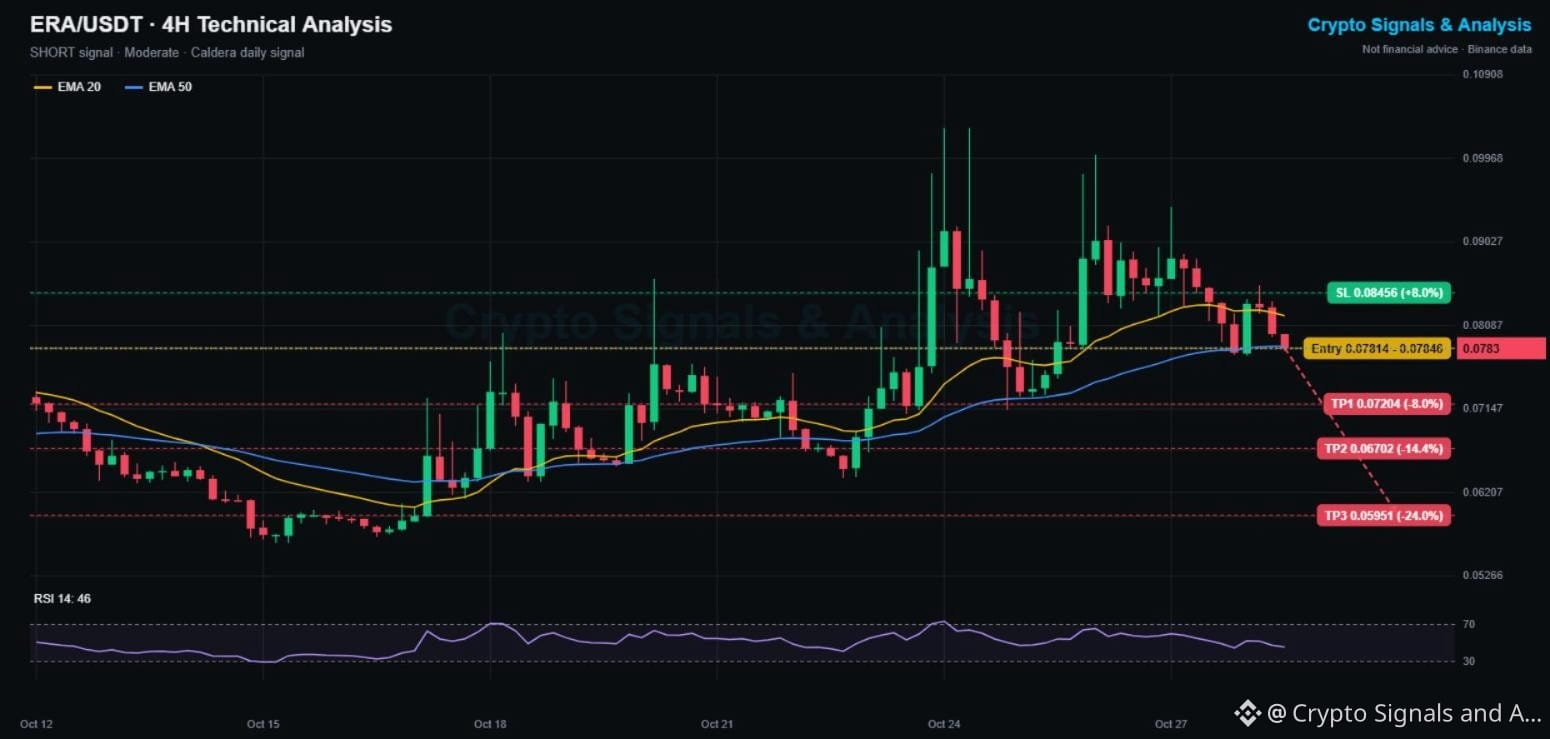
🔴 SHORT | Entry 0.07814 - 0.07846 | TP1 0.07204 | SL 0.08456
👉 Tap $ERA to place your trade fast
Caldera ran from 0.056 to 0.100 this month, but the last three pushes toward 0.10 all got rejected with long wicks. Today it dropped 6% and lost its 4H EMA20, and price is now sitting right on the EMA50.
📌 CALDERA TRADING SIGNAL (Moderate, momentum fading)
Entry: 0.07814 - 0.07846
Take profit 1: 0.07204 (-8%)
Take profit 2: 0.06702 (-14%)
Take profit 3: 0.05951 (-24%)
Stop loss: 0.08456 (+8%)
📊 ERA TECHNICAL ANALYSIS (4H CHART)
ERA is under the EMA20 (0.0820), which is now turning down, and it is testing the EMA50 (0.0785). RSI dropped to 46. The repeated wicks at 0.096 to 0.100 show heavy supply up there. Caution: the coin is still up 11% on the week, so wait for a 4H close under the EMA50 before going full size.
🔑 KEY LEVELS
Support: 0.0785 (EMA50), then 0.0731
Resistance: 0.0820 (EMA20), then 0.0880
📈 Bullish scenario: a bounce from the EMA50 and a close above 0.0846 keeps the uptrend alive and cancels the short.
📉 Bearish scenario: a 4H close under 0.0785 confirms the top and opens TP1 and TP2.
💡 Bottom line: three failed tops is a warning. The EMA50 is the line that decides it.
👉 Tap $ERA
to open the live chart. NFA
🔥 TRADE WITH LOWER FEES
✅ Get a 20% kickback on your Binance trading fees, for life
👇👇👇
{spot}(ERAUSDT)
[Claim your 20% Binance fee kickback here](https://www.binance.com/register?ref=X0NQWZ4N)
━━━━━━━━━━
Caldera: bull flag or triple top? Tell me your read 👇
Follow Crypto Signals and Analysis for daily signals.
#cryptosignals #ERA #EarningsSeason
⚠️ Crypto is volatile: risk only what you can afford to lose.
$ERA Price Prediction Today: Caldera Crypto Signal & Technical Analysis 📊
🔴 SHORT | Entry 0.07814 - 0.07846 | TP1 0.07204 | SL 0.08456
👉 Tap $ERA to place your trade fast
Caldera ran from 0.056 to 0.100 this month, but the last three pushes toward 0.10 all got rejected with long wicks. Today it dropped 6% and lost its 4H EMA20, and price is now sitting right on the EMA50.
📌 CALDERA TRADING SIGNAL (Moderate, momentum fading)
Entry: 0.07814 - 0.07846
Take profit 1: 0.07204 (-8%)
Take profit 2: 0.06702 (-14%)
Take profit 3: 0.05951 (-24%)
Stop loss: 0.08456 (+8%)
📊 ERA TECHNICAL ANALYSIS (4H CHART)
ERA is under the EMA20 (0.0820), which is now turning down, and it is testing the EMA50 (0.0785). RSI dropped to 46. The repeated wicks at 0.096 to 0.100 show heavy supply up there. Caution: the coin is still up 11% on the week, so wait for a 4H close under the EMA50 before going full size.
🔑 KEY LEVELS
Support: 0.0785 (EMA50), then 0.0731
Resistance: 0.0820 (EMA20), then 0.0880
📈 Bullish scenario: a bounce from the EMA50 and a close above 0.0846 keeps the uptrend alive and cancels the short.
📉 Bearish scenario: a 4H close under 0.0785 confirms the top and opens TP1 and TP2.
💡 Bottom line: three failed tops is a warning. The EMA50 is the line that decides it.
👉 Tap $ERA
to open the live chart. NFA
🔥 TRADE WITH LOWER FEES
✅ Get a 20% kickback on your Binance trading fees, for life
👇👇👇
Claim your 20% Binance fee kickback here
━━━━━━━━━━
Caldera: bull flag or triple top? Tell me your read 👇
Follow Crypto Signals and Analysis for daily signals.
#cryptosignals #ERA #EarningsSeason
⚠️ Crypto is volatile: risk only what you can afford to lose.
1
216
·
--
弱気相場
翻訳参照
$QNT Price Prediction Today: Quant Crypto Signal & Technical Analysis 📊
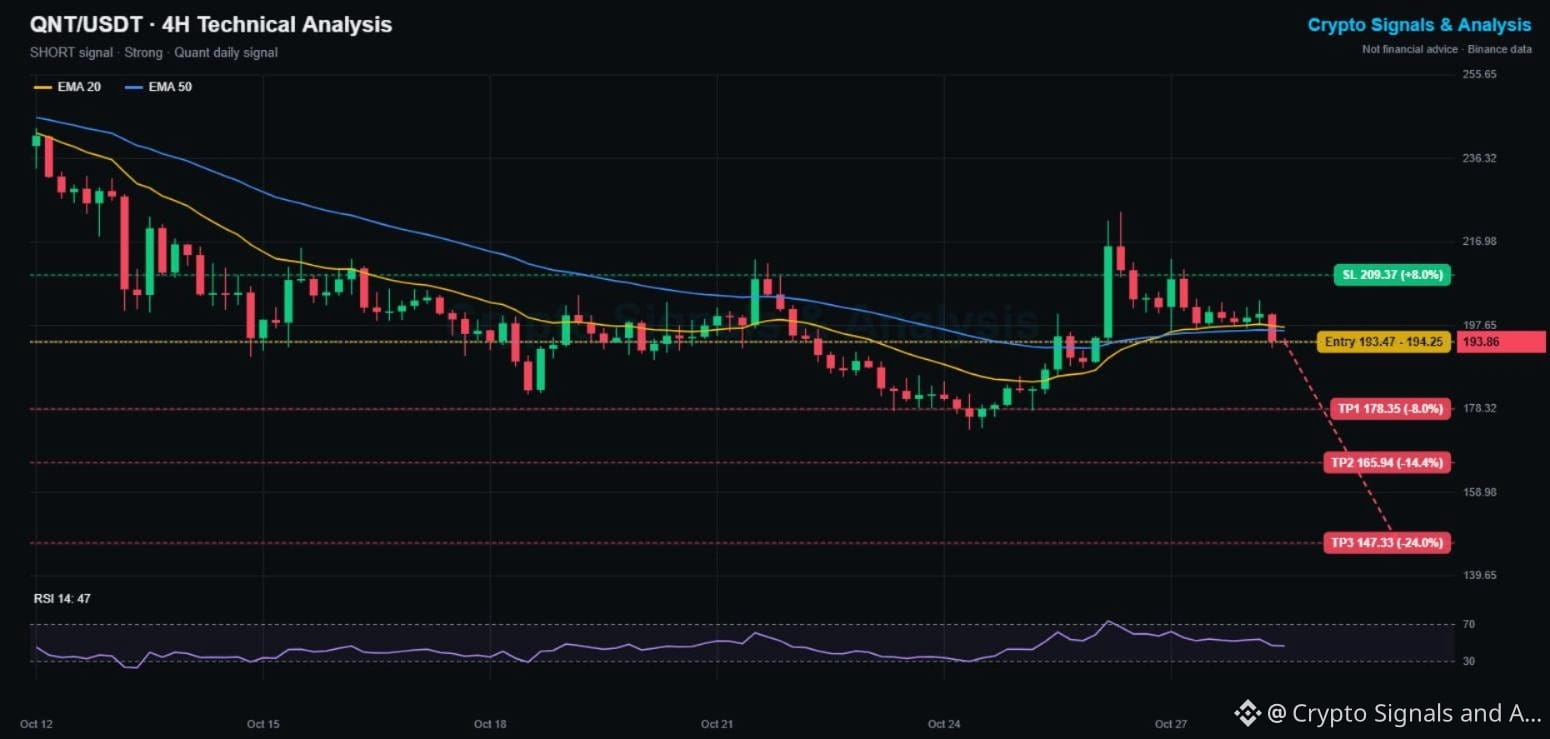
🔴 SHORT | Entry 193.5 - 194.3 | TP1 178.4 | SL 209.4
👉 Tap $QNT to place your trade fast
Quant spiked to 224 on Oct 26 but could not hold it. Two days of lower highs followed, and today a 3.4% drop pushed it back under both 4H EMAs. The spike now looks like a bull trap.
📌 QUANT TRADING SIGNAL (Strong, 4/5 signals agree)
Entry: 193.5 - 194.3
Take profit 1: 178.4 (-8%)
Take profit 2: 165.9 (-14%)
Take profit 3: 147.3 (-24%)
Stop loss: 209.4 (+8%)
📊 QNT TECHNICAL ANALYSIS (4H CHART)
QNT has lost the EMA20 (197.2) and EMA50 (196.4), and the EMA20 is rolling over. RSI at 47 is neutral but falling. The long-term trend from 243 in mid-October is still down. The 181.8 low is the first target zone, and the Oct 24 low at 173.6 is the next.
🔑 KEY LEVELS
Support: 181.8, then 173.6
Resistance: 197.2 (EMA20), then 209
📈 Bullish scenario: a 4H close above 209.4 reclaims the breakout zone and cancels the short.
📉 Bearish scenario: losing 181.8 opens TP2 and the October lows.
💡 Bottom line: a failed spike plus an EMA breakdown is a bearish combo. Respect the stop above 209.
👉 Tap $QNT
to open the live chart. NFA
🔥 TRADE WITH LOWER FEES
✅ Get a 20% kickback on your Binance trading fees, for life
👇👇👇
{spot}(QNTUSDT)
[Claim your 20% Binance fee kickback here](https://www.binance.com/register?ref=X0NQWZ4N)
━━━━━━━━━━
Was the Quant spike to 224 a trap? Tell me below 👇
Follow Crypto Signals and Analysis for daily signals.
#cryptosignals #QNT #CanGoogleDefendItsCore
⚠️ Crypto is volatile: risk only what you can afford to lose.
$QNT Price Prediction Today: Quant Crypto Signal & Technical Analysis 📊
🔴 SHORT | Entry 193.5 - 194.3 | TP1 178.4 | SL 209.4
👉 Tap $QNT to place your trade fast
Quant spiked to 224 on Oct 26 but could not hold it. Two days of lower highs followed, and today a 3.4% drop pushed it back under both 4H EMAs. The spike now looks like a bull trap.
📌 QUANT TRADING SIGNAL (Strong, 4/5 signals agree)
Entry: 193.5 - 194.3
Take profit 1: 178.4 (-8%)
Take profit 2: 165.9 (-14%)
Take profit 3: 147.3 (-24%)
Stop loss: 209.4 (+8%)
📊 QNT TECHNICAL ANALYSIS (4H CHART)
QNT has lost the EMA20 (197.2) and EMA50 (196.4), and the EMA20 is rolling over. RSI at 47 is neutral but falling. The long-term trend from 243 in mid-October is still down. The 181.8 low is the first target zone, and the Oct 24 low at 173.6 is the next.
🔑 KEY LEVELS
Support: 181.8, then 173.6
Resistance: 197.2 (EMA20), then 209
📈 Bullish scenario: a 4H close above 209.4 reclaims the breakout zone and cancels the short.
📉 Bearish scenario: losing 181.8 opens TP2 and the October lows.
💡 Bottom line: a failed spike plus an EMA breakdown is a bearish combo. Respect the stop above 209.
👉 Tap $QNT
to open the live chart. NFA
🔥 TRADE WITH LOWER FEES
✅ Get a 20% kickback on your Binance trading fees, for life
👇👇👇
Claim your 20% Binance fee kickback here
━━━━━━━━━━
Was the Quant spike to 224 a trap? Tell me below 👇
Follow Crypto Signals and Analysis for daily signals.
#cryptosignals #QNT #CanGoogleDefendItsCore
⚠️ Crypto is volatile: risk only what you can afford to lose.
180
·
--
弱気相場
$GTC 今日の価格予測:Gitcoinの暗号資産シグナル&テクニカル分析 📊
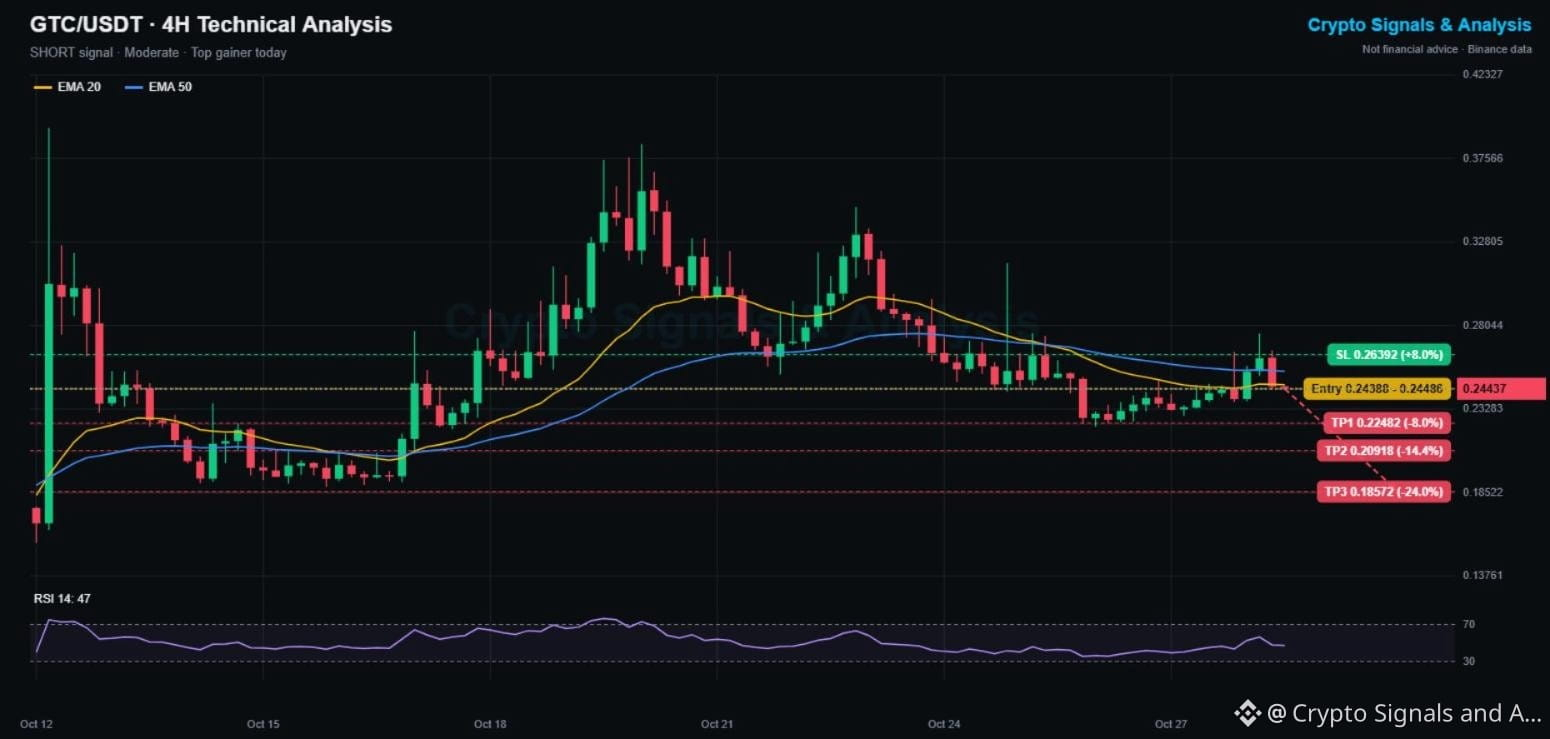
🔴 ショート | エントリー 0.2439 - 0.2449 | 利確1 0.2248 | 損切り 0.2639
👉 $GTC をタップして、すぐに取引
Gitcoinは今日早くに急騰して0.276をつけ、上昇率上位銘柄のリストに入りました。しかし、下降中の4時間足EMA50に達したところで、強い売りに押されました。長い上ヒゲと、その後に続いた陰線は、ブレイクアウト失敗の典型的なサインです。
📌 GITCOIN取引シグナル(中程度、ブレイクアウト失敗のセットアップ)
エントリー:0.2439 - 0.2449
利確1:0.2248 (-8%)
利確2:0.2092 (-14%)
利確3:0.1857 (-24%)
損切り:0.2639 (+8%)
📊 GTCテクニカル分析(4時間足チャート)
GTCは10月12日に0.393、10月20日に0.38の高値をつけました。それ以降、高値は0.34、0.31、そして現在の0.276と切り下がっています。価格はEMA20(0.2467)とEMA50(0.2544)を下回っています。RSIは47で中立です。10月26日の安値0.2227が重要なサポートです。
🔑 重要な水準
サポート:0.2227、その次は0.2090
レジスタンス:0.2544(EMA50)、その次は0.2758
📈 強気シナリオ:4時間足が0.2639およびEMA50を上回って確定すれば、ショートシナリオは無効になります。
📉 弱気シナリオ:0.2227を下回ると、利確2、さらに利確3まで下落する可能性があります。
💡 要点:上昇率上位銘柄のリストは、乗り遅れた買い手を罠にかけることがあります。このチャートは、上昇が売られたことを示しています。
👉 $GTC をタップ
してリアルタイムチャートを開きましょう。投資助言ではありません。
🔥 取引手数料を抑えて取引
✅ Binanceの取引手数料の20%が、永久に還元されます
👇👇👇
{spot}(GTCUSDT)
[Claim your 20% Binance fee kickback here](https://www.binance.com/register?ref=X0NQWZ4N)
━━━━━━━━━━
上昇率上位銘柄を追いかけますか?それとも押し目を待ちますか? 👇
毎日のシグナルを受け取るには、Crypto Signals and Analysisをフォローしてください。
#cryptosignals #GTC #CanMicrosoftDeliverOnAI
⚠️ 暗号資産は価格変動が大きいため、失っても差し支えない範囲でのみ投資してください。
$GTC 今日の価格予測:Gitcoinの暗号資産シグナル&テクニカル分析 📊
🔴 ショート | エントリー 0.2439 - 0.2449 | 利確1 0.2248 | 損切り 0.2639
👉 $GTC をタップして、すぐに取引
Gitcoinは今日早くに急騰して0.276をつけ、上昇率上位銘柄のリストに入りました。しかし、下降中の4時間足EMA50に達したところで、強い売りに押されました。長い上ヒゲと、その後に続いた陰線は、ブレイクアウト失敗の典型的なサインです。
📌 GITCOIN取引シグナル(中程度、ブレイクアウト失敗のセットアップ)
エントリー:0.2439 - 0.2449
利確1:0.2248 (-8%)
利確2:0.2092 (-14%)
利確3:0.1857 (-24%)
損切り:0.2639 (+8%)
📊 GTCテクニカル分析(4時間足チャート)
GTCは10月12日に0.393、10月20日に0.38の高値をつけました。それ以降、高値は0.34、0.31、そして現在の0.276と切り下がっています。価格はEMA20(0.2467)とEMA50(0.2544)を下回っています。RSIは47で中立です。10月26日の安値0.2227が重要なサポートです。
🔑 重要な水準
サポート:0.2227、その次は0.2090
レジスタンス:0.2544(EMA50)、その次は0.2758
📈 強気シナリオ:4時間足が0.2639およびEMA50を上回って確定すれば、ショートシナリオは無効になります。
📉 弱気シナリオ:0.2227を下回ると、利確2、さらに利確3まで下落する可能性があります。
💡 要点:上昇率上位銘柄のリストは、乗り遅れた買い手を罠にかけることがあります。このチャートは、上昇が売られたことを示しています。
👉 $GTC をタップ
してリアルタイムチャートを開きましょう。投資助言ではありません。
🔥 取引手数料を抑えて取引
✅ Binanceの取引手数料の20%が、永久に還元されます
👇👇👇
Claim your 20% Binance fee kickback here
━━━━━━━━━━
上昇率上位銘柄を追いかけますか?それとも押し目を待ちますか? 👇
毎日のシグナルを受け取るには、Crypto Signals and Analysisをフォローしてください。
#cryptosignals #GTC #CanMicrosoftDeliverOnAI
⚠️ 暗号資産は価格変動が大きいため、失っても差し支えない範囲でのみ投資してください。
206
·
--
ブリッシュ
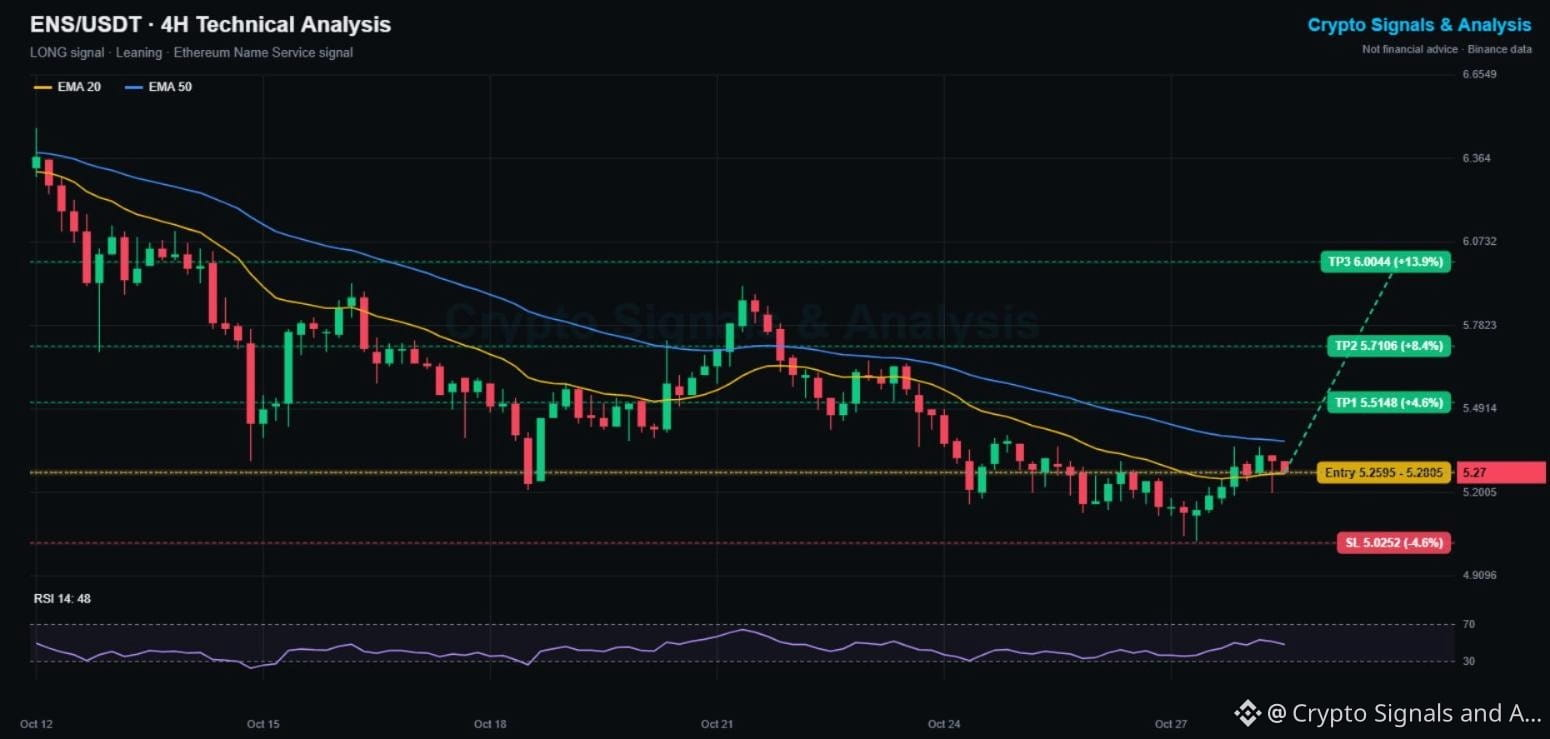
$ENS 本日の価格予測:イーサリアム・ネーム・サービスの暗号資産シグナル&テクニカル分析 📊
🟢 ロング | エントリー 5.260 - 5.281 | 利確1 5.515 | 損切り 5.025
👉 $ENS をタップして、すぐに取引を始めましょう
ENSは6.47から22%下落した後、5.03で底を打ち、直近3本のローソク足では安値が切り上がっています。価格は4時間足のEMA20を回復し、現在は押し戻されて再テスト中です。
📌 ENS 取引シグナル(初期的な反転 setup、慎重な見方)
エントリー:5.260 - 5.281
利確1:5.515(+4.6%)
利確2:5.711(+8.4%)
利確3:6.004(+13.9%)
損切り:5.025(-4.6%)
📊 ENS テクニカル分析(4時間足チャート)
EMA20(5.266)は上向き始めています。下降中のEMA50(5.379)が確認ラインで、10月12日以降、上昇するたびに価格を抑えてきました。RSIは48で中立です。5.38を上回って終値を付ければ、2週間以上ぶりにEMA50を突破することになります。
🔑 重要な価格水準
サポート:5.266(EMA20)、次に5.03
レジスタンス:5.379(EMA50)、次に5.51
📈 強気シナリオ:4時間足の終値が5.38を上回れば、反転が確認され、利確2・利確3が視野に入ります。
📉 弱気シナリオ:再びEMA50に阻まれれば、ENSは5.03まで戻る可能性があります。5.025を下回って終値を付けた場合、このシグナルは無効です。
💡 まとめ:底値の下にタイトな損切りを置いた、初期段階の反転シナリオです。取引の行方はEMA50が決めます。
👉 $ENS をタップ
してリアルタイムチャートを開きましょう。投資助言ではありません。
🔥 取引手数料を節約
✅ Binanceの取引手数料の20%が、ずっとキャッシュバック
👇👇👇
{spot}(ENSUSDT)
[Claim your 20% Binance fee kickback here](https://www.binance.com/register?ref=X0NQWZ4N)
━━━━━━━━━━
.ethネームをお持ちですか?下のコメントで教えてください 👇
毎日のシグナルをチェックするには、Crypto Signals and Analysisをフォローしてください。
#cryptosignals #ENS #EarningsSeason
⚠️ 暗号資産は価格変動が大きいため、失っても問題のない範囲でのみ投資してください。
$ENS 本日の価格予測:イーサリアム・ネーム・サービスの暗号資産シグナル&テクニカル分析 📊
🟢 ロング | エントリー 5.260 - 5.281 | 利確1 5.515 | 損切り 5.025
👉 $ENS をタップして、すぐに取引を始めましょう
ENSは6.47から22%下落した後、5.03で底を打ち、直近3本のローソク足では安値が切り上がっています。価格は4時間足のEMA20を回復し、現在は押し戻されて再テスト中です。
📌 ENS 取引シグナル(初期的な反転 setup、慎重な見方)
エントリー:5.260 - 5.281
利確1:5.515(+4.6%)
利確2:5.711(+8.4%)
利確3:6.004(+13.9%)
損切り:5.025(-4.6%)
📊 ENS テクニカル分析(4時間足チャート)
EMA20(5.266)は上向き始めています。下降中のEMA50(5.379)が確認ラインで、10月12日以降、上昇するたびに価格を抑えてきました。RSIは48で中立です。5.38を上回って終値を付ければ、2週間以上ぶりにEMA50を突破することになります。
🔑 重要な価格水準
サポート:5.266(EMA20)、次に5.03
レジスタンス:5.379(EMA50)、次に5.51
📈 強気シナリオ:4時間足の終値が5.38を上回れば、反転が確認され、利確2・利確3が視野に入ります。
📉 弱気シナリオ:再びEMA50に阻まれれば、ENSは5.03まで戻る可能性があります。5.025を下回って終値を付けた場合、このシグナルは無効です。
💡 まとめ:底値の下にタイトな損切りを置いた、初期段階の反転シナリオです。取引の行方はEMA50が決めます。
👉 $ENS をタップ
してリアルタイムチャートを開きましょう。投資助言ではありません。
🔥 取引手数料を節約
✅ Binanceの取引手数料の20%が、ずっとキャッシュバック
👇👇👇
Claim your 20% Binance fee kickback here
━━━━━━━━━━
.ethネームをお持ちですか?下のコメントで教えてください 👇
毎日のシグナルをチェックするには、Crypto Signals and Analysisをフォローしてください。
#cryptosignals #ENS #EarningsSeason
⚠️ 暗号資産は価格変動が大きいため、失っても問題のない範囲でのみ投資してください。
1
23
·
--
弱気相場
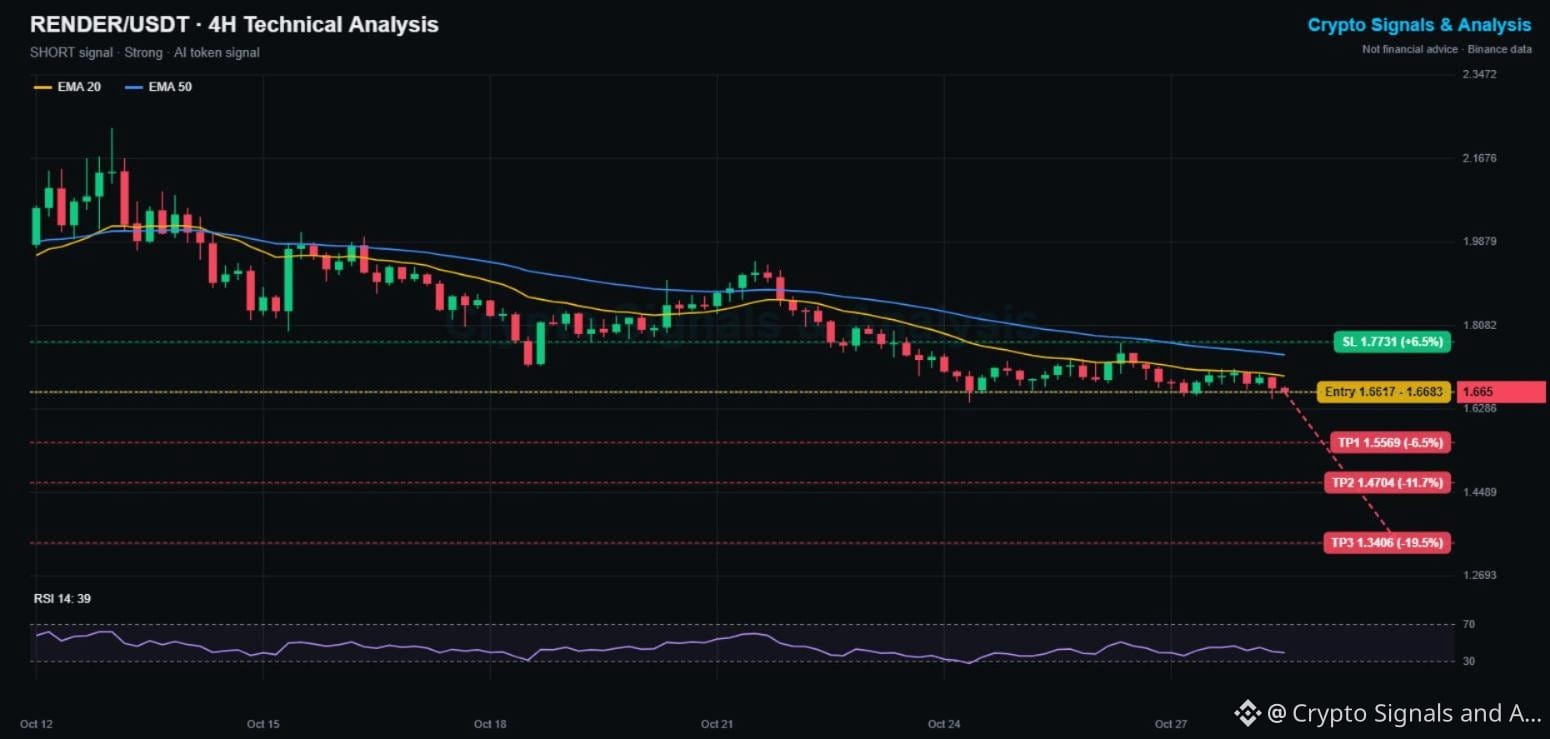
$RENDER 本日の価格予測:Renderの暗号資産シグナル&テクニカル分析 📊
🔴 ショート | エントリー 1.662 - 1.668 | TP1 1.557 | SL 1.773
👉 $RENDER をタップして、すぐに取引
AIおよびGPUコンピューティングのトークンであるRenderは、今週13%、10月13日以降25%下落しています(2.23から1.65へ)。今週の安値を更新したばかりで、4時間足のEMAが引き続き価格を押し下げています。
📌 RENDER取引シグナル(強気度:強、5つのシグナルすべてが一致)
エントリー:1.662 - 1.668
利確目標 1:1.557(-6.5%)
利確目標 2:1.470(-11.7%)
利確目標 3:1.341(-19.5%)
損切り:1.773(+6.5%)
📊 RENDERテクニカル分析(4時間足チャート)
価格はEMA20(1.700)とEMA50(1.745)を下回っており、どちらも下降中です。RSIは39で、売り手が優勢であることを示しています。1.643〜1.65のゾーンは、10月24日以来の最後のサポートです。ここを明確に下抜けると、1.50台まで目立った下値支持はありません。
🔑 重要水準
サポート:1.643、その次は1.557
レジスタンス:1.700(EMA20)、その次は1.771
📈 強気シナリオ:4時間足の終値が1.773を上回れば下降トレンドを突破し、ショートシナリオは無効になります。
📉 弱気シナリオ:1.643を下回って引けると、ブレイクダウンが確認され、TP1とTP2に向かう展開が見込まれます。
💡 要点:今週、AIトークンは最も弱いセクターであり、Renderのトレンドは明らかに下向きです。
👉 $RENDER をタップ
してリアルタイムチャートを開きましょう。投資助言ではありません。
🔥 手数料を抑えて取引
✅ Binanceの取引手数料の20%が、期限なしで還元されます
👇👇👇
{spot}(RENDERUSDT)
[Claim your 20% Binance fee kickback here](https://www.binance.com/register?ref=X0NQWZ4N)
━━━━━━━━━━
AI暗号資産の売り:買いの好機か、それとも警告サインか? 👇
毎日のシグナルをお届けするCrypto Signals and Analysisをフォローしてください。
#cryptosignals #RENDER #CanGoogleDefendItsCore
⚠️ 暗号資産は価格変動が激しいため、失っても問題のない範囲でのみ投資してください。
$RENDER 本日の価格予測:Renderの暗号資産シグナル&テクニカル分析 📊
🔴 ショート | エントリー 1.662 - 1.668 | TP1 1.557 | SL 1.773
👉 $RENDER をタップして、すぐに取引
AIおよびGPUコンピューティングのトークンであるRenderは、今週13%、10月13日以降25%下落しています(2.23から1.65へ)。今週の安値を更新したばかりで、4時間足のEMAが引き続き価格を押し下げています。
📌 RENDER取引シグナル(強気度:強、5つのシグナルすべてが一致)
エントリー:1.662 - 1.668
利確目標 1:1.557(-6.5%)
利確目標 2:1.470(-11.7%)
利確目標 3:1.341(-19.5%)
損切り:1.773(+6.5%)
📊 RENDERテクニカル分析(4時間足チャート)
価格はEMA20(1.700)とEMA50(1.745)を下回っており、どちらも下降中です。RSIは39で、売り手が優勢であることを示しています。1.643〜1.65のゾーンは、10月24日以来の最後のサポートです。ここを明確に下抜けると、1.50台まで目立った下値支持はありません。
🔑 重要水準
サポート:1.643、その次は1.557
レジスタンス:1.700(EMA20)、その次は1.771
📈 強気シナリオ:4時間足の終値が1.773を上回れば下降トレンドを突破し、ショートシナリオは無効になります。
📉 弱気シナリオ:1.643を下回って引けると、ブレイクダウンが確認され、TP1とTP2に向かう展開が見込まれます。
💡 要点:今週、AIトークンは最も弱いセクターであり、Renderのトレンドは明らかに下向きです。
👉 $RENDER をタップ
してリアルタイムチャートを開きましょう。投資助言ではありません。
🔥 手数料を抑えて取引
✅ Binanceの取引手数料の20%が、期限なしで還元されます
👇👇👇
Claim your 20% Binance fee kickback here
━━━━━━━━━━
AI暗号資産の売り:買いの好機か、それとも警告サインか? 👇
毎日のシグナルをお届けするCrypto Signals and Analysisをフォローしてください。
#cryptosignals #RENDER #CanGoogleDefendItsCore
⚠️ 暗号資産は価格変動が激しいため、失っても問題のない範囲でのみ投資してください。
29
·
--
ブリッシュ
翻訳参照
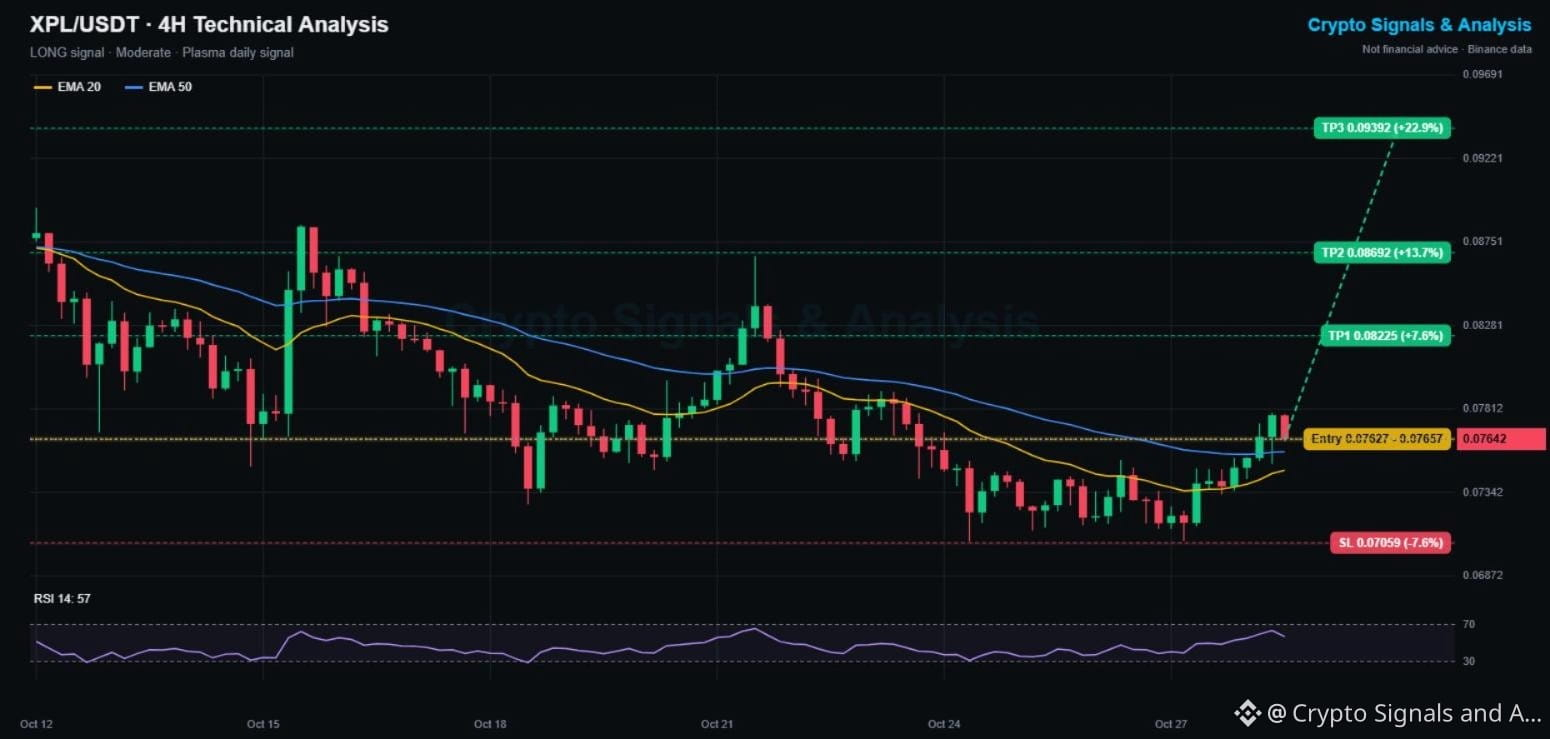
$XPL Price Prediction Today: Plasma Crypto Signal & Technical Analysis 📊
🟢 LONG | Entry 0.07627 - 0.07657 | TP1 0.08225 | SL 0.07059
👉 Tap $XPL to place your trade fast
Plasma, the stablecoin-focused blockchain, is up 3.2% today and just broke above its 4H EMA50 for the first time since Oct 22. It held a double bottom at 0.0707 and is now turning the trend.
📌 PLASMA TRADING SIGNAL (Moderate, 4/5 signals agree)
Entry: 0.07627 - 0.07657
Take profit 1: 0.08225 (+7.6%)
Take profit 2: 0.08692 (+13.7%)
Take profit 3: 0.09392 (+22.9%)
Stop loss: 0.07059 (-7.6%)
📊 XPL TECHNICAL ANALYSIS (4H CHART)
Price is above the EMA20 (0.0747) and EMA50 (0.0757), and the EMA20 is curling up for a bullish cross. RSI at 57 favors buyers. The 0.0779 recent high is the first test. Above it, the Oct 21 spike zone at 0.082 to 0.087 is the main target.
🔑 KEY LEVELS
Support: 0.0757 (EMA50), then 0.0707
Resistance: 0.0779, then 0.0822
📈 Bullish scenario: a 4H close above 0.0779 confirms the breakout and targets TP1 and TP2.
📉 Bearish scenario: losing the EMA50 makes this a fakeout. A close under 0.07059 cancels this signal.
💡 Bottom line: a double bottom plus an EMA50 reclaim is a solid early-trend setup.
👉 Tap $XPL
to open the live chart. NFA
🔥 TRADE WITH LOWER FEES
✅ Get a 20% kickback on your Binance trading fees, for life
👇👇👇
{spot}(XPLUSDT)
[Claim your 20% Binance fee kickback here](https://www.binance.com/register?ref=X0NQWZ4N)
━━━━━━━━━━
Stablecoin chains: the next big narrative? What do you think 👇
Follow Crypto Signals and Analysis for daily signals.
#cryptosignals #XPL #EarningsSeason
⚠️ Crypto is volatile: risk only what you can afford to lose.
$XPL Price Prediction Today: Plasma Crypto Signal & Technical Analysis 📊
🟢 LONG | Entry 0.07627 - 0.07657 | TP1 0.08225 | SL 0.07059
👉 Tap $XPL to place your trade fast
Plasma, the stablecoin-focused blockchain, is up 3.2% today and just broke above its 4H EMA50 for the first time since Oct 22. It held a double bottom at 0.0707 and is now turning the trend.
📌 PLASMA TRADING SIGNAL (Moderate, 4/5 signals agree)
Entry: 0.07627 - 0.07657
Take profit 1: 0.08225 (+7.6%)
Take profit 2: 0.08692 (+13.7%)
Take profit 3: 0.09392 (+22.9%)
Stop loss: 0.07059 (-7.6%)
📊 XPL TECHNICAL ANALYSIS (4H CHART)
Price is above the EMA20 (0.0747) and EMA50 (0.0757), and the EMA20 is curling up for a bullish cross. RSI at 57 favors buyers. The 0.0779 recent high is the first test. Above it, the Oct 21 spike zone at 0.082 to 0.087 is the main target.
🔑 KEY LEVELS
Support: 0.0757 (EMA50), then 0.0707
Resistance: 0.0779, then 0.0822
📈 Bullish scenario: a 4H close above 0.0779 confirms the breakout and targets TP1 and TP2.
📉 Bearish scenario: losing the EMA50 makes this a fakeout. A close under 0.07059 cancels this signal.
💡 Bottom line: a double bottom plus an EMA50 reclaim is a solid early-trend setup.
👉 Tap $XPL
to open the live chart. NFA
🔥 TRADE WITH LOWER FEES
✅ Get a 20% kickback on your Binance trading fees, for life
👇👇👇
Claim your 20% Binance fee kickback here
━━━━━━━━━━
Stablecoin chains: the next big narrative? What do you think 👇
Follow Crypto Signals and Analysis for daily signals.
#cryptosignals #XPL #EarningsSeason
⚠️ Crypto is volatile: risk only what you can afford to lose.
162
·
--
ブリッシュ
翻訳参照
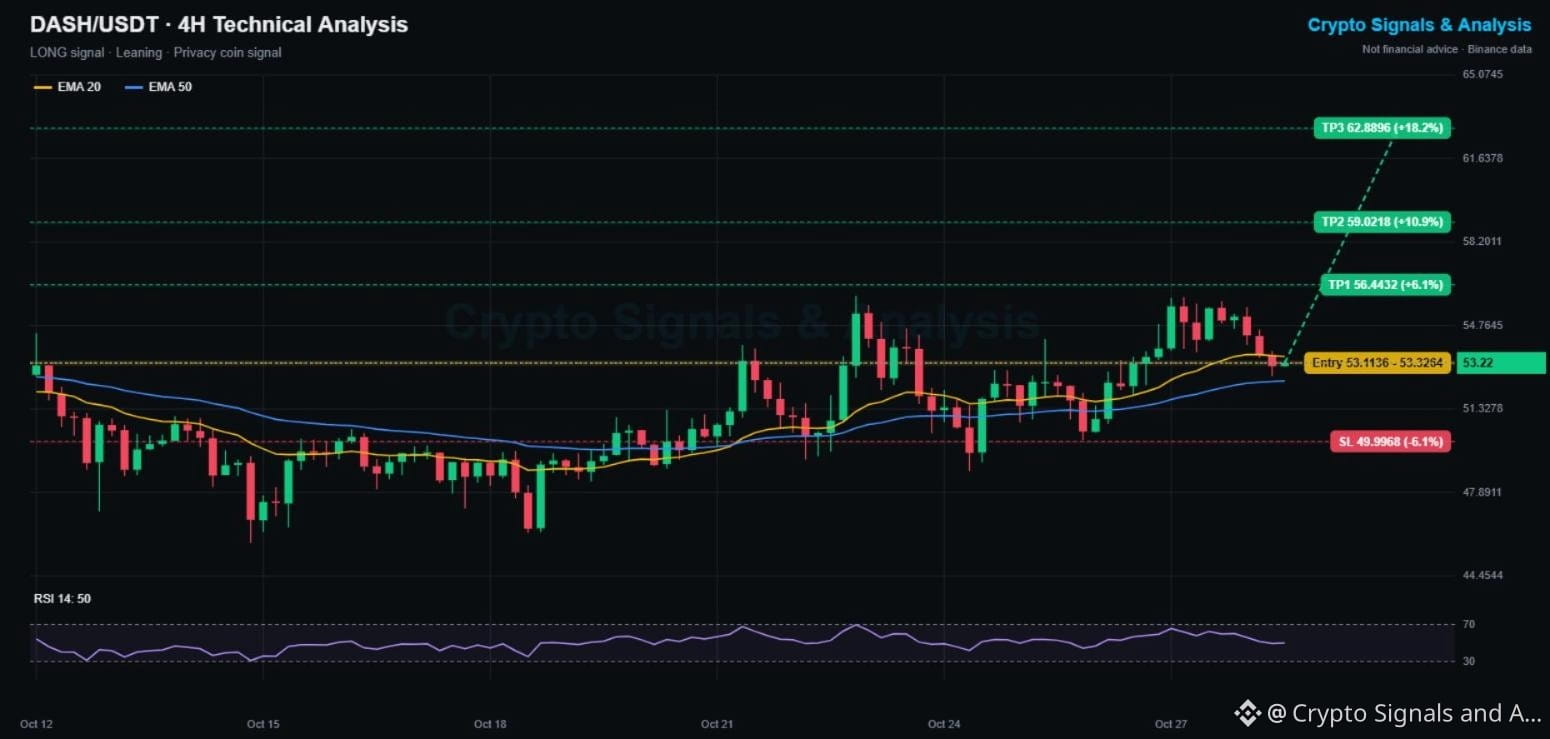
$DASH Price Prediction Today: Dash Crypto Signal & Technical Analysis 📊
🟢 LONG | Entry 53.11 - 53.33 | TP1 56.44 | SL 50.00
👉 Tap $DASH to place your trade fast
Dash, like Zcash, is one of the few coins in an uptrend this month, with higher lows since Oct 19 (45.8, then 49.0, then 50.0). After a 4% pullback today, it is sitting right on its rising 4H EMA50, a classic buy-the-dip zone.
📌 DASH TRADING SIGNAL (Leaning, pullback in an uptrend)
Entry: 53.11 - 53.33
Take profit 1: 56.44 (+6.1%)
Take profit 2: 59.02 (+10.9%)
Take profit 3: 62.89 (+18.2%)
Stop loss: 50.00 (-6.1%)
📊 DASH TECHNICAL ANALYSIS (4H CHART)
The bigger trend is up: the EMA50 (52.49) is rising, and price has stayed above it since Oct 21. The short-term dip took price just under the EMA20 (53.49), and RSI reset to 50. The 55.9 high (double top area) is the key breakout level.
🔑 KEY LEVELS
Support: 52.49 (EMA50), then 50.06
Resistance: 53.49 (EMA20), then 55.92
📈 Bullish scenario: a bounce from the EMA50 and a close above 55.9 opens TP2 and TP3.
📉 Bearish scenario: losing the EMA50 means the uptrend is in trouble. A close under 50.00 cancels this signal.
💡 Bottom line: privacy coins are outperforming this month. This is a dip-buy in an uptrend, with a clear stop.
👉 Tap $DASH
to open the live chart. NFA
🔥 TRADE WITH LOWER FEES
✅ Get a 20% kickback on your Binance trading fees, for life
👇👇👇
{spot}(DASHUSDT)
[Claim your 20% Binance fee kickback here](https://www.binance.com/register?ref=X0NQWZ4N)
━━━━━━━━━━
Zcash or Dash: which privacy coin is your pick? 👇
Follow Crypto Signals and Analysis for daily signals.
#cryptosignals #DASH #CanGoogleDefendItsCore
⚠️ Crypto is volatile: risk only what you can afford to lose.
$DASH Price Prediction Today: Dash Crypto Signal & Technical Analysis 📊
🟢 LONG | Entry 53.11 - 53.33 | TP1 56.44 | SL 50.00
👉 Tap $DASH to place your trade fast
Dash, like Zcash, is one of the few coins in an uptrend this month, with higher lows since Oct 19 (45.8, then 49.0, then 50.0). After a 4% pullback today, it is sitting right on its rising 4H EMA50, a classic buy-the-dip zone.
📌 DASH TRADING SIGNAL (Leaning, pullback in an uptrend)
Entry: 53.11 - 53.33
Take profit 1: 56.44 (+6.1%)
Take profit 2: 59.02 (+10.9%)
Take profit 3: 62.89 (+18.2%)
Stop loss: 50.00 (-6.1%)
📊 DASH TECHNICAL ANALYSIS (4H CHART)
The bigger trend is up: the EMA50 (52.49) is rising, and price has stayed above it since Oct 21. The short-term dip took price just under the EMA20 (53.49), and RSI reset to 50. The 55.9 high (double top area) is the key breakout level.
🔑 KEY LEVELS
Support: 52.49 (EMA50), then 50.06
Resistance: 53.49 (EMA20), then 55.92
📈 Bullish scenario: a bounce from the EMA50 and a close above 55.9 opens TP2 and TP3.
📉 Bearish scenario: losing the EMA50 means the uptrend is in trouble. A close under 50.00 cancels this signal.
💡 Bottom line: privacy coins are outperforming this month. This is a dip-buy in an uptrend, with a clear stop.
👉 Tap $DASH
to open the live chart. NFA
🔥 TRADE WITH LOWER FEES
✅ Get a 20% kickback on your Binance trading fees, for life
👇👇👇
Claim your 20% Binance fee kickback here
━━━━━━━━━━
Zcash or Dash: which privacy coin is your pick? 👇
Follow Crypto Signals and Analysis for daily signals.
#cryptosignals #DASH #CanGoogleDefendItsCore
⚠️ Crypto is volatile: risk only what you can afford to lose.
141
·
--
ブリッシュ
翻訳参照
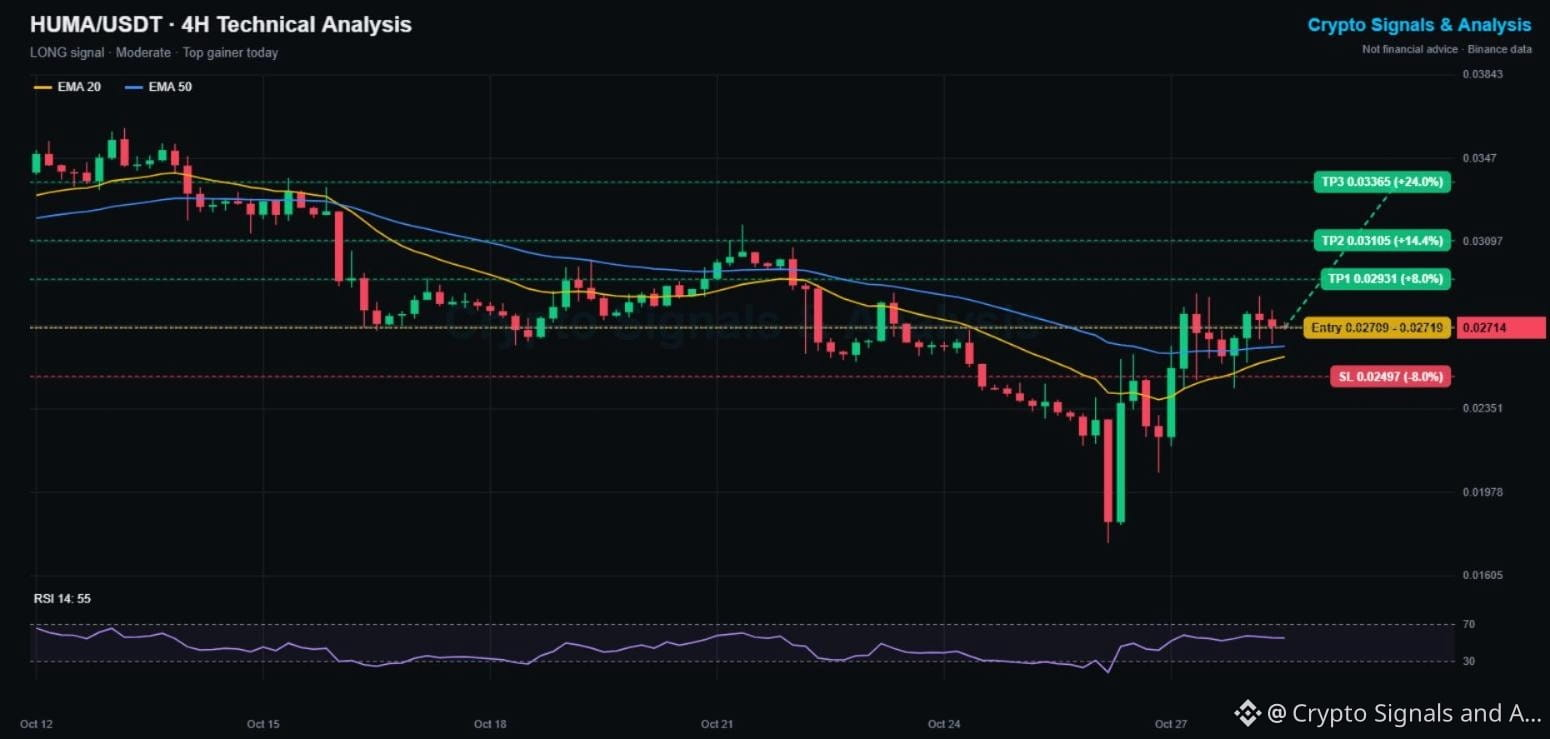
$HUMA Price Prediction Today: Huma Finance Crypto Signal & Technical Analysis 📊
🟢 LONG | Entry 0.02709 - 0.02719 | TP1 0.02931 | SL 0.02497
👉 Tap $HUMA to place your trade fast
Huma Finance printed a sharp V-bottom: a flush to 0.0175 on Oct 26, then a 55% rebound to 0.027. Price has now reclaimed both 4H EMAs and is holding above them, which shows buyers absorbing the dips.
📌 HUMA TRADING SIGNAL (Moderate, 4/5 signals agree)
Entry: 0.02709 - 0.02719
Take profit 1: 0.02931 (+8%)
Take profit 2: 0.03105 (+14%)
Take profit 3: 0.03365 (+24%)
Stop loss: 0.02497 (-8%)
📊 HUMA TECHNICAL ANALYSIS (4H CHART)
The EMA20 (0.0259) is rising toward a bullish cross with the EMA50 (0.0263). RSI at 55 has room to run. The 0.0287 high is the first barrier, and above it the Oct 21 high around 0.031 lines up with TP2.
🔑 KEY LEVELS
Support: 0.0263 (EMA50), then 0.0250
Resistance: 0.0287, then 0.0310
📈 Bullish scenario: a 4H close above 0.0287 confirms the reversal and opens TP2 and TP3.
📉 Bearish scenario: losing the EMAs sends HUMA back toward the 0.023 zone. A close under 0.02497 cancels this signal.
💡 Bottom line: V-bottoms are powerful when they hold. Keep the stop under the EMAs.
👉 Tap $HUMA
to open the live chart. NFA
🔥 TRADE WITH LOWER FEES
✅ Get a 20% kickback on your Binance trading fees, for life
👇👇👇
{spot}(HUMAUSDT)
[Claim your 20% Binance fee kickback here](https://www.binance.com/register?ref=X0NQWZ4N)
━━━━━━━━━━
Did you catch the Huma bounce, or are you waiting for a dip? 👇
Follow Crypto Signals and Analysis for daily signals.
#cryptosignals #HUMA #CanMicrosoftDeliverOnAI
⚠️ Crypto is volatile: risk only what you can afford to lose.
$HUMA Price Prediction Today: Huma Finance Crypto Signal & Technical Analysis 📊
🟢 LONG | Entry 0.02709 - 0.02719 | TP1 0.02931 | SL 0.02497
👉 Tap $HUMA to place your trade fast
Huma Finance printed a sharp V-bottom: a flush to 0.0175 on Oct 26, then a 55% rebound to 0.027. Price has now reclaimed both 4H EMAs and is holding above them, which shows buyers absorbing the dips.
📌 HUMA TRADING SIGNAL (Moderate, 4/5 signals agree)
Entry: 0.02709 - 0.02719
Take profit 1: 0.02931 (+8%)
Take profit 2: 0.03105 (+14%)
Take profit 3: 0.03365 (+24%)
Stop loss: 0.02497 (-8%)
📊 HUMA TECHNICAL ANALYSIS (4H CHART)
The EMA20 (0.0259) is rising toward a bullish cross with the EMA50 (0.0263). RSI at 55 has room to run. The 0.0287 high is the first barrier, and above it the Oct 21 high around 0.031 lines up with TP2.
🔑 KEY LEVELS
Support: 0.0263 (EMA50), then 0.0250
Resistance: 0.0287, then 0.0310
📈 Bullish scenario: a 4H close above 0.0287 confirms the reversal and opens TP2 and TP3.
📉 Bearish scenario: losing the EMAs sends HUMA back toward the 0.023 zone. A close under 0.02497 cancels this signal.
💡 Bottom line: V-bottoms are powerful when they hold. Keep the stop under the EMAs.
👉 Tap $HUMA
to open the live chart. NFA
🔥 TRADE WITH LOWER FEES
✅ Get a 20% kickback on your Binance trading fees, for life
👇👇👇
Claim your 20% Binance fee kickback here
━━━━━━━━━━
Did you catch the Huma bounce, or are you waiting for a dip? 👇
Follow Crypto Signals and Analysis for daily signals.
#cryptosignals #HUMA #CanMicrosoftDeliverOnAI
⚠️ Crypto is volatile: risk only what you can afford to lose.
38
·
--
弱気相場
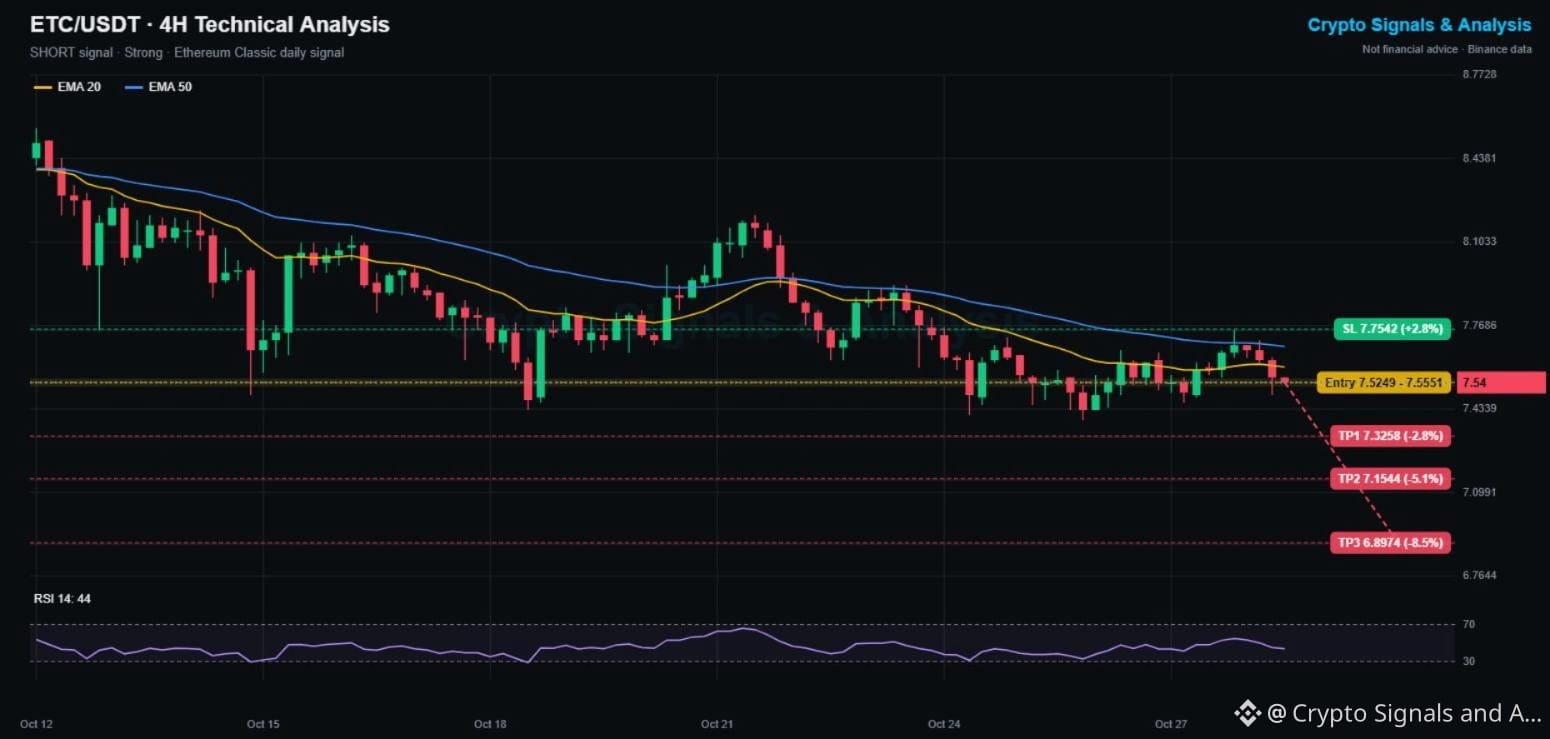
$ETC 本日の価格予測:イーサリアムクラシックの暗号資産シグナル&テクニカル分析 📊
🔴 ショート | エントリー 7.525 - 7.555 | TP1 7.326 | SL 7.754
👉 $ETC をタップして、すぐに取引を開始
イーサリアムクラシックは昨日、下降中の4時間足EMA50(7.75)を試しましたが、再び上値を抑えられました。現在は両方のEMAを下回り、週間安値の7.39に向かっています。週間では7.6%下落しています。
📌 イーサリアムクラシック取引シグナル(強気、5/5のシグナルが一致)
エントリー:7.525 - 7.555
利確目標1:7.326 (-2.8%)
利確目標2:7.154 (-5.1%)
利確目標3:6.897 (-8.5%)
損切り:7.754 (+2.8%)
📊 ETCテクニカル分析(4時間足チャート)
ETCは10月12日以降、8.56から7.39まで下落し、8.2、7.9、7.75と高値を切り下げています。EMA20(7.60)とEMA50(7.68)は下降しており、上値抵抗として機能しています。RSIは44で、弱気に傾いています。7.39を下抜けると、7.0付近が視野に入ります。
🔑 重要な価格水準
サポート:7.39、次に7.15
レジスタンス:7.60(EMA20)、次に7.75
📈 強気シナリオ:4時間足が7.754を上回って確定すれば、高値切り下げのパターンが崩れ、ショートシナリオは無効になります。
📉 弱気シナリオ:7.39を下回って終値をつけると、TP2とTP3が視野に入ります。
💡 要点:高値の切り下げと下降中のEMAは、トレンドが下向きであることを示しています。7.6〜7.7付近への戻りをショート。
👉 $ETC をタップ
してリアルタイムチャートを開きましょう。NFA
🔥 取引手数料を抑えてトレード
✅ Binanceの取引手数料の20%が、生涯にわたってキャッシュバック
👇👇👇
{spot}(ETCUSDT)
[Claim your 20% Binance fee kickback here](https://www.binance.com/register?ref=X0NQWZ4N)
━━━━━━━━━━
イーサリアムクラシックは、先に7、それとも8.5?下の投票で回答してください 👇
毎日のシグナルを受け取るには、Crypto Signals and Analysisをフォローしてください。
#cryptosignals #ETC #CanGoogleDefendItsCore
⚠️ 暗号資産は価格変動が激しいため、失っても問題のない金額のみを投資してください。
$ETC 本日の価格予測:イーサリアムクラシックの暗号資産シグナル&テクニカル分析 📊
🔴 ショート | エントリー 7.525 - 7.555 | TP1 7.326 | SL 7.754
👉 $ETC をタップして、すぐに取引を開始
イーサリアムクラシックは昨日、下降中の4時間足EMA50(7.75)を試しましたが、再び上値を抑えられました。現在は両方のEMAを下回り、週間安値の7.39に向かっています。週間では7.6%下落しています。
📌 イーサリアムクラシック取引シグナル(強気、5/5のシグナルが一致)
エントリー:7.525 - 7.555
利確目標1:7.326 (-2.8%)
利確目標2:7.154 (-5.1%)
利確目標3:6.897 (-8.5%)
損切り:7.754 (+2.8%)
📊 ETCテクニカル分析(4時間足チャート)
ETCは10月12日以降、8.56から7.39まで下落し、8.2、7.9、7.75と高値を切り下げています。EMA20(7.60)とEMA50(7.68)は下降しており、上値抵抗として機能しています。RSIは44で、弱気に傾いています。7.39を下抜けると、7.0付近が視野に入ります。
🔑 重要な価格水準
サポート:7.39、次に7.15
レジスタンス:7.60(EMA20)、次に7.75
📈 強気シナリオ:4時間足が7.754を上回って確定すれば、高値切り下げのパターンが崩れ、ショートシナリオは無効になります。
📉 弱気シナリオ:7.39を下回って終値をつけると、TP2とTP3が視野に入ります。
💡 要点:高値の切り下げと下降中のEMAは、トレンドが下向きであることを示しています。7.6〜7.7付近への戻りをショート。
👉 $ETC をタップ
してリアルタイムチャートを開きましょう。NFA
🔥 取引手数料を抑えてトレード
✅ Binanceの取引手数料の20%が、生涯にわたってキャッシュバック
👇👇👇
Claim your 20% Binance fee kickback here
━━━━━━━━━━
イーサリアムクラシックは、先に7、それとも8.5?下の投票で回答してください 👇
毎日のシグナルを受け取るには、Crypto Signals and Analysisをフォローしてください。
#cryptosignals #ETC #CanGoogleDefendItsCore
⚠️ 暗号資産は価格変動が激しいため、失っても問題のない金額のみを投資してください。
5
·
--
ブリッシュ
翻訳参照
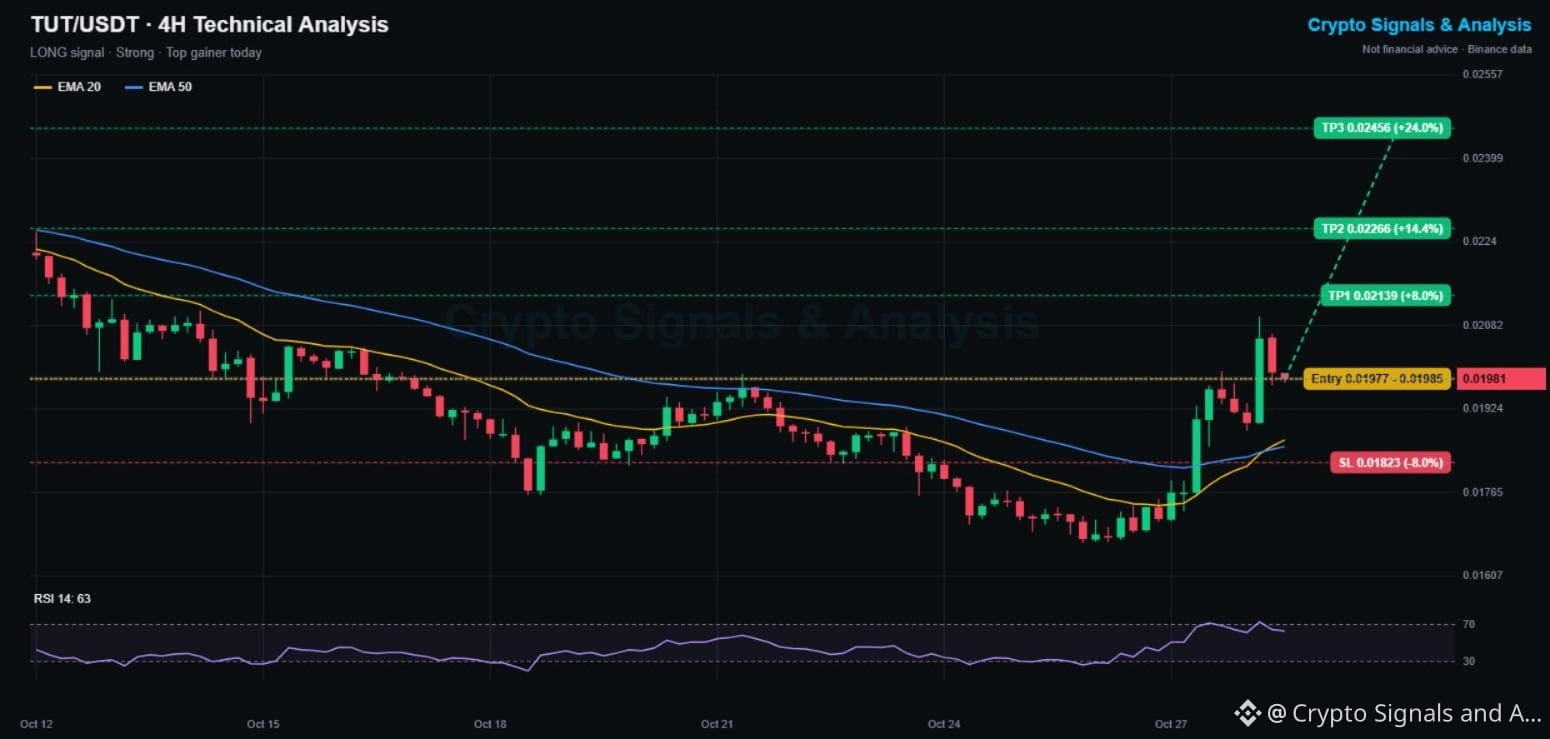
$TUT Price Prediction Today: Tutorial Token Crypto Signal & Technical Analysis 📊
🟢 LONG | Entry 0.01977 - 0.01985 | TP1 0.02139 | SL 0.01823
👉 Tap $TUT to place your trade fast
TUT, the BNB Chain meme coin, was one of today's top gainers. It bounced 25% off the 0.0167 low, broke above both 4H EMAs, and the EMA20 has just crossed above the EMA50: a fresh bullish cross.
📌 TUT TRADING SIGNAL (Strong, 5/5 signals agree)
Entry: 0.01977 - 0.01985
Take profit 1: 0.02139 (+8%)
Take profit 2: 0.02266 (+14%)
Take profit 3: 0.02456 (+24%)
Stop loss: 0.01823 (-8%)
📊 TUT TECHNICAL ANALYSIS (4H CHART)
Price holds well above the EMA20 (0.01865) and EMA50 (0.01852). RSI at 63 is strong but has cooled from 70. The spike to 0.0210 was partly sold, so a small pullback toward 0.0193 is possible before the next push. The Oct 12 high at 0.0226 is the main upside target.
🔑 KEY LEVELS
Support: 0.0193, then 0.01865 (EMA20)
Resistance: 0.0210, then 0.0226
📈 Bullish scenario: a 4H close above 0.0210 opens TP2 at the Oct 12 high.
📉 Bearish scenario: losing the EMAs makes this a failed breakout. A close under 0.01823 cancels this signal.
💡 Bottom line: a fresh trend change on a volatile meme coin. Small size, and take partial profit at TP1.
👉 Tap $TUT
to open the live chart. NFA
🔥 TRADE WITH LOWER FEES
✅ Get a 20% kickback on your Binance trading fees, for life
👇👇👇
{spot}(TUTUSDT)
[Claim your 20% Binance fee kickback here](https://www.binance.com/register?ref=X0NQWZ4N)
━━━━━━━━━━
BNB Chain memes are waking up. Which one are you watching? 👇
Follow Crypto Signals and Analysis for daily signals.
#cryptosignals #TUT #EarningsSeason
⚠️ Crypto is volatile: risk only what you can afford to lose.
$TUT Price Prediction Today: Tutorial Token Crypto Signal & Technical Analysis 📊
🟢 LONG | Entry 0.01977 - 0.01985 | TP1 0.02139 | SL 0.01823
👉 Tap $TUT to place your trade fast
TUT, the BNB Chain meme coin, was one of today's top gainers. It bounced 25% off the 0.0167 low, broke above both 4H EMAs, and the EMA20 has just crossed above the EMA50: a fresh bullish cross.
📌 TUT TRADING SIGNAL (Strong, 5/5 signals agree)
Entry: 0.01977 - 0.01985
Take profit 1: 0.02139 (+8%)
Take profit 2: 0.02266 (+14%)
Take profit 3: 0.02456 (+24%)
Stop loss: 0.01823 (-8%)
📊 TUT TECHNICAL ANALYSIS (4H CHART)
Price holds well above the EMA20 (0.01865) and EMA50 (0.01852). RSI at 63 is strong but has cooled from 70. The spike to 0.0210 was partly sold, so a small pullback toward 0.0193 is possible before the next push. The Oct 12 high at 0.0226 is the main upside target.
🔑 KEY LEVELS
Support: 0.0193, then 0.01865 (EMA20)
Resistance: 0.0210, then 0.0226
📈 Bullish scenario: a 4H close above 0.0210 opens TP2 at the Oct 12 high.
📉 Bearish scenario: losing the EMAs makes this a failed breakout. A close under 0.01823 cancels this signal.
💡 Bottom line: a fresh trend change on a volatile meme coin. Small size, and take partial profit at TP1.
👉 Tap $TUT
to open the live chart. NFA
🔥 TRADE WITH LOWER FEES
✅ Get a 20% kickback on your Binance trading fees, for life
👇👇👇
Claim your 20% Binance fee kickback here
━━━━━━━━━━
BNB Chain memes are waking up. Which one are you watching? 👇
Follow Crypto Signals and Analysis for daily signals.
#cryptosignals #TUT #EarningsSeason
⚠️ Crypto is volatile: risk only what you can afford to lose.
123
·
--
弱気相場
翻訳参照
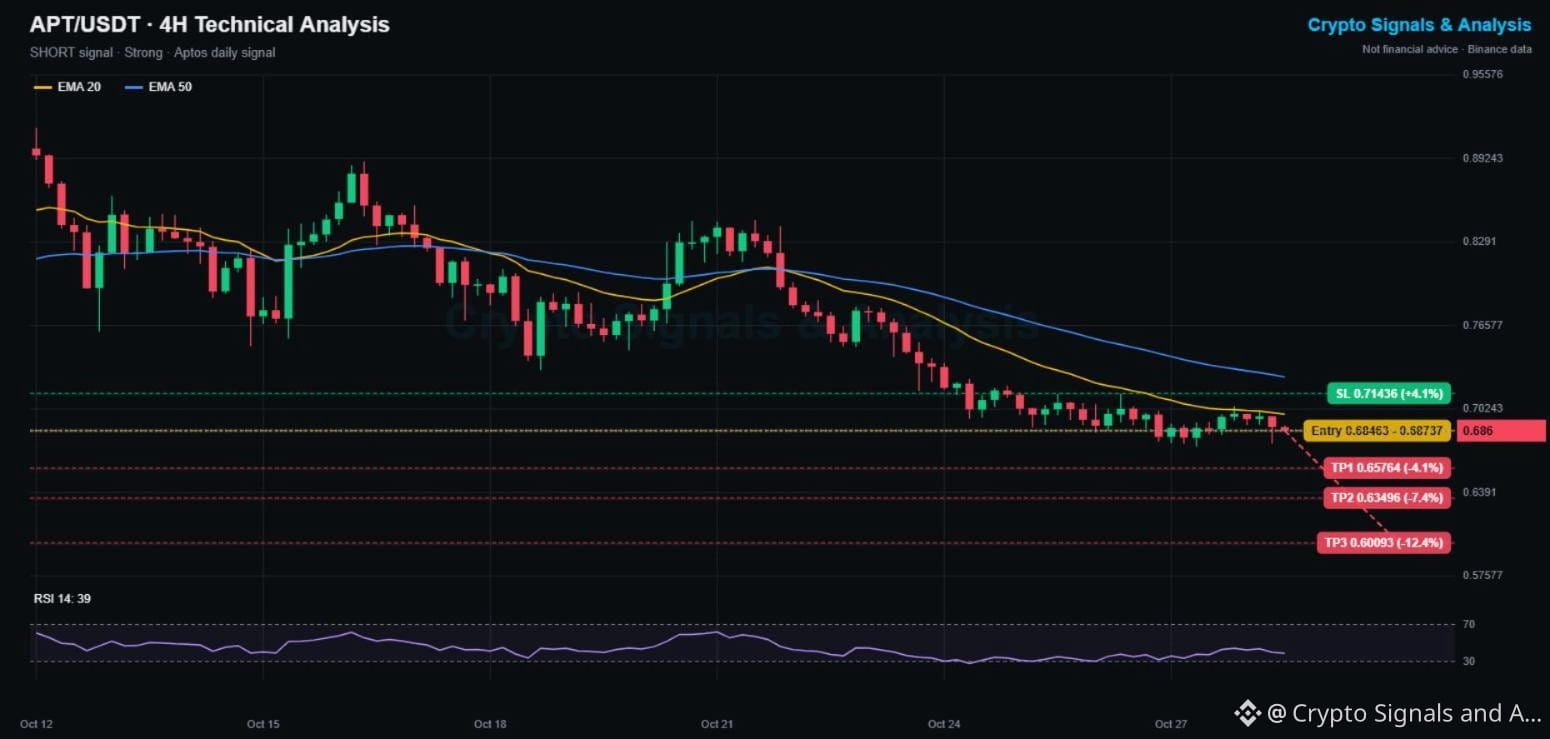
$APT Price Prediction Today: Aptos Crypto Signal & Technical Analysis 📊
🔴 SHORT | Entry 0.6846 - 0.6874 | TP1 0.6576 | SL 0.7144
👉 Tap $APT to place your trade fast
Aptos is down 17% this week and 25% since Oct 12, from 0.92 to 0.674. It has spent 4 days pinned under the falling 4H EMA20, and every small bounce is getting sold.
📌 APTOS TRADING SIGNAL (Strong, 5/5 signals agree)
Entry: 0.6846 - 0.6874
Take profit 1: 0.6576 (-4.1%)
Take profit 2: 0.6350 (-7.4%)
Take profit 3: 0.6009 (-12.4%)
Stop loss: 0.7144 (+4.1%)
📊 APT TECHNICAL ANALYSIS (4H CHART)
All the trend signals point down: price is under the EMA20 (0.6984) and EMA50 (0.7268), both are sloping lower, and RSI at 39 shows weak demand. The 0.674 low is the only nearby support. Once it gives way, there is no structure until the low 0.60s.
🔑 KEY LEVELS
Support: 0.674, then 0.635
Resistance: 0.698 (EMA20), then 0.714
📈 Bullish scenario: a 4H close above 0.7144 reclaims the EMA zone and cancels the short.
📉 Bearish scenario: losing 0.674 opens TP2 and TP3.
💡 Bottom line: Aptos is one of the weakest layer 1 charts right now. Trend followers stay short under the EMAs.
👉 Tap $APT
to open the live chart. NFA
🔥 TRADE WITH LOWER FEES
✅ Get a 20% kickback on your Binance trading fees, for life
👇👇👇
{spot}(APTUSDT)
[Claim your 20% Binance fee kickback here](https://www.binance.com/register?ref=X0NQWZ4N)
━━━━━━━━━━
Aptos or Sui: which Move chain recovers first? 👇
Follow Crypto Signals and Analysis for daily signals.
#cryptosignals #APT #CanMicrosoftDeliverOnAI
⚠️ Crypto is volatile: risk only what you can afford to lose.
$APT Price Prediction Today: Aptos Crypto Signal & Technical Analysis 📊
🔴 SHORT | Entry 0.6846 - 0.6874 | TP1 0.6576 | SL 0.7144
👉 Tap $APT to place your trade fast
Aptos is down 17% this week and 25% since Oct 12, from 0.92 to 0.674. It has spent 4 days pinned under the falling 4H EMA20, and every small bounce is getting sold.
📌 APTOS TRADING SIGNAL (Strong, 5/5 signals agree)
Entry: 0.6846 - 0.6874
Take profit 1: 0.6576 (-4.1%)
Take profit 2: 0.6350 (-7.4%)
Take profit 3: 0.6009 (-12.4%)
Stop loss: 0.7144 (+4.1%)
📊 APT TECHNICAL ANALYSIS (4H CHART)
All the trend signals point down: price is under the EMA20 (0.6984) and EMA50 (0.7268), both are sloping lower, and RSI at 39 shows weak demand. The 0.674 low is the only nearby support. Once it gives way, there is no structure until the low 0.60s.
🔑 KEY LEVELS
Support: 0.674, then 0.635
Resistance: 0.698 (EMA20), then 0.714
📈 Bullish scenario: a 4H close above 0.7144 reclaims the EMA zone and cancels the short.
📉 Bearish scenario: losing 0.674 opens TP2 and TP3.
💡 Bottom line: Aptos is one of the weakest layer 1 charts right now. Trend followers stay short under the EMAs.
👉 Tap $APT
to open the live chart. NFA
🔥 TRADE WITH LOWER FEES
✅ Get a 20% kickback on your Binance trading fees, for life
👇👇👇
Claim your 20% Binance fee kickback here
━━━━━━━━━━
Aptos or Sui: which Move chain recovers first? 👇
Follow Crypto Signals and Analysis for daily signals.
#cryptosignals #APT #CanMicrosoftDeliverOnAI
⚠️ Crypto is volatile: risk only what you can afford to lose.
154
·
--
ブリッシュ
翻訳参照
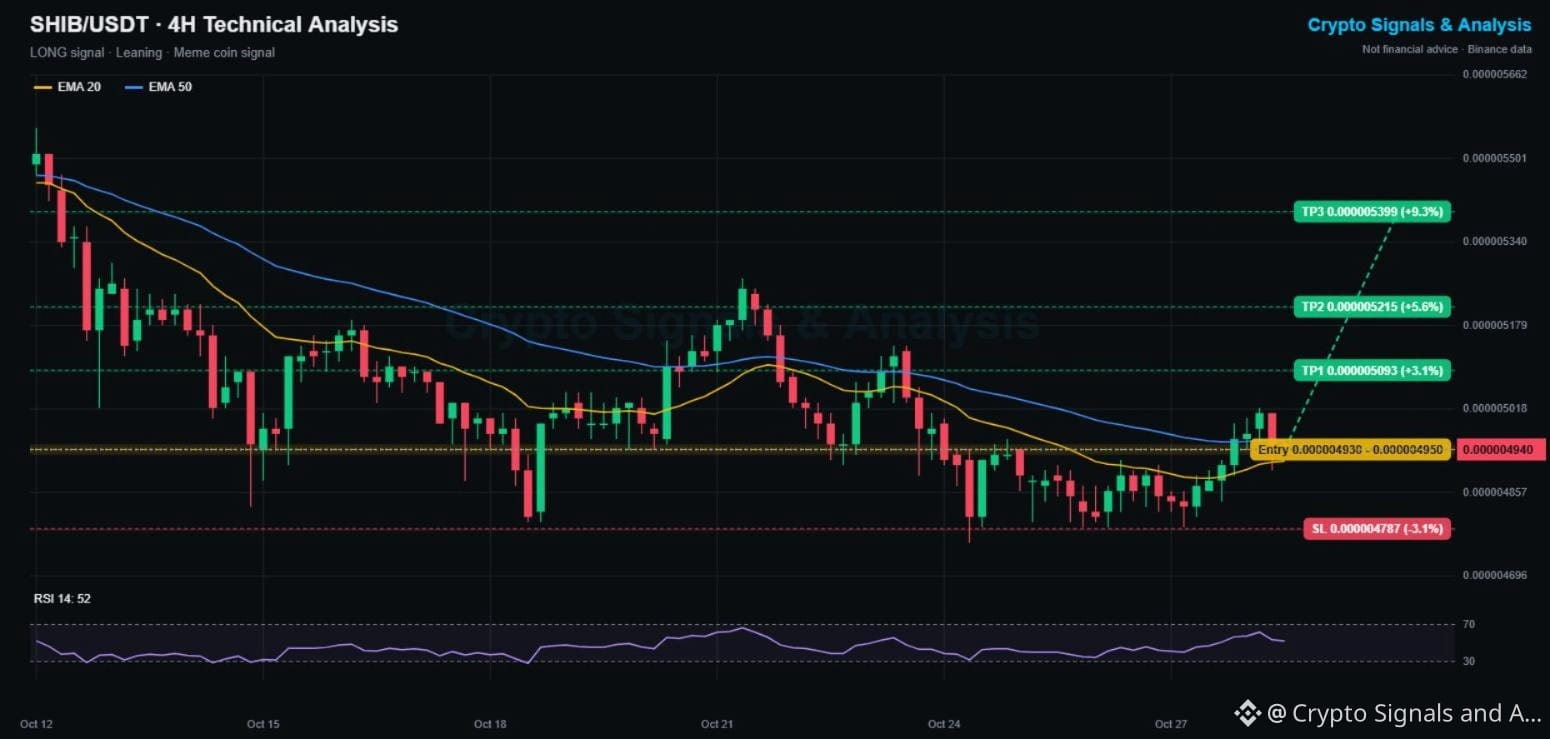
$SHIB Price Prediction Today: Shiba Inu Crypto Signal & Technical Analysis 📊
🟢 LONG | Entry 0.00000493 - 0.00000495 | TP1 0.00000509 | SL 0.00000479
👉 Tap $SHIB to place your trade fast
Shiba Inu is joining today's meme rebound. It held its 0.00000476 to 0.00000479 floor for 5 days, then broke above the 4H EMA20. Now it is retesting that EMA from above, which is a classic spot to buy a pullback.
📌 SHIBA INU TRADING SIGNAL (Leaning, early reversal setup)
Entry: 0.00000493 - 0.00000495
Take profit 1: 0.00000509 (+3.1%)
Take profit 2: 0.00000522 (+5.6%)
Take profit 3: 0.00000540 (+9.3%)
Stop loss: 0.00000479 (-3.1%)
📊 SHIB TECHNICAL ANALYSIS (4H CHART)
The EMA20 (0.000004918) has turned up, and the EMA50 (0.000004957) sits just overhead. RSI at 52 is neutral. The local high at 0.00000502 is the trigger: above it, SHIB has room to the Oct 21 high near 0.00000522.
🔑 KEY LEVELS
Support: 0.00000492 (EMA20), then 0.00000479
Resistance: 0.00000502, then 0.00000522
📈 Bullish scenario: a 4H close above 0.00000502 confirms the reversal and targets TP2 and TP3.
📉 Bearish scenario: losing the EMA20 puts SHIB back into its range. A close under 0.00000479 cancels this signal.
💡 Bottom line: a tight-stop meme play. If meme season continues, SHIB usually follows DOGE and PEPE.
👉 Tap $SHIB
to open the live chart. NFA
🔥 TRADE WITH LOWER FEES
✅ Get a 20% kickback on your Binance trading fees, for life
👇👇👇
{spot}(SHIBUSDT)
[Claim your 20% Binance fee kickback here](https://www.binance.com/register?ref=X0NQWZ4N)
━━━━━━━━━━
SHIB army: still holding, or did you switch to PEPE? 👇
Follow Crypto Signals and Analysis for daily signals.
#cryptosignals #SHİB #CanGoogleDefendItsCore
⚠️ Crypto is volatile: risk only what you can afford to lose.
$SHIB Price Prediction Today: Shiba Inu Crypto Signal & Technical Analysis 📊
🟢 LONG | Entry 0.00000493 - 0.00000495 | TP1 0.00000509 | SL 0.00000479
👉 Tap $SHIB to place your trade fast
Shiba Inu is joining today's meme rebound. It held its 0.00000476 to 0.00000479 floor for 5 days, then broke above the 4H EMA20. Now it is retesting that EMA from above, which is a classic spot to buy a pullback.
📌 SHIBA INU TRADING SIGNAL (Leaning, early reversal setup)
Entry: 0.00000493 - 0.00000495
Take profit 1: 0.00000509 (+3.1%)
Take profit 2: 0.00000522 (+5.6%)
Take profit 3: 0.00000540 (+9.3%)
Stop loss: 0.00000479 (-3.1%)
📊 SHIB TECHNICAL ANALYSIS (4H CHART)
The EMA20 (0.000004918) has turned up, and the EMA50 (0.000004957) sits just overhead. RSI at 52 is neutral. The local high at 0.00000502 is the trigger: above it, SHIB has room to the Oct 21 high near 0.00000522.
🔑 KEY LEVELS
Support: 0.00000492 (EMA20), then 0.00000479
Resistance: 0.00000502, then 0.00000522
📈 Bullish scenario: a 4H close above 0.00000502 confirms the reversal and targets TP2 and TP3.
📉 Bearish scenario: losing the EMA20 puts SHIB back into its range. A close under 0.00000479 cancels this signal.
💡 Bottom line: a tight-stop meme play. If meme season continues, SHIB usually follows DOGE and PEPE.
👉 Tap $SHIB
to open the live chart. NFA
🔥 TRADE WITH LOWER FEES
✅ Get a 20% kickback on your Binance trading fees, for life
👇👇👇
Claim your 20% Binance fee kickback here
━━━━━━━━━━
SHIB army: still holding, or did you switch to PEPE? 👇
Follow Crypto Signals and Analysis for daily signals.
#cryptosignals #SHİB #CanGoogleDefendItsCore
⚠️ Crypto is volatile: risk only what you can afford to lose.
12
·
--
ブリッシュ
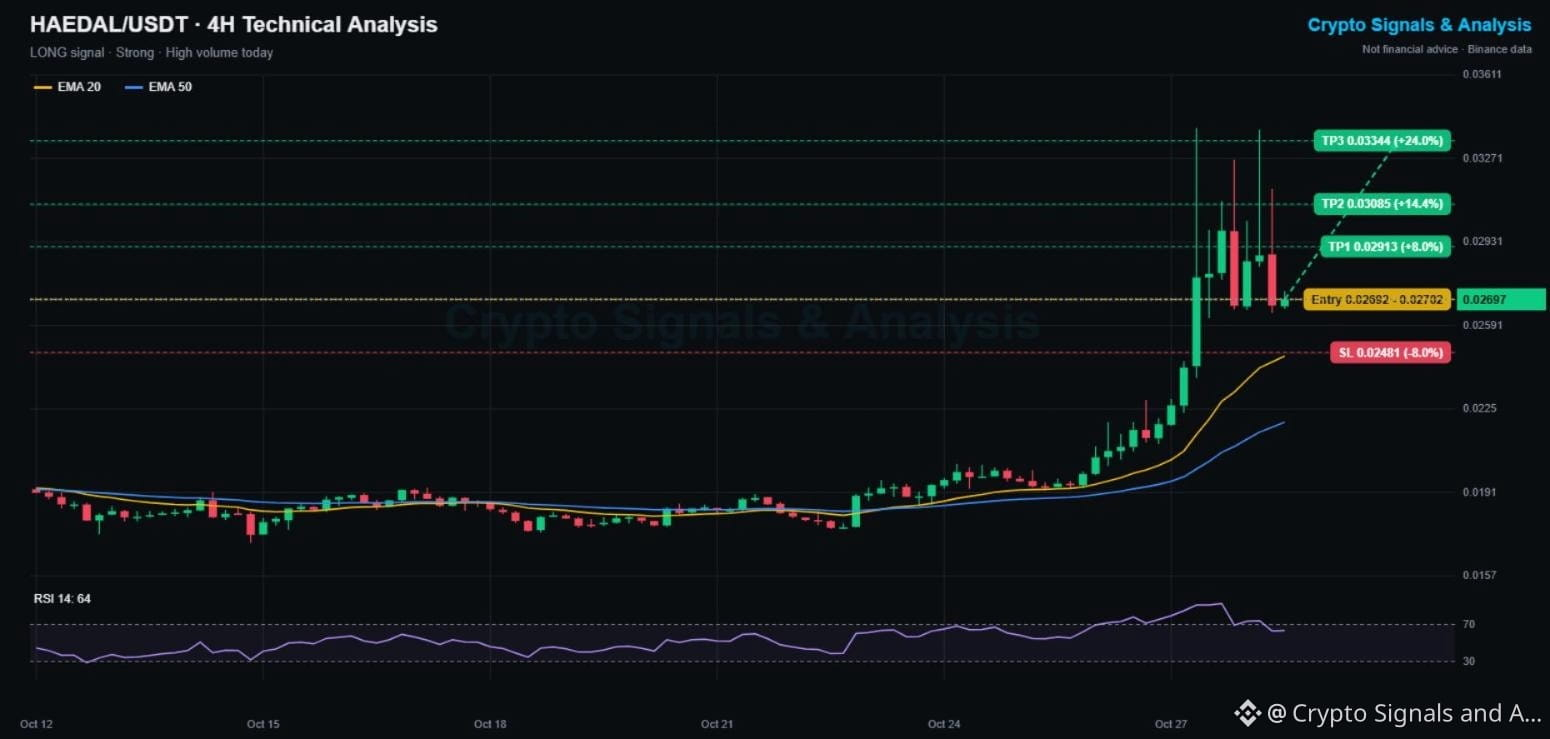
$HAEDAL 本日の価格予測:Haedal Protocolの暗号資産シグナル&テクニカル分析 📊
🟢 ロング | エントリー 0.02692 - 0.02702 | TP1 0.02913 | SL 0.02481
👉 $HAEDAL をタップして、すぐに取引
Haedal Protocolは今週43%上昇し、本日のBinanceで最も取引されている小型銘柄の一つです。0.034まで2度急騰した後、勢いが落ち着き、0.026〜0.029で値固めしています。上昇中の4時間足EMAを大きく上回る水準です。
📌 HAEDAL 取引シグナル(強いトレンド、非常に高いボラティリティ)
エントリー:0.02692 - 0.02702
利確目標 1:0.02913(+8%)
利確目標 2:0.03085(+14%)
利確目標 3:0.03344(+24%)
損切り:0.02481(-8%)
📊 HAEDAL テクニカル分析(4時間足チャート)
トレンドは明らかに上向きです。EMA20(0.0247)とEMA50(0.0220)は急速に上昇し、RSIは80から64まで低下しました。ただし、0.034で長い上ヒゲが2本出ており、高値圏で強い売り圧力があったことを示しています。最も望ましい展開はフラッグ形成です。横ばいで値固めした後、もう一段上昇するシナリオです。
🔑 重要な価格水準
サポート:0.0260、次に0.0247(EMA20)
レジスタンス:0.0293、次に0.0340
📈 強気シナリオ:4時間足の終値が0.0293を上回ればフラッグを上抜けし、TP2と0.034の高値を目指します。
📉 弱気シナリオ:EMA20を割り込めば、ひとまず急騰は終了です。0.02481を下回って終値をつけた場合、このシグナルは無効になります。
💡 要点:勢いは強いものの、このコインは数時間で20%変動します。ポジションサイズを小さくし、損切りを必ず守りましょう。
👉 $HAEDAL をタップして
リアルタイムチャートを開きましょう。投資助言ではありません。
🔥 取引手数料をもっとお得に
✅ Binanceの取引手数料が生涯20%還元
👇👇👇
{spot}(HAEDALUSDT)
[Claim your 20% Binance fee kickback here](https://www.binance.com/register?ref=X0NQWZ4N)
━━━━━━━━━━
Haedal:0.034への3度目の上昇か、それとも急騰は終了か? 👇
毎日のシグナルを受け取るには、Crypto Signals and Analysisをフォローしてください。
#cryptosignals #HAEDAL #EarningsSeason
⚠️ 暗号資産は価格変動が激しいため、失っても問題のない範囲でのみリスクを取りましょう。
$HAEDAL 本日の価格予測:Haedal Protocolの暗号資産シグナル&テクニカル分析 📊
🟢 ロング | エントリー 0.02692 - 0.02702 | TP1 0.02913 | SL 0.02481
👉 $HAEDAL をタップして、すぐに取引
Haedal Protocolは今週43%上昇し、本日のBinanceで最も取引されている小型銘柄の一つです。0.034まで2度急騰した後、勢いが落ち着き、0.026〜0.029で値固めしています。上昇中の4時間足EMAを大きく上回る水準です。
📌 HAEDAL 取引シグナル(強いトレンド、非常に高いボラティリティ)
エントリー:0.02692 - 0.02702
利確目標 1:0.02913(+8%)
利確目標 2:0.03085(+14%)
利確目標 3:0.03344(+24%)
損切り:0.02481(-8%)
📊 HAEDAL テクニカル分析(4時間足チャート)
トレンドは明らかに上向きです。EMA20(0.0247)とEMA50(0.0220)は急速に上昇し、RSIは80から64まで低下しました。ただし、0.034で長い上ヒゲが2本出ており、高値圏で強い売り圧力があったことを示しています。最も望ましい展開はフラッグ形成です。横ばいで値固めした後、もう一段上昇するシナリオです。
🔑 重要な価格水準
サポート:0.0260、次に0.0247(EMA20)
レジスタンス:0.0293、次に0.0340
📈 強気シナリオ:4時間足の終値が0.0293を上回ればフラッグを上抜けし、TP2と0.034の高値を目指します。
📉 弱気シナリオ:EMA20を割り込めば、ひとまず急騰は終了です。0.02481を下回って終値をつけた場合、このシグナルは無効になります。
💡 要点:勢いは強いものの、このコインは数時間で20%変動します。ポジションサイズを小さくし、損切りを必ず守りましょう。
👉 $HAEDAL をタップして
リアルタイムチャートを開きましょう。投資助言ではありません。
🔥 取引手数料をもっとお得に
✅ Binanceの取引手数料が生涯20%還元
👇👇👇
Claim your 20% Binance fee kickback here
━━━━━━━━━━
Haedal:0.034への3度目の上昇か、それとも急騰は終了か? 👇
毎日のシグナルを受け取るには、Crypto Signals and Analysisをフォローしてください。
#cryptosignals #HAEDAL #EarningsSeason
⚠️ 暗号資産は価格変動が激しいため、失っても問題のない範囲でのみリスクを取りましょう。
178
·
--
弱気相場
翻訳参照
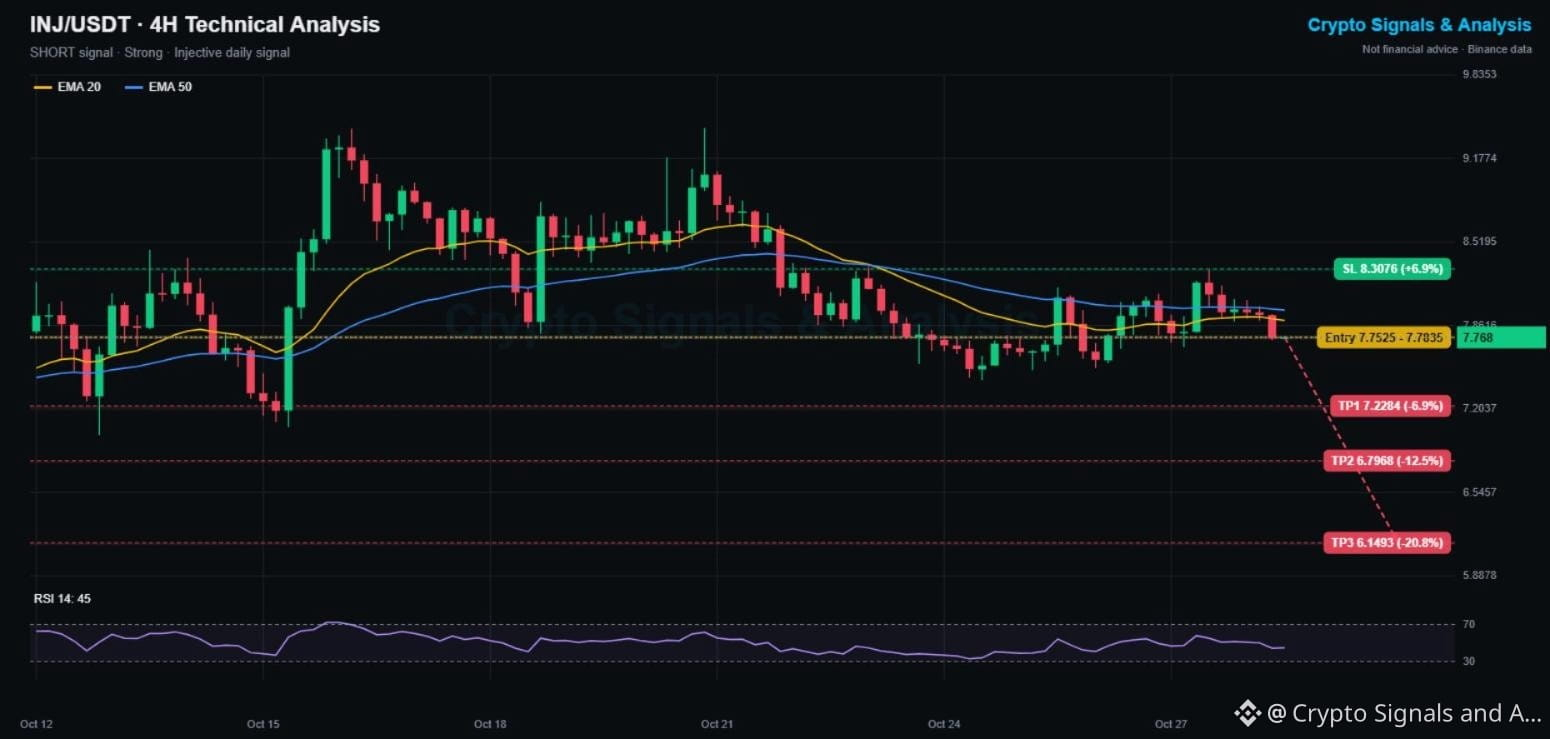
$INJ Price Prediction Today: Injective Crypto Signal & Technical Analysis 📊
🔴 SHORT | Entry 7.753 - 7.784 | TP1 7.228 | SL 8.308
👉 Tap $INJ to place your trade fast
Injective dropped 4.2% today and just slipped back under both 4H EMAs. The bounce to 8.30 yesterday failed, and the chart now shows a lower high under the Oct 21 peak at 9.42.
📌 INJECTIVE TRADING SIGNAL (Strong, 5/5 signals agree)
Entry: 7.753 - 7.784
Take profit 1: 7.228 (-6.9%)
Take profit 2: 6.797 (-12.5%)
Take profit 3: 6.149 (-20.8%)
Stop loss: 8.308 (+6.9%)
📊 INJ TECHNICAL ANALYSIS (4H CHART)
INJ has made lower highs at 9.42, 8.60 and 8.30. Price is now under the EMA20 (7.90) and EMA50 (7.98), and the EMA20 is sloping down. RSI at 45 is tilting toward sellers. The 7.45 to 7.53 zone is the nearest support; below it, the Oct 15 low at 7.0 comes into play.
🔑 KEY LEVELS
Support: 7.53, then 7.00
Resistance: 7.98 (EMA50), then 8.30
📈 Bullish scenario: a 4H close above 8.31 breaks the lower-high pattern and cancels the short.
📉 Bearish scenario: losing 7.45 opens the way to TP1 and the 7.0 support.
💡 Bottom line: Injective is losing momentum after a failed bounce. A retest of 7.9 to 8.0 would be a better short entry.
👉 Tap $INJ
to open the live chart. NFA
🔥 TRADE WITH LOWER FEES
✅ Get a 20% kickback on your Binance trading fees, for life
👇👇👇
{spot}(INJUSDT)
[Claim your 20% Binance fee kickback here](https://www.binance.com/register?ref=X0NQWZ4N)
━━━━━━━━━━
Injective at 7 or 9 first? Vote below 👇
Follow Crypto Signals and Analysis for daily signals.
#cryptosignals #İNJ #CanMicrosoftDeliverOnAI
⚠️ Crypto is volatile: risk only what you can afford to lose.
$INJ Price Prediction Today: Injective Crypto Signal & Technical Analysis 📊
🔴 SHORT | Entry 7.753 - 7.784 | TP1 7.228 | SL 8.308
👉 Tap $INJ to place your trade fast
Injective dropped 4.2% today and just slipped back under both 4H EMAs. The bounce to 8.30 yesterday failed, and the chart now shows a lower high under the Oct 21 peak at 9.42.
📌 INJECTIVE TRADING SIGNAL (Strong, 5/5 signals agree)
Entry: 7.753 - 7.784
Take profit 1: 7.228 (-6.9%)
Take profit 2: 6.797 (-12.5%)
Take profit 3: 6.149 (-20.8%)
Stop loss: 8.308 (+6.9%)
📊 INJ TECHNICAL ANALYSIS (4H CHART)
INJ has made lower highs at 9.42, 8.60 and 8.30. Price is now under the EMA20 (7.90) and EMA50 (7.98), and the EMA20 is sloping down. RSI at 45 is tilting toward sellers. The 7.45 to 7.53 zone is the nearest support; below it, the Oct 15 low at 7.0 comes into play.
🔑 KEY LEVELS
Support: 7.53, then 7.00
Resistance: 7.98 (EMA50), then 8.30
📈 Bullish scenario: a 4H close above 8.31 breaks the lower-high pattern and cancels the short.
📉 Bearish scenario: losing 7.45 opens the way to TP1 and the 7.0 support.
💡 Bottom line: Injective is losing momentum after a failed bounce. A retest of 7.9 to 8.0 would be a better short entry.
👉 Tap $INJ
to open the live chart. NFA
🔥 TRADE WITH LOWER FEES
✅ Get a 20% kickback on your Binance trading fees, for life
👇👇👇
Claim your 20% Binance fee kickback here
━━━━━━━━━━
Injective at 7 or 9 first? Vote below 👇
Follow Crypto Signals and Analysis for daily signals.
#cryptosignals #İNJ #CanMicrosoftDeliverOnAI
⚠️ Crypto is volatile: risk only what you can afford to lose.
87
·
--
ブリッシュ
翻訳参照
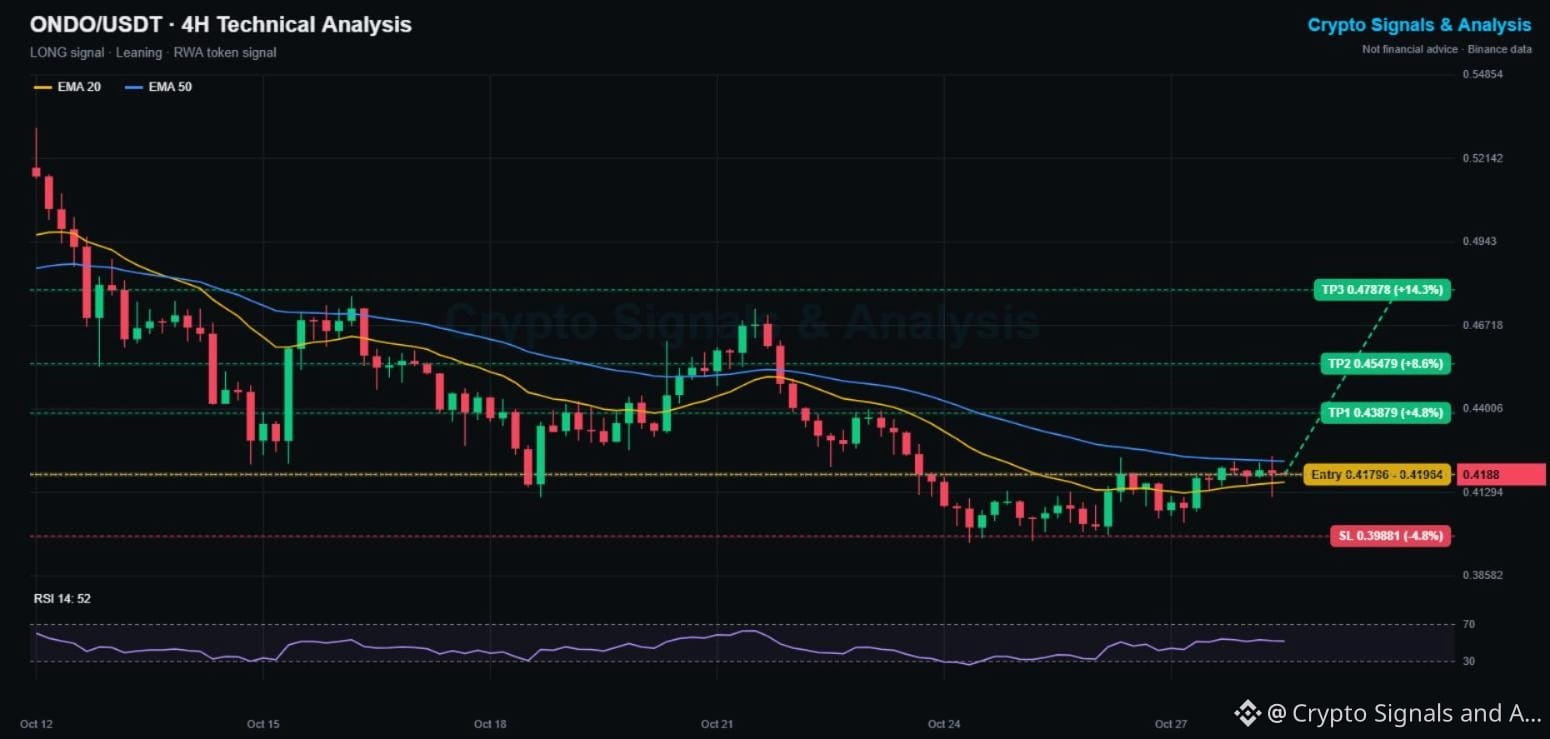
$ONDO Price Prediction Today: Ondo Finance Crypto Signal & Technical Analysis 📊
🟢 LONG | Entry 0.4180 - 0.4196 | TP1 0.4388 | SL 0.3988
👉 Tap $ONDO to place your trade fast
Ondo, the leading real-world-asset (RWA) token, has held a tight floor at 0.397 to 0.400 for 4 days. Now it is lifting off: price reclaimed the 4H EMA20 and is pressing the EMA50 at 0.423.
📌 ONDO TRADING SIGNAL (Leaning, base breakout setup)
Entry: 0.4180 - 0.4196
Take profit 1: 0.4388 (+4.8%)
Take profit 2: 0.4548 (+8.6%)
Take profit 3: 0.4788 (+14.3%)
Stop loss: 0.3988 (-4.8%)
📊 ONDO TECHNICAL ANALYSIS (4H CHART)
ONDO dropped from 0.531 to 0.397 since Oct 12, but the last 4 days show higher lows. The EMA20 (0.4163) has turned up, and RSI at 52 is neutral. A 4H close above the EMA50 (0.4231) and the 0.4247 high would confirm the breakout toward 0.44 to 0.455.
🔑 KEY LEVELS
Support: 0.4163 (EMA20), then 0.3970
Resistance: 0.4247, then 0.4400
📈 Bullish scenario: a 4H close above 0.4247 confirms the base breakout and opens TP1 and TP2.
📉 Bearish scenario: a rejection at the EMA50 sends ONDO back to its 0.40 floor. A close under 0.3988 cancels this signal.
💡 Bottom line: the RWA narrative is still strong. The chart just needs to break the EMA50 to join it.
👉 Tap $ONDO
to open the live chart. NFA
🔥 TRADE WITH LOWER FEES
✅ Get a 20% kickback on your Binance trading fees, for life
👇👇👇
{spot}(ONDOUSDT)
[Claim your 20% Binance fee kickback here](https://www.binance.com/register?ref=X0NQWZ4N)
━━━━━━━━━━
Is RWA the strongest crypto narrative for 2027? 👇
Follow Crypto Signals and Analysis for daily signals.
#cryptosignals #ONDO #CanGoogleDefendItsCore
⚠️ Crypto is volatile: risk only what you can afford to lose.
$ONDO Price Prediction Today: Ondo Finance Crypto Signal & Technical Analysis 📊
🟢 LONG | Entry 0.4180 - 0.4196 | TP1 0.4388 | SL 0.3988
👉 Tap $ONDO to place your trade fast
Ondo, the leading real-world-asset (RWA) token, has held a tight floor at 0.397 to 0.400 for 4 days. Now it is lifting off: price reclaimed the 4H EMA20 and is pressing the EMA50 at 0.423.
📌 ONDO TRADING SIGNAL (Leaning, base breakout setup)
Entry: 0.4180 - 0.4196
Take profit 1: 0.4388 (+4.8%)
Take profit 2: 0.4548 (+8.6%)
Take profit 3: 0.4788 (+14.3%)
Stop loss: 0.3988 (-4.8%)
📊 ONDO TECHNICAL ANALYSIS (4H CHART)
ONDO dropped from 0.531 to 0.397 since Oct 12, but the last 4 days show higher lows. The EMA20 (0.4163) has turned up, and RSI at 52 is neutral. A 4H close above the EMA50 (0.4231) and the 0.4247 high would confirm the breakout toward 0.44 to 0.455.
🔑 KEY LEVELS
Support: 0.4163 (EMA20), then 0.3970
Resistance: 0.4247, then 0.4400
📈 Bullish scenario: a 4H close above 0.4247 confirms the base breakout and opens TP1 and TP2.
📉 Bearish scenario: a rejection at the EMA50 sends ONDO back to its 0.40 floor. A close under 0.3988 cancels this signal.
💡 Bottom line: the RWA narrative is still strong. The chart just needs to break the EMA50 to join it.
👉 Tap $ONDO
to open the live chart. NFA
🔥 TRADE WITH LOWER FEES
✅ Get a 20% kickback on your Binance trading fees, for life
👇👇👇
Claim your 20% Binance fee kickback here
━━━━━━━━━━
Is RWA the strongest crypto narrative for 2027? 👇
Follow Crypto Signals and Analysis for daily signals.
#cryptosignals #ONDO #CanGoogleDefendItsCore
⚠️ Crypto is volatile: risk only what you can afford to lose.
51
·
--
弱気相場
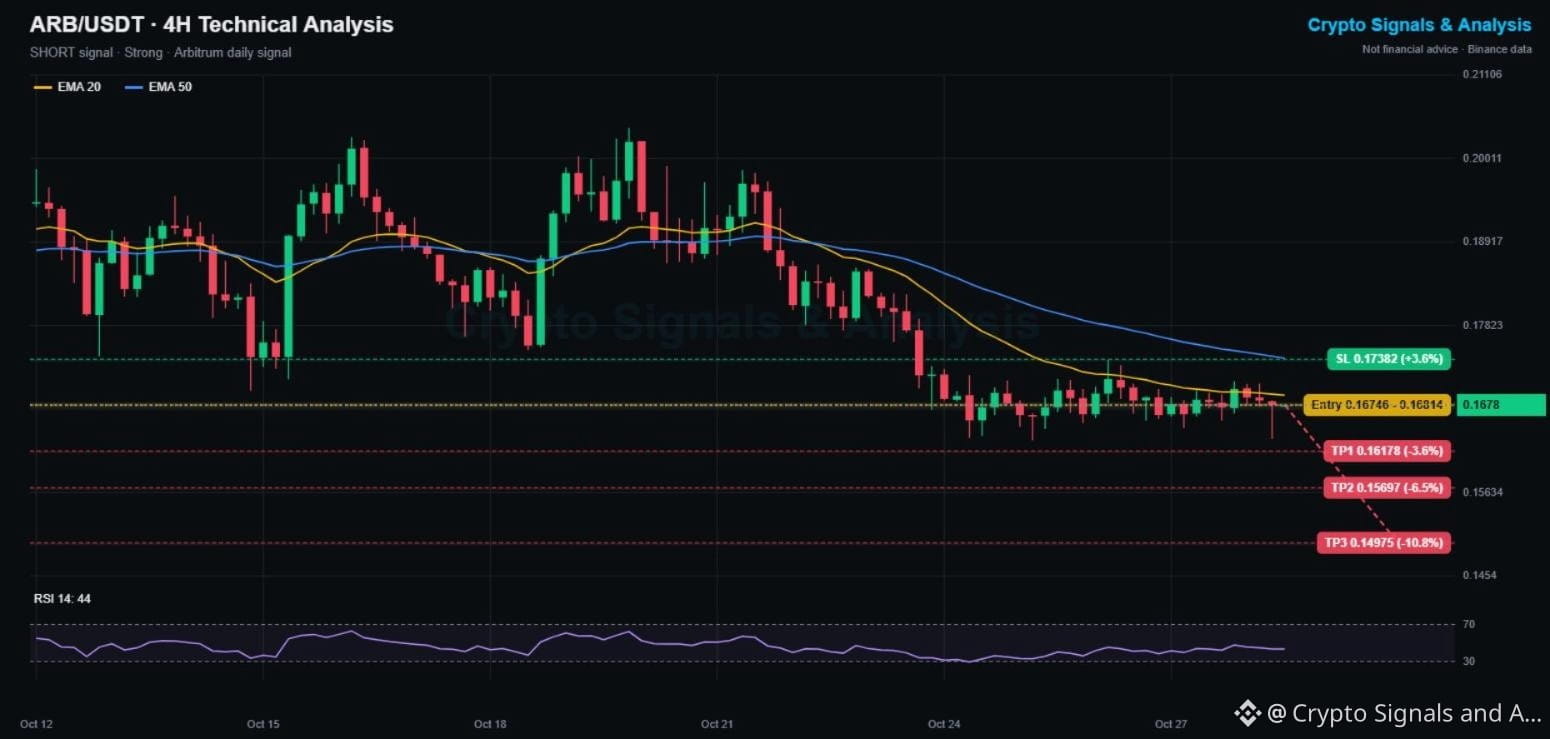
$ARB 本日の価格予測:Arbitrumの暗号資産シグナル&テクニカル分析 📊
🔴 ショート | エントリー 0.1675 - 0.1681 | TP1 0.1618 | SL 0.1738
👉 $ARB をタップして、すぐに取引を開始
Arbitrumは10月23日に0.18のサポートを割り込み、その後5日間、下降中の4時間足EMAを下回る0.163~0.174の範囲で横ばいに推移しています。今週は14%下落しており、小幅な反発も毎回EMA20で売られています。
📌 ARBITRUM 取引シグナル(強気度:高、5/5のシグナルが一致)
エントリー:0.1675 - 0.1681
利確目標1:0.1618(-3.6%)
利確目標2:0.1570(-6.5%)
利確目標3:0.1498(-10.8%)
損切り:0.1738(+3.6%)
📊 ARB テクニカル分析(4時間足チャート)
価格はEMA20(0.1691)とEMA50(0.1739)を下回ったままで、どちらも下降中です。RSIは44で、需要の弱さを示しています。10月24日以降のベアフラッグは0.1632が下限です。ここを下抜けると、0.157と節目の0.150が目標になります。
🔑 重要な価格水準
サポート:0.1632、その次が0.1570
レジスタンス:0.1691(EMA20)、その次が0.1739(EMA50)
📈 強気シナリオ:4時間足の終値が0.1738を上回れば、EMA50を回復し、ショートシナリオは無効になります。
📉 弱気シナリオ:0.1632を割るとベアフラッグが完成し、TP2とTP3が視野に入ります。
💡 まとめ:レイヤー2トークンは弱く、Arbitrumも例外ではありません。反発局面では売り、損切りラインを厳守しましょう。
👉 $ARB をタップ
してリアルタイムチャートを開きましょう。投資助言ではありません。
🔥 取引手数料をお得に
✅ Binanceの取引手数料の20%が、永久にキャッシュバック
👇👇👇
{spot}(ARBUSDT)
[Claim your 20% Binance fee kickback here](https://www.binance.com/register?ref=X0NQWZ4N)
━━━━━━━━━━
Arbitrum、Optimism、それともBase:2027年に勝つレイヤー2は? 👇
毎日のシグナルを受け取るには、Crypto Signals and Analysisをフォローしてください。
#cryptosignals #ARB #EarningsSeason
⚠️ 暗号資産は価格変動が激しいため、失っても差し支えない金額だけを投資してください。
$ARB 本日の価格予測:Arbitrumの暗号資産シグナル&テクニカル分析 📊
🔴 ショート | エントリー 0.1675 - 0.1681 | TP1 0.1618 | SL 0.1738
👉 $ARB をタップして、すぐに取引を開始
Arbitrumは10月23日に0.18のサポートを割り込み、その後5日間、下降中の4時間足EMAを下回る0.163~0.174の範囲で横ばいに推移しています。今週は14%下落しており、小幅な反発も毎回EMA20で売られています。
📌 ARBITRUM 取引シグナル(強気度:高、5/5のシグナルが一致)
エントリー:0.1675 - 0.1681
利確目標1:0.1618(-3.6%)
利確目標2:0.1570(-6.5%)
利確目標3:0.1498(-10.8%)
損切り:0.1738(+3.6%)
📊 ARB テクニカル分析(4時間足チャート)
価格はEMA20(0.1691)とEMA50(0.1739)を下回ったままで、どちらも下降中です。RSIは44で、需要の弱さを示しています。10月24日以降のベアフラッグは0.1632が下限です。ここを下抜けると、0.157と節目の0.150が目標になります。
🔑 重要な価格水準
サポート:0.1632、その次が0.1570
レジスタンス:0.1691(EMA20)、その次が0.1739(EMA50)
📈 強気シナリオ:4時間足の終値が0.1738を上回れば、EMA50を回復し、ショートシナリオは無効になります。
📉 弱気シナリオ:0.1632を割るとベアフラッグが完成し、TP2とTP3が視野に入ります。
💡 まとめ:レイヤー2トークンは弱く、Arbitrumも例外ではありません。反発局面では売り、損切りラインを厳守しましょう。
👉 $ARB をタップ
してリアルタイムチャートを開きましょう。投資助言ではありません。
🔥 取引手数料をお得に
✅ Binanceの取引手数料の20%が、永久にキャッシュバック
👇👇👇
Claim your 20% Binance fee kickback here
━━━━━━━━━━
Arbitrum、Optimism、それともBase:2027年に勝つレイヤー2は? 👇
毎日のシグナルを受け取るには、Crypto Signals and Analysisをフォローしてください。
#cryptosignals #ARB #EarningsSeason
⚠️ 暗号資産は価格変動が激しいため、失っても差し支えない金額だけを投資してください。
99
·
--
弱気相場
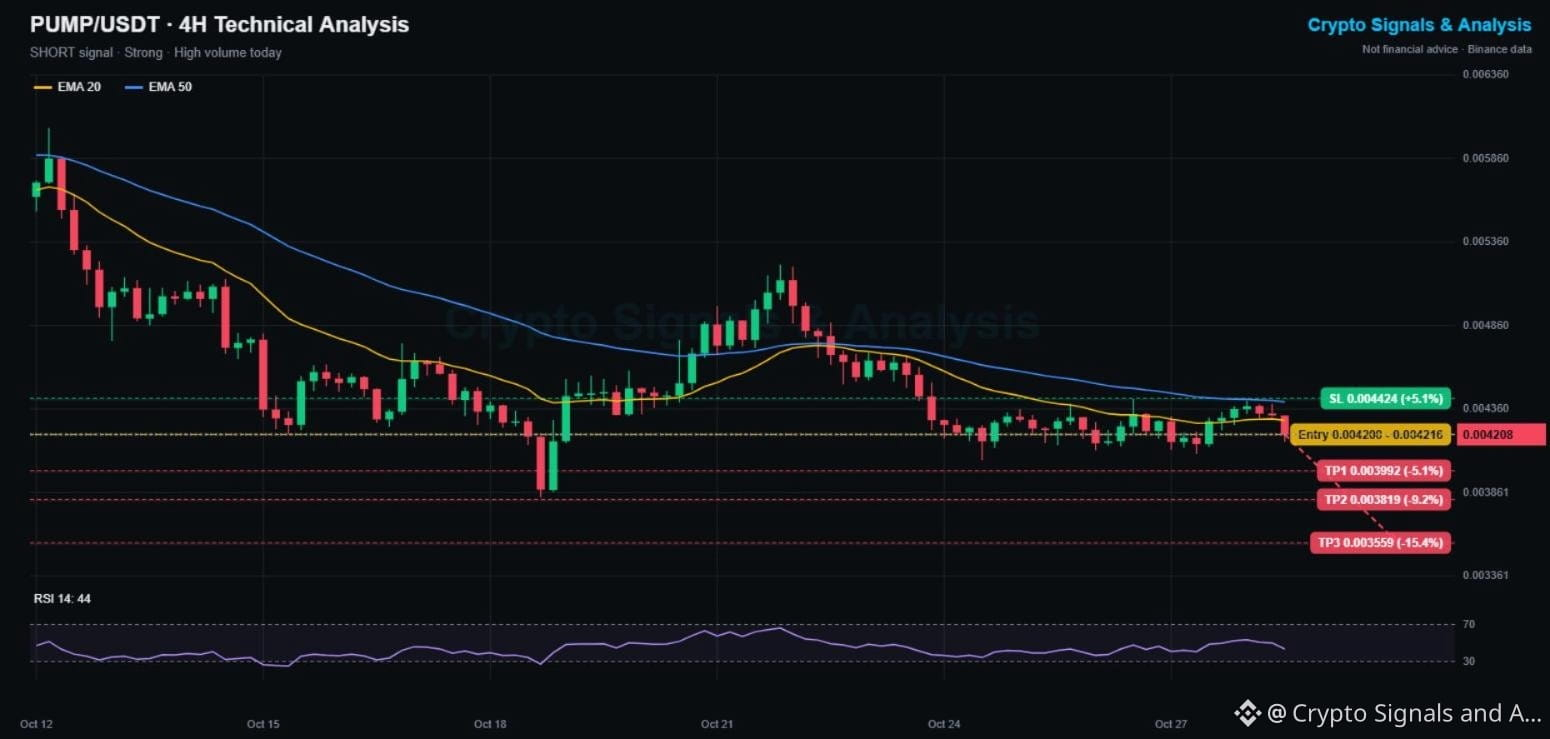
$PUMP 本日の価格予測:Pump.fun 暗号資産シグナル&テクニカル分析 📊
🔴 ショート | エントリー 0.004200 - 0.004216 | TP1 0.003992 | SL 0.004424
👉 $PUMP をタップして、すぐに取引
Pump.funトークンは依然としてBinanceで最も取引されているコインの一つですが、チャートは下落し続けています。今週は15%、10月12日以降では30%下落しました。直近の反発は、下降中の4時間足EMA50でちょうど失速し、赤いローソク足がさらに価格を押し下げています。
📌 PUMP 取引シグナル(強気、5/5のシグナルが一致)
エントリー:0.004200 - 0.004216
利確目標 1:0.003992(-5.1%)
利確目標 2:0.003819(-9.2%)
利確目標 3:0.003559(-15.4%)
損切り:0.004424(+5.1%)
📊 PUMP テクニカル分析(4時間足チャート)
PUMPはEMA20(0.00429)とEMA50(0.00440)を下回っており、どちらも下降しています。RSIは44で、売り方優勢を示しています。0.00409~0.00415のゾーンは、5日間にわたって下値支持となっています。ここを下回ると、次の目標となるのは10月19日の安値0.00383です。
🔑 重要な価格水準
サポート:0.00409、次に0.00383
レジスタンス:0.00429(EMA20)、次に0.00442
📈 強気シナリオ:4時間足の終値が0.004424を上回れば、EMA50を突破し、ショートシナリオは無効になります。
📉 弱気シナリオ:0.00409を割ると、10月19日の安値にあるTP2、さらにはそれより下まで下落する可能性があります。
💡 まとめ:出来高は多いものの、レジスタンスでは買い手が不在です。EMA50を上抜けるまでは、売り方優勢のトレンドが続きそうです。
👉 $PUMP をタップ
してリアルタイムチャートを開きましょう。投資助言ではありません。
🔥 取引手数料をお得に
✅ Binanceの取引手数料の20%が、ずっとキャッシュバック
👇👇👇
{spot}(PUMPUSDT)
[Claim your 20% Binance fee kickback here](https://www.binance.com/register?ref=X0NQWZ4N)
━━━━━━━━━━
Pump.fun:ローンチパッドの熱狂はもう終わり?コメントで教えてください 👇
毎日のシグナルを受け取るには、Crypto Signals and Analysisをフォローしてください。
#cryptosignals #PUMP #CanMicrosoftDeliverOnAI
⚠️ 暗号資産は価格変動が激しいため、失っても問題のない金額だけをリスクにさらしましょう。
$PUMP 本日の価格予測:Pump.fun 暗号資産シグナル&テクニカル分析 📊
🔴 ショート | エントリー 0.004200 - 0.004216 | TP1 0.003992 | SL 0.004424
👉 $PUMP をタップして、すぐに取引
Pump.funトークンは依然としてBinanceで最も取引されているコインの一つですが、チャートは下落し続けています。今週は15%、10月12日以降では30%下落しました。直近の反発は、下降中の4時間足EMA50でちょうど失速し、赤いローソク足がさらに価格を押し下げています。
📌 PUMP 取引シグナル(強気、5/5のシグナルが一致)
エントリー:0.004200 - 0.004216
利確目標 1:0.003992(-5.1%)
利確目標 2:0.003819(-9.2%)
利確目標 3:0.003559(-15.4%)
損切り:0.004424(+5.1%)
📊 PUMP テクニカル分析(4時間足チャート)
PUMPはEMA20(0.00429)とEMA50(0.00440)を下回っており、どちらも下降しています。RSIは44で、売り方優勢を示しています。0.00409~0.00415のゾーンは、5日間にわたって下値支持となっています。ここを下回ると、次の目標となるのは10月19日の安値0.00383です。
🔑 重要な価格水準
サポート:0.00409、次に0.00383
レジスタンス:0.00429(EMA20)、次に0.00442
📈 強気シナリオ:4時間足の終値が0.004424を上回れば、EMA50を突破し、ショートシナリオは無効になります。
📉 弱気シナリオ:0.00409を割ると、10月19日の安値にあるTP2、さらにはそれより下まで下落する可能性があります。
💡 まとめ:出来高は多いものの、レジスタンスでは買い手が不在です。EMA50を上抜けるまでは、売り方優勢のトレンドが続きそうです。
👉 $PUMP をタップ
してリアルタイムチャートを開きましょう。投資助言ではありません。
🔥 取引手数料をお得に
✅ Binanceの取引手数料の20%が、ずっとキャッシュバック
👇👇👇
Claim your 20% Binance fee kickback here
━━━━━━━━━━
Pump.fun:ローンチパッドの熱狂はもう終わり?コメントで教えてください 👇
毎日のシグナルを受け取るには、Crypto Signals and Analysisをフォローしてください。
#cryptosignals #PUMP #CanMicrosoftDeliverOnAI
⚠️ 暗号資産は価格変動が激しいため、失っても問題のない金額だけをリスクにさらしましょう。
96
·
--
弱気相場
翻訳参照
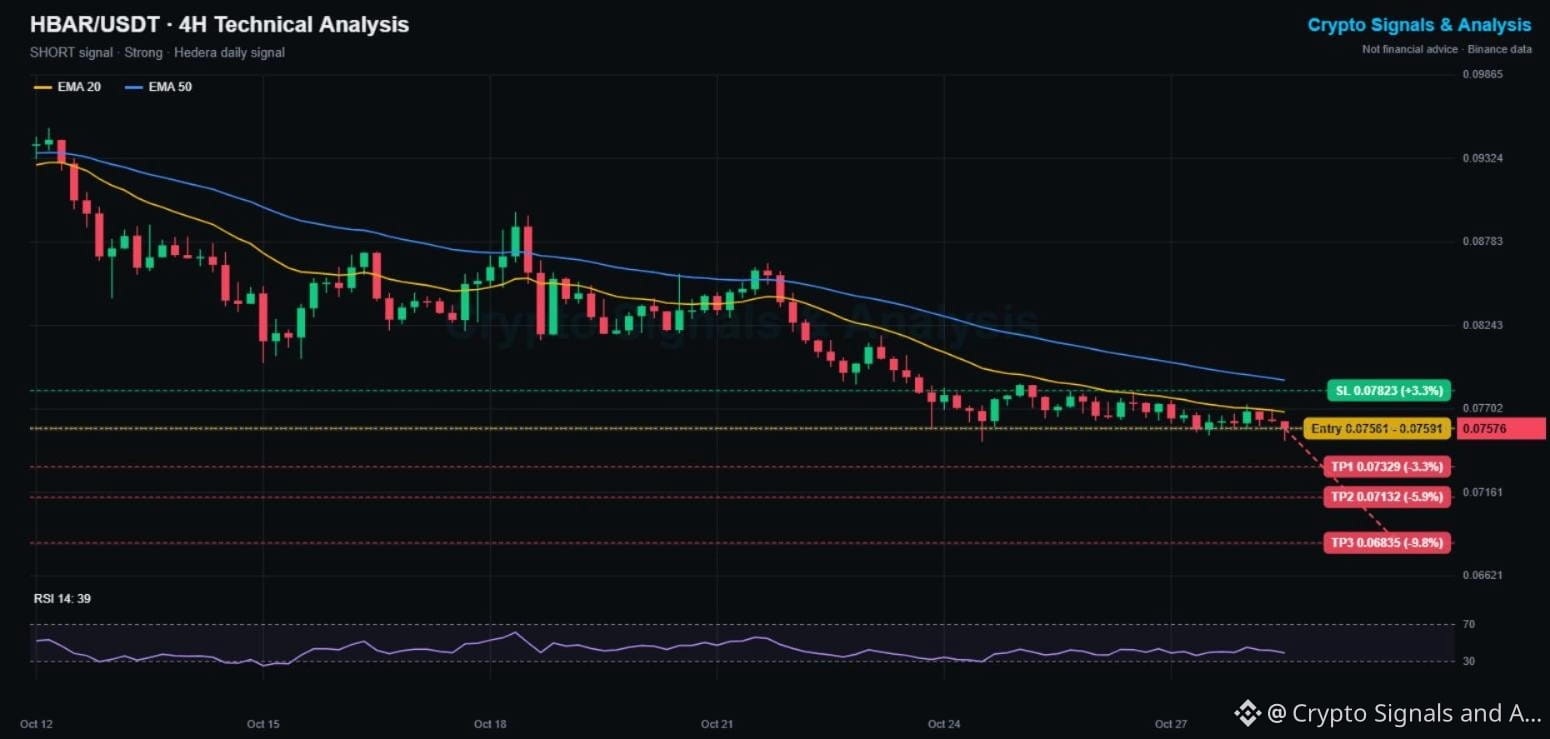
$HBAR Price Prediction Today: Hedera Crypto Signal & Technical Analysis 📊
🔴 SHORT | Entry 0.07561 - 0.07591 | TP1 0.07329 | SL 0.07823
👉 Tap $HBAR to place your trade fast
Hedera has dropped 20% since Oct 12 (from 0.095 to 0.075) and is down 12% this week alone. Price has been pinned under the falling 4H EMA20 for 5 days and is now leaning on the 0.0749 floor.
📌 HEDERA TRADING SIGNAL (Strong, 5/5 signals agree)
Entry: 0.07561 - 0.07591
Take profit 1: 0.07329 (-3.3%)
Take profit 2: 0.07132 (-5.9%)
Take profit 3: 0.06835 (-9.8%)
Stop loss: 0.07823 (+3.3%)
📊 HBAR TECHNICAL ANALYSIS (4H CHART)
Price is under both the EMA20 (0.0768) and EMA50 (0.0789), the EMAs are falling, and RSI at 39 shows sellers in charge. HBAR has made lower highs on every bounce: 0.0880, 0.0860, 0.0790. The 0.0749 floor has held twice, but each test weakens it.
🔑 KEY LEVELS
Support: 0.0749, then 0.0713
Resistance: 0.0768 (EMA20), then 0.0789 (EMA50)
📈 Bullish scenario: a 4H close above 0.0782 reclaims the EMA zone and cancels the short.
📉 Bearish scenario: a break of 0.0749 opens a fast drop to TP2 and TP3.
💡 Bottom line: Hedera has been one of the steadiest decliners this month. Trend followers stay short until the EMA50 breaks.
👉 Tap $HBAR
to open the live chart. NFA
🔥 TRADE WITH LOWER FEES
✅ Get a 20% kickback on your Binance trading fees, for life
👇👇👇
{spot}(HBARUSDT)
[Claim your 20% Binance fee kickback here](https://www.binance.com/register?ref=X0NQWZ4N)
━━━━━━━━━━
Hedera holders: is 0.07 the bottom or just the next stop? 👇
Follow Crypto Signals and Analysis for daily signals.
#cryptosignals #HBAR #CanGoogleDefendItsCore
⚠️ Crypto is volatile: risk only what you can afford to lose.
$HBAR Price Prediction Today: Hedera Crypto Signal & Technical Analysis 📊
🔴 SHORT | Entry 0.07561 - 0.07591 | TP1 0.07329 | SL 0.07823
👉 Tap $HBAR to place your trade fast
Hedera has dropped 20% since Oct 12 (from 0.095 to 0.075) and is down 12% this week alone. Price has been pinned under the falling 4H EMA20 for 5 days and is now leaning on the 0.0749 floor.
📌 HEDERA TRADING SIGNAL (Strong, 5/5 signals agree)
Entry: 0.07561 - 0.07591
Take profit 1: 0.07329 (-3.3%)
Take profit 2: 0.07132 (-5.9%)
Take profit 3: 0.06835 (-9.8%)
Stop loss: 0.07823 (+3.3%)
📊 HBAR TECHNICAL ANALYSIS (4H CHART)
Price is under both the EMA20 (0.0768) and EMA50 (0.0789), the EMAs are falling, and RSI at 39 shows sellers in charge. HBAR has made lower highs on every bounce: 0.0880, 0.0860, 0.0790. The 0.0749 floor has held twice, but each test weakens it.
🔑 KEY LEVELS
Support: 0.0749, then 0.0713
Resistance: 0.0768 (EMA20), then 0.0789 (EMA50)
📈 Bullish scenario: a 4H close above 0.0782 reclaims the EMA zone and cancels the short.
📉 Bearish scenario: a break of 0.0749 opens a fast drop to TP2 and TP3.
💡 Bottom line: Hedera has been one of the steadiest decliners this month. Trend followers stay short until the EMA50 breaks.
👉 Tap $HBAR
to open the live chart. NFA
🔥 TRADE WITH LOWER FEES
✅ Get a 20% kickback on your Binance trading fees, for life
👇👇👇
Claim your 20% Binance fee kickback here
━━━━━━━━━━
Hedera holders: is 0.07 the bottom or just the next stop? 👇
Follow Crypto Signals and Analysis for daily signals.
#cryptosignals #HBAR #CanGoogleDefendItsCore
⚠️ Crypto is volatile: risk only what you can afford to lose.
103
·
--
弱気相場
翻訳参照
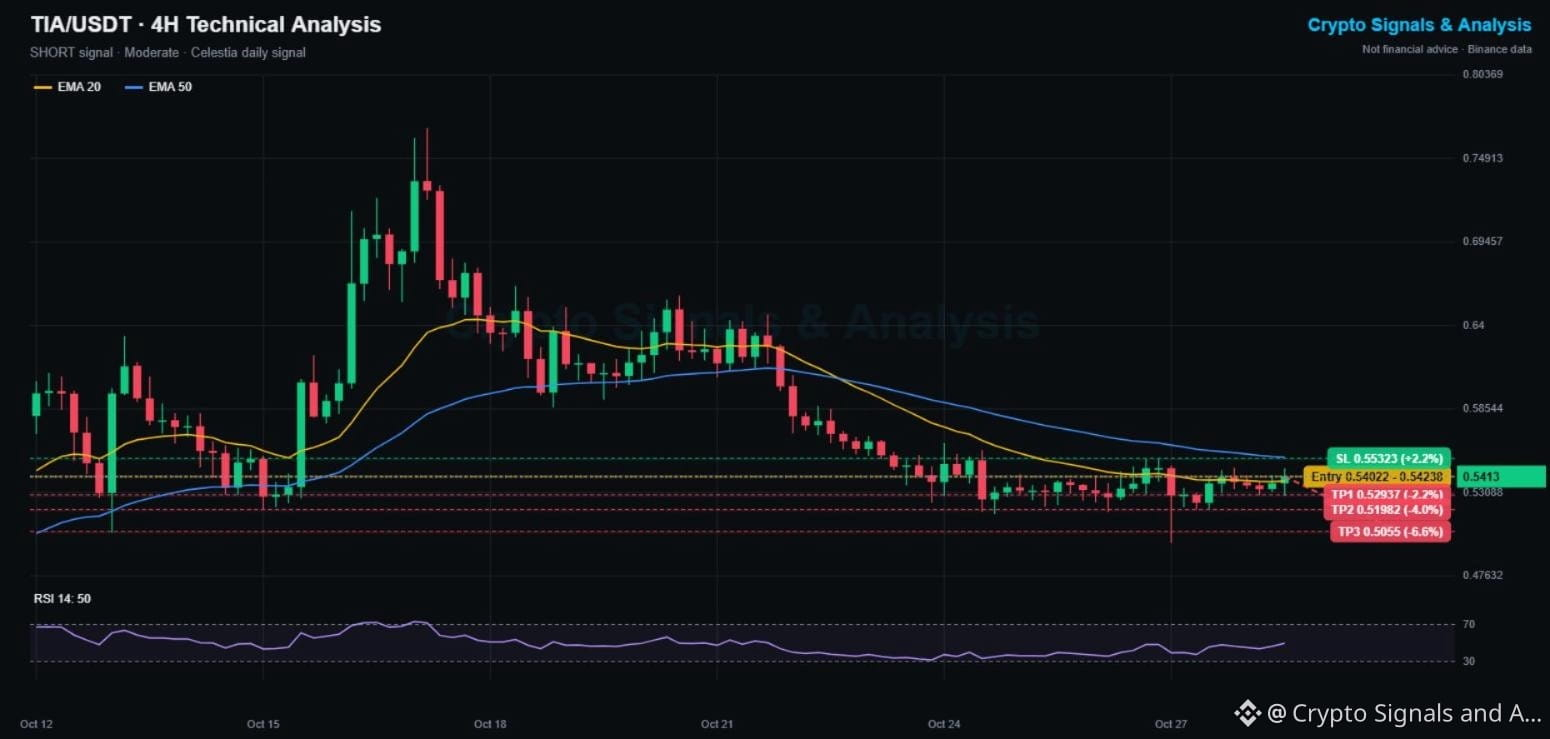
$TIA Price Prediction Today: Celestia Crypto Signal & Technical Analysis 📊
🔴 SHORT | Entry 0.5402 - 0.5424 | TP1 0.5294 | SL 0.5532
👉 Tap $TIA to place your trade fast
Celestia pumped to 0.769 on Oct 17 and has given back 30% since. It is down 14.5% this week, and every bounce now runs into the falling 4H EMA50 at 0.554.
📌 CELESTIA TRADING SIGNAL (Moderate, 3/5 signals agree)
Entry: 0.5402 - 0.5424
Take profit 1: 0.5294 (-2.2%)
Take profit 2: 0.5198 (-4.0%)
Take profit 3: 0.5055 (-6.6%)
Stop loss: 0.5532 (+2.2%)
📊 TIA TECHNICAL ANALYSIS (4H CHART)
TIA has been grinding sideways at 0.52 to 0.55 for 4 days, right under the EMA50 (0.5539). The EMA20 (0.5383) is still sloping down, and RSI sits at a neutral 50. The long wick down to 0.498 on Oct 27 shows there are buyers lower, so TP3 is set just above that zone.
🔑 KEY LEVELS
Support: 0.5300, then 0.4980
Resistance: 0.5539 (EMA50), then 0.5800
📈 Bullish scenario: a 4H close above 0.5532 and the EMA50 breaks the range upward and cancels the short.
📉 Bearish scenario: losing 0.53 sends TIA back to the 0.50 to 0.52 zone.
💡 Bottom line: a range trade under resistance. Tight stop, quick targets.
👉 Tap $TIA
to open the live chart. NFA
🔥 TRADE WITH LOWER FEES
✅ Get a 20% kickback on your Binance trading fees, for life
👇👇👇
{spot}(TIAUSDT)
[Claim your 20% Binance fee kickback here](https://www.binance.com/register?ref=X0NQWZ4N)
━━━━━━━━━━
Celestia: breakdown to 0.50 or a squeeze back to 0.60? 👇
Follow Crypto Signals and Analysis for daily signals.
#cryptosignals #TIA #EarningsSeason
⚠️ Crypto is volatile: risk only what you can afford to lose.
$TIA Price Prediction Today: Celestia Crypto Signal & Technical Analysis 📊
🔴 SHORT | Entry 0.5402 - 0.5424 | TP1 0.5294 | SL 0.5532
👉 Tap $TIA to place your trade fast
Celestia pumped to 0.769 on Oct 17 and has given back 30% since. It is down 14.5% this week, and every bounce now runs into the falling 4H EMA50 at 0.554.
📌 CELESTIA TRADING SIGNAL (Moderate, 3/5 signals agree)
Entry: 0.5402 - 0.5424
Take profit 1: 0.5294 (-2.2%)
Take profit 2: 0.5198 (-4.0%)
Take profit 3: 0.5055 (-6.6%)
Stop loss: 0.5532 (+2.2%)
📊 TIA TECHNICAL ANALYSIS (4H CHART)
TIA has been grinding sideways at 0.52 to 0.55 for 4 days, right under the EMA50 (0.5539). The EMA20 (0.5383) is still sloping down, and RSI sits at a neutral 50. The long wick down to 0.498 on Oct 27 shows there are buyers lower, so TP3 is set just above that zone.
🔑 KEY LEVELS
Support: 0.5300, then 0.4980
Resistance: 0.5539 (EMA50), then 0.5800
📈 Bullish scenario: a 4H close above 0.5532 and the EMA50 breaks the range upward and cancels the short.
📉 Bearish scenario: losing 0.53 sends TIA back to the 0.50 to 0.52 zone.
💡 Bottom line: a range trade under resistance. Tight stop, quick targets.
👉 Tap $TIA
to open the live chart. NFA
🔥 TRADE WITH LOWER FEES
✅ Get a 20% kickback on your Binance trading fees, for life
👇👇👇
Claim your 20% Binance fee kickback here
━━━━━━━━━━
Celestia: breakdown to 0.50 or a squeeze back to 0.60? 👇
Follow Crypto Signals and Analysis for daily signals.
#cryptosignals #TIA #EarningsSeason
⚠️ Crypto is volatile: risk only what you can afford to lose.
188
·
--
ブリッシュ
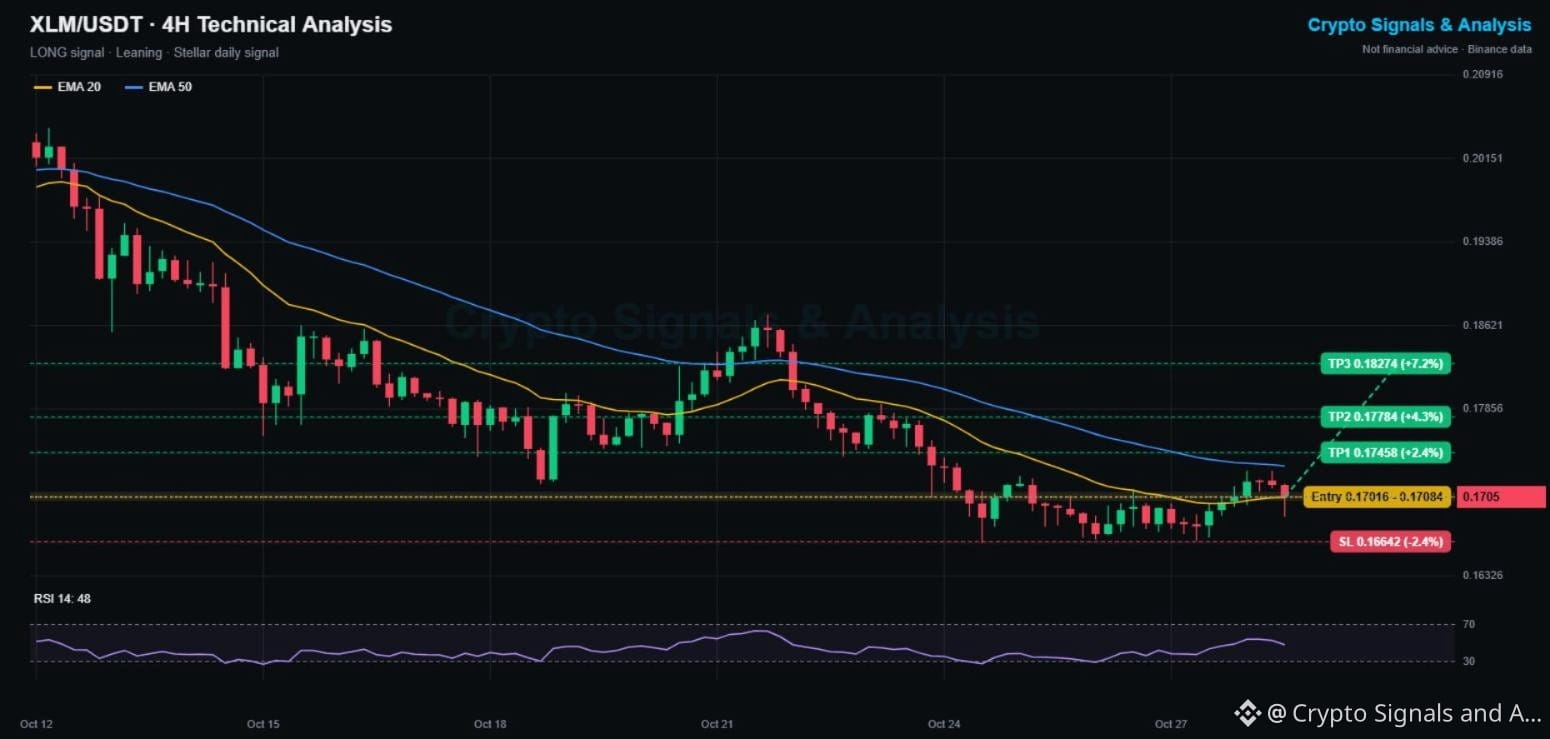
$XLM 本日の価格予測:Stellarの暗号資産シグナル&テクニカル分析 📊
🟢 ロング | エントリー 0.1702~0.1708 | TP1 0.1746 | SL 0.1664
👉 $XLM をタップして、すぐに取引を開始
Stellarは今月18%下落した後、0.1663~0.1665でダブルボトムを形成しました。4時間足のEMA20を回復したばかりで、EMAまでのこの押し目は、リスクを抑えてロングエントリーできる最初のチャンスです。
📌 STELLARのトレードシグナル(ロング寄り、ダブルボトム形成)
エントリー:0.1702~0.1708
利確目標1:0.1746(+2.4%)
利確目標2:0.1778(+4.3%)
利確目標3:0.1827(+7.2%)
損切り:0.1664(-2.4%)
📊 XLMのテクニカル分析(4時間足チャート)
XLMは同じ0.1663の水準から2度反発しており、強いサポートとなっています。価格はEMA20(0.1705)を維持しており、EMA20は上向きに転じています。RSIは48で中立です。EMA50(0.1733)が確認ラインです。この水準を上回って終値を付ければ、ダブルボトムが完成し、0.178~0.183が視野に入ります。
🔑 重要な価格水準
サポート:0.1705(EMA20)、次いで0.1663
レジスタンス:0.1733(EMA50)、次いで0.1786
📈 強気シナリオ:4時間足の終値が0.1733を上回れば、ダブルボトムが確認され、TP2とTP3が目標となります。
📉 弱気シナリオ:0.1663を下回ると、ダブルボトムが崩れます。終値が0.1664を下回れば、このシグナルは無効です。
💡 要点:明確な無効化水準をダブルボトムのすぐ下に置いた、リスクを抑えやすいセットアップです。
👉 $XLM をタップ
してリアルタイムチャートを開きましょう。投資助言ではありません。
🔥 取引手数料を抑えてトレード
✅ Binanceの取引手数料の20%が、期限なしでキャッシュバック
👇👇👇
{spot}(XLMUSDT)
[Claim your 20% Binance fee kickback here](https://www.binance.com/register?ref=X0NQWZ4N)
━━━━━━━━━━
今四半期、StellarとXRPのどちらが決済用コインとして優勢? 👇
毎日のシグナルを受け取るには、Crypto Signals and Analysisをフォローしてください。
#cryptosignals #XLM #CanMicrosoftDeliverOnAI
⚠️ 暗号資産は価格変動が激しいため、失っても問題のない範囲でのみ投資してください。
$XLM 本日の価格予測:Stellarの暗号資産シグナル&テクニカル分析 📊
🟢 ロング | エントリー 0.1702~0.1708 | TP1 0.1746 | SL 0.1664
👉 $XLM をタップして、すぐに取引を開始
Stellarは今月18%下落した後、0.1663~0.1665でダブルボトムを形成しました。4時間足のEMA20を回復したばかりで、EMAまでのこの押し目は、リスクを抑えてロングエントリーできる最初のチャンスです。
📌 STELLARのトレードシグナル(ロング寄り、ダブルボトム形成)
エントリー:0.1702~0.1708
利確目標1:0.1746(+2.4%)
利確目標2:0.1778(+4.3%)
利確目標3:0.1827(+7.2%)
損切り:0.1664(-2.4%)
📊 XLMのテクニカル分析(4時間足チャート)
XLMは同じ0.1663の水準から2度反発しており、強いサポートとなっています。価格はEMA20(0.1705)を維持しており、EMA20は上向きに転じています。RSIは48で中立です。EMA50(0.1733)が確認ラインです。この水準を上回って終値を付ければ、ダブルボトムが完成し、0.178~0.183が視野に入ります。
🔑 重要な価格水準
サポート:0.1705(EMA20)、次いで0.1663
レジスタンス:0.1733(EMA50)、次いで0.1786
📈 強気シナリオ:4時間足の終値が0.1733を上回れば、ダブルボトムが確認され、TP2とTP3が目標となります。
📉 弱気シナリオ:0.1663を下回ると、ダブルボトムが崩れます。終値が0.1664を下回れば、このシグナルは無効です。
💡 要点:明確な無効化水準をダブルボトムのすぐ下に置いた、リスクを抑えやすいセットアップです。
👉 $XLM をタップ
してリアルタイムチャートを開きましょう。投資助言ではありません。
🔥 取引手数料を抑えてトレード
✅ Binanceの取引手数料の20%が、期限なしでキャッシュバック
👇👇👇
Claim your 20% Binance fee kickback here
━━━━━━━━━━
今四半期、StellarとXRPのどちらが決済用コインとして優勢? 👇
毎日のシグナルを受け取るには、Crypto Signals and Analysisをフォローしてください。
#cryptosignals #XLM #CanMicrosoftDeliverOnAI
⚠️ 暗号資産は価格変動が激しいため、失っても問題のない範囲でのみ投資してください。
21
ログインして、さらにコンテンツを読む
厳選トピックで世界の暗号資産トレーダーの仲間入り
⚡️ 暗号資産に関する最新かつ有益な情報が見つかります。
💬 世界最大の暗号資産取引所から信頼されています。
👍 認証を受けたクリエイターから、有益なインサイトを得られます。
メール / 電話番号