

pro trader22
17 投稿

pro trader22
報告
ユーザーをブロック
I am a content creator
取引を発注
9日
1 フォロー
3 フォロワー
1 いいね
投稿
ポートフォリオ
·
--
翻訳参照
🚨🐸 What if $PEPE PE suddenly surged to $0.010 tomorrow? 🚀
Imagine waking up to an incredible green candle and seeing your PEPE holdings skyrocket in value! 💚📈
The PEPE community remains passionate, and the dream of a massive rally continues to capture attention.
Could $PEPE make history someday? What price target are you hoping to see?
👇 How many PEPE tokens are you holding?
⚠️ This is a hypothetical scenario, not a price prediction. Always DYOR.
PEPE
#KOSPIFalls3.53%BackBelow6000 #BinanceWillListPredictPREDICT #
{spot}(PEPEUSDT)
🚨🐸 What if $PEPE PE suddenly surged to $0.010 tomorrow? 🚀
Imagine waking up to an incredible green candle and seeing your PEPE holdings skyrocket in value! 💚📈
The PEPE community remains passionate, and the dream of a massive rally continues to capture attention.
Could $PEPE make history someday? What price target are you hoping to see?
👇 How many PEPE tokens are you holding?
⚠️ This is a hypothetical scenario, not a price prediction. Always DYOR.
PEPE
#KOSPIFalls3.53%BackBelow6000 #BinanceWillListPredictPREDICT #

75
·
--
翻訳参照
$SOL OL break 100$ position...📈📊📉
If anyone analysing $SOL coin suggest me is it a perfect time to buy or not??
Comment below 👇👇👇📊
{spot}(SOLUSDT)
#FedWatch #EarningsSeason #USMidtermElections #BrazilCryptoExchangesMustApplyForLicensesByFriday
$SOL OL break 100$ position...📈📊📉
If anyone analysing $SOL coin suggest me is it a perfect time to buy or not??
Comment below 👇👇👇📊
#FedWatch #EarningsSeason #USMidtermElections #BrazilCryptoExchangesMustApplyForLicensesByFriday
If anyone analysing $SOL coin suggest me is it a perfect time to buy or not??
Comment below 👇👇👇📊
#FedWatch #EarningsSeason #USMidtermElections #BrazilCryptoExchangesMustApplyForLicensesByFriday

68
·
--
翻訳参照
$APR R 130% in just 5 days
Ruling Binance
We added 0.027
Current price 0.06
Gave to my subs Than gave in public with proper analysis why it will go huge everyone printed with me ❤️
Next $HANA most perfect chart falling channel breaking out
Like if you learn and earn with crypto
trader
{alpha}(560x299ad4299da5b2b93fba4c96967b040c7f611099)
{alpha}(560x6261963ebe9ff014aad10ecc3b0238d4d04e8353)
#CanMicrosoftDeliverOnAI #EarningsSeason #CanGoogleDefindItsCore #FOMCWatch #EarningsSeason
$APR R 130% in just 5 days
Ruling Binance
We added 0.027
Current price 0.06
Gave to my subs Than gave in public with proper analysis why it will go huge everyone printed with me ❤️
Next $HANA most perfect chart falling channel breaking out
Like if you learn and earn with crypto
trader
#CanMicrosoftDeliverOnAI #EarningsSeason #CanGoogleDefindItsCore #FOMCWatch #EarningsSeason

73
·
--
翻訳参照
Earnings Season is live on Binance Pick!
Predict who beats expectations this quarter and earn points.👌🏻🍑
My view right now:
Bullish → $AMZN
{stock_us}(AMZN.US)
$GOOGLB
Watching → $MSFTB
What’s your prediction? Drop it + screenshot below 👇
#EarningsSeason #BinancePick
#ThailandLaunchesWORPTStablecoinToQRPaymentApp #BitmineAdds10452ETH
{spot}(GOOGLBUSDT)
{spot}(MSFTBUSDT)
Earnings Season is live on Binance Pick!
Predict who beats expectations this quarter and earn points.👌🏻🍑
My view right now:
Bullish → $AMZN
$GOOGLB
Watching → $MSFTB
What’s your prediction? Drop it + screenshot below 👇
#EarningsSeason #BinancePick
#ThailandLaunchesWORPTStablecoinToQRPaymentApp #BitmineAdds10452ETH
Predict who beats expectations this quarter and earn points.👌🏻🍑
My view right now:
Bullish → $AMZN
$GOOGLB
Watching → $MSFTB
What’s your prediction? Drop it + screenshot below 👇
#EarningsSeason #BinancePick
#ThailandLaunchesWORPTStablecoinToQRPaymentApp #BitmineAdds10452ETH

92
·
--
翻訳参照
$BNB (Binance Coin) is the native token of the BNB Chain ecosystem and is used for transaction fees and other blockchain-related activities.
Technical outlook
Support: Around $728–$732, where buyers may attempt to defend the price.
Resistance: Around $745–$755, where selling pressure may appear.
Bullish scenario: A strong breakout above resistance with increasing trading volume could support further upward movement.
Bearish scenario: A break below support could lead to additional declines.
My view: BNB's short-term outlook is neutral to cautious. An upward move is possible, but it is not confirmed. Watch price action, trading volume, and Bitcoin's direction before making a trading decision.
{spot}(BNBUSDT)
#BinancePick #EarningsSeason #AnthropicTTMRevenueGrewAbout1200% #ArgentineCourtDismissesLIBRACaseAgainstMilei #StrategyMSTRSurpassesNasdaqInMarketCap
$BNB (Binance Coin) is the native token of the BNB Chain ecosystem and is used for transaction fees and other blockchain-related activities.
Technical outlook
Support: Around $728–$732, where buyers may attempt to defend the price.
Resistance: Around $745–$755, where selling pressure may appear.
Bullish scenario: A strong breakout above resistance with increasing trading volume could support further upward movement.
Bearish scenario: A break below support could lead to additional declines.
My view: BNB's short-term outlook is neutral to cautious. An upward move is possible, but it is not confirmed. Watch price action, trading volume, and Bitcoin's direction before making a trading decision.
#BinancePick #EarningsSeason #AnthropicTTMRevenueGrewAbout1200% #ArgentineCourtDismissesLIBRACaseAgainstMilei #StrategyMSTRSurpassesNasdaqInMarketCap

70
·
--
翻訳参照
$PEPE latest analysis
$PEPE to $0.001? Is it really possible, or just a dream? The journey would require a massive rally and a huge market cap. Can PEPE surprise everyone this cycle?
{spot}(PEPEUSDT)
$PEPE latest analysis
$PEPE to $0.001? Is it really possible, or just a dream? The journey would require a massive rally and a huge market cap. Can PEPE surprise everyone this cycle?
$PEPE to $0.001? Is it really possible, or just a dream? The journey would require a massive rally and a huge market cap. Can PEPE surprise everyone this cycle?

49
·
--
翻訳参照
$BTC coin predict
$BTC FINAL BULL TRAP IS OVER.
The market is now entering the cycle-bottom formation phase.
$BTC will dump to $53,000 within the next 12 days before the new cycle begins.
$81K → $73K → $67K → $53K → New Cycle
Save this chart and compare it again in a few weeks.
Turn on notifications. Follow before you’re late.
I’ll post every major update here first.
{spot}(BTCUSDT)
#BinancePick #EarningsSeason #USQ3GDPAndSeptemberPCEDueNextWeek #SouthKoreaDelaysCryptoIncomeTax #DowDrops653Points
$BTC coin predict
$BTC FINAL BULL TRAP IS OVER.
The market is now entering the cycle-bottom formation phase.
$BTC will dump to $53,000 within the next 12 days before the new cycle begins.
$81K → $73K → $67K → $53K → New Cycle
Save this chart and compare it again in a few weeks.
Turn on notifications. Follow before you’re late.
I’ll post every major update here first.
#BinancePick #EarningsSeason #USQ3GDPAndSeptemberPCEDueNextWeek #SouthKoreaDelaysCryptoIncomeTax #DowDrops653Points

52
·
--
翻訳参照
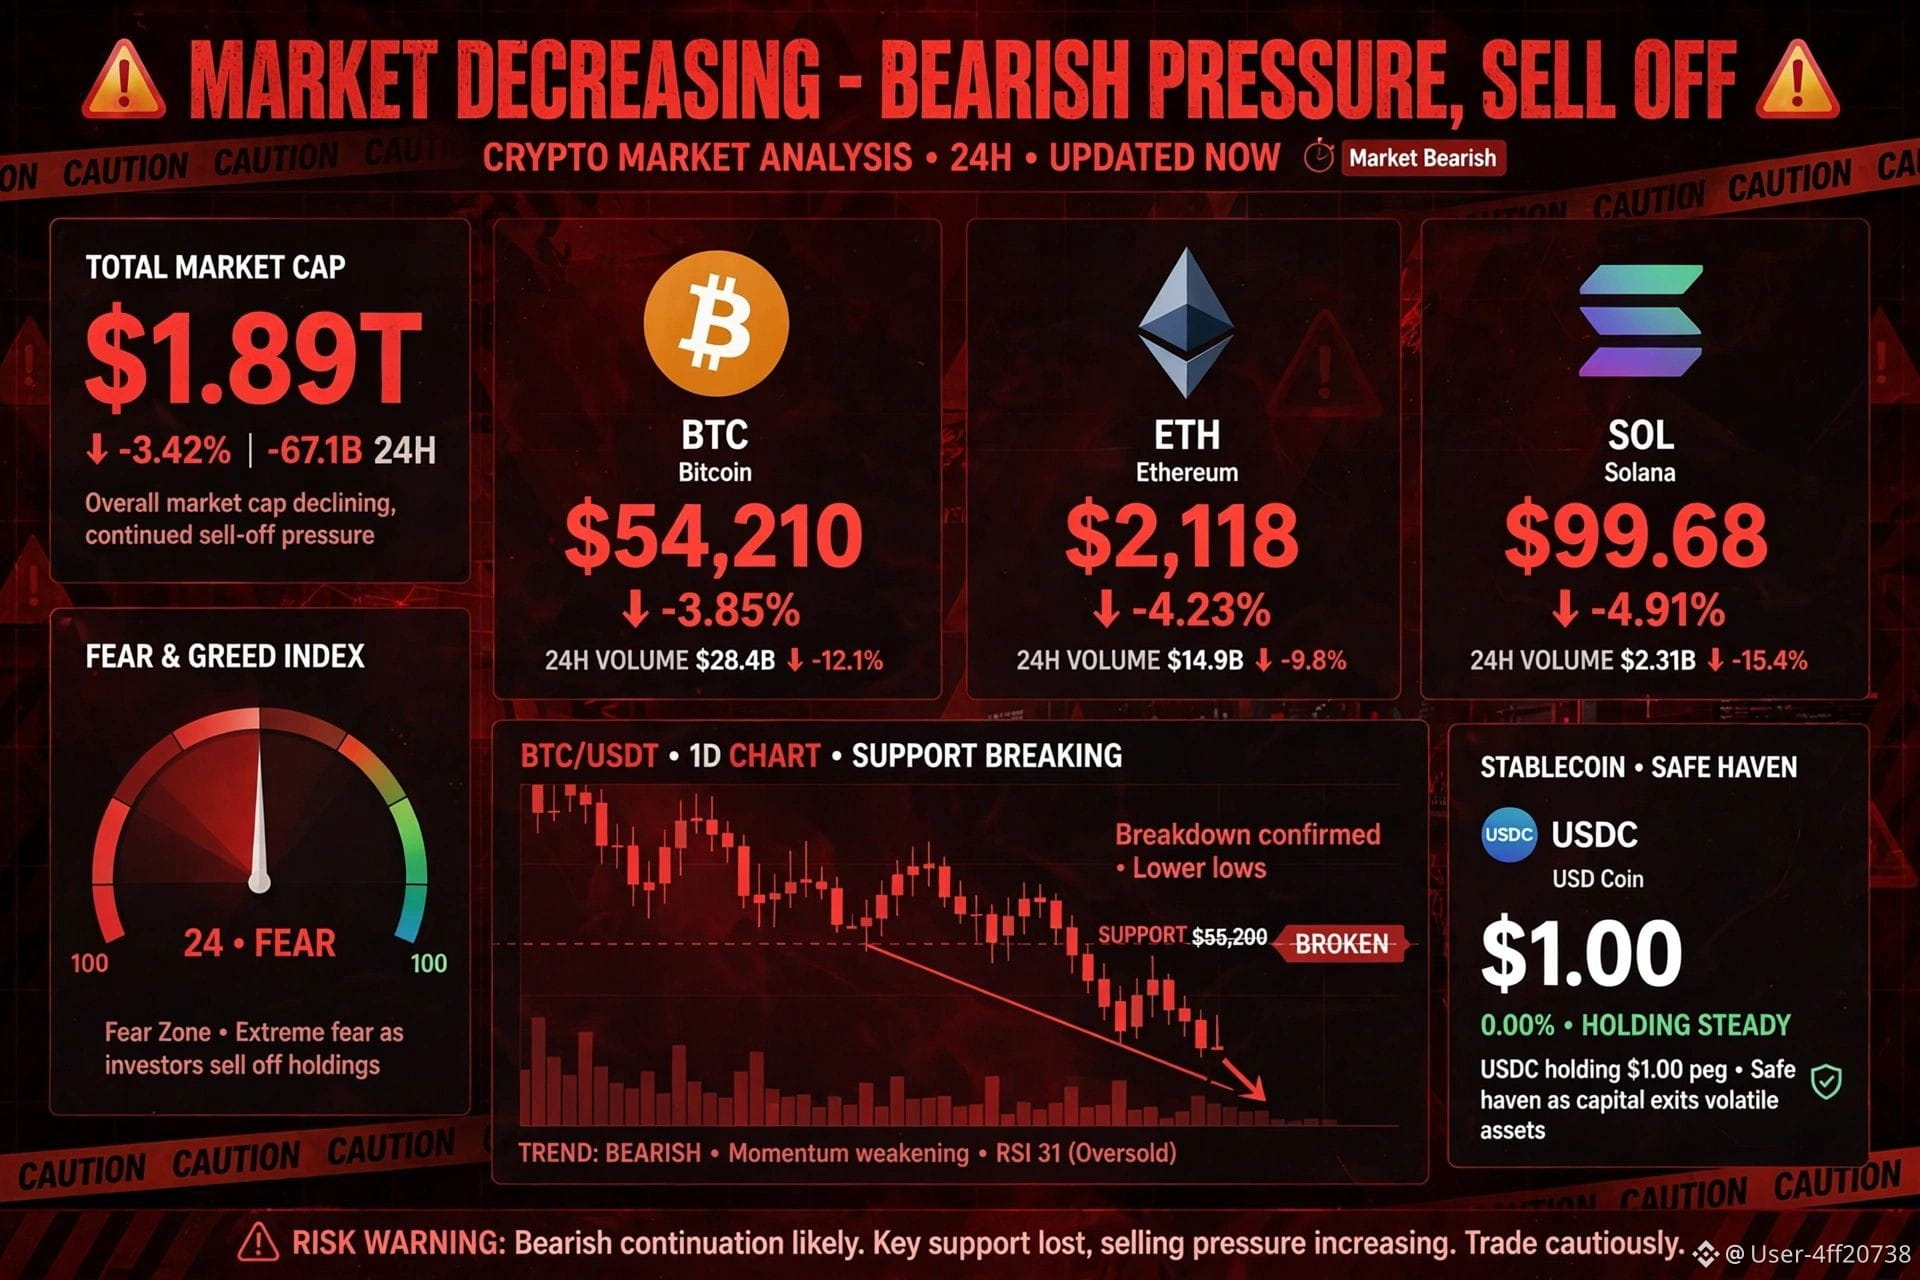
$USDC Coin - Analysis:
Price:$1.00103 pegged to USD (-0.01% 24h)
*lMarket Cap:$71.65B / $72.15B rank #6 Volume:$6.58B - $14.05B 24h
All-time high: $1.040 in May 2021 7e635951acc7
What is it?
USD Coin is a regulated stablecoin issued by Circle, backed 1:1 by fully reserved cash & cash-equivalents, monthly attestation by Big Four auditor. It's not a speculative coin - it's designed to stay at $1. acc7
Analysis:
No volatility:5-day return 0.02%, 1-month 0.1%, YTD 0.01% - that's the point. Flat line chart.
Use case: Payments, trading base pair, DeFi collateral, bridge between TradFi and crypto. Supported on Ethereum, Solana, etc.
Risk:De-peg risk is minimal - last major de-peg was March 2023. Now deemed first of 45 EU significant e-money tokens.
Oversight: EU MiCA oversight starts Nov 12, 2026 - more regulation = more trust. 7e635951acee#BinancePick #EarningsSeason #SouthKoreaDelaysCryptoIncomeTax
Verdict: Don't trade $USDC
{spot}(USDCUSDT)
for profit. Hold USDC when market is dumping (like SOL -4.9% today) to preserve value, then buy dips. It's your cash in crypto.
$USDC Coin - Analysis:
Price:$1.00103 pegged to USD (-0.01% 24h)
*lMarket Cap:$71.65B / $72.15B rank #6 Volume:$6.58B - $14.05B 24h
All-time high: $1.040 in May 2021 7e635951acc7
What is it?
USD Coin is a regulated stablecoin issued by Circle, backed 1:1 by fully reserved cash & cash-equivalents, monthly attestation by Big Four auditor. It's not a speculative coin - it's designed to stay at $1. acc7
Analysis:
No volatility:5-day return 0.02%, 1-month 0.1%, YTD 0.01% - that's the point. Flat line chart.
Use case: Payments, trading base pair, DeFi collateral, bridge between TradFi and crypto. Supported on Ethereum, Solana, etc.
Risk:De-peg risk is minimal - last major de-peg was March 2023. Now deemed first of 45 EU significant e-money tokens.
Oversight: EU MiCA oversight starts Nov 12, 2026 - more regulation = more trust. 7e635951acee#BinancePick #EarningsSeason #SouthKoreaDelaysCryptoIncomeTax
Verdict: Don't trade $USDC
for profit. Hold USDC when market is dumping (like SOL -4.9% today) to preserve value, then buy dips. It's your cash in crypto.
95
·
--
翻訳参照
$SOL
Coin (solana)
Market Trend: Short-term Bearish, with potential for recovery.
Solana (SOL) is a high-performance blockchain known for fast transactions, low fees, and its growing ecosystem of decentralized applications, DeFi, NFTs, and tokenized assets. SOL is trading around $101–$102, facing selling pressure amid broader cryptocurrency market weakness.
Key Price Levels:
- Support: $100–$101
- Secondary Support: $97–$98
- Resistance: $104–$105
- Bullish Target: $108–$113 if resistance breaks with strong buying volume.
- Bearish Scenario: A confirmed breakdown below $100 could push SOL toward $95 or potentially $88–$90.
Technical Outlook: SOL is showing short-term weakness, with momentum indicators reflecting selling pressure. However, a strong bounce from the $100 support zone could trigger a recovery toward $104–$108. A sustained move above $105 would improve the bullish outlook, while a breakdown below support could extend the decline.
Fundamental Outlook: Solana remains a major blockchain ecosystem with applications in decentralized finance, payments, and digital assets. Network adoption, developer activity, institutional demand, Bitcoin's direction, and overall market sentiment will influence its future performance.
Conclusion: SOL is currently at a critical support zone. Holding above $100 could support a relief rally, while losing this level may lead to further downside. Traders should wait for confirmation from price action and trading volume before entering a position.
Disclaimer: This analysis is for informational purposes only and is not financial advice. Cryptocurrency markets are highly volatile. Always conduct your own research and use proper risk management.
{spot}(SOLUSDT)
#BinancePick #EarningsSeason #DowDrops653Points #PepeJumps14%ToLeadAltcoinRebound #IRSPlansLowerTaxDisclosurePenaltiesForCryptoCases
$SOL
Coin (solana)
Market Trend: Short-term Bearish, with potential for recovery.
Solana (SOL) is a high-performance blockchain known for fast transactions, low fees, and its growing ecosystem of decentralized applications, DeFi, NFTs, and tokenized assets. SOL is trading around $101–$102, facing selling pressure amid broader cryptocurrency market weakness.
Key Price Levels:
- Support: $100–$101
- Secondary Support: $97–$98
- Resistance: $104–$105
- Bullish Target: $108–$113 if resistance breaks with strong buying volume.
- Bearish Scenario: A confirmed breakdown below $100 could push SOL toward $95 or potentially $88–$90.
Technical Outlook: SOL is showing short-term weakness, with momentum indicators reflecting selling pressure. However, a strong bounce from the $100 support zone could trigger a recovery toward $104–$108. A sustained move above $105 would improve the bullish outlook, while a breakdown below support could extend the decline.
Fundamental Outlook: Solana remains a major blockchain ecosystem with applications in decentralized finance, payments, and digital assets. Network adoption, developer activity, institutional demand, Bitcoin's direction, and overall market sentiment will influence its future performance.
Conclusion: SOL is currently at a critical support zone. Holding above $100 could support a relief rally, while losing this level may lead to further downside. Traders should wait for confirmation from price action and trading volume before entering a position.
Disclaimer: This analysis is for informational purposes only and is not financial advice. Cryptocurrency markets are highly volatile. Always conduct your own research and use proper risk management.
#BinancePick #EarningsSeason #DowDrops653Points #PepeJumps14%ToLeadAltcoinRebound #IRSPlansLowerTaxDisclosurePenaltiesForCryptoCases

85
·
--
翻訳参照
$SPCX Market Trend: Neutral to Bearish in the short term.
SPCX is a tokenized asset linked to SpaceX equity, with different versions available through tokenization platforms. The Backpack Securities version was trading around $146.77, down approximately 0.40% over 24 hours, while gaining 0.80% over the past seven days. Market activity and price movements remain volatile.
Key Price Levels:
- Support: $138–$142
- Resistance: $155–$160
- Bullish Target: $165–$176 if buying pressure increases.
- Bearish Scenario: A break below $138 could trigger further downside.
Technical Outlook: SPCX is showing mixed momentum, with short-term selling pressure and potential for recovery if buyers regain control. A breakout above resistance with strong volume could improve the outlook, while a breakdown below support may indicate further weakness.
Fundamental Outlook: SPCX provides exposure to SpaceX through tokenization, but investors should verify the specific token issuer, redemption rights, custody arrangements, and trading liquidity before investing. Tokenized assets can carry additional risks beyond ordinary cryptocurrencies.
Conclusion: SPCX may offer upside potential if market sentiment improves and resistance levels break. However, the current outlook calls for caution. Monitor price action, trading volume, and broader market conditions before making a decision.
Disclaimer: This analysis is for informational purposes only and is not financial advice. Cryptocurrency and tokenized securities involve significant risks. Always do your own research before investing.
{stock_us}(SPCX.US)
#BinancePick #EarningsSeason #PepeJumps14%ToLeadAltcoinRebound #IRSPlansLowerTaxDisclosurePenaltiesForCryptoCases
$SPCX Market Trend: Neutral to Bearish in the short term.
SPCX is a tokenized asset linked to SpaceX equity, with different versions available through tokenization platforms. The Backpack Securities version was trading around $146.77, down approximately 0.40% over 24 hours, while gaining 0.80% over the past seven days. Market activity and price movements remain volatile.
Key Price Levels:
- Support: $138–$142
- Resistance: $155–$160
- Bullish Target: $165–$176 if buying pressure increases.
- Bearish Scenario: A break below $138 could trigger further downside.
Technical Outlook: SPCX is showing mixed momentum, with short-term selling pressure and potential for recovery if buyers regain control. A breakout above resistance with strong volume could improve the outlook, while a breakdown below support may indicate further weakness.
Fundamental Outlook: SPCX provides exposure to SpaceX through tokenization, but investors should verify the specific token issuer, redemption rights, custody arrangements, and trading liquidity before investing. Tokenized assets can carry additional risks beyond ordinary cryptocurrencies.
Conclusion: SPCX may offer upside potential if market sentiment improves and resistance levels break. However, the current outlook calls for caution. Monitor price action, trading volume, and broader market conditions before making a decision.
Disclaimer: This analysis is for informational purposes only and is not financial advice. Cryptocurrency and tokenized securities involve significant risks. Always do your own research before investing.
#BinancePick #EarningsSeason #PepeJumps14%ToLeadAltcoinRebound #IRSPlansLowerTaxDisclosurePenaltiesForCryptoCases

2
·
--
$NIL Coin(Nillion)
市場トレンド:慎重ながらも強気。ただし、短期的な反落リスクあり。
Nillion(NIL)は、安全な計算と暗号化データの実現を目的とした、プライバシー重視のブロックチェーンプロジェクトです。この技術は、データ処理を可能にしながら機密情報を保護することを目指しています。
主な価格水準:
- サポート:$0.078~$0.080
- レジスタンス:$0.085~$0.088
- 強気シナリオ:取引高を伴ってレジスタンスを突破した場合、目標価格は$0.090~$0.095。
- 弱気シナリオ:$0.078を下回ると、さらに下落する可能性があります。
テクニカル見通し:買い手が勢いを維持すれば、NILにはさらなる上昇余地があるかもしれません。ただし、短期的な調整や値固めの可能性もあります。トレーダーは取引高、ビットコインの値動き、市場センチメント、プロジェクトの動向を注視する必要があります。
結論:強い買い圧力を伴ってレジスタンスを上抜ければ、NILは上昇する可能性があります。サポートが崩れた場合、価格はさらに下落するおそれがあります。値動きの激しい暗号資産を取引する際は、適切なリスク管理が不可欠です。
免責事項:この分析は情報提供のみを目的としており、金融上の助言ではありません。投資を行う前に、必ずご自身で調査してください。
{spot}(NILUSDT)
#BinancePick #EarningsSeason #DowDrops653Points #DowDrops653Points #IRSPlansLowerTaxDisclosurePenaltiesForCryptoCases
$NIL Coin(Nillion)
市場トレンド:慎重ながらも強気。ただし、短期的な反落リスクあり。
Nillion(NIL)は、安全な計算と暗号化データの実現を目的とした、プライバシー重視のブロックチェーンプロジェクトです。この技術は、データ処理を可能にしながら機密情報を保護することを目指しています。
主な価格水準:
- サポート:$0.078~$0.080
- レジスタンス:$0.085~$0.088
- 強気シナリオ:取引高を伴ってレジスタンスを突破した場合、目標価格は$0.090~$0.095。
- 弱気シナリオ:$0.078を下回ると、さらに下落する可能性があります。
テクニカル見通し:買い手が勢いを維持すれば、NILにはさらなる上昇余地があるかもしれません。ただし、短期的な調整や値固めの可能性もあります。トレーダーは取引高、ビットコインの値動き、市場センチメント、プロジェクトの動向を注視する必要があります。
結論:強い買い圧力を伴ってレジスタンスを上抜ければ、NILは上昇する可能性があります。サポートが崩れた場合、価格はさらに下落するおそれがあります。値動きの激しい暗号資産を取引する際は、適切なリスク管理が不可欠です。
免責事項:この分析は情報提供のみを目的としており、金融上の助言ではありません。投資を行う前に、必ずご自身で調査してください。
#BinancePick #EarningsSeason #DowDrops653Points #DowDrops653Points #IRSPlansLowerTaxDisclosurePenaltiesForCryptoCases

144
·
--
$MU コイン
コイン名:Mu Coin(MU)
現在価格:約0.0127米ドル(2026年10月23日)
市場動向:短期的には弱気です。MU Coinは直近24時間で約3.4%、過去7日間で23.1%下落しました。
市場見通し:MU Coinは、流動性が限られた、投機性の高い小型暗号資産です。価格は急激に上昇または下落する可能性があり、取引量が少ないため、売買が難しくなることがあります。
投資に関する見解:短期的な見通しにはリスクがあります。投資する前に、取引量、流動性、プロジェクトの開発状況、価格動向を注視してください。失っても差し支えない範囲を超える金額の投資は避けてください。
免責事項:これは情報提供を目的とした分析であり、金融アドバイスではありません。市場価格は急速に変動する可能性があります。
{stock_us}(MU.US)
#BinancePick #EarningsSeason #DowDrops653Points #MarketsPriceJust10%ChanceOfFedHikeNextWeek
$MU コイン
コイン名:Mu Coin(MU)
現在価格:約0.0127米ドル(2026年10月23日)
市場動向:短期的には弱気です。MU Coinは直近24時間で約3.4%、過去7日間で23.1%下落しました。
市場見通し:MU Coinは、流動性が限られた、投機性の高い小型暗号資産です。価格は急激に上昇または下落する可能性があり、取引量が少ないため、売買が難しくなることがあります。
投資に関する見解:短期的な見通しにはリスクがあります。投資する前に、取引量、流動性、プロジェクトの開発状況、価格動向を注視してください。失っても差し支えない範囲を超える金額の投資は避けてください。
免責事項:これは情報提供を目的とした分析であり、金融アドバイスではありません。市場価格は急速に変動する可能性があります。
#BinancePick #EarningsSeason #DowDrops653Points #MarketsPriceJust10%ChanceOfFedHikeNextWeek

1
940
·
--
翻訳参照
$ATH Market Analysis**
Aethir (ATH) is gaining attention in the crypto market due to its decentralized GPU cloud computing technology for AI and gaming.
📊 **Latest Price:** Around $0.0062
📈 **24H Change:** Approximately +5.9%
🔥 **Bullish Factor:** Aethir plans to introduce daily ATH token burns from network fees starting in November 2026.
**Market Outlook:** ATH could continue recovering if buying volume remains strong. However, a broader market decline or selling pressure could reverse the gains.
🎯 **Key Levels to Watch:** $0.0055 support and $0.0063 resistance.
⚠️ **Conclusion:** Cautiously bullish, but ATH remains a high-risk altcoin. Monitor volume and actual token burns before making trading decisions.
{alpha}(10xbe0ed4138121ecfc5c0e56b40517da27e6c5226b)
$ATH Market Analysis**
Aethir (ATH) is gaining attention in the crypto market due to its decentralized GPU cloud computing technology for AI and gaming.
📊 **Latest Price:** Around $0.0062
📈 **24H Change:** Approximately +5.9%
🔥 **Bullish Factor:** Aethir plans to introduce daily ATH token burns from network fees starting in November 2026.
**Market Outlook:** ATH could continue recovering if buying volume remains strong. However, a broader market decline or selling pressure could reverse the gains.
🎯 **Key Levels to Watch:** $0.0055 support and $0.0063 resistance.
⚠️ **Conclusion:** Cautiously bullish, but ATH remains a high-risk altcoin. Monitor volume and actual token burns before making trading decisions.

167
·
--
$DOT は、異なるネットワークを接続し、クロスチェーン通信を可能にすることを目的としたブロックチェーンプロジェクトです。
- 強気の見通し:普及の拡大、エコシステムの発展、暗号資産市場のセンチメント改善が、DOTの価格を支える可能性があります。
- 弱気リスク:市場環境の悪化、需要の低迷、または売り圧力により、価格が下落する可能性があります。
- 注目点:取引量、主要なサポートラインとレジスタンスライン、ビットコインの動向、Polkadotネットワークの最新情報。
最新の市場メモ:CoinMarketCapの最新スナップショットでは、DOTは約$1.12で推移しており、短期的には下落圧力が見られます。最近発生したサードパーティ製ウォレットのセキュリティインシデントも、市場センチメントに影響を与えています。DOTが$1.20を上回れば、勢いが改善する可能性があります。一方、$1.10を下回ると、さらなる下落リスクが生じる可能性があります。これらは参考水準であり、結果を保証するものではありません。
CoinMarketCap
+1
結論:DOTには長期的な成長の可能性がありますが、短期的なボラティリティは依然として高い水準にあります。常にリスク管理を行い、ご自身でも調査してください。これは金融アドバイスではありません。
{spot}(DOTUSDT)
$DOT は、異なるネットワークを接続し、クロスチェーン通信を可能にすることを目的としたブロックチェーンプロジェクトです。
- 強気の見通し:普及の拡大、エコシステムの発展、暗号資産市場のセンチメント改善が、DOTの価格を支える可能性があります。
- 弱気リスク:市場環境の悪化、需要の低迷、または売り圧力により、価格が下落する可能性があります。
- 注目点:取引量、主要なサポートラインとレジスタンスライン、ビットコインの動向、Polkadotネットワークの最新情報。
最新の市場メモ:CoinMarketCapの最新スナップショットでは、DOTは約$1.12で推移しており、短期的には下落圧力が見られます。最近発生したサードパーティ製ウォレットのセキュリティインシデントも、市場センチメントに影響を与えています。DOTが$1.20を上回れば、勢いが改善する可能性があります。一方、$1.10を下回ると、さらなる下落リスクが生じる可能性があります。これらは参考水準であり、結果を保証するものではありません。
CoinMarketCap
+1
結論:DOTには長期的な成長の可能性がありますが、短期的なボラティリティは依然として高い水準にあります。常にリスク管理を行い、ご自身でも調査してください。これは金融アドバイスではありません。

178
·
--
翻訳参照
$DASH LARGE MARKET ANALYSIS
📅 Date: 23 October 2026
1. Market Overview
Dash (DASH) is an established cryptocurrency designed to provide fast and affordable digital payments. It focuses on usability, transaction efficiency, and everyday payments.
DASH recently showed positive price momentum, attracting attention from crypto traders. However, traders should monitor trading volume, Bitcoin's direction, and key support and resistance levels before making any decisions.
2. Market Snapshot
• Coin: Dash (DASH)
• Reference Price: $52.92
• Reported 24-Hour Change: +6.79%
• Reported Market Capitalization: $681.51 Million
• Reported 24-Hour Trading Volume: $115.59 Million
• Reported 24-Hour High: $55.65
• Reported 24-Hour Low: $49.42
Note: These figures are a market snapshot from 23 October 2026, not guaranteed live prices.
3. Technical Analysis
DASH has demonstrated positive short-term momentum after moving above an important technical level. The next move depends on whether buyers can maintain control and defend support during a possible price retest.
Important Resistance Levels
Resistance 1: $55.65
This is the reported recent 24-hour high. Sellers could enter this area, so traders should watch whether the price breaks above it with strong volume.
Resistance 2: $56.67
A sustained breakout above the first resistance could bring this level into focus as the next potential upside target.
Important Support Levels
Support 1: $52.90
This is the reported breakout area. Holding above it could help preserve the bullish structure.
Support 2: $52.00
A sustained move below this level could weaken short-term buying momentum.
Lower Support: $48.80
If selling pressure increases significantly, this is another potential area traders may monitor.
4. Why Is DASH Moving?
Several factors may influence DASH's price action:
1. Technical Breakout
A move above an important moving average can attract traders looking for momentum opportunities.
⚠️ Disclaimer: This content is for educational purposes only and is not financial advice.
{spot}(DASHUSDT)
$DASH LARGE MARKET ANALYSIS
📅 Date: 23 October 2026
1. Market Overview
Dash (DASH) is an established cryptocurrency designed to provide fast and affordable digital payments. It focuses on usability, transaction efficiency, and everyday payments.
DASH recently showed positive price momentum, attracting attention from crypto traders. However, traders should monitor trading volume, Bitcoin's direction, and key support and resistance levels before making any decisions.
2. Market Snapshot
• Coin: Dash (DASH)
• Reference Price: $52.92
• Reported 24-Hour Change: +6.79%
• Reported Market Capitalization: $681.51 Million
• Reported 24-Hour Trading Volume: $115.59 Million
• Reported 24-Hour High: $55.65
• Reported 24-Hour Low: $49.42
Note: These figures are a market snapshot from 23 October 2026, not guaranteed live prices.
3. Technical Analysis
DASH has demonstrated positive short-term momentum after moving above an important technical level. The next move depends on whether buyers can maintain control and defend support during a possible price retest.
Important Resistance Levels
Resistance 1: $55.65
This is the reported recent 24-hour high. Sellers could enter this area, so traders should watch whether the price breaks above it with strong volume.
Resistance 2: $56.67
A sustained breakout above the first resistance could bring this level into focus as the next potential upside target.
Important Support Levels
Support 1: $52.90
This is the reported breakout area. Holding above it could help preserve the bullish structure.
Support 2: $52.00
A sustained move below this level could weaken short-term buying momentum.
Lower Support: $48.80
If selling pressure increases significantly, this is another potential area traders may monitor.
4. Why Is DASH Moving?
Several factors may influence DASH's price action:
1. Technical Breakout
A move above an important moving average can attract traders looking for momentum opportunities.
⚠️ Disclaimer: This content is for educational purposes only and is not financial advice.

139
·
--
翻訳参照
$BTC Coin — Medium-Term Analysis
Market update: October 22, 2026
1. Market Overview
Bitcoin (BTC) is showing volatile price action. On October 22, BTC dropped below $82,000 after briefly moving above $84,000, as weakness in global stock markets put pressure on cryptocurrencies. Recent U.S. spot Bitcoin ETF inflows have provided some support, but the market has not confirmed a strong breakout yet.
2. Technical Analysis
Bullish scenario
If BTC reclaims $83,000 and breaks above $85,000, the next potential target is $87,000.
Support zone
$80,800–$81,000 is an important area to watch for buyers.
Bearish scenario
A sustained break below $80,800 could expose support near $77,400 and $76,100.
These are reference levels from the October 22 market analysis, not guaranteed price targets.
3. Medium-Term Outlook
My outlook is neutral to cautiously bullish if BTC holds its key support. Renewed ETF buying could help Bitcoin recover, but global economic uncertainty, oil prices, and interest-rate expectations remain risks. A confirmed move above $85,000 would strengthen the recovery case, while a breakdown below $80,800 would increase downside risk.
Final Verdict
Bitcoin is at an important decision point. Traders should watch the $80,800 support and the $83,000–$85,000 recovery zone before assuming the next major move will be upward.
Risk reminder: Cryptocurrency is highly volatile. Use stop-losses where appropriate and avoid risking money you cannot afford to lose. This analysis is educational, not financial advice.
#BinancePick #TeslaSlides5%PreMarket #KOSPISinks3.52%ToLowestCloseSinceApril #ChinaSeeksToSeize61800BTC
{spot}(BTCUSDT)
$BTC Coin — Medium-Term Analysis
Market update: October 22, 2026
1. Market Overview
Bitcoin (BTC) is showing volatile price action. On October 22, BTC dropped below $82,000 after briefly moving above $84,000, as weakness in global stock markets put pressure on cryptocurrencies. Recent U.S. spot Bitcoin ETF inflows have provided some support, but the market has not confirmed a strong breakout yet.
2. Technical Analysis
Bullish scenario
If BTC reclaims $83,000 and breaks above $85,000, the next potential target is $87,000.
Support zone
$80,800–$81,000 is an important area to watch for buyers.
Bearish scenario
A sustained break below $80,800 could expose support near $77,400 and $76,100.
These are reference levels from the October 22 market analysis, not guaranteed price targets.
3. Medium-Term Outlook
My outlook is neutral to cautiously bullish if BTC holds its key support. Renewed ETF buying could help Bitcoin recover, but global economic uncertainty, oil prices, and interest-rate expectations remain risks. A confirmed move above $85,000 would strengthen the recovery case, while a breakdown below $80,800 would increase downside risk.
Final Verdict
Bitcoin is at an important decision point. Traders should watch the $80,800 support and the $83,000–$85,000 recovery zone before assuming the next major move will be upward.
Risk reminder: Cryptocurrency is highly volatile. Use stop-losses where appropriate and avoid risking money you cannot afford to lose. This analysis is educational, not financial advice.
#BinancePick #TeslaSlides5%PreMarket #KOSPISinks3.52%ToLowestCloseSinceApril #ChinaSeeksToSeize61800BTC

83
ログインして、さらにコンテンツを読む
厳選トピックで世界の暗号資産トレーダーの仲間入り
⚡️ 暗号資産に関する最新かつ有益な情報が見つかります。
💬 世界最大の暗号資産取引所から信頼されています。
👍 認証を受けたクリエイターから、有益なインサイトを得られます。
メール / 電話番号
トレンドトピック
UniswapA16zSeekDeFiExemptionFromIllinoisCryptoTax
閲覧回数 14,580
587人が討論中
暗号資産課税をめぐる議論が激しさを増しています。UniswapとAndreessen Horowitz(a16z)は、イリノイ州が提案する暗号資産税制からDeFiを免除するよう求めています。両者が懸念しているのは、分散型金融プロトコルやカストディを伴わないプラットフォームが不公平な税負担を強いられ、イノベーションが鈍化し、暗号資産の開発がより困難になる可能性があることです。DeFiプラットフォームでは、従来の仲介業者を介さずにデジタル資産を取引・管理できるため、従来型の金融に適用される税制を当てはめると深刻な課題が生じるおそれがあります。規制当局は、公平な課税、投資家保護、イノベーションのバランスを見いだす必要があり、これは米国の暗号資産業界にとって重要な局面となる可能性があります。🚀
主な懸念は、提案されている0.2%の税が、取引利益ではなく取引額を基準に算出されることです。Uniswap、a16z、DeFi Education Fundは、ウォレットからの出金やクロスチェーンブリッジを課税対象から除外するよう求める一方、秘密鍵の記録を保管する義務にも反対しています。イリノイ州は、裁判所の承認を条件に、施行を2027年7月1日まで延期することに同意しました。この結果は、他の米国各州がDeFi課税にどう取り組むかにも影響を及ぼす可能性があります。The Defiant +2
どう思いますか🤔?分散性を守るためにDeFi取引は非課税にすべきでしょうか。それとも、暗号資産プラットフォームも従来の税制に従うべきでしょうか?🤔
#UniswapA16zSeekDeFiExemptionFromIllinoisCryptoTax
Volatile
·いいね:3件
·閲覧回数 121
HKDollarStablecoinHKDAPToLaunchOnSolana
閲覧回数 9,427
341人が討論中
$1.5BInLeveragedCryptoBetsLiquidated
閲覧回数 25,989
219人が討論中