
Arjun 55
327 投稿

Arjun 55
報告
ユーザーをブロック
start your journey with binance and grow your knowledge and mindset you will be success your dream journey
取引を発注
低高頻度トレーダー
1.8年
22 フォロー
48 フォロワー
62 いいね
投稿
ポートフォリオ
·
--
翻訳参照
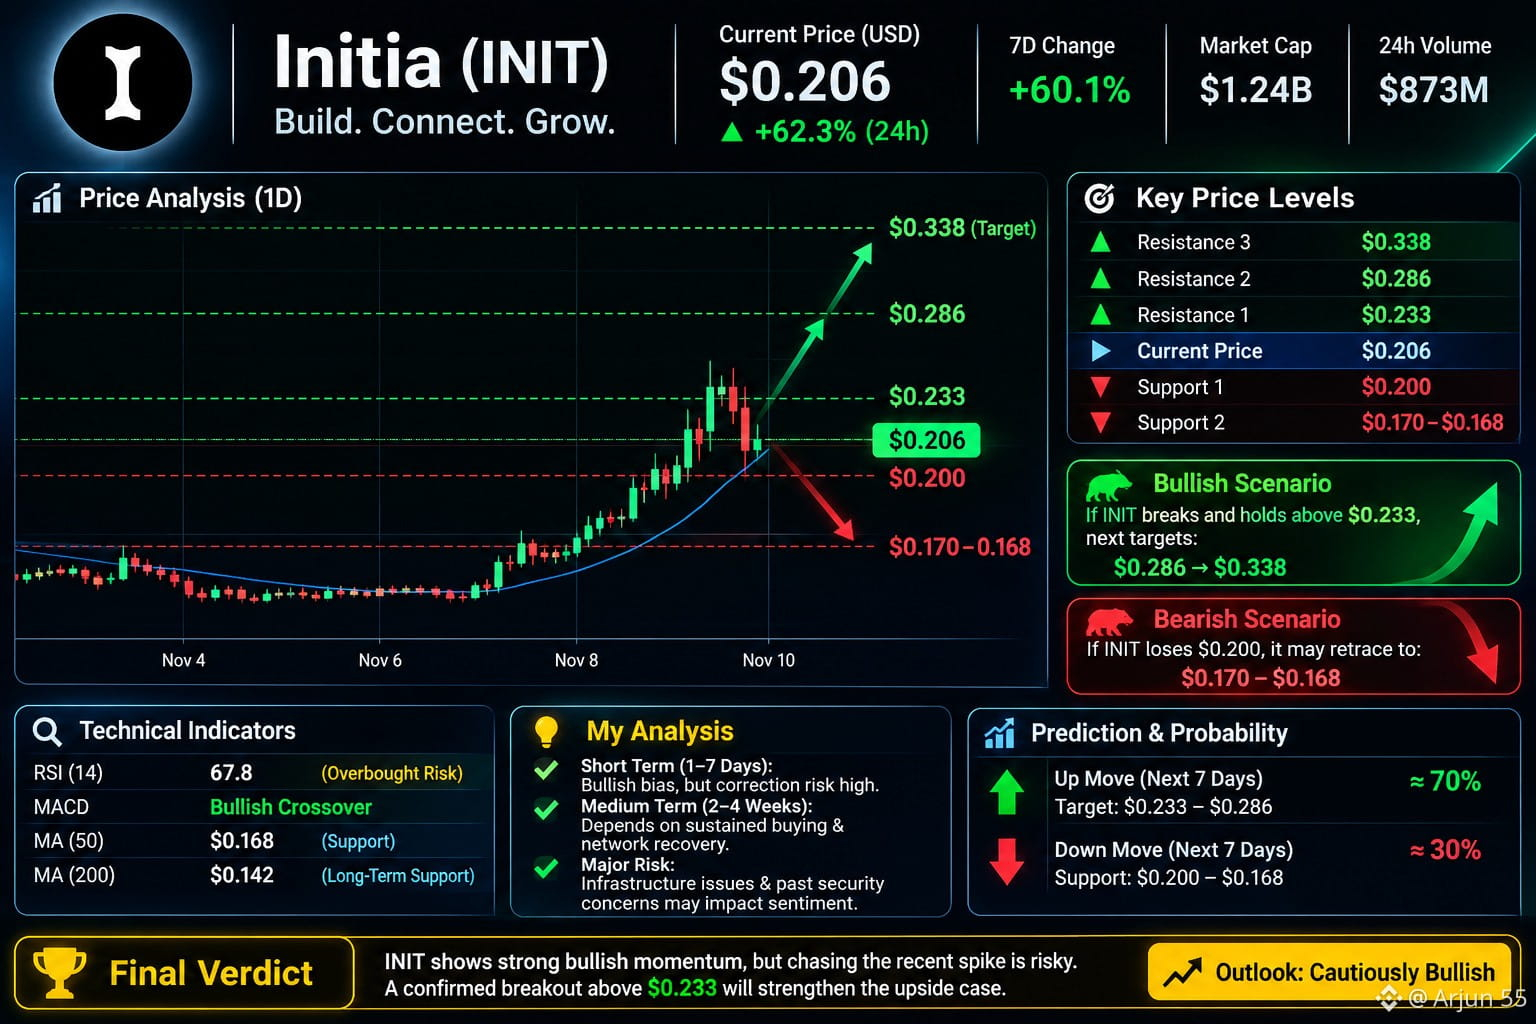
$INIT INIT (Ini tia) Token – Recent Analysis & Future Prediction
As of 10 November 2026, INIT is showing a strong recovery.
Market snapshot (USD)
Current price: approximately $0.20–$0.21
24-hour gain: approximately 58–71%
7-day gain: approximately 57–64%
RSI: approximately 67–69, indicating potentially overbought conditions.
Important price levels
Level Price (USD)
First resistance $0.215–0.216
Second resistance $0.233
Major resistance $0.286
Strong upside target $0.338
First support $0.200
Strong support $0.170–0.168
Future movement prediction
If INIT breaks and sustains above $0.233, the next possible targets are $0.286 and $0.338.
If INIT loses $0.200, it could retrace towards $0.170–$0.168.
My analysis
Short term (1–7 days): Bullish bias, but correction risk is high.
Medium term (2–4 weeks): Depends on sustained buying and network recovery.
Major risk: Recent rollup infrastructure disruption and earlier security concerns could affect investor confidence.
My verdict: INIT has bullish momentum, but chasing the recent sharp rise is risky. A confirmed breakout above $0.233 would strengthen the bullish case.
#INIT #QI #one #CPIWatch #USJobData
{spot}(INITUSDT)
{spot}(QIUSDT)
{spot}(ONEUSDT)
$INIT INIT (Ini tia) Token – Recent Analysis & Future Prediction
As of 10 November 2026, INIT is showing a strong recovery.
Market snapshot (USD)
Current price: approximately $0.20–$0.21
24-hour gain: approximately 58–71%
7-day gain: approximately 57–64%
RSI: approximately 67–69, indicating potentially overbought conditions.
Important price levels
Level Price (USD)
First resistance $0.215–0.216
Second resistance $0.233
Major resistance $0.286
Strong upside target $0.338
First support $0.200
Strong support $0.170–0.168
Future movement prediction
If INIT breaks and sustains above $0.233, the next possible targets are $0.286 and $0.338.
If INIT loses $0.200, it could retrace towards $0.170–$0.168.
My analysis
Short term (1–7 days): Bullish bias, but correction risk is high.
Medium term (2–4 weeks): Depends on sustained buying and network recovery.
Major risk: Recent rollup infrastructure disruption and earlier security concerns could affect investor confidence.
My verdict: INIT has bullish momentum, but chasing the recent sharp rise is risky. A confirmed breakout above $0.233 would strengthen the bullish case.
#INIT #QI #one #CPIWatch #USJobData
As of 10 November 2026, INIT is showing a strong recovery.
Market snapshot (USD)
Current price: approximately $0.20–$0.21
24-hour gain: approximately 58–71%
7-day gain: approximately 57–64%
RSI: approximately 67–69, indicating potentially overbought conditions.
Important price levels
Level Price (USD)
First resistance $0.215–0.216
Second resistance $0.233
Major resistance $0.286
Strong upside target $0.338
First support $0.200
Strong support $0.170–0.168
Future movement prediction
If INIT breaks and sustains above $0.233, the next possible targets are $0.286 and $0.338.
If INIT loses $0.200, it could retrace towards $0.170–$0.168.
My analysis
Short term (1–7 days): Bullish bias, but correction risk is high.
Medium term (2–4 weeks): Depends on sustained buying and network recovery.
Major risk: Recent rollup infrastructure disruption and earlier security concerns could affect investor confidence.
My verdict: INIT has bullish momentum, but chasing the recent sharp rise is risky. A confirmed breakout above $0.233 would strengthen the bullish case.
#INIT #QI #one #CPIWatch #USJobData
224
·
--
翻訳参照
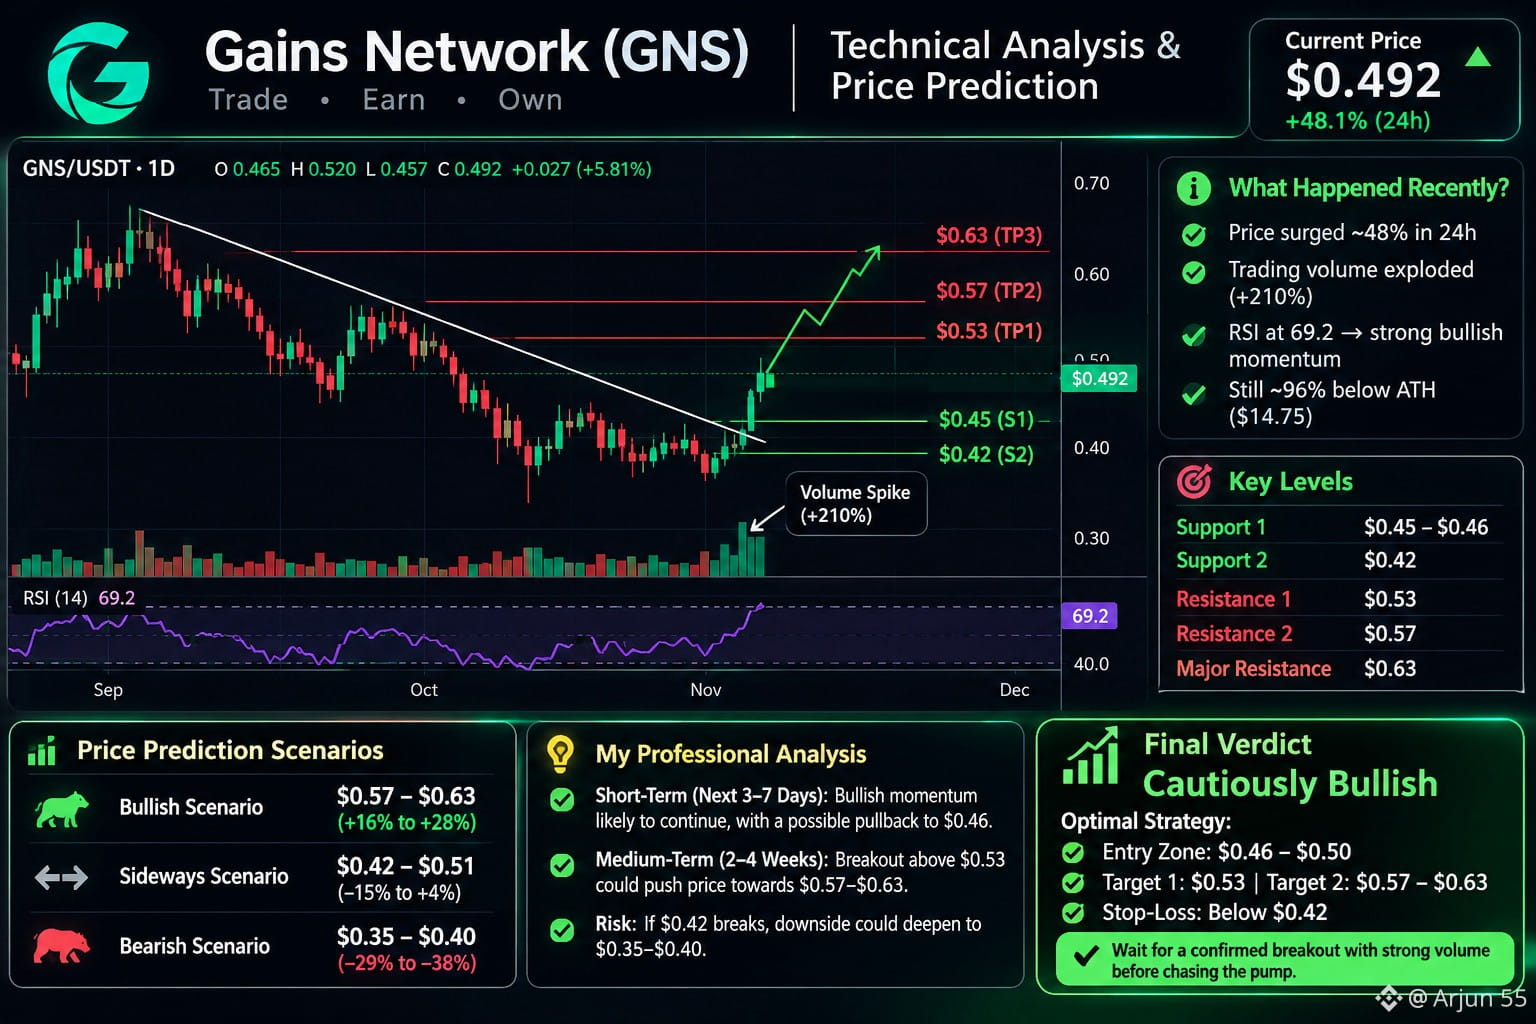
$GNS Gains Network (GNS) – Price Analysis & Prediction
Current price: Approximately $0.48–$0.51 (November 9, 2026).
What happened recently?
GNS surged approximately 48% in 24 hours.
Trading volume increased sharply, indicating strong buying activity.
However, the token remains around 96% below its all-time high.
RSI is around 60, showing positive but not yet extreme momentum.
Important price levels
Level Price (USD)
Support 1 $0.45–0.46
Support 2 $0.42
Resistance 1 $0.50–0.51
Resistance 2 $0.53
Major resistance $0.57
Future prediction
These are scenario estimates, not guaranteed targets.
Scenario Possible price
Bullish $0.57–$0.63
Sideways $0.42–$0.51
Bearish $0.35–$0.40
My assessment:
Next few days: Bullish momentum, but a pullback is possible.
Next 2–4 weeks: Potential upside if GNS breaks and holds above $0.51.
If it loses $0.42, downside risk increases considerably.
Final verdict
I would not chase the recent 48% pump. A sustained breakout above $0.51 with strong volume would strengthen the bullish case.
#GNS #TST #ARB #CPIWatch #USJobData
{spot}(GNSUSDT)
{spot}(TSTUSDT)
{spot}(ARBUSDT)
$GNS Gains Network (GNS) – Price Analysis & Prediction
Current price: Approximately $0.48–$0.51 (November 9, 2026).
What happened recently?
GNS surged approximately 48% in 24 hours.
Trading volume increased sharply, indicating strong buying activity.
However, the token remains around 96% below its all-time high.
RSI is around 60, showing positive but not yet extreme momentum.
Important price levels
Level Price (USD)
Support 1 $0.45–0.46
Support 2 $0.42
Resistance 1 $0.50–0.51
Resistance 2 $0.53
Major resistance $0.57
Future prediction
These are scenario estimates, not guaranteed targets.
Scenario Possible price
Bullish $0.57–$0.63
Sideways $0.42–$0.51
Bearish $0.35–$0.40
My assessment:
Next few days: Bullish momentum, but a pullback is possible.
Next 2–4 weeks: Potential upside if GNS breaks and holds above $0.51.
If it loses $0.42, downside risk increases considerably.
Final verdict
I would not chase the recent 48% pump. A sustained breakout above $0.51 with strong volume would strengthen the bullish case.
#GNS #TST #ARB #CPIWatch #USJobData
Current price: Approximately $0.48–$0.51 (November 9, 2026).
What happened recently?
GNS surged approximately 48% in 24 hours.
Trading volume increased sharply, indicating strong buying activity.
However, the token remains around 96% below its all-time high.
RSI is around 60, showing positive but not yet extreme momentum.
Important price levels
Level Price (USD)
Support 1 $0.45–0.46
Support 2 $0.42
Resistance 1 $0.50–0.51
Resistance 2 $0.53
Major resistance $0.57
Future prediction
These are scenario estimates, not guaranteed targets.
Scenario Possible price
Bullish $0.57–$0.63
Sideways $0.42–$0.51
Bearish $0.35–$0.40
My assessment:
Next few days: Bullish momentum, but a pullback is possible.
Next 2–4 weeks: Potential upside if GNS breaks and holds above $0.51.
If it loses $0.42, downside risk increases considerably.
Final verdict
I would not chase the recent 48% pump. A sustained breakout above $0.51 with strong volume would strengthen the bullish case.
#GNS #TST #ARB #CPIWatch #USJobData
325
·
--
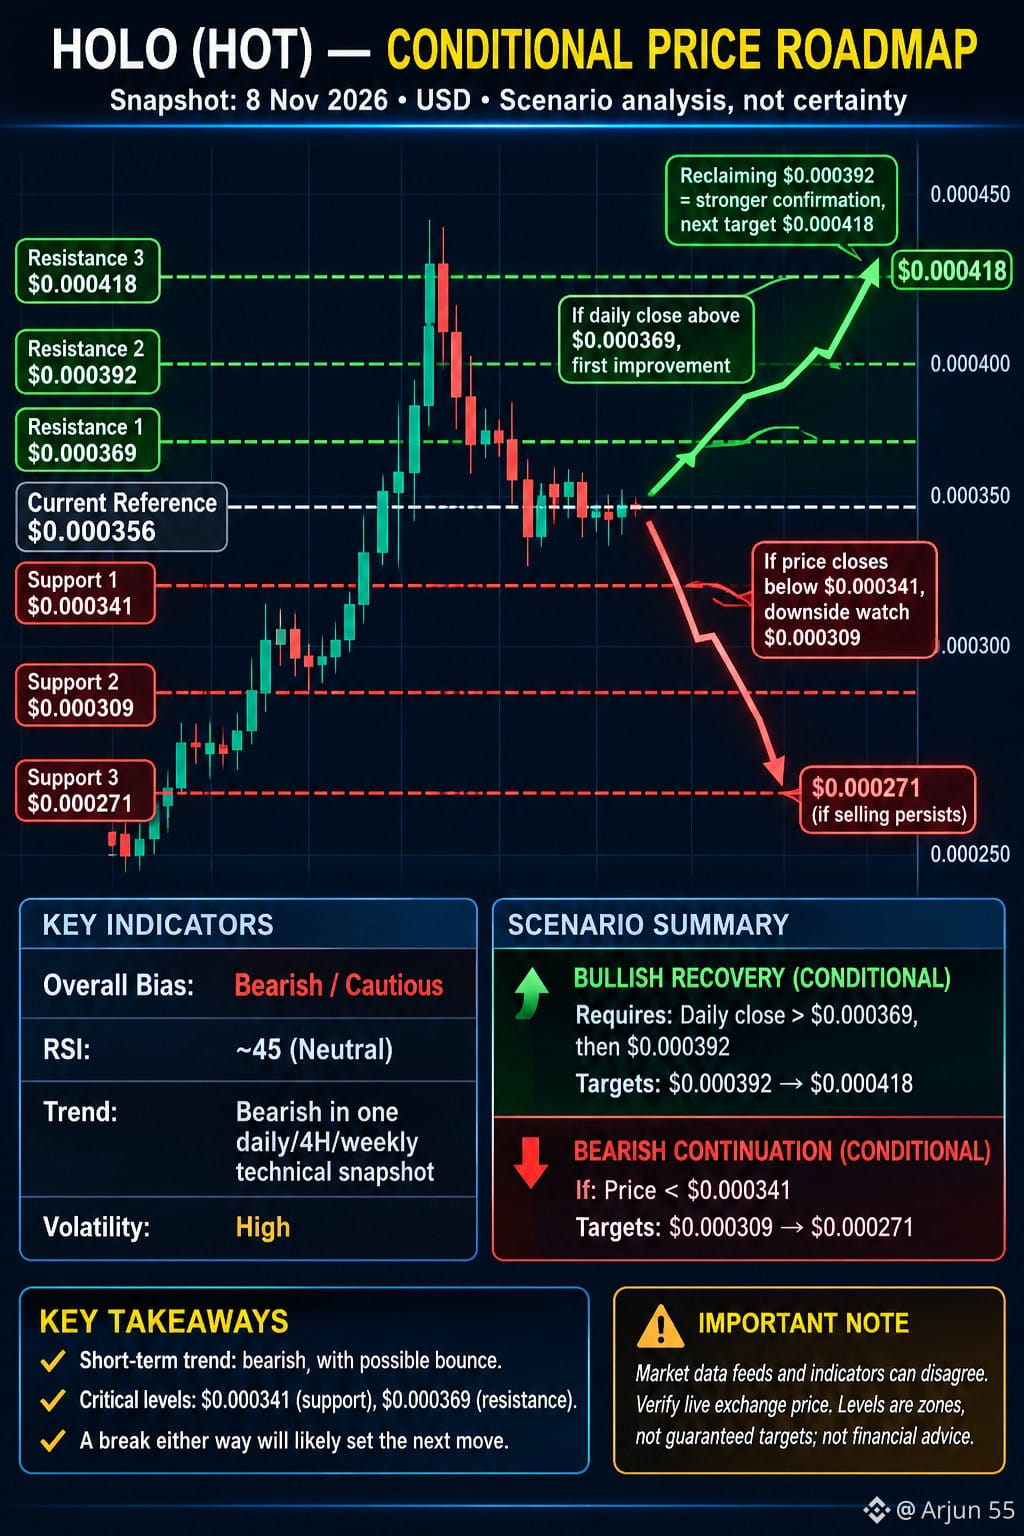
$HOT Holo (HOT) – 最近のパフォーマンスと今後の価格予測
HOLO (HOT)
私の分析方法:最近の価格変動、買い圧力と売り圧力、サポートとレジスタンス、そして上昇または下落する可能性を評価します。
重要なのは、HOTが回復に向けて動き始めているのか、それとも下落トレンドが続いているのかという点です。価格が上昇しただけでは、トレンドが反転したとは言えません。
最近の市場パフォーマンス
2026年11月8日時点で、市場データでは価格に食い違いが見られます。
情報源 HOT価格 24時間の変動率
$0.0003538 -3.88%
Investing.com $0.000462 +26.96%
$0.0004778 +33.72%
これらの差は大きいため、取引前に実際のHOT/USDT取引所価格を確認してください。
重要なテクニカル水準
分析を基準にすると、以下のとおりです。
水準 価格
サポート1 $0.000361
サポート2 $0.000307
レジスタンス1 $0.000383
$0.000383を上回る水準を維持できれば、強気の見通しは改善するでしょう。$0.000307を割り込むと、下落リスクが高まります。
今後の値動き予測
強気シナリオ:買い手がサポートを守り、レジスタンスを上抜ければ、再び回復が始まる可能性があります。
横ばいシナリオ:買い手と売り手の均衡を探るなかで、HOTはもみ合いとなります。
弱気シナリオ:サポートが崩れ、さらに下落します。
重要な注意点:Investing.comの11月8日時点のデータでは、RSIは約84.9とされており、買われ過ぎの状態を示しています。強い上昇局面でも、反落する可能性があります。
私の見解
HOTを現時点で確実な買いとは判断しません。特に、取引高を伴って価格が持続的にブレイクアウトするなど、価格による確認を待ちます。
#HOT #BMT #ACT #CPIWatch #USJobData
{spot}(HOTUSDT)
{spot}(BMTUSDT)
{spot}(ACTUSDT)
$HOT Holo (HOT) – 最近のパフォーマンスと今後の価格予測
HOLO (HOT)
私の分析方法:最近の価格変動、買い圧力と売り圧力、サポートとレジスタンス、そして上昇または下落する可能性を評価します。
重要なのは、HOTが回復に向けて動き始めているのか、それとも下落トレンドが続いているのかという点です。価格が上昇しただけでは、トレンドが反転したとは言えません。
最近の市場パフォーマンス
2026年11月8日時点で、市場データでは価格に食い違いが見られます。
情報源 HOT価格 24時間の変動率
$0.0003538 -3.88%
Investing.com $0.000462 +26.96%
$0.0004778 +33.72%
これらの差は大きいため、取引前に実際のHOT/USDT取引所価格を確認してください。
重要なテクニカル水準
分析を基準にすると、以下のとおりです。
水準 価格
サポート1 $0.000361
サポート2 $0.000307
レジスタンス1 $0.000383
$0.000383を上回る水準を維持できれば、強気の見通しは改善するでしょう。$0.000307を割り込むと、下落リスクが高まります。
今後の値動き予測
強気シナリオ:買い手がサポートを守り、レジスタンスを上抜ければ、再び回復が始まる可能性があります。
横ばいシナリオ:買い手と売り手の均衡を探るなかで、HOTはもみ合いとなります。
弱気シナリオ:サポートが崩れ、さらに下落します。
重要な注意点:Investing.comの11月8日時点のデータでは、RSIは約84.9とされており、買われ過ぎの状態を示しています。強い上昇局面でも、反落する可能性があります。
私の見解
HOTを現時点で確実な買いとは判断しません。特に、取引高を伴って価格が持続的にブレイクアウトするなど、価格による確認を待ちます。
#HOT #BMT #ACT #CPIWatch #USJobData
HOLO (HOT)
私の分析方法:最近の価格変動、買い圧力と売り圧力、サポートとレジスタンス、そして上昇または下落する可能性を評価します。
重要なのは、HOTが回復に向けて動き始めているのか、それとも下落トレンドが続いているのかという点です。価格が上昇しただけでは、トレンドが反転したとは言えません。
最近の市場パフォーマンス
2026年11月8日時点で、市場データでは価格に食い違いが見られます。
情報源 HOT価格 24時間の変動率
$0.0003538 -3.88%
Investing.com $0.000462 +26.96%
$0.0004778 +33.72%
これらの差は大きいため、取引前に実際のHOT/USDT取引所価格を確認してください。
重要なテクニカル水準
分析を基準にすると、以下のとおりです。
水準 価格
サポート1 $0.000361
サポート2 $0.000307
レジスタンス1 $0.000383
$0.000383を上回る水準を維持できれば、強気の見通しは改善するでしょう。$0.000307を割り込むと、下落リスクが高まります。
今後の値動き予測
強気シナリオ:買い手がサポートを守り、レジスタンスを上抜ければ、再び回復が始まる可能性があります。
横ばいシナリオ:買い手と売り手の均衡を探るなかで、HOTはもみ合いとなります。
弱気シナリオ:サポートが崩れ、さらに下落します。
重要な注意点:Investing.comの11月8日時点のデータでは、RSIは約84.9とされており、買われ過ぎの状態を示しています。強い上昇局面でも、反落する可能性があります。
私の見解
HOTを現時点で確実な買いとは判断しません。特に、取引高を伴って価格が持続的にブレイクアウトするなど、価格による確認を待ちます。
#HOT #BMT #ACT #CPIWatch #USJobData
134
·
--
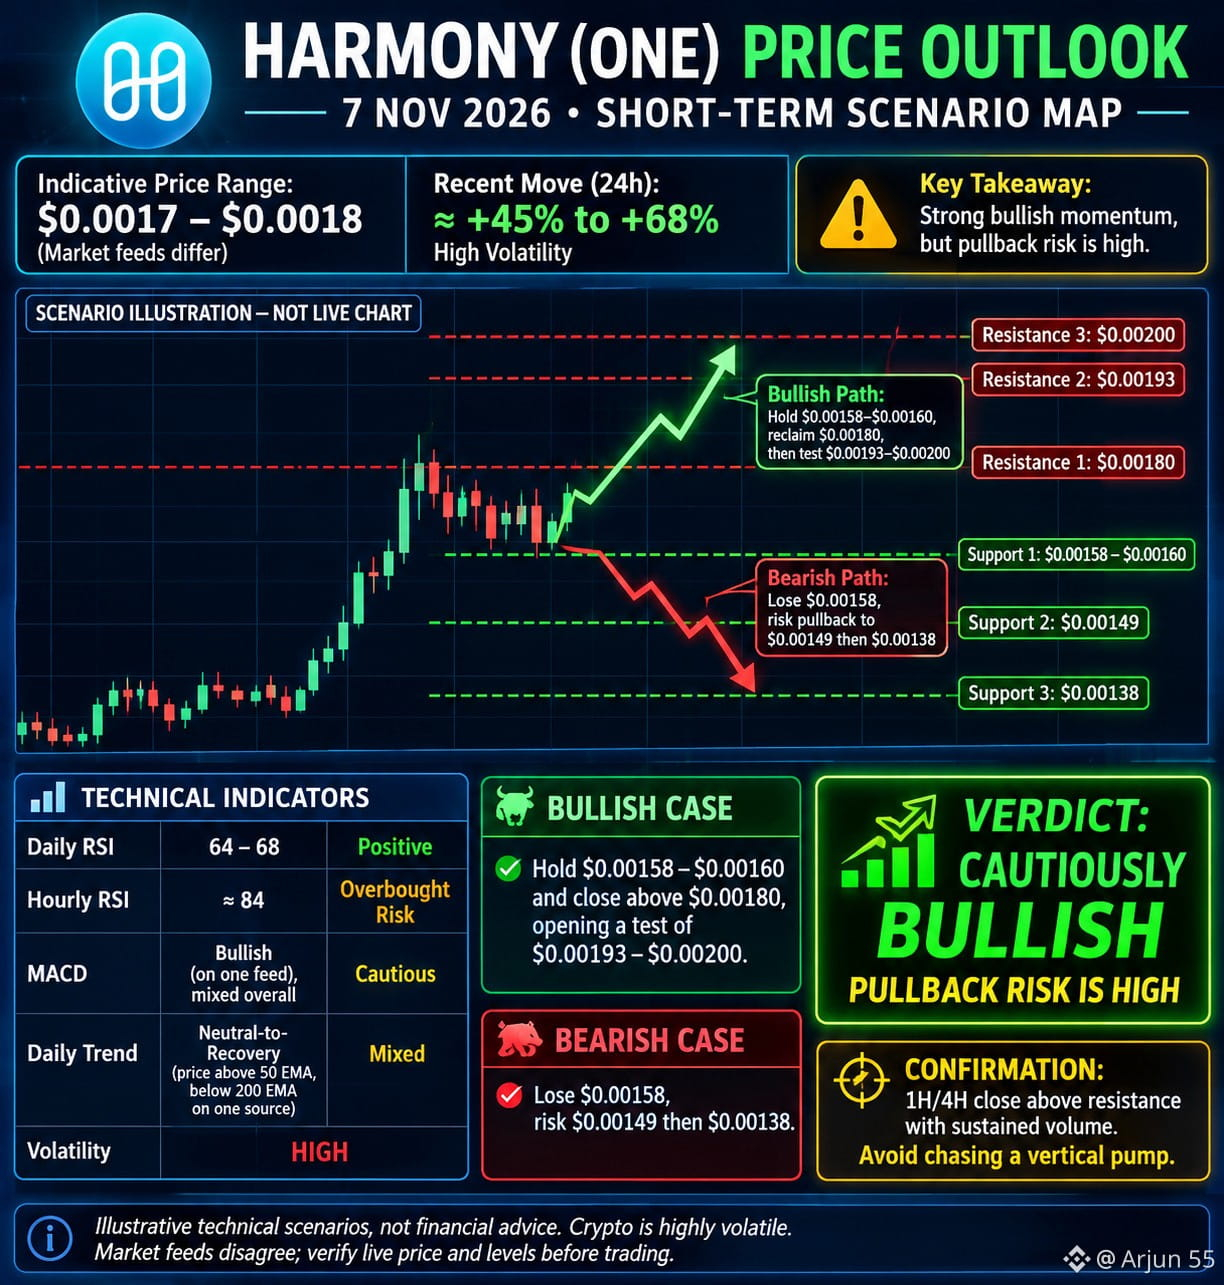
$ONE Harmony(ONE)— テクニカル分析
Harmony(ONE)
$0.001712
24時間で約+56.59%
最近の値動き
価格が大きく上抜け。
取引量が大幅に増加。
現在、短期的には買い手が優勢。
価格の変動率は依然として非常に高い。
テクニカル指標
指標 数値 シグナル
RSI(日足) 63.84 強気
RSI(時間足) 83.99 買われすぎ
MACD 強気 買い
ADX(時間足) 51.51 強いトレンド
重要な価格水準
水準 USD
サポート $0.00175
下値サポート $0.00169
レジスタンス $0.00188
次のレジスタンス $0.00190–0.00201
私の予測
今後数時間:上昇が続く可能性があるものの、調整リスクは高い。
今後24時間:価格が$0.00175を上回って維持できれば強気。
$0.00190を上抜け:さらなる上昇につながる可能性。
$0.00169を下回る:弱気の警告。
最終判断:上昇優勢。ただし、急騰に飛び乗るのは避けましょう。確認を待つか、押し目を待ちましょう。
#one #QNTB #ACT #CPIWatch #USJobData
{spot}(ONEUSDT)
{spot}(QNTBUSDT)
{spot}(ACTUSDT)
$ONE Harmony(ONE)— テクニカル分析
Harmony(ONE)
$0.001712
24時間で約+56.59%
最近の値動き
価格が大きく上抜け。
取引量が大幅に増加。
現在、短期的には買い手が優勢。
価格の変動率は依然として非常に高い。
テクニカル指標
指標 数値 シグナル
RSI(日足) 63.84 強気
RSI(時間足) 83.99 買われすぎ
MACD 強気 買い
ADX(時間足) 51.51 強いトレンド
重要な価格水準
水準 USD
サポート $0.00175
下値サポート $0.00169
レジスタンス $0.00188
次のレジスタンス $0.00190–0.00201
私の予測
今後数時間:上昇が続く可能性があるものの、調整リスクは高い。
今後24時間:価格が$0.00175を上回って維持できれば強気。
$0.00190を上抜け:さらなる上昇につながる可能性。
$0.00169を下回る:弱気の警告。
最終判断:上昇優勢。ただし、急騰に飛び乗るのは避けましょう。確認を待つか、押し目を待ちましょう。
#one #QNTB #ACT #CPIWatch #USJobData
Harmony(ONE)
$0.001712
24時間で約+56.59%
最近の値動き
価格が大きく上抜け。
取引量が大幅に増加。
現在、短期的には買い手が優勢。
価格の変動率は依然として非常に高い。
テクニカル指標
指標 数値 シグナル
RSI(日足) 63.84 強気
RSI(時間足) 83.99 買われすぎ
MACD 強気 買い
ADX(時間足) 51.51 強いトレンド
重要な価格水準
水準 USD
サポート $0.00175
下値サポート $0.00169
レジスタンス $0.00188
次のレジスタンス $0.00190–0.00201
私の予測
今後数時間:上昇が続く可能性があるものの、調整リスクは高い。
今後24時間:価格が$0.00175を上回って維持できれば強気。
$0.00190を上抜け:さらなる上昇につながる可能性。
$0.00169を下回る:弱気の警告。
最終判断:上昇優勢。ただし、急騰に飛び乗るのは避けましょう。確認を待つか、押し目を待ちましょう。
#one #QNTB #ACT #CPIWatch #USJobData
193
·
--
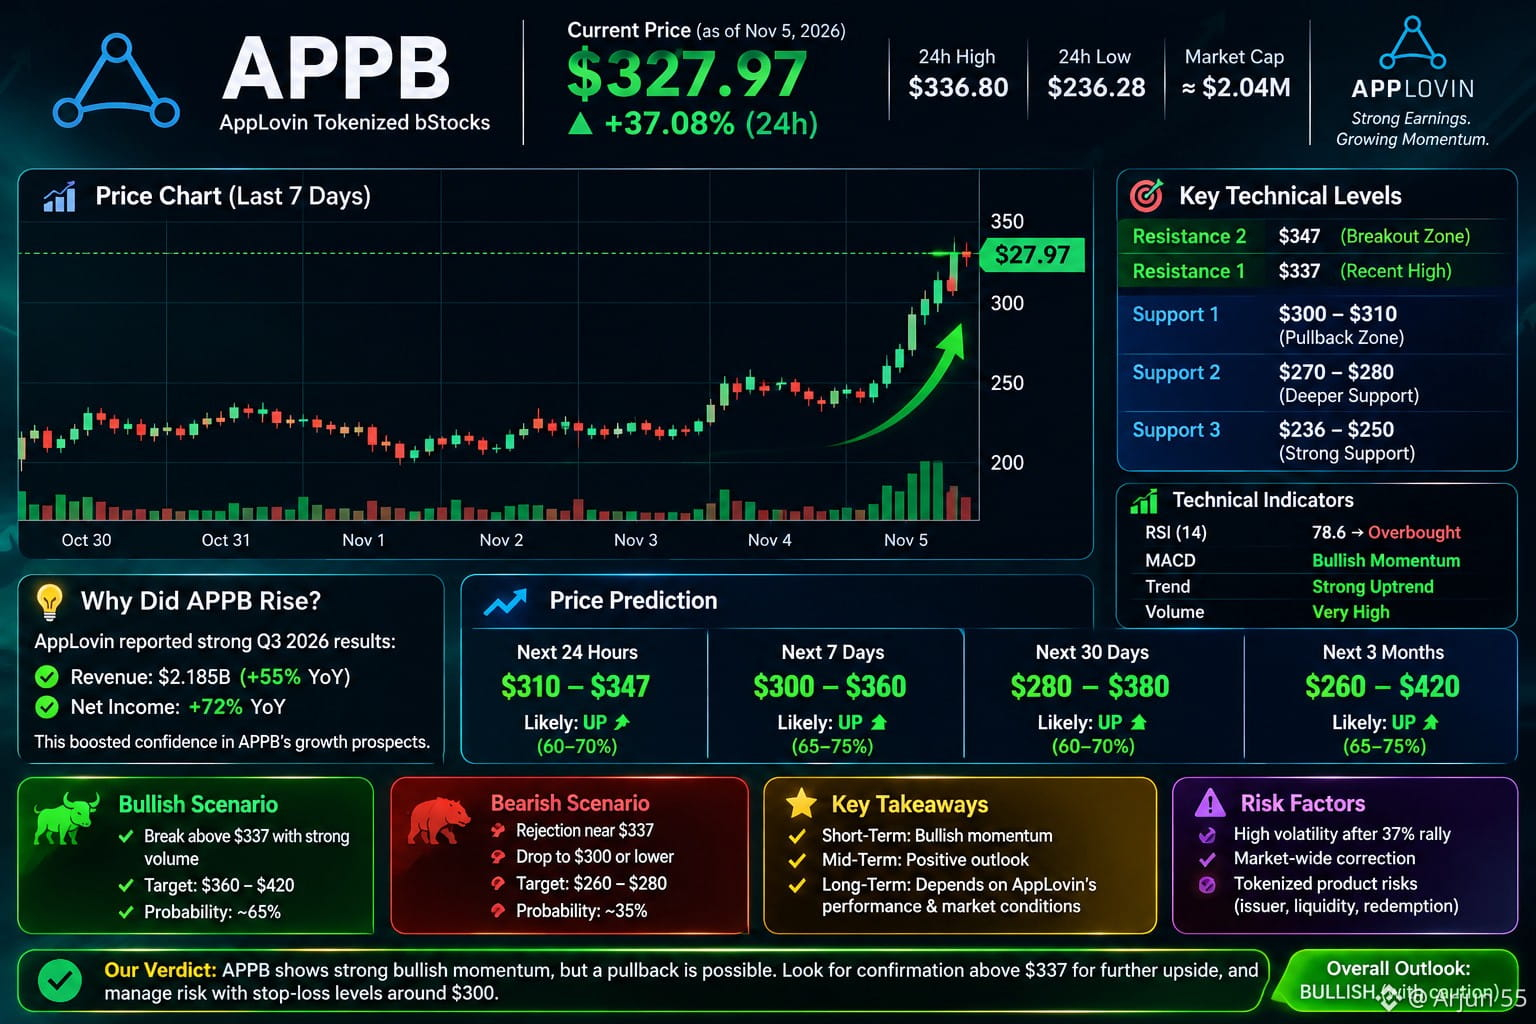
$APPB APP B(AppLovin Tokenized b Stocks)– 分析
2026年11月5日時点で、APP Bは大幅な価格変動を見せています。
直近の市場動向で報告された価格
$327.97
24時間高値:$336.80
24時間安値:$236.28 · 時価総額:約204万ドル
出典:
重要:他の価格追跡サービスでは約$226~$327と報告されています。これは大きな食い違いです。取引前にAPP B/USDTの取引所価格を確認してください。
APP Bが上昇した理由
AppLovinは11月4日、2026年第3四半期の好調な業績を発表しました。
売上高:21億8,500万ドル。
売上高の成長率:前年同期比55%。
純利益の成長率:前年同期比72%。
これらは、基盤となる企業にとってポジティブなファンダメンタルズのシグナルです。
注目すべきテクニカル水準
報告された取引レンジに基づく水準:
水準 APP B価格(USD) 重要性
レジスタンス2 $347 ブレイクアウトゾーン
レジスタンス1 $337 直近高値
サポート1 $300~310 押し目の可能性があるゾーン
サポート2 $270~280 より深い調整のゾーン
サポート3 $236~250 直近の下値レンジ
これらは暫定的な価格帯であり、確認済みのテクニカルサポート水準ではありません。
今後の予測
今後24~48時間
強気シナリオ
$310を上回って維持し、出来高を伴って$337を突破する。
調整シナリオ
$337付近で上値を抑えられた場合、利益確定売りにより$300またはそれ以下まで下落する可能性があります。
今後7~30日
方向性は、AppLovinの基盤となる株式のパフォーマンス、業績の勢い、APP Bの市場流動性によって左右されます。
私の見解:基盤となるファンダメンタルズは強気ですが、37%上昇した後に追いかけて買うのはリスクがあります。すぐに買うのではなく、価格の持ち合いと確認を待ちます。
#APPB #fogo #SOXSB #CPIWatch #USJobData
{spot}(APPBUSDT)
{spot}(FOGOUSDT)
{spot}(SOXSBUSDT)
$APPB APP B(AppLovin Tokenized b Stocks)– 分析
2026年11月5日時点で、APP Bは大幅な価格変動を見せています。
直近の市場動向で報告された価格
$327.97
24時間高値:$336.80
24時間安値:$236.28 · 時価総額:約204万ドル
出典:
重要:他の価格追跡サービスでは約$226~$327と報告されています。これは大きな食い違いです。取引前にAPP B/USDTの取引所価格を確認してください。
APP Bが上昇した理由
AppLovinは11月4日、2026年第3四半期の好調な業績を発表しました。
売上高:21億8,500万ドル。
売上高の成長率:前年同期比55%。
純利益の成長率:前年同期比72%。
これらは、基盤となる企業にとってポジティブなファンダメンタルズのシグナルです。
注目すべきテクニカル水準
報告された取引レンジに基づく水準:
水準 APP B価格(USD) 重要性
レジスタンス2 $347 ブレイクアウトゾーン
レジスタンス1 $337 直近高値
サポート1 $300~310 押し目の可能性があるゾーン
サポート2 $270~280 より深い調整のゾーン
サポート3 $236~250 直近の下値レンジ
これらは暫定的な価格帯であり、確認済みのテクニカルサポート水準ではありません。
今後の予測
今後24~48時間
強気シナリオ
$310を上回って維持し、出来高を伴って$337を突破する。
調整シナリオ
$337付近で上値を抑えられた場合、利益確定売りにより$300またはそれ以下まで下落する可能性があります。
今後7~30日
方向性は、AppLovinの基盤となる株式のパフォーマンス、業績の勢い、APP Bの市場流動性によって左右されます。
私の見解:基盤となるファンダメンタルズは強気ですが、37%上昇した後に追いかけて買うのはリスクがあります。すぐに買うのではなく、価格の持ち合いと確認を待ちます。
#APPB #fogo #SOXSB #CPIWatch #USJobData
2026年11月5日時点で、APP Bは大幅な価格変動を見せています。
直近の市場動向で報告された価格
$327.97
24時間高値:$336.80
24時間安値:$236.28 · 時価総額:約204万ドル
出典:
重要:他の価格追跡サービスでは約$226~$327と報告されています。これは大きな食い違いです。取引前にAPP B/USDTの取引所価格を確認してください。
APP Bが上昇した理由
AppLovinは11月4日、2026年第3四半期の好調な業績を発表しました。
売上高:21億8,500万ドル。
売上高の成長率:前年同期比55%。
純利益の成長率:前年同期比72%。
これらは、基盤となる企業にとってポジティブなファンダメンタルズのシグナルです。
注目すべきテクニカル水準
報告された取引レンジに基づく水準:
水準 APP B価格(USD) 重要性
レジスタンス2 $347 ブレイクアウトゾーン
レジスタンス1 $337 直近高値
サポート1 $300~310 押し目の可能性があるゾーン
サポート2 $270~280 より深い調整のゾーン
サポート3 $236~250 直近の下値レンジ
これらは暫定的な価格帯であり、確認済みのテクニカルサポート水準ではありません。
今後の予測
今後24~48時間
強気シナリオ
$310を上回って維持し、出来高を伴って$337を突破する。
調整シナリオ
$337付近で上値を抑えられた場合、利益確定売りにより$300またはそれ以下まで下落する可能性があります。
今後7~30日
方向性は、AppLovinの基盤となる株式のパフォーマンス、業績の勢い、APP Bの市場流動性によって左右されます。
私の見解:基盤となるファンダメンタルズは強気ですが、37%上昇した後に追いかけて買うのはリスクがあります。すぐに買うのではなく、価格の持ち合いと確認を待ちます。
#APPB #fogo #SOXSB #CPIWatch #USJobData
322
·
--
本人確認中
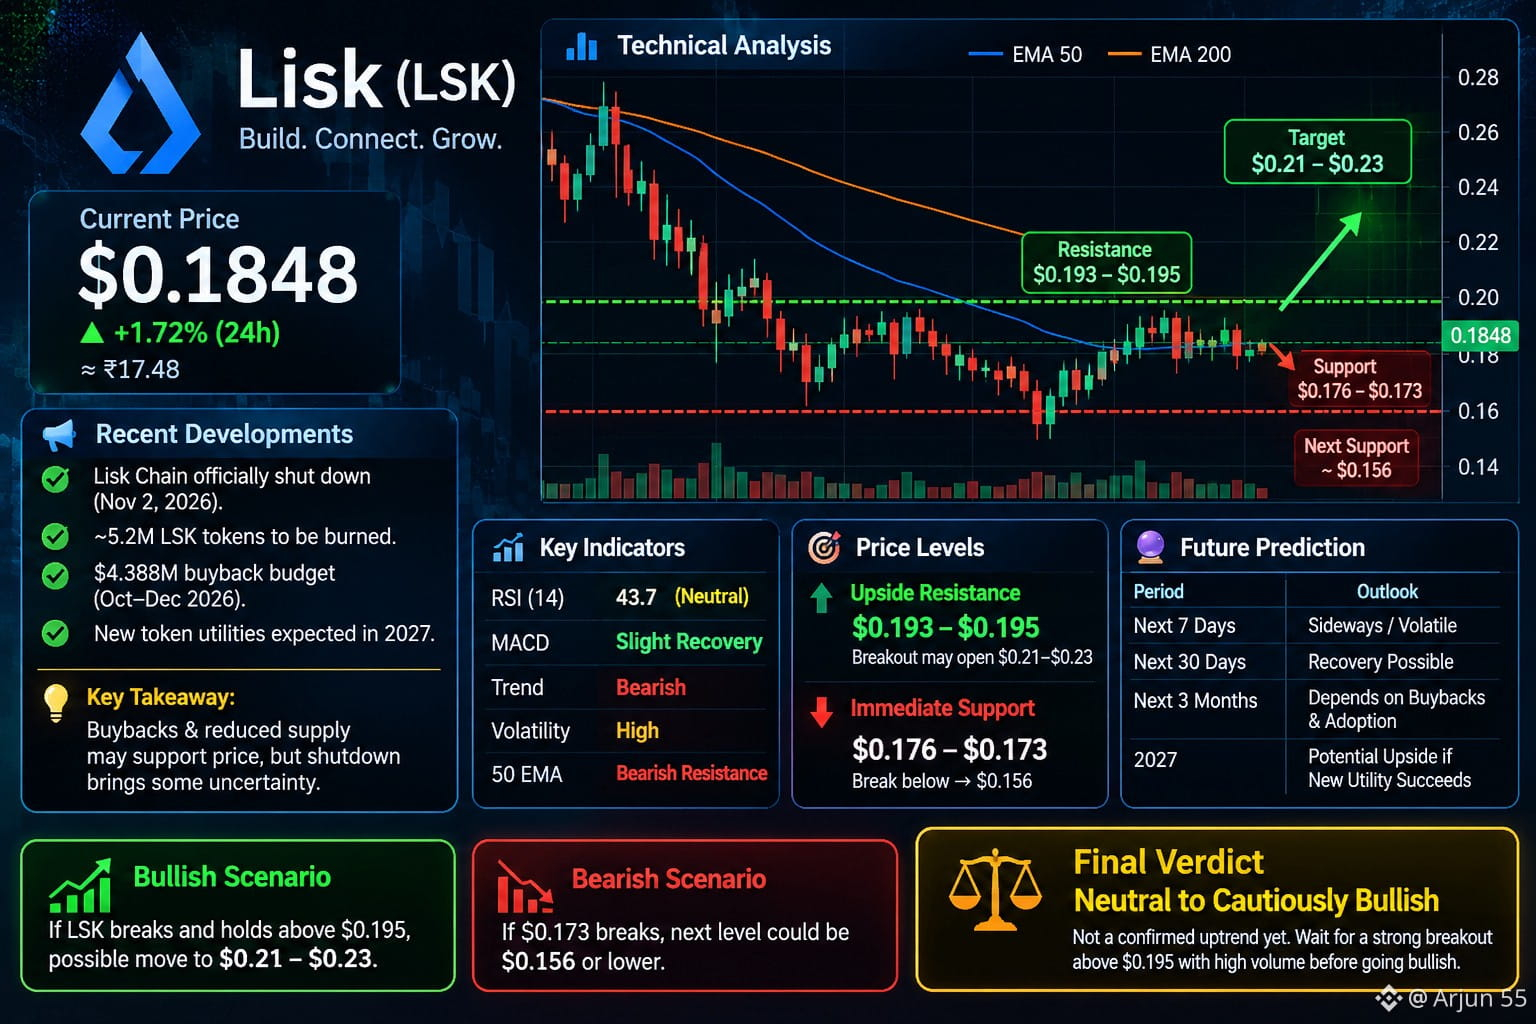
$LSK Liskは、ブロックチェーンインフラから企業向け金融サービスへと注力分野を移しました。
旧Lisk Chainは2026年11月2日に正式に終了しました。
約520万LSKトークンがバーンされる予定です。
Liskは、2026年10月から12月にかけて438万8,000ドルの買い戻し予算を発表しました。
2027年以降、新たなトークンの利用方法が導入される見込みです。
私の見解:買い戻しと供給量の減少は価格を支える可能性がありますが、チェーンの終了により、今後の需要には不透明感も生じています。
テクニカル分析
指標 現在の状況
RSI 43.7 – 中立
全体的なトレンド 弱気
MACD 小幅に回復
ボラティリティ 高い
50 EMA 弱気の抵抗線
3. 重要な価格水準
上値抵抗線
$0.193 – $0.195
この水準を継続的に上抜ければ、$0.21~$0.23を目指す展開となる可能性があります。
目先のサポート
$0.176 – $0.173
ここを下抜けた場合、次の下値目安は約$0.156です。
テクニカル水準は概算であり、市場環境によって変わる可能性があります。
4. 今後の予測
これらはシナリオに基づく予測であり、目標価格を保証するものではありません。期間 私の見通し
今後7日間 横ばい/変動が大きい展開
今後30日間 回復の可能性
今後3か月 買い戻しと普及状況次第
2027年 新たな利用方法が成功すれば上昇の可能性
強気シナリオ:$0.195を上抜けて維持できれば、$0.21~$0.23を目指す可能性があります。
弱気シナリオ:$0.173を下回れば、$0.156またはそれ以下まで下落する可能性があります。
5. 最終評価
LSKが上昇トレンドに入ったと断定するのは、まだ早いでしょう。トークノミクスにはプラス材料となる可能性がありますが、テクニカル面では依然として弱い状況です。
強い取引高を伴って$0.195を明確に上抜けるまでは、強気への転換を見込んだ投資は控えたいと思います。
#LSK #SXTUSDT #zec #CPIWatch #USJobData
{spot}(LSKUSDT)
{spot}(SXTUSDT)
{spot}(ZECUSDT)
$LSK Liskは、ブロックチェーンインフラから企業向け金融サービスへと注力分野を移しました。
旧Lisk Chainは2026年11月2日に正式に終了しました。
約520万LSKトークンがバーンされる予定です。
Liskは、2026年10月から12月にかけて438万8,000ドルの買い戻し予算を発表しました。
2027年以降、新たなトークンの利用方法が導入される見込みです。
私の見解:買い戻しと供給量の減少は価格を支える可能性がありますが、チェーンの終了により、今後の需要には不透明感も生じています。
テクニカル分析
指標 現在の状況
RSI 43.7 – 中立
全体的なトレンド 弱気
MACD 小幅に回復
ボラティリティ 高い
50 EMA 弱気の抵抗線
3. 重要な価格水準
上値抵抗線
$0.193 – $0.195
この水準を継続的に上抜ければ、$0.21~$0.23を目指す展開となる可能性があります。
目先のサポート
$0.176 – $0.173
ここを下抜けた場合、次の下値目安は約$0.156です。
テクニカル水準は概算であり、市場環境によって変わる可能性があります。
4. 今後の予測
これらはシナリオに基づく予測であり、目標価格を保証するものではありません。期間 私の見通し
今後7日間 横ばい/変動が大きい展開
今後30日間 回復の可能性
今後3か月 買い戻しと普及状況次第
2027年 新たな利用方法が成功すれば上昇の可能性
強気シナリオ:$0.195を上抜けて維持できれば、$0.21~$0.23を目指す可能性があります。
弱気シナリオ:$0.173を下回れば、$0.156またはそれ以下まで下落する可能性があります。
5. 最終評価
LSKが上昇トレンドに入ったと断定するのは、まだ早いでしょう。トークノミクスにはプラス材料となる可能性がありますが、テクニカル面では依然として弱い状況です。
強い取引高を伴って$0.195を明確に上抜けるまでは、強気への転換を見込んだ投資は控えたいと思います。
#LSK #SXTUSDT #zec #CPIWatch #USJobData
旧Lisk Chainは2026年11月2日に正式に終了しました。
約520万LSKトークンがバーンされる予定です。
Liskは、2026年10月から12月にかけて438万8,000ドルの買い戻し予算を発表しました。
2027年以降、新たなトークンの利用方法が導入される見込みです。
私の見解:買い戻しと供給量の減少は価格を支える可能性がありますが、チェーンの終了により、今後の需要には不透明感も生じています。
テクニカル分析
指標 現在の状況
RSI 43.7 – 中立
全体的なトレンド 弱気
MACD 小幅に回復
ボラティリティ 高い
50 EMA 弱気の抵抗線
3. 重要な価格水準
上値抵抗線
$0.193 – $0.195
この水準を継続的に上抜ければ、$0.21~$0.23を目指す展開となる可能性があります。
目先のサポート
$0.176 – $0.173
ここを下抜けた場合、次の下値目安は約$0.156です。
テクニカル水準は概算であり、市場環境によって変わる可能性があります。
4. 今後の予測
これらはシナリオに基づく予測であり、目標価格を保証するものではありません。期間 私の見通し
今後7日間 横ばい/変動が大きい展開
今後30日間 回復の可能性
今後3か月 買い戻しと普及状況次第
2027年 新たな利用方法が成功すれば上昇の可能性
強気シナリオ:$0.195を上抜けて維持できれば、$0.21~$0.23を目指す可能性があります。
弱気シナリオ:$0.173を下回れば、$0.156またはそれ以下まで下落する可能性があります。
5. 最終評価
LSKが上昇トレンドに入ったと断定するのは、まだ早いでしょう。トークノミクスにはプラス材料となる可能性がありますが、テクニカル面では依然として弱い状況です。
強い取引高を伴って$0.195を明確に上抜けるまでは、強気への転換を見込んだ投資は控えたいと思います。
#LSK #SXTUSDT #zec #CPIWatch #USJobData
795
·
--
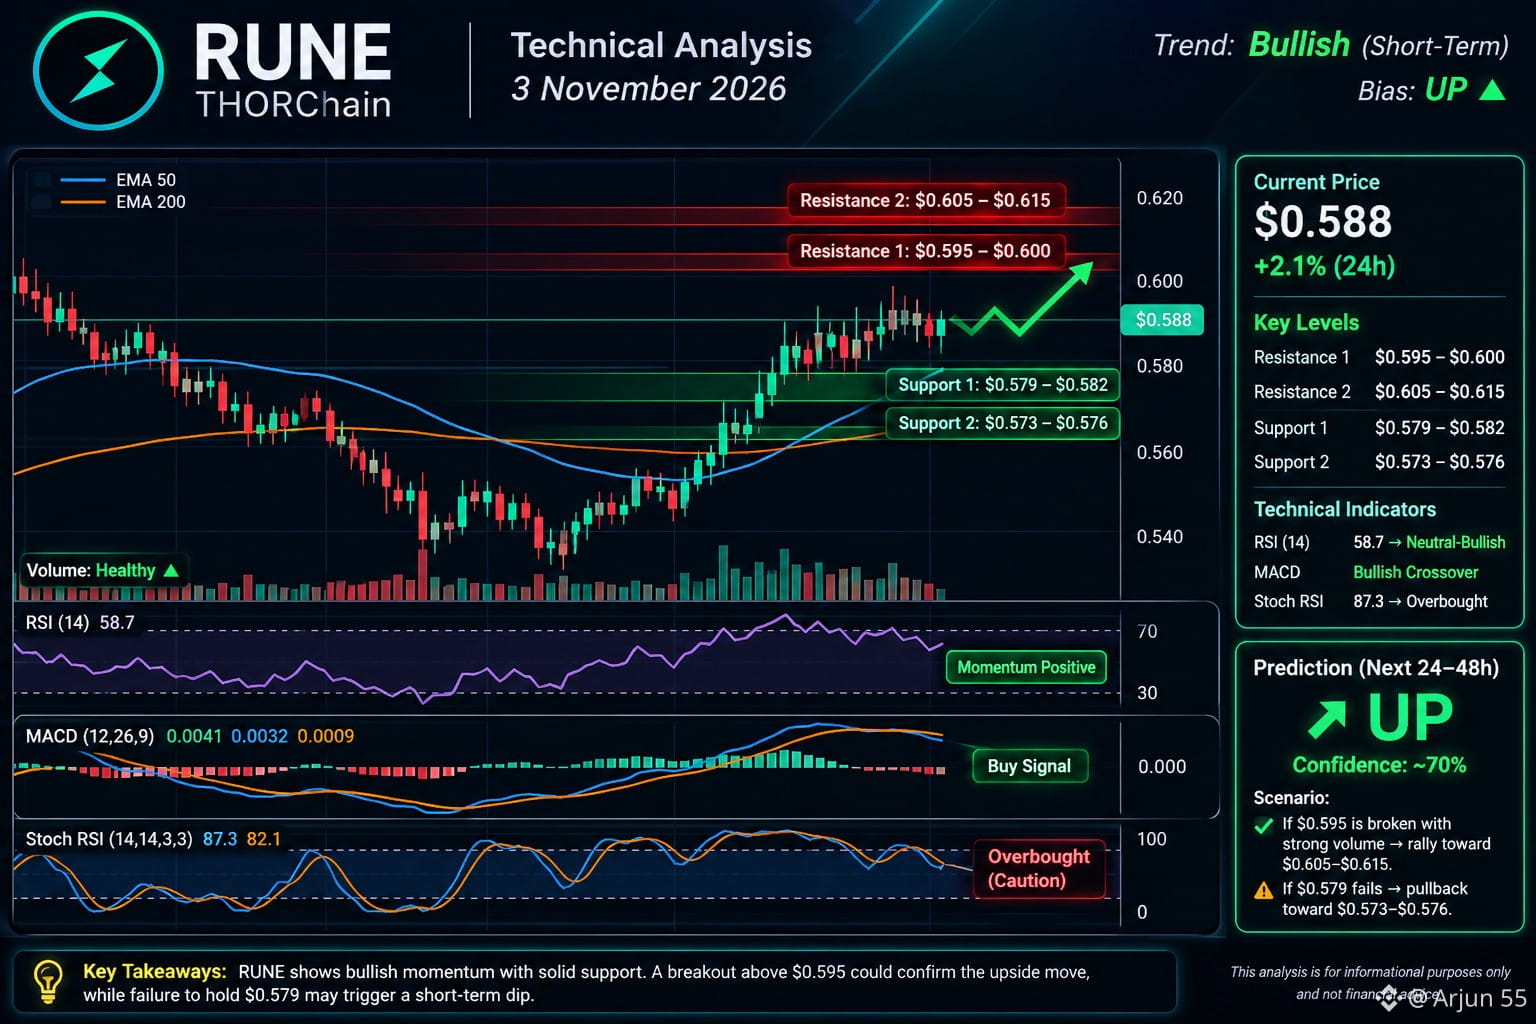
$RUNE RUNE(THORチェーン)— 2026年11月3日
現在の見通し:短期的には強気ですが、確認が必要です。
最近の動き:RSIは58で、MACDは買いシグナルを示しており、上昇モメンタムがうかがえます。
サポート:0.573~0.579ドルのピボットゾーン。
レジスタンス:0.589ドル、次いで0.595~0.605ドル。
今後24~48時間:強い出来高を伴って価格がレジスタンスを突破すれば、上昇基調となる見込みです。上値を拒まれた場合、サポートに向けて反落する可能性があります。
リスク:短期のストキャスティクスRSIは買われすぎのため、調整の可能性があります。
#Rune #BMT #HOT #CPIWatch #USJobData
{spot}(RUNEUSDT)
{spot}(BMTUSDT)
{spot}(HOTUSDT)
$RUNE RUNE(THORチェーン)— 2026年11月3日
現在の見通し:短期的には強気ですが、確認が必要です。
最近の動き:RSIは58で、MACDは買いシグナルを示しており、上昇モメンタムがうかがえます。
サポート:0.573~0.579ドルのピボットゾーン。
レジスタンス:0.589ドル、次いで0.595~0.605ドル。
今後24~48時間:強い出来高を伴って価格がレジスタンスを突破すれば、上昇基調となる見込みです。上値を拒まれた場合、サポートに向けて反落する可能性があります。
リスク:短期のストキャスティクスRSIは買われすぎのため、調整の可能性があります。
#Rune #BMT #HOT #CPIWatch #USJobData
現在の見通し:短期的には強気ですが、確認が必要です。
最近の動き:RSIは58で、MACDは買いシグナルを示しており、上昇モメンタムがうかがえます。
サポート:0.573~0.579ドルのピボットゾーン。
レジスタンス:0.589ドル、次いで0.595~0.605ドル。
今後24~48時間:強い出来高を伴って価格がレジスタンスを突破すれば、上昇基調となる見込みです。上値を拒まれた場合、サポートに向けて反落する可能性があります。
リスク:短期のストキャスティクスRSIは買われすぎのため、調整の可能性があります。
#Rune #BMT #HOT #CPIWatch #USJobData
432
·
--
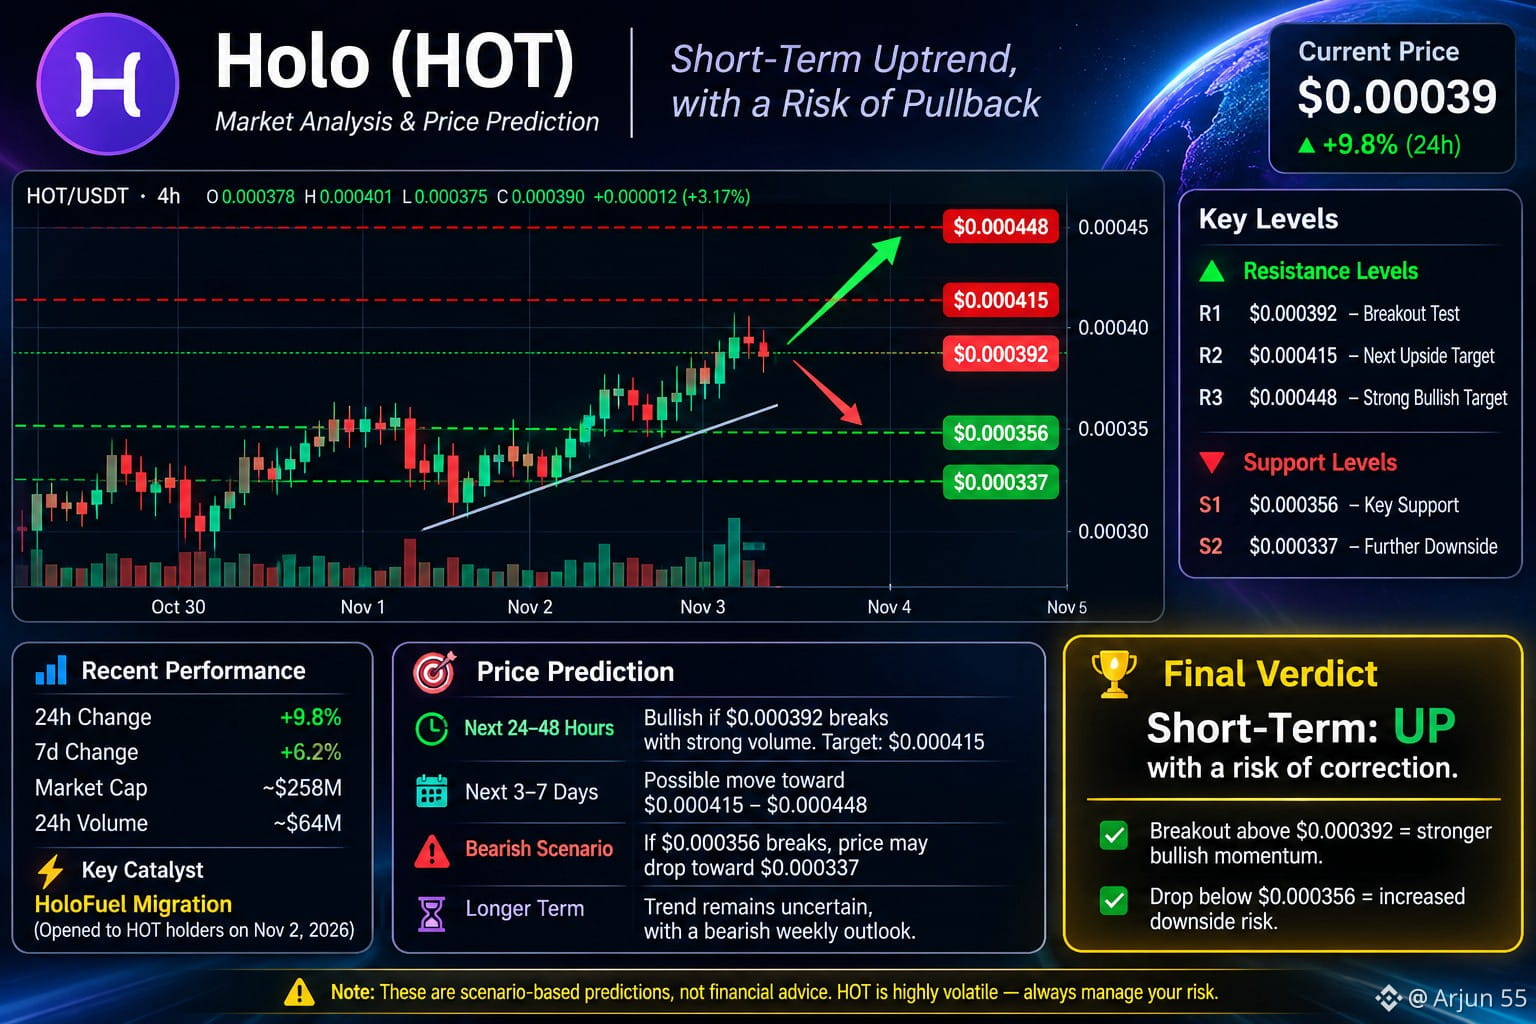
$HOT HOTトークン(Holo)— 短期価格予測
私の見解:短期的には強気ですが、反落の可能性もあります。中期的なトレンドは依然として不透明です。
最近のパフォーマンス
現在価格:約$0.00038~$0.00040。
最近の値動き:市場データによると、HOTは過去24時間で約8~10%上昇しました。
主な材料:Holo Fuelへの移行をめぐる期待感。報道によると、2026年11月2日にHOT保有者向けに開始されました。
リスク:最近の上昇を受け、トレーダーが利益確定に動く可能性があります。
重要なサポートとレジスタンス
11月2日時点の最新テクニカル分析に基づく
水準
HOT価格
意味
レジスタンス1
$0.000392
ブレイクアウトを試す水準
レジスタンス2
$0.000415
次の上値目標
レジスタンス3
$0.000448
より強気な場合の目標
サポート1
$0.000356
重要なサポート
サポート2
$0.000337
さらなる下落リスク
今後の予測
今後24~48時間:HOTが強い出来高を伴って$0.000392を上抜ければ強気です。次の目標は$0.000415となります。
今後3~7日:買いの勢いが続けば、$0.000415~$0.000448に向かう可能性があります。
弱気シナリオ:HOTが$0.000356を下回ると、$0.000337付近まで下落する可能性があります。
長期見通し:不透明です。短期的には回復しているものの、週足トレンドは依然として弱気です。
最終判断
私の予測:短期的には上昇。ただし、調整リスクがあります。$0.000392を持続的に上抜ければ強気シナリオが強まり、$0.000356を下回れば弱まるでしょう。
#HOT #HotTrends #mito #KORUB #CPIWatch
{spot}(HOTUSDT)
{spot}(MITOUSDT)
{spot}(KORUBUSDT)
$HOT HOTトークン(Holo)— 短期価格予測
私の見解:短期的には強気ですが、反落の可能性もあります。中期的なトレンドは依然として不透明です。
最近のパフォーマンス
現在価格:約$0.00038~$0.00040。
最近の値動き:市場データによると、HOTは過去24時間で約8~10%上昇しました。
主な材料:Holo Fuelへの移行をめぐる期待感。報道によると、2026年11月2日にHOT保有者向けに開始されました。
リスク:最近の上昇を受け、トレーダーが利益確定に動く可能性があります。
重要なサポートとレジスタンス
11月2日時点の最新テクニカル分析に基づく
水準
HOT価格
意味
レジスタンス1
$0.000392
ブレイクアウトを試す水準
レジスタンス2
$0.000415
次の上値目標
レジスタンス3
$0.000448
より強気な場合の目標
サポート1
$0.000356
重要なサポート
サポート2
$0.000337
さらなる下落リスク
今後の予測
今後24~48時間:HOTが強い出来高を伴って$0.000392を上抜ければ強気です。次の目標は$0.000415となります。
今後3~7日:買いの勢いが続けば、$0.000415~$0.000448に向かう可能性があります。
弱気シナリオ:HOTが$0.000356を下回ると、$0.000337付近まで下落する可能性があります。
長期見通し:不透明です。短期的には回復しているものの、週足トレンドは依然として弱気です。
最終判断
私の予測:短期的には上昇。ただし、調整リスクがあります。$0.000392を持続的に上抜ければ強気シナリオが強まり、$0.000356を下回れば弱まるでしょう。
#HOT #HotTrends #mito #KORUB #CPIWatch
私の見解:短期的には強気ですが、反落の可能性もあります。中期的なトレンドは依然として不透明です。
最近のパフォーマンス
現在価格:約$0.00038~$0.00040。
最近の値動き:市場データによると、HOTは過去24時間で約8~10%上昇しました。
主な材料:Holo Fuelへの移行をめぐる期待感。報道によると、2026年11月2日にHOT保有者向けに開始されました。
リスク:最近の上昇を受け、トレーダーが利益確定に動く可能性があります。
重要なサポートとレジスタンス
11月2日時点の最新テクニカル分析に基づく
水準
HOT価格
意味
レジスタンス1
$0.000392
ブレイクアウトを試す水準
レジスタンス2
$0.000415
次の上値目標
レジスタンス3
$0.000448
より強気な場合の目標
サポート1
$0.000356
重要なサポート
サポート2
$0.000337
さらなる下落リスク
今後の予測
今後24~48時間:HOTが強い出来高を伴って$0.000392を上抜ければ強気です。次の目標は$0.000415となります。
今後3~7日:買いの勢いが続けば、$0.000415~$0.000448に向かう可能性があります。
弱気シナリオ:HOTが$0.000356を下回ると、$0.000337付近まで下落する可能性があります。
長期見通し:不透明です。短期的には回復しているものの、週足トレンドは依然として弱気です。
最終判断
私の予測:短期的には上昇。ただし、調整リスクがあります。$0.000392を持続的に上抜ければ強気シナリオが強まり、$0.000356を下回れば弱まるでしょう。
#HOT #HotTrends #mito #KORUB #CPIWatch
219
·
--
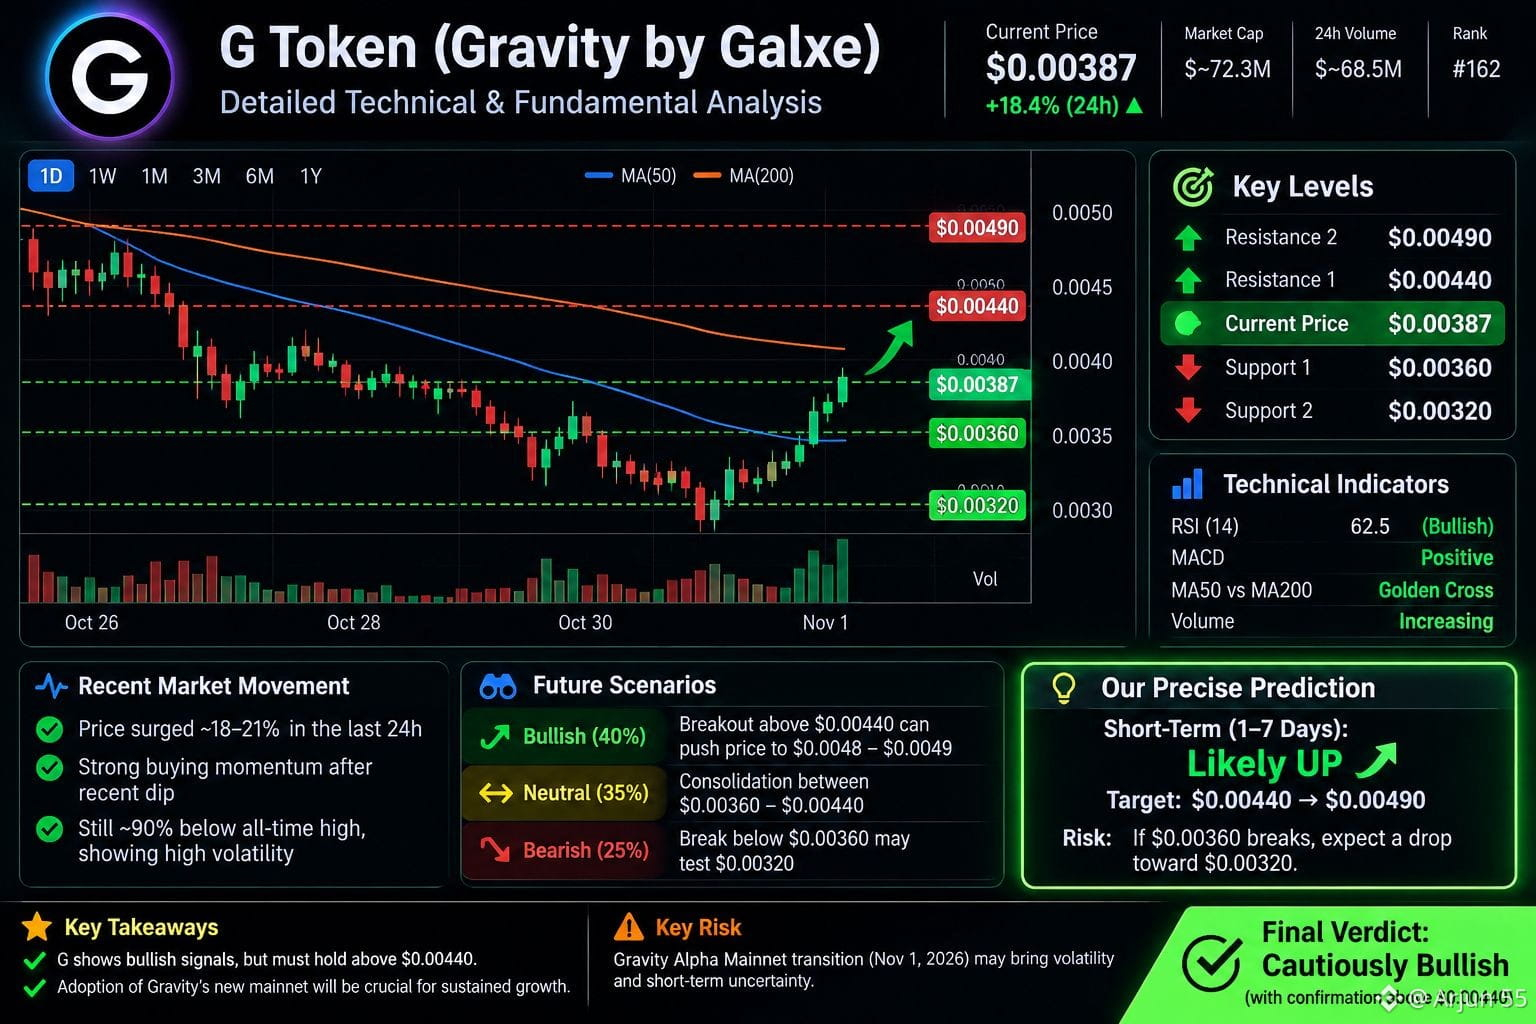
$G Gトークン(Gravity)— 最近の動向と今後の予測
私の暫定的な見解:短期的には強気の反発が見られますが、高いボラティリティと下落リスクは依然として残っています。最近の価格上昇だけでは、上昇トレンドが持続するとは言えません。重要なのは、Gが強い取引高を伴ってレジスタンスを突破し、その水準を上回って推移できるかどうかです。
最近の市場動向
現在価格:2026年11月1日時点で入手可能な市場データによると、約$0.0038~$0.0040です。
最近の値動き:一部のトラッカーでは、Gは急反発し、24時間で約16~21%上昇したと報告されています。
主な懸念点:Gが過去最高値から大幅に下落していることを踏まえると、この上昇局面では利益確定売りが出る可能性があります。また、価格は取引所によって異なります。
注目すべきテクニカル水準
価格水準
解釈
$0.0043~$0.0044
レジスタンス。上抜けすれば、さらなる上昇を後押しする可能性
$0.0048~$0.0049
次の上昇目標となる可能性のある水準
$0.0036~$0.0037
サポートとして注視すべき重要な水準
$0.0032~$0.0033
売りが再開した場合の下値サポートゾーン
これらは概算の分析水準であり、価格目標が保証されるものではありません。
今後の予測
短期(1~7日):
強気シナリオ:強い取引高を伴って$0.0044を持続的に上回れば、$0.0048~$0.0049に向けて上昇する可能性があります。
中立シナリオ:価格は約$0.0036~$0.0044の範囲で持ち合います。
弱気シナリオ:$0.0036を下回ると、$0.0032付近まで下落する可能性があります。
中期(2~4週間):方向性は、買いが継続するか、Gravityの新しいメインネットが普及するか、そして最近の上昇が維持されるかどうかに左右されます。回復が続く可能性はありますが、新たに下落する可能性も否定できません。
重要なファンダメンタルズ上のリスク
Gravity Alphaメインネットは、2026年11月1日に稼働を停止する予定です。Galxeの公式通知によると、ネイティブブリッジとステーキングダッシュボードは10月26日にオフラインになりました。この移行により、資産が旧ネットワーク上に残っている保有者にはリスクが生じます。送金する前に、トークンがどのネットワーク上にあるかを確認してください。
#Gravity #INIT #zro #CPIWatch #USJobData
{future}(GUSDT)
{spot}(INITUSDT)
{spot}(ZROUSDT)
$G Gトークン(Gravity)— 最近の動向と今後の予測
私の暫定的な見解:短期的には強気の反発が見られますが、高いボラティリティと下落リスクは依然として残っています。最近の価格上昇だけでは、上昇トレンドが持続するとは言えません。重要なのは、Gが強い取引高を伴ってレジスタンスを突破し、その水準を上回って推移できるかどうかです。
最近の市場動向
現在価格:2026年11月1日時点で入手可能な市場データによると、約$0.0038~$0.0040です。
最近の値動き:一部のトラッカーでは、Gは急反発し、24時間で約16~21%上昇したと報告されています。
主な懸念点:Gが過去最高値から大幅に下落していることを踏まえると、この上昇局面では利益確定売りが出る可能性があります。また、価格は取引所によって異なります。
注目すべきテクニカル水準
価格水準
解釈
$0.0043~$0.0044
レジスタンス。上抜けすれば、さらなる上昇を後押しする可能性
$0.0048~$0.0049
次の上昇目標となる可能性のある水準
$0.0036~$0.0037
サポートとして注視すべき重要な水準
$0.0032~$0.0033
売りが再開した場合の下値サポートゾーン
これらは概算の分析水準であり、価格目標が保証されるものではありません。
今後の予測
短期(1~7日):
強気シナリオ:強い取引高を伴って$0.0044を持続的に上回れば、$0.0048~$0.0049に向けて上昇する可能性があります。
中立シナリオ:価格は約$0.0036~$0.0044の範囲で持ち合います。
弱気シナリオ:$0.0036を下回ると、$0.0032付近まで下落する可能性があります。
中期(2~4週間):方向性は、買いが継続するか、Gravityの新しいメインネットが普及するか、そして最近の上昇が維持されるかどうかに左右されます。回復が続く可能性はありますが、新たに下落する可能性も否定できません。
重要なファンダメンタルズ上のリスク
Gravity Alphaメインネットは、2026年11月1日に稼働を停止する予定です。Galxeの公式通知によると、ネイティブブリッジとステーキングダッシュボードは10月26日にオフラインになりました。この移行により、資産が旧ネットワーク上に残っている保有者にはリスクが生じます。送金する前に、トークンがどのネットワーク上にあるかを確認してください。
#Gravity #INIT #zro #CPIWatch #USJobData
私の暫定的な見解:短期的には強気の反発が見られますが、高いボラティリティと下落リスクは依然として残っています。最近の価格上昇だけでは、上昇トレンドが持続するとは言えません。重要なのは、Gが強い取引高を伴ってレジスタンスを突破し、その水準を上回って推移できるかどうかです。
最近の市場動向
現在価格:2026年11月1日時点で入手可能な市場データによると、約$0.0038~$0.0040です。
最近の値動き:一部のトラッカーでは、Gは急反発し、24時間で約16~21%上昇したと報告されています。
主な懸念点:Gが過去最高値から大幅に下落していることを踏まえると、この上昇局面では利益確定売りが出る可能性があります。また、価格は取引所によって異なります。
注目すべきテクニカル水準
価格水準
解釈
$0.0043~$0.0044
レジスタンス。上抜けすれば、さらなる上昇を後押しする可能性
$0.0048~$0.0049
次の上昇目標となる可能性のある水準
$0.0036~$0.0037
サポートとして注視すべき重要な水準
$0.0032~$0.0033
売りが再開した場合の下値サポートゾーン
これらは概算の分析水準であり、価格目標が保証されるものではありません。
今後の予測
短期(1~7日):
強気シナリオ:強い取引高を伴って$0.0044を持続的に上回れば、$0.0048~$0.0049に向けて上昇する可能性があります。
中立シナリオ:価格は約$0.0036~$0.0044の範囲で持ち合います。
弱気シナリオ:$0.0036を下回ると、$0.0032付近まで下落する可能性があります。
中期(2~4週間):方向性は、買いが継続するか、Gravityの新しいメインネットが普及するか、そして最近の上昇が維持されるかどうかに左右されます。回復が続く可能性はありますが、新たに下落する可能性も否定できません。
重要なファンダメンタルズ上のリスク
Gravity Alphaメインネットは、2026年11月1日に稼働を停止する予定です。Galxeの公式通知によると、ネイティブブリッジとステーキングダッシュボードは10月26日にオフラインになりました。この移行により、資産が旧ネットワーク上に残っている保有者にはリスクが生じます。送金する前に、トークンがどのネットワーク上にあるかを確認してください。
#Gravity #INIT #zro #CPIWatch #USJobData
405
·
--
翻訳参照
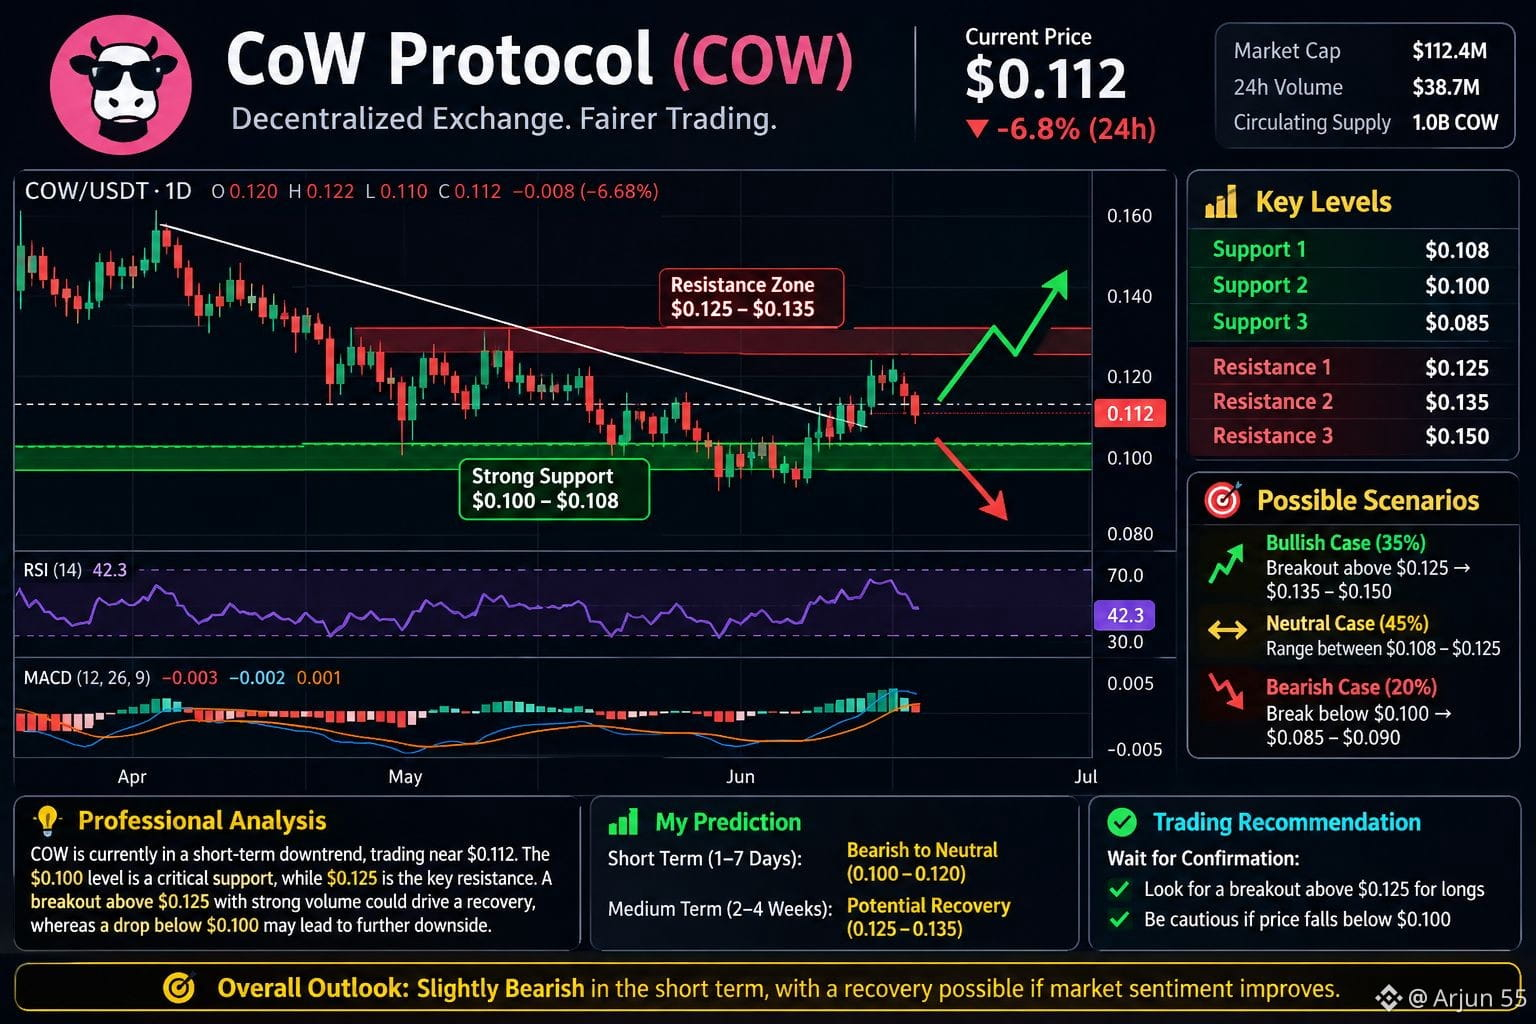
$COW CoW Protocol (COW) — Recent Analysis & Future Prediction
My view: Short-term bearish, with a possibility of a recovery bounce. COW has recently experienced strong selling pressure, so a bullish reversal needs confirmation before considering the trend upward.
What is COW
CoW Protocol (COW) is a crypto token associated with a decentralized trading protocol that aims to improve swap execution and protect users from certain forms of transaction manipulation. Its price is influenced by Bitcoin's direction, overall market sentiment, trading volume, and demand for the token.
Recent price movement
According to the latest available market data:
Current price: Approximately $0.11–$0.12 in recent reports.
Recent trend: Heavy selling pressure and sharp volatility.
Main reason: Broader crypto-market weakness and risk aversion.
Important support: $0.10–$0.108.
Resistance to watch: $0.12–$0.125.
Future prediction: Up or down?
Scenario
Possible movement
Confirmation
Bearish
$0.10, potentially $0.085–$0.09
Price breaks below $0.10
Sideways
$0.10–$0.12
Price holds support but fails to break resistance
Bullish
$0.125–$0.135
Strong volume and a sustained breakout above $0.125
These are conditional scenarios, not guaranteed price targets.
My final prediction
Short term (next 1–7 days): Bearish to neutral. Further downside remains possible, although a temporary rebound could occur.
Medium term (next 2–4 weeks): Recovery is possible if Bitcoin stabilizes, market sentiment improves, and COW breaks above resistance with strong volume.
My key levels to watch:
Below $0.10: Bearish pressure increases.
Above $0.125: Bullish recovery becomes more credible.
Between $0.10 and $0.125: Wait for a clearer direction.
#COW #LSK #Eden #CPIWatch #USJobData
{spot}(COWUSDT)
{spot}(LSKUSDT)
{spot}(EDENUSDT)
$COW CoW Protocol (COW) — Recent Analysis & Future Prediction
My view: Short-term bearish, with a possibility of a recovery bounce. COW has recently experienced strong selling pressure, so a bullish reversal needs confirmation before considering the trend upward.
What is COW
CoW Protocol (COW) is a crypto token associated with a decentralized trading protocol that aims to improve swap execution and protect users from certain forms of transaction manipulation. Its price is influenced by Bitcoin's direction, overall market sentiment, trading volume, and demand for the token.
Recent price movement
According to the latest available market data:
Current price: Approximately $0.11–$0.12 in recent reports.
Recent trend: Heavy selling pressure and sharp volatility.
Main reason: Broader crypto-market weakness and risk aversion.
Important support: $0.10–$0.108.
Resistance to watch: $0.12–$0.125.
Future prediction: Up or down?
Scenario
Possible movement
Confirmation
Bearish
$0.10, potentially $0.085–$0.09
Price breaks below $0.10
Sideways
$0.10–$0.12
Price holds support but fails to break resistance
Bullish
$0.125–$0.135
Strong volume and a sustained breakout above $0.125
These are conditional scenarios, not guaranteed price targets.
My final prediction
Short term (next 1–7 days): Bearish to neutral. Further downside remains possible, although a temporary rebound could occur.
Medium term (next 2–4 weeks): Recovery is possible if Bitcoin stabilizes, market sentiment improves, and COW breaks above resistance with strong volume.
My key levels to watch:
Below $0.10: Bearish pressure increases.
Above $0.125: Bullish recovery becomes more credible.
Between $0.10 and $0.125: Wait for a clearer direction.
#COW #LSK #Eden #CPIWatch #USJobData
My view: Short-term bearish, with a possibility of a recovery bounce. COW has recently experienced strong selling pressure, so a bullish reversal needs confirmation before considering the trend upward.
What is COW
CoW Protocol (COW) is a crypto token associated with a decentralized trading protocol that aims to improve swap execution and protect users from certain forms of transaction manipulation. Its price is influenced by Bitcoin's direction, overall market sentiment, trading volume, and demand for the token.
Recent price movement
According to the latest available market data:
Current price: Approximately $0.11–$0.12 in recent reports.
Recent trend: Heavy selling pressure and sharp volatility.
Main reason: Broader crypto-market weakness and risk aversion.
Important support: $0.10–$0.108.
Resistance to watch: $0.12–$0.125.
Future prediction: Up or down?
Scenario
Possible movement
Confirmation
Bearish
$0.10, potentially $0.085–$0.09
Price breaks below $0.10
Sideways
$0.10–$0.12
Price holds support but fails to break resistance
Bullish
$0.125–$0.135
Strong volume and a sustained breakout above $0.125
These are conditional scenarios, not guaranteed price targets.
My final prediction
Short term (next 1–7 days): Bearish to neutral. Further downside remains possible, although a temporary rebound could occur.
Medium term (next 2–4 weeks): Recovery is possible if Bitcoin stabilizes, market sentiment improves, and COW breaks above resistance with strong volume.
My key levels to watch:
Below $0.10: Bearish pressure increases.
Above $0.125: Bullish recovery becomes more credible.
Between $0.10 and $0.125: Wait for a clearer direction.
#COW #LSK #Eden #CPIWatch #USJobData
607
·
--
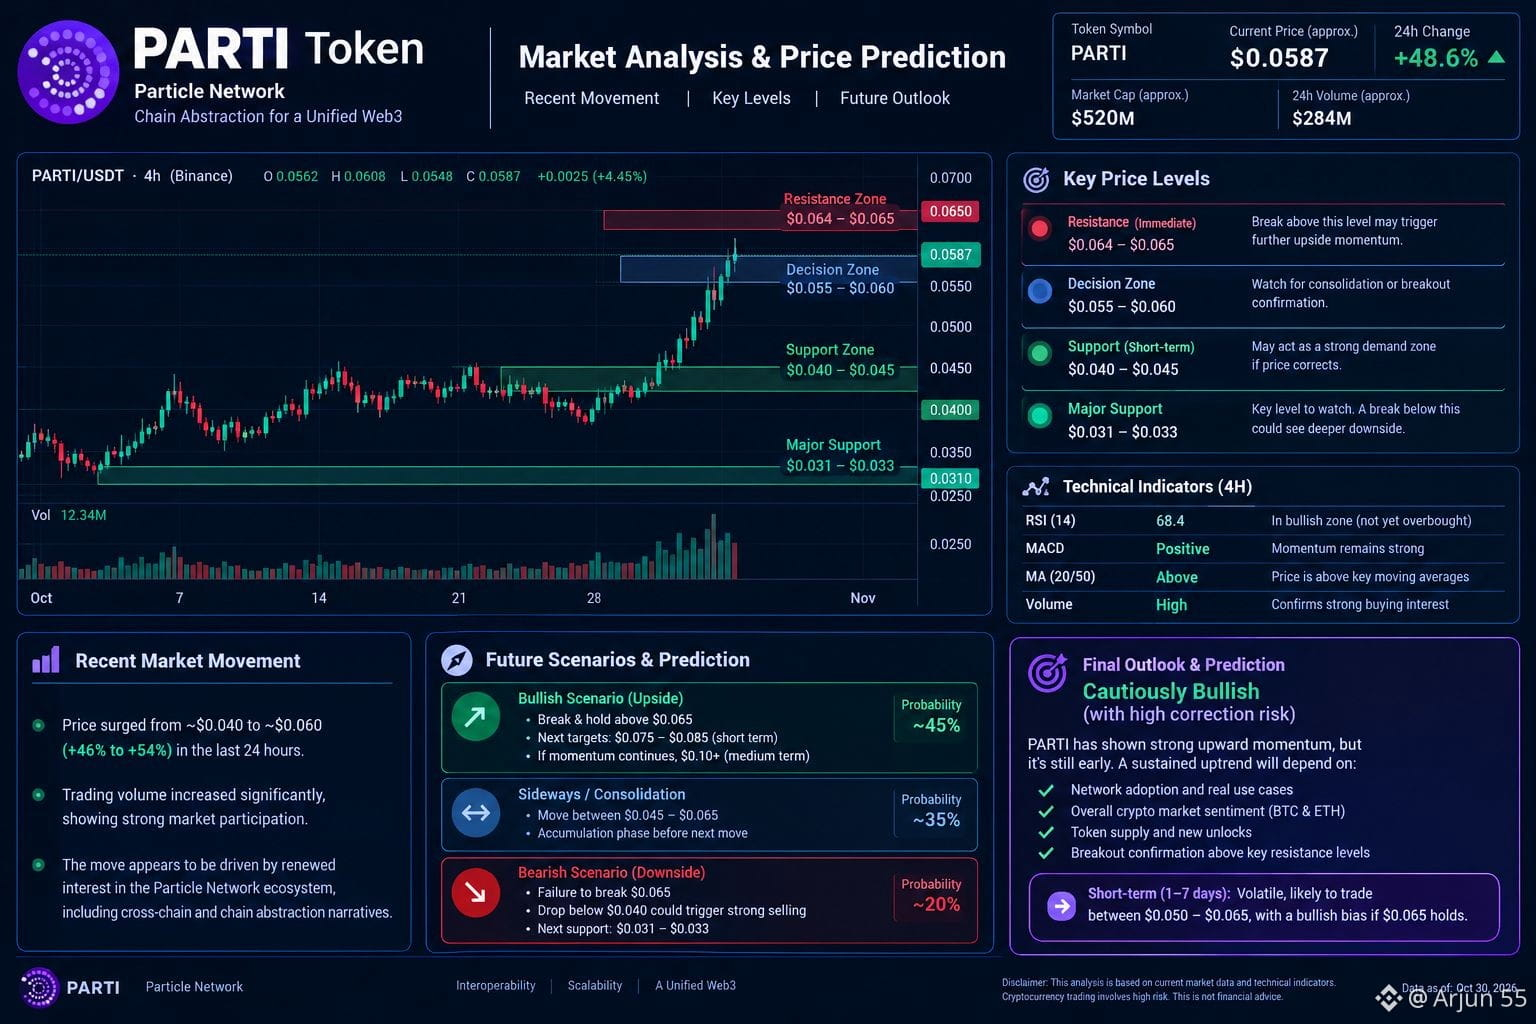
$PARTI PARTIトークン — 最近の値動きと今後の予測
トークン:Particle Network(PARTI)
最近の価格動向
2026年10月30日時点で入手可能な最新の市場データによると、PARTIは急激な価格上昇を記録しています。
最近の価格:約$0.056~$0.060。
24時間の値動き:データソースや更新時刻によって異なりますが、約+46%~+54%。
取引高:増加しており、市場活動が活発であることを示しています。
リスク:これほど急速に上昇した後は、利益確定売りや急激な調整が起こる可能性があります。
重要なサポート水準とレジスタンス水準
最近の価格帯を踏まえ、注目したい水準は次のとおりです。
価格水準
重要性
$0.064~$0.065
目先のレジスタンス
$0.055~$0.060
短期的な判断ゾーン
$0.040~$0.045
サポートとなる可能性のある水準
$0.031~$0.033
最近の主要なサポートゾーン
これらは参考水準であり、サポートやレジスタンスとして確認されたものではありません。価格は急速に変動しています。
今後の予測:上昇か、下落か?
短期見通し:値動きが不安定です。上昇が続く可能性がある一方、調整も起こりそうです。
強気シナリオ:PARTIが$0.065を上抜け、その水準を維持できれば、さらに上昇する可能性があります。
弱気シナリオ:レジスタンスを突破できず、$0.040を下回った場合、売り圧力が強まる可能性があります。
中期見通し:実際のネットワーク普及状況、暗号資産市場全体の状況、流通に入るトークンの供給量に左右されます。
結論
現在の見方:慎重ながら強気。ただし、調整リスクは高いです。
PARTIの急騰は強い買い需要を示していますが、1日の価格上昇だけでは上昇トレンドが続くとは言えません。十分な確認がないまま、大幅上昇後の価格を追いかけるのは避けましょう。
#PARTI #BEAMX #SOXSB #CPIWatch #USJobData
{spot}(PARTIUSDT)
{spot}(BEAMXUSDT)
{spot}(SOXSBUSDT)
$PARTI PARTIトークン — 最近の値動きと今後の予測
トークン:Particle Network(PARTI)
最近の価格動向
2026年10月30日時点で入手可能な最新の市場データによると、PARTIは急激な価格上昇を記録しています。
最近の価格:約$0.056~$0.060。
24時間の値動き:データソースや更新時刻によって異なりますが、約+46%~+54%。
取引高:増加しており、市場活動が活発であることを示しています。
リスク:これほど急速に上昇した後は、利益確定売りや急激な調整が起こる可能性があります。
重要なサポート水準とレジスタンス水準
最近の価格帯を踏まえ、注目したい水準は次のとおりです。
価格水準
重要性
$0.064~$0.065
目先のレジスタンス
$0.055~$0.060
短期的な判断ゾーン
$0.040~$0.045
サポートとなる可能性のある水準
$0.031~$0.033
最近の主要なサポートゾーン
これらは参考水準であり、サポートやレジスタンスとして確認されたものではありません。価格は急速に変動しています。
今後の予測:上昇か、下落か?
短期見通し:値動きが不安定です。上昇が続く可能性がある一方、調整も起こりそうです。
強気シナリオ:PARTIが$0.065を上抜け、その水準を維持できれば、さらに上昇する可能性があります。
弱気シナリオ:レジスタンスを突破できず、$0.040を下回った場合、売り圧力が強まる可能性があります。
中期見通し:実際のネットワーク普及状況、暗号資産市場全体の状況、流通に入るトークンの供給量に左右されます。
結論
現在の見方:慎重ながら強気。ただし、調整リスクは高いです。
PARTIの急騰は強い買い需要を示していますが、1日の価格上昇だけでは上昇トレンドが続くとは言えません。十分な確認がないまま、大幅上昇後の価格を追いかけるのは避けましょう。
#PARTI #BEAMX #SOXSB #CPIWatch #USJobData
トークン:Particle Network(PARTI)
最近の価格動向
2026年10月30日時点で入手可能な最新の市場データによると、PARTIは急激な価格上昇を記録しています。
最近の価格:約$0.056~$0.060。
24時間の値動き:データソースや更新時刻によって異なりますが、約+46%~+54%。
取引高:増加しており、市場活動が活発であることを示しています。
リスク:これほど急速に上昇した後は、利益確定売りや急激な調整が起こる可能性があります。
重要なサポート水準とレジスタンス水準
最近の価格帯を踏まえ、注目したい水準は次のとおりです。
価格水準
重要性
$0.064~$0.065
目先のレジスタンス
$0.055~$0.060
短期的な判断ゾーン
$0.040~$0.045
サポートとなる可能性のある水準
$0.031~$0.033
最近の主要なサポートゾーン
これらは参考水準であり、サポートやレジスタンスとして確認されたものではありません。価格は急速に変動しています。
今後の予測:上昇か、下落か?
短期見通し:値動きが不安定です。上昇が続く可能性がある一方、調整も起こりそうです。
強気シナリオ:PARTIが$0.065を上抜け、その水準を維持できれば、さらに上昇する可能性があります。
弱気シナリオ:レジスタンスを突破できず、$0.040を下回った場合、売り圧力が強まる可能性があります。
中期見通し:実際のネットワーク普及状況、暗号資産市場全体の状況、流通に入るトークンの供給量に左右されます。
結論
現在の見方:慎重ながら強気。ただし、調整リスクは高いです。
PARTIの急騰は強い買い需要を示していますが、1日の価格上昇だけでは上昇トレンドが続くとは言えません。十分な確認がないまま、大幅上昇後の価格を追いかけるのは避けましょう。
#PARTI #BEAMX #SOXSB #CPIWatch #USJobData
287
·
--
翻訳参照
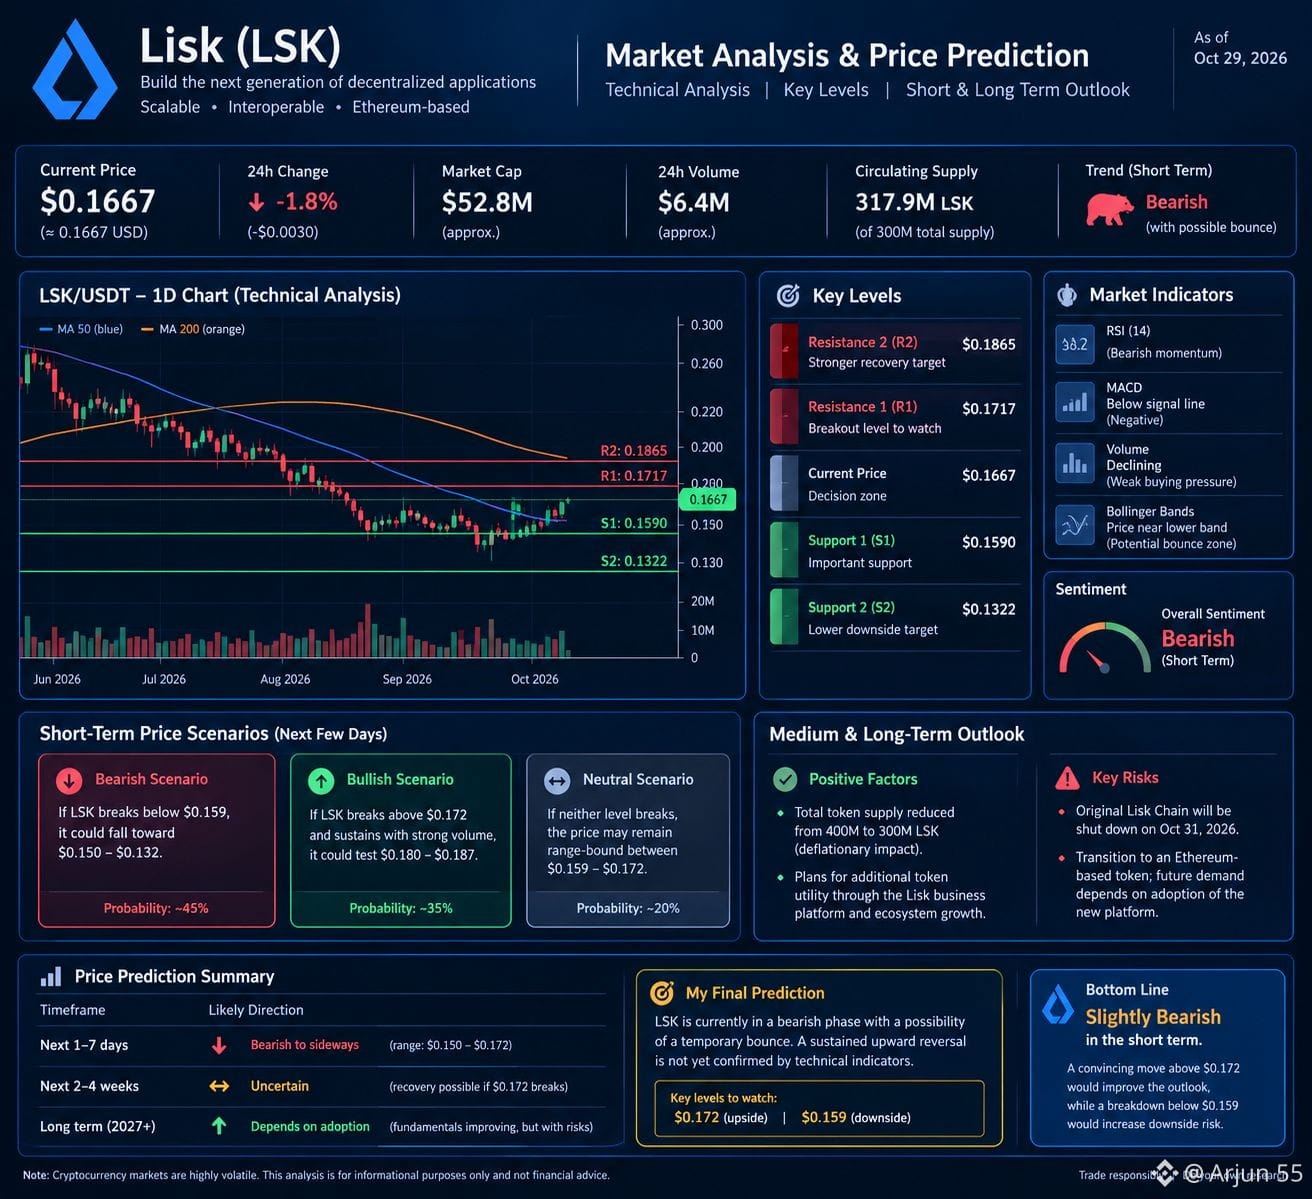
$LSK Lisk (LSK) Token: Recent Analysis & Future Prediction
My view: LSK is currently bearish in the short term, with a possibility of a temporary bounce. A sustained upward reversal is not yet confirmed by the technical indicators.
Recent market movement
As of October 29, 2026, available market analysis reports LSK trading around $0.166–$0.167.
Recent trend: Weak, with selling pressure.
Momentum: Bearish; the daily RSI is around 38, indicating weak momentum.
Market influence: Bitcoin's direction and broader crypto-market sentiment could influence LSK's next move.
Recent recovery: A bounce has occurred, but it does not yet establish a long-term uptrend.
Important support and resistance levels
Based on technical analysis published on October 29
Level
LSK price
Significance
Resistance 2
$0.1865
Stronger recovery target
Resistance 1
$0.1717
Breakout level to watch
Current price
~$0.167
Decision zone
Support 1
$0.1590
Important support
Support 2
$0.1322
Lower downside target
Future prediction: Up or down?
Short term (next few days)
Bearish scenario: If LSK breaks below $0.159, it could fall toward $0.150–$0.132.
Bullish scenario: If LSK breaks above $0.172 and sustains that level with strong volume, it could test $0.180–$0.187.
Neutral scenario: If neither level breaks, the price may remain range-bound.
These are conditional scenarios, not guaranteed price targets.
Medium to long term (2027 onward)
There are two important fundamental developments:
Positive: Lisk has reduced its total token supply from 400 million to 300 million LSK and plans to introduce additional token utility through its business platform.
Risk: The original Lisk Chain is scheduled to shut down on October 31, 2026. LSK is transitioning to an Ethereum-based token, and future demand will depend partly on adoption of the new platform.
My final prediction
Timeframe
Directional outlook
Next 1–7 days
Bearish to sideways
Next 2–4 weeks
Uncertain; recovery possible
#LSK #hype #CYPHB #CPIWatch #USJobData
{spot}(LSKUSDT)
{spot}(HYPEUSDT)
{spot}(CYPHBUSDT)
$LSK Lisk (LSK) Token: Recent Analysis & Future Prediction
My view: LSK is currently bearish in the short term, with a possibility of a temporary bounce. A sustained upward reversal is not yet confirmed by the technical indicators.
Recent market movement
As of October 29, 2026, available market analysis reports LSK trading around $0.166–$0.167.
Recent trend: Weak, with selling pressure.
Momentum: Bearish; the daily RSI is around 38, indicating weak momentum.
Market influence: Bitcoin's direction and broader crypto-market sentiment could influence LSK's next move.
Recent recovery: A bounce has occurred, but it does not yet establish a long-term uptrend.
Important support and resistance levels
Based on technical analysis published on October 29
Level
LSK price
Significance
Resistance 2
$0.1865
Stronger recovery target
Resistance 1
$0.1717
Breakout level to watch
Current price
~$0.167
Decision zone
Support 1
$0.1590
Important support
Support 2
$0.1322
Lower downside target
Future prediction: Up or down?
Short term (next few days)
Bearish scenario: If LSK breaks below $0.159, it could fall toward $0.150–$0.132.
Bullish scenario: If LSK breaks above $0.172 and sustains that level with strong volume, it could test $0.180–$0.187.
Neutral scenario: If neither level breaks, the price may remain range-bound.
These are conditional scenarios, not guaranteed price targets.
Medium to long term (2027 onward)
There are two important fundamental developments:
Positive: Lisk has reduced its total token supply from 400 million to 300 million LSK and plans to introduce additional token utility through its business platform.
Risk: The original Lisk Chain is scheduled to shut down on October 31, 2026. LSK is transitioning to an Ethereum-based token, and future demand will depend partly on adoption of the new platform.
My final prediction
Timeframe
Directional outlook
Next 1–7 days
Bearish to sideways
Next 2–4 weeks
Uncertain; recovery possible
#LSK #hype #CYPHB #CPIWatch #USJobData
My view: LSK is currently bearish in the short term, with a possibility of a temporary bounce. A sustained upward reversal is not yet confirmed by the technical indicators.
Recent market movement
As of October 29, 2026, available market analysis reports LSK trading around $0.166–$0.167.
Recent trend: Weak, with selling pressure.
Momentum: Bearish; the daily RSI is around 38, indicating weak momentum.
Market influence: Bitcoin's direction and broader crypto-market sentiment could influence LSK's next move.
Recent recovery: A bounce has occurred, but it does not yet establish a long-term uptrend.
Important support and resistance levels
Based on technical analysis published on October 29
Level
LSK price
Significance
Resistance 2
$0.1865
Stronger recovery target
Resistance 1
$0.1717
Breakout level to watch
Current price
~$0.167
Decision zone
Support 1
$0.1590
Important support
Support 2
$0.1322
Lower downside target
Future prediction: Up or down?
Short term (next few days)
Bearish scenario: If LSK breaks below $0.159, it could fall toward $0.150–$0.132.
Bullish scenario: If LSK breaks above $0.172 and sustains that level with strong volume, it could test $0.180–$0.187.
Neutral scenario: If neither level breaks, the price may remain range-bound.
These are conditional scenarios, not guaranteed price targets.
Medium to long term (2027 onward)
There are two important fundamental developments:
Positive: Lisk has reduced its total token supply from 400 million to 300 million LSK and plans to introduce additional token utility through its business platform.
Risk: The original Lisk Chain is scheduled to shut down on October 31, 2026. LSK is transitioning to an Ethereum-based token, and future demand will depend partly on adoption of the new platform.
My final prediction
Timeframe
Directional outlook
Next 1–7 days
Bearish to sideways
Next 2–4 weeks
Uncertain; recovery possible
#LSK #hype #CYPHB #CPIWatch #USJobData
343
·
--
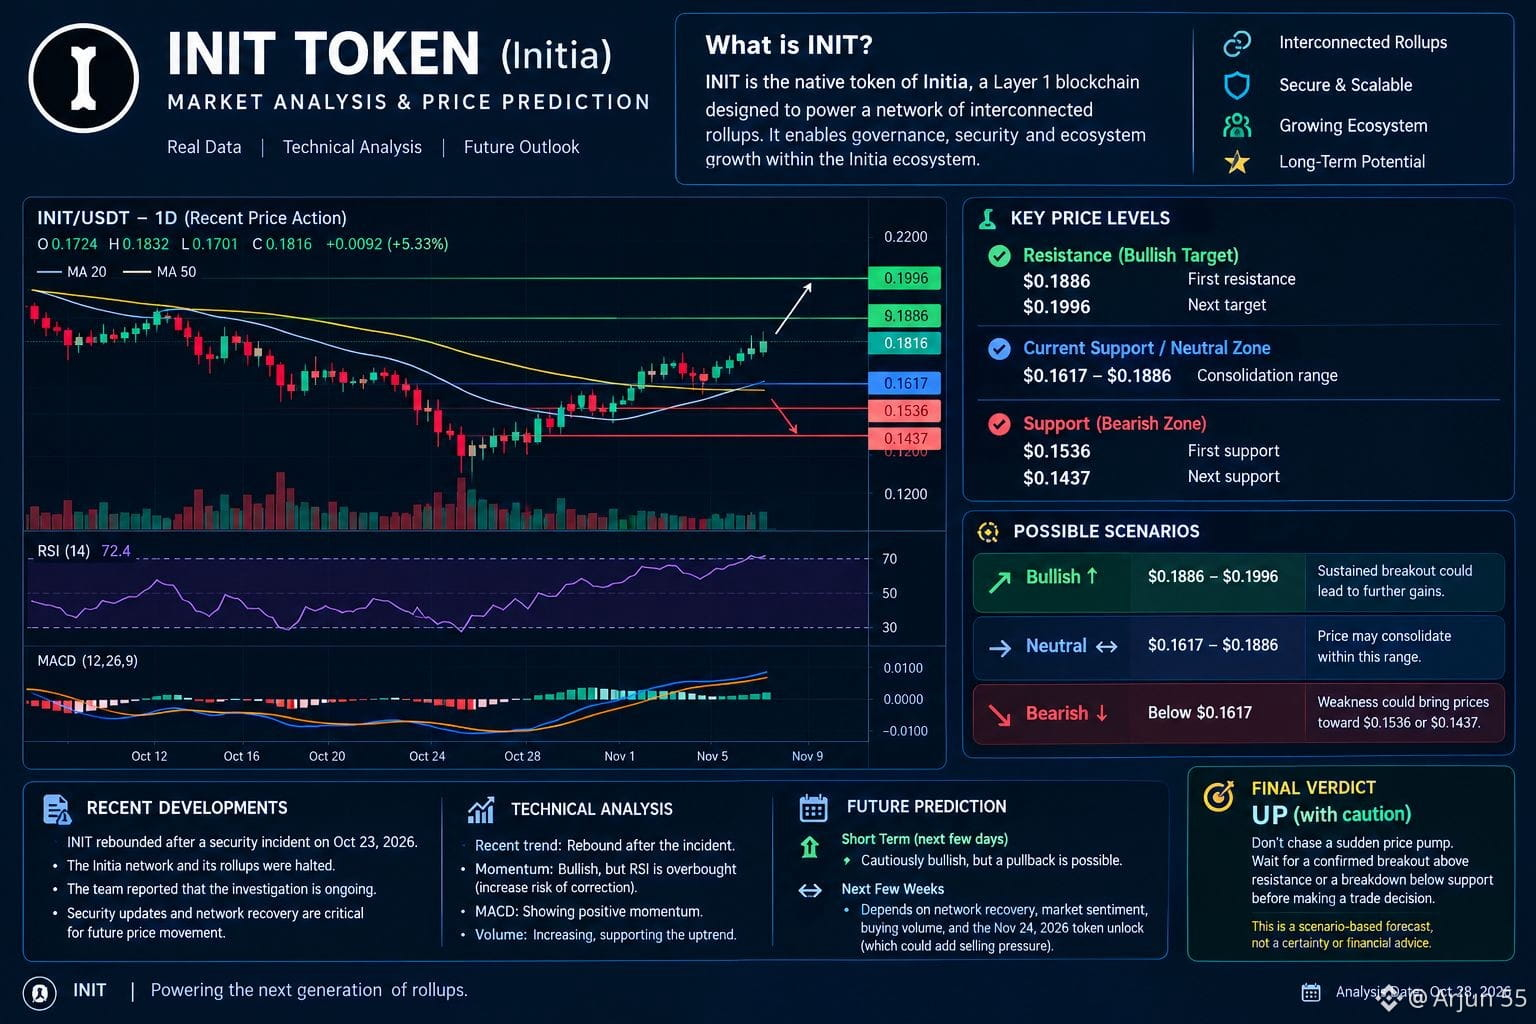
$INIT INITトークン(Ini tia)— 短期および将来の価格予測
私の見解:短期的には強気の勢いがありますが、急激な反落のリスクも高いです。
最近の値動きは、2026年10月23日に発生した深刻なセキュリティインシデント後の回復を示しています。このインシデントにより、Ini tiaネットワークとそのロールアップは停止しました。プロジェクトは、調査が継続中であると報告しています。そのため、セキュリティに関する最新情報とネットワークの復旧が、トークンの今後の価格を左右する重要な要因となります。
最近のパフォーマンスとテクニカル分析
最近の傾向:INITはセキュリティインシデント後に反発しています。
テクニカル面の勢い:指標は強気の勢いを示していますが、RSIは買われ過ぎの領域に入り、調整のリスクが高まっています。
ファンダメンタルズ面のリスク:チームはセキュリティパッチを監査し、ネットワークの復旧に向けて準備しています。復旧に成功すれば価格を支える可能性がありますが、遅延すれば売りにつながるおそれがあります。
今後の価格予測
シナリオ
重要な価格水準
解釈
強気
$0.1886–$0.1996
上抜けが持続すれば、さらなる上昇につながる可能性があります。
中立
$0.1617–$0.1886
価格はこの範囲内で持ち合う可能性があります。
弱気
$0.1617を下回る
弱含みとなれば、価格は$0.1536または$0.1437付近まで下落する可能性があります。
これらは10月28日に報告されたテクニカル上の参考水準であり、確実な目標価格ではありません。
最終予測:上昇か、それとも下落か?
短期:慎重ながらも強気ですが、反落の可能性があります。
今後数週間:方向性はネットワークの復旧、市場心理、買いの出来高に大きく左右されます。次回予定されているトークンのロック解除は2026年11月24日で、追加の売り圧力が生じる可能性があります。
結論:急激な価格上昇を追いかけないでください。取引を判断する前に、レジスタンスを明確に上抜けるか、サポートを下抜けるかを確認しましょう。
これはシナリオに基づく予測であり、確実なものではなく、金融アドバイスでもありません。
#INIT #WENB #BLUR #CPIWatch #USJobData
{spot}(INITUSDT)
{spot}(WENBUSDT)
{spot}(BLURUSDT)
$INIT INITトークン(Ini tia)— 短期および将来の価格予測
私の見解:短期的には強気の勢いがありますが、急激な反落のリスクも高いです。
最近の値動きは、2026年10月23日に発生した深刻なセキュリティインシデント後の回復を示しています。このインシデントにより、Ini tiaネットワークとそのロールアップは停止しました。プロジェクトは、調査が継続中であると報告しています。そのため、セキュリティに関する最新情報とネットワークの復旧が、トークンの今後の価格を左右する重要な要因となります。
最近のパフォーマンスとテクニカル分析
最近の傾向:INITはセキュリティインシデント後に反発しています。
テクニカル面の勢い:指標は強気の勢いを示していますが、RSIは買われ過ぎの領域に入り、調整のリスクが高まっています。
ファンダメンタルズ面のリスク:チームはセキュリティパッチを監査し、ネットワークの復旧に向けて準備しています。復旧に成功すれば価格を支える可能性がありますが、遅延すれば売りにつながるおそれがあります。
今後の価格予測
シナリオ
重要な価格水準
解釈
強気
$0.1886–$0.1996
上抜けが持続すれば、さらなる上昇につながる可能性があります。
中立
$0.1617–$0.1886
価格はこの範囲内で持ち合う可能性があります。
弱気
$0.1617を下回る
弱含みとなれば、価格は$0.1536または$0.1437付近まで下落する可能性があります。
これらは10月28日に報告されたテクニカル上の参考水準であり、確実な目標価格ではありません。
最終予測:上昇か、それとも下落か?
短期:慎重ながらも強気ですが、反落の可能性があります。
今後数週間:方向性はネットワークの復旧、市場心理、買いの出来高に大きく左右されます。次回予定されているトークンのロック解除は2026年11月24日で、追加の売り圧力が生じる可能性があります。
結論:急激な価格上昇を追いかけないでください。取引を判断する前に、レジスタンスを明確に上抜けるか、サポートを下抜けるかを確認しましょう。
これはシナリオに基づく予測であり、確実なものではなく、金融アドバイスでもありません。
#INIT #WENB #BLUR #CPIWatch #USJobData
私の見解:短期的には強気の勢いがありますが、急激な反落のリスクも高いです。
最近の値動きは、2026年10月23日に発生した深刻なセキュリティインシデント後の回復を示しています。このインシデントにより、Ini tiaネットワークとそのロールアップは停止しました。プロジェクトは、調査が継続中であると報告しています。そのため、セキュリティに関する最新情報とネットワークの復旧が、トークンの今後の価格を左右する重要な要因となります。
最近のパフォーマンスとテクニカル分析
最近の傾向:INITはセキュリティインシデント後に反発しています。
テクニカル面の勢い:指標は強気の勢いを示していますが、RSIは買われ過ぎの領域に入り、調整のリスクが高まっています。
ファンダメンタルズ面のリスク:チームはセキュリティパッチを監査し、ネットワークの復旧に向けて準備しています。復旧に成功すれば価格を支える可能性がありますが、遅延すれば売りにつながるおそれがあります。
今後の価格予測
シナリオ
重要な価格水準
解釈
強気
$0.1886–$0.1996
上抜けが持続すれば、さらなる上昇につながる可能性があります。
中立
$0.1617–$0.1886
価格はこの範囲内で持ち合う可能性があります。
弱気
$0.1617を下回る
弱含みとなれば、価格は$0.1536または$0.1437付近まで下落する可能性があります。
これらは10月28日に報告されたテクニカル上の参考水準であり、確実な目標価格ではありません。
最終予測:上昇か、それとも下落か?
短期:慎重ながらも強気ですが、反落の可能性があります。
今後数週間:方向性はネットワークの復旧、市場心理、買いの出来高に大きく左右されます。次回予定されているトークンのロック解除は2026年11月24日で、追加の売り圧力が生じる可能性があります。
結論:急激な価格上昇を追いかけないでください。取引を判断する前に、レジスタンスを明確に上抜けるか、サポートを下抜けるかを確認しましょう。
これはシナリオに基づく予測であり、確実なものではなく、金融アドバイスでもありません。
#INIT #WENB #BLUR #CPIWatch #USJobData
315
·
--
翻訳参照
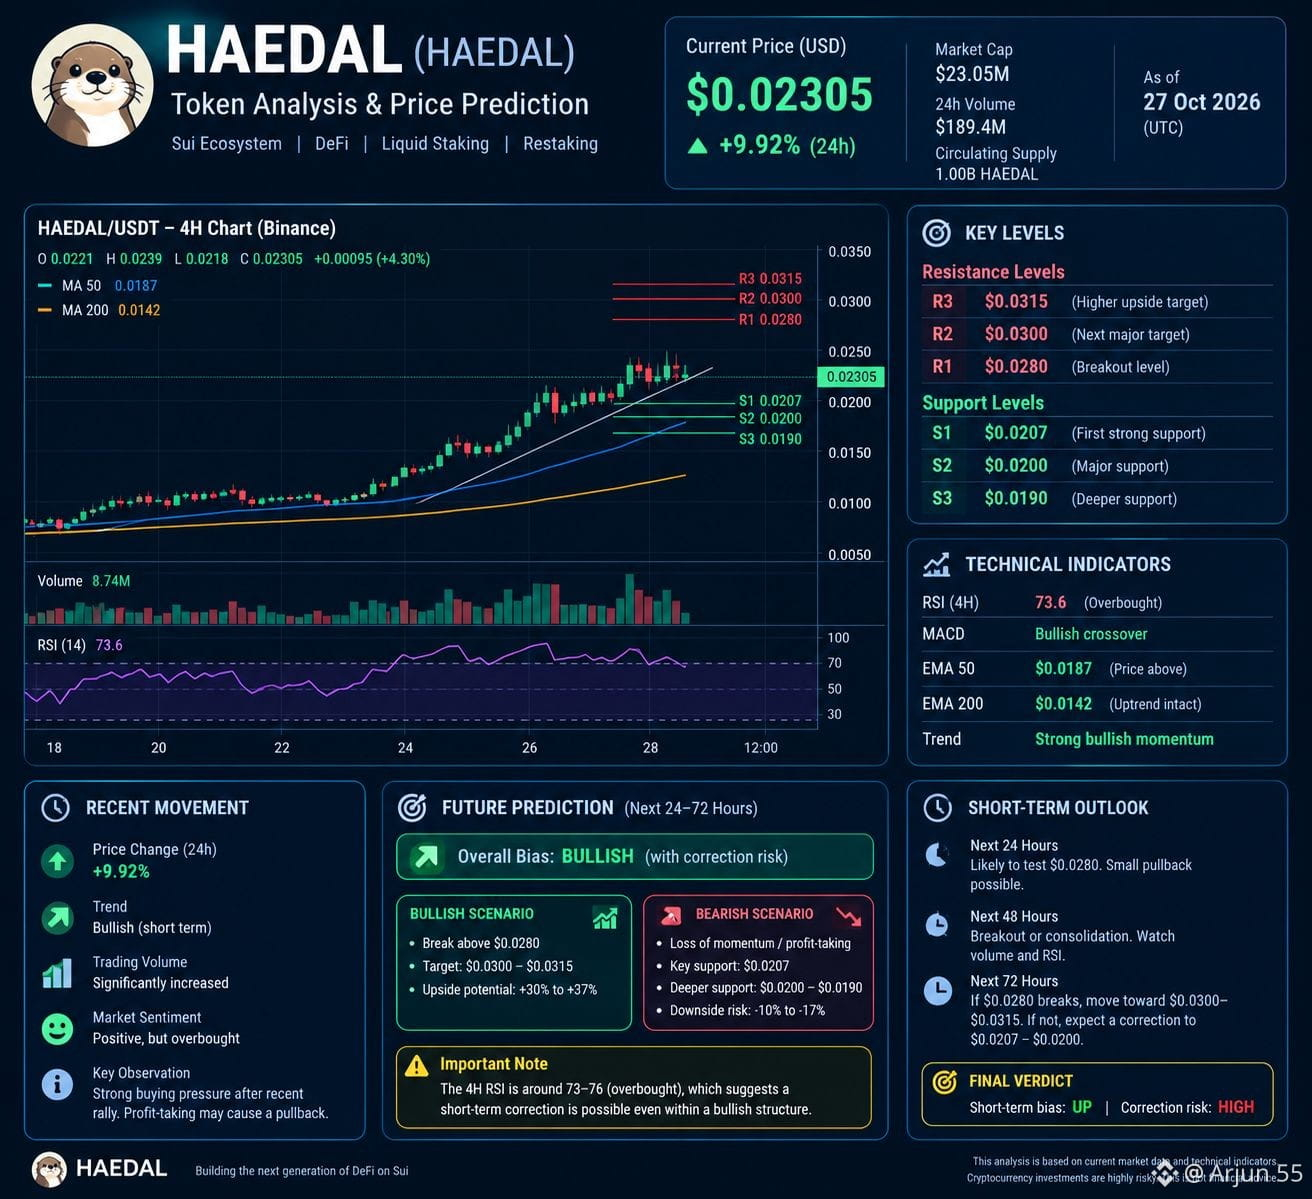
$HAEDAL HAE DAL Token — Latest Analysis
As of 27 October 2026
Hae dal Protocol
According to HAE DAL market page, the latest reported price is approximately $0.02305, up 9.92% in 24 hours. Prices vary across exchanges and updates continuously.
Recent movement
Short-term trend: Bullish.
Momentum: Strong buying activity, with a significant rise in trading volume.
Risk: After a sharp rally, profit-taking could cause a pullback.
Important support and resistance
Based on the latest technical analysis available, these are approximate levels.
Level
Price (USD)
Significance
Resistance 3
$0.0315
Higher upside target
Resistance 2
$0.0300
Next major target
Resistance 1
$0.0280
Breakout level
Support 1
$0.0207
Important support
Support 2
$0.0200
Stronger support
Support 3
$0.0190
Deeper support
Future prediction: Next 24–72 hours
My assessment: Bullish trend, but high correction risk.
Bullish scenario: A sustained break above $0.0280 could open a move toward $0.0300–$0.0315.
Bearish scenario: If the rally loses momentum, profit-taking could cause a sharp pullback. Watch whether the price holds above $0.0207.
Main warning: The 4-hour RSI is around 93, indicating extremely overbought conditions in the latest technical report. A correction is possible even while the broader trend remains bullish.
Final verdict
Short-term bias: UP Correction risk: HIGH
The price is showing strong upward momentum, but a sharp rally is not a guarantee of further gains. I would look for a confirmed breakout above $0.0280 rather than assume the price will keep rising.
This is a scenario-based forecast, not a guaranteed prediction or personalized financial advice.
#FOMCWatch #haedal #brev #cyphb #cpiwatch
{spot}(HAEDALUSDT)
{spot}(BREVUSDT)
{spot}(CYPHBUSDT)
$HAEDAL HAE DAL Token — Latest Analysis
As of 27 October 2026
Hae dal Protocol
According to HAE DAL market page, the latest reported price is approximately $0.02305, up 9.92% in 24 hours. Prices vary across exchanges and updates continuously.
Recent movement
Short-term trend: Bullish.
Momentum: Strong buying activity, with a significant rise in trading volume.
Risk: After a sharp rally, profit-taking could cause a pullback.
Important support and resistance
Based on the latest technical analysis available, these are approximate levels.
Level
Price (USD)
Significance
Resistance 3
$0.0315
Higher upside target
Resistance 2
$0.0300
Next major target
Resistance 1
$0.0280
Breakout level
Support 1
$0.0207
Important support
Support 2
$0.0200
Stronger support
Support 3
$0.0190
Deeper support
Future prediction: Next 24–72 hours
My assessment: Bullish trend, but high correction risk.
Bullish scenario: A sustained break above $0.0280 could open a move toward $0.0300–$0.0315.
Bearish scenario: If the rally loses momentum, profit-taking could cause a sharp pullback. Watch whether the price holds above $0.0207.
Main warning: The 4-hour RSI is around 93, indicating extremely overbought conditions in the latest technical report. A correction is possible even while the broader trend remains bullish.
Final verdict
Short-term bias: UP Correction risk: HIGH
The price is showing strong upward momentum, but a sharp rally is not a guarantee of further gains. I would look for a confirmed breakout above $0.0280 rather than assume the price will keep rising.
This is a scenario-based forecast, not a guaranteed prediction or personalized financial advice.
#FOMCWatch #haedal #brev #cyphb #cpiwatch
As of 27 October 2026
Hae dal Protocol
According to HAE DAL market page, the latest reported price is approximately $0.02305, up 9.92% in 24 hours. Prices vary across exchanges and updates continuously.
Recent movement
Short-term trend: Bullish.
Momentum: Strong buying activity, with a significant rise in trading volume.
Risk: After a sharp rally, profit-taking could cause a pullback.
Important support and resistance
Based on the latest technical analysis available, these are approximate levels.
Level
Price (USD)
Significance
Resistance 3
$0.0315
Higher upside target
Resistance 2
$0.0300
Next major target
Resistance 1
$0.0280
Breakout level
Support 1
$0.0207
Important support
Support 2
$0.0200
Stronger support
Support 3
$0.0190
Deeper support
Future prediction: Next 24–72 hours
My assessment: Bullish trend, but high correction risk.
Bullish scenario: A sustained break above $0.0280 could open a move toward $0.0300–$0.0315.
Bearish scenario: If the rally loses momentum, profit-taking could cause a sharp pullback. Watch whether the price holds above $0.0207.
Main warning: The 4-hour RSI is around 93, indicating extremely overbought conditions in the latest technical report. A correction is possible even while the broader trend remains bullish.
Final verdict
Short-term bias: UP Correction risk: HIGH
The price is showing strong upward momentum, but a sharp rally is not a guarantee of further gains. I would look for a confirmed breakout above $0.0280 rather than assume the price will keep rising.
This is a scenario-based forecast, not a guaranteed prediction or personalized financial advice.
#FOMCWatch #haedal #brev #cyphb #cpiwatch
278
·
--
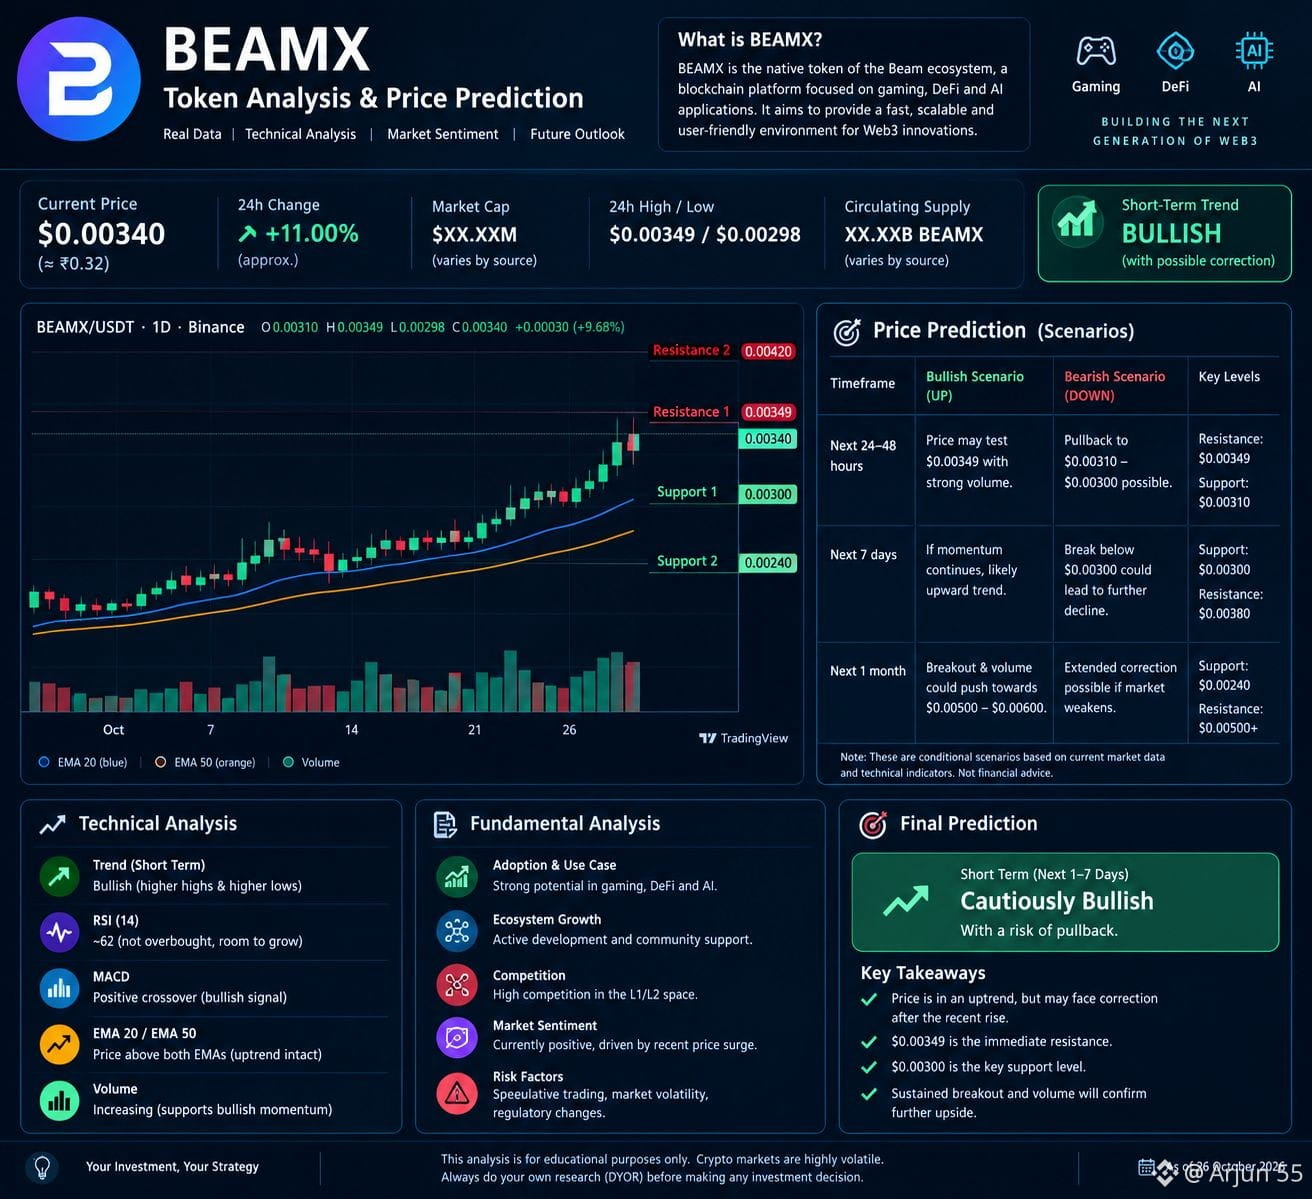
$BEAMX BEAM Xトークン分析&価格予測
日付:2026年10月26日
現在の市場状況
現在価格:約$0.00340(₹0.32)。
24時間の値動き:約11%上昇。
市場トレンド:短期的には強気ですが、急上昇後に調整する可能性があります。
今後の予測:上昇か下落か?
期間
予測
注目水準
今後24~48時間
強気。ただし、値動きが激しくなる可能性あり
$0.00349付近がレジスタンス
今後7日間
勢いが続けば、中立から強気
$0.00300のサポートに注目
今後1か月
不透明。市場の勢い次第
ブレイクアウトと取引量に注目
これらは条件付きのシナリオであり、価格目標を保証するものではありません。
今後、何が起こる可能性がある?
強気シナリオ(上昇):
価格が大きな取引量を伴って$0.00349を上回る。
ブレイクアウトが維持されれば、さらなる上昇につながる可能性があります。
弱気シナリオ(下落):
価格が$0.00300を下回り、回復できない。
より深い調整となる可能性が高まります。
ファンダメンタル分析
最近の分析によると、BEAMの成長余地は、ゲーム、DeFi、AI関連アプリケーションでの普及に左右されます。ただし、競争や投機的な取引は引き続き大きなリスクです。
最終予測
短期:慎重ながら強気。ただし、反落のリスクもあります。
最近の価格上昇は心強いものの、1日分の上昇だけでは、上昇トレンドが持続すると判断するには不十分です。
#BEAMX #chip #ERA #CPIWatch #USjobs
{spot}(BEAMXUSDT)
{spot}(CHIPUSDT)
{spot}(ERAUSDT)
$BEAMX BEAM Xトークン分析&価格予測
日付:2026年10月26日
現在の市場状況
現在価格:約$0.00340(₹0.32)。
24時間の値動き:約11%上昇。
市場トレンド:短期的には強気ですが、急上昇後に調整する可能性があります。
今後の予測:上昇か下落か?
期間
予測
注目水準
今後24~48時間
強気。ただし、値動きが激しくなる可能性あり
$0.00349付近がレジスタンス
今後7日間
勢いが続けば、中立から強気
$0.00300のサポートに注目
今後1か月
不透明。市場の勢い次第
ブレイクアウトと取引量に注目
これらは条件付きのシナリオであり、価格目標を保証するものではありません。
今後、何が起こる可能性がある?
強気シナリオ(上昇):
価格が大きな取引量を伴って$0.00349を上回る。
ブレイクアウトが維持されれば、さらなる上昇につながる可能性があります。
弱気シナリオ(下落):
価格が$0.00300を下回り、回復できない。
より深い調整となる可能性が高まります。
ファンダメンタル分析
最近の分析によると、BEAMの成長余地は、ゲーム、DeFi、AI関連アプリケーションでの普及に左右されます。ただし、競争や投機的な取引は引き続き大きなリスクです。
最終予測
短期:慎重ながら強気。ただし、反落のリスクもあります。
最近の価格上昇は心強いものの、1日分の上昇だけでは、上昇トレンドが持続すると判断するには不十分です。
#BEAMX #chip #ERA #CPIWatch #USjobs
日付:2026年10月26日
現在の市場状況
現在価格:約$0.00340(₹0.32)。
24時間の値動き:約11%上昇。
市場トレンド:短期的には強気ですが、急上昇後に調整する可能性があります。
今後の予測:上昇か下落か?
期間
予測
注目水準
今後24~48時間
強気。ただし、値動きが激しくなる可能性あり
$0.00349付近がレジスタンス
今後7日間
勢いが続けば、中立から強気
$0.00300のサポートに注目
今後1か月
不透明。市場の勢い次第
ブレイクアウトと取引量に注目
これらは条件付きのシナリオであり、価格目標を保証するものではありません。
今後、何が起こる可能性がある?
強気シナリオ(上昇):
価格が大きな取引量を伴って$0.00349を上回る。
ブレイクアウトが維持されれば、さらなる上昇につながる可能性があります。
弱気シナリオ(下落):
価格が$0.00300を下回り、回復できない。
より深い調整となる可能性が高まります。
ファンダメンタル分析
最近の分析によると、BEAMの成長余地は、ゲーム、DeFi、AI関連アプリケーションでの普及に左右されます。ただし、競争や投機的な取引は引き続き大きなリスクです。
最終予測
短期:慎重ながら強気。ただし、反落のリスクもあります。
最近の価格上昇は心強いものの、1日分の上昇だけでは、上昇トレンドが持続すると判断するには不十分です。
#BEAMX #chip #ERA #CPIWatch #USjobs
1
110
·
--
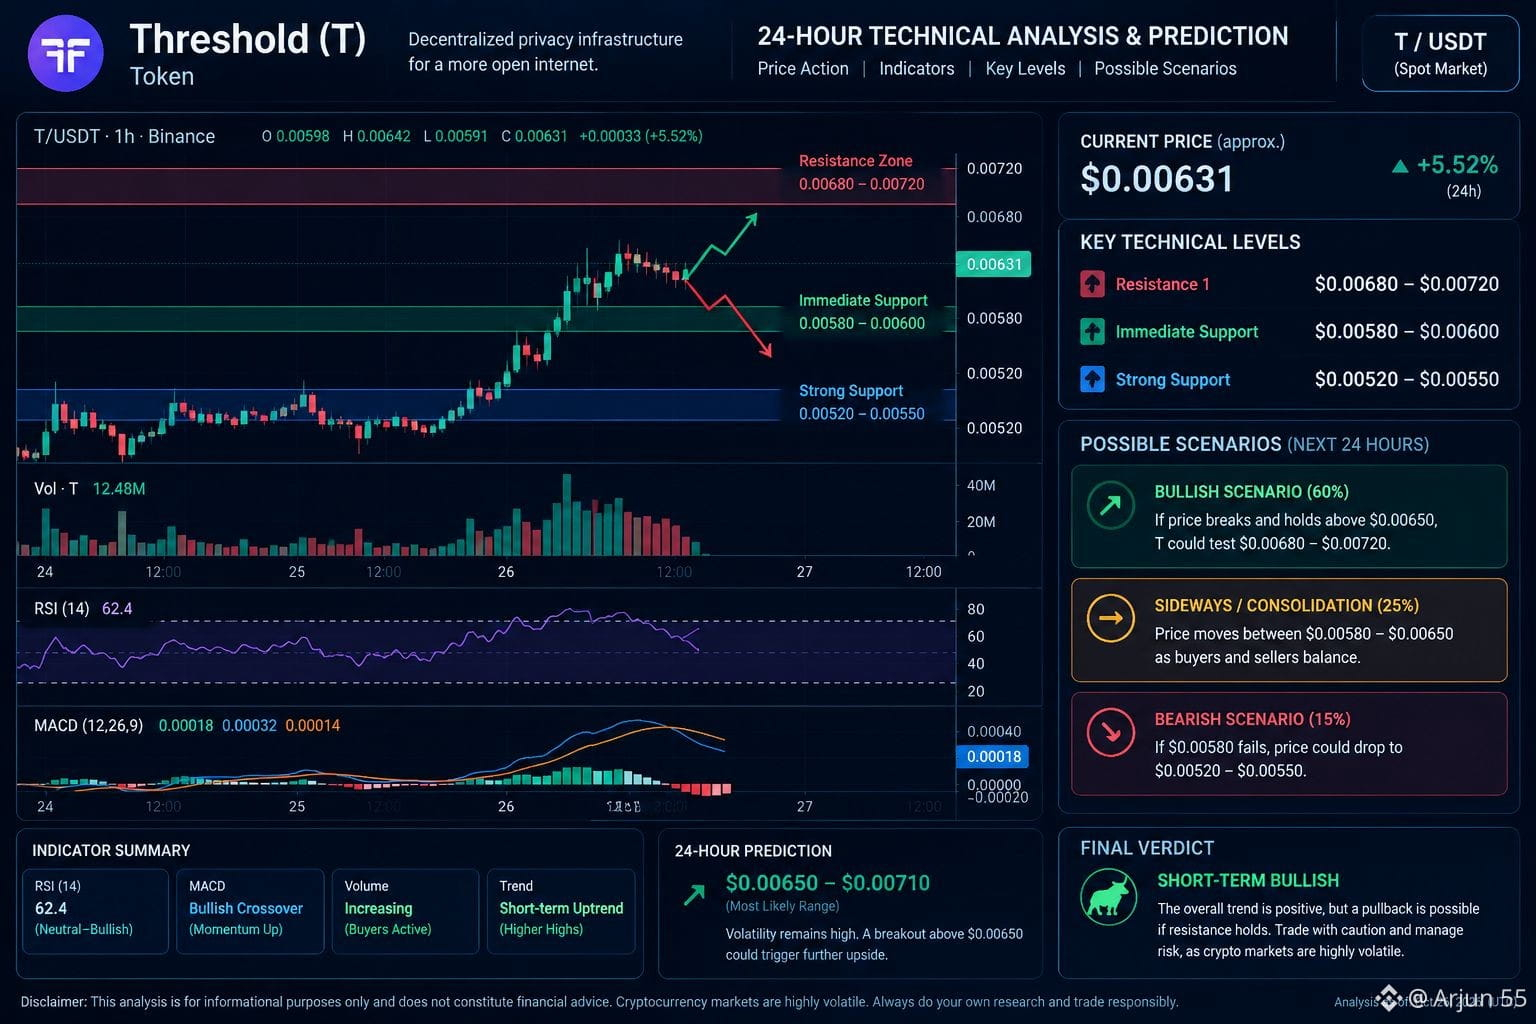
$T Threshold(T)トークン — 最近の動向と今後の予測
最近の値動き
最近の市場データによると、2026年10月下旬のTは、取引所によって価格に差があるものの、0.0045~0.0050ドル付近で取引されています。直近では価格が軟化しており、売り圧力がうかがえます。
テクニカル分析:上昇か下落か?
テクニカル指標は強気への反転の可能性を示していますが、価格の変動は非常に大きくなっています。ある分析では、RSIは69前後で、強いモメンタムを示す一方、短期的に買われ過ぎとなるリスクもあるとされています。
価格水準
意味
0.0045~0.0046ドル
サポートゾーン
0.0050~0.0056ドル
回復の可能性があるゾーン
0.0062~0.0066ドル
レジスタンスゾーン
0.0066ドル超
ブレイクアウトが維持されれば、さらに上昇する可能性
今後の予測
短期(1~7日):値動きが大きくなる見込みです。反発の可能性はありますが、調整も否定できません。
強気シナリオ:0.0062~0.0066ドルを上回る動きが続けば、0.0070ドルを目指す展開となる可能性があります。
弱気シナリオ:0.0045ドルを下回ると、さらに下落する可能性があります。
最終見解
私の見立て:レジスタンスを上抜ければ慎重ながら強気、それ以外の場合は、値動きの大きさや下落の可能性に注意が必要です。これは条件付きのテクニカル見通しであり、確実な予測ではありません。
#threshold #t #QI #ENA #CPIWatch
{spot}(ENAUSDT)
{spot}(QIUSDT)
{spot}(DASHUSDT)
$T Threshold(T)トークン — 最近の動向と今後の予測
最近の値動き
最近の市場データによると、2026年10月下旬のTは、取引所によって価格に差があるものの、0.0045~0.0050ドル付近で取引されています。直近では価格が軟化しており、売り圧力がうかがえます。
テクニカル分析:上昇か下落か?
テクニカル指標は強気への反転の可能性を示していますが、価格の変動は非常に大きくなっています。ある分析では、RSIは69前後で、強いモメンタムを示す一方、短期的に買われ過ぎとなるリスクもあるとされています。
価格水準
意味
0.0045~0.0046ドル
サポートゾーン
0.0050~0.0056ドル
回復の可能性があるゾーン
0.0062~0.0066ドル
レジスタンスゾーン
0.0066ドル超
ブレイクアウトが維持されれば、さらに上昇する可能性
今後の予測
短期(1~7日):値動きが大きくなる見込みです。反発の可能性はありますが、調整も否定できません。
強気シナリオ:0.0062~0.0066ドルを上回る動きが続けば、0.0070ドルを目指す展開となる可能性があります。
弱気シナリオ:0.0045ドルを下回ると、さらに下落する可能性があります。
最終見解
私の見立て:レジスタンスを上抜ければ慎重ながら強気、それ以外の場合は、値動きの大きさや下落の可能性に注意が必要です。これは条件付きのテクニカル見通しであり、確実な予測ではありません。
#threshold #t #QI #ENA #CPIWatch
最近の値動き
最近の市場データによると、2026年10月下旬のTは、取引所によって価格に差があるものの、0.0045~0.0050ドル付近で取引されています。直近では価格が軟化しており、売り圧力がうかがえます。
テクニカル分析:上昇か下落か?
テクニカル指標は強気への反転の可能性を示していますが、価格の変動は非常に大きくなっています。ある分析では、RSIは69前後で、強いモメンタムを示す一方、短期的に買われ過ぎとなるリスクもあるとされています。
価格水準
意味
0.0045~0.0046ドル
サポートゾーン
0.0050~0.0056ドル
回復の可能性があるゾーン
0.0062~0.0066ドル
レジスタンスゾーン
0.0066ドル超
ブレイクアウトが維持されれば、さらに上昇する可能性
今後の予測
短期(1~7日):値動きが大きくなる見込みです。反発の可能性はありますが、調整も否定できません。
強気シナリオ:0.0062~0.0066ドルを上回る動きが続けば、0.0070ドルを目指す展開となる可能性があります。
弱気シナリオ:0.0045ドルを下回ると、さらに下落する可能性があります。
最終見解
私の見立て:レジスタンスを上抜ければ慎重ながら強気、それ以外の場合は、値動きの大きさや下落の可能性に注意が必要です。これは条件付きのテクニカル見通しであり、確実な予測ではありません。
#threshold #t #QI #ENA #CPIWatch
253
·
--
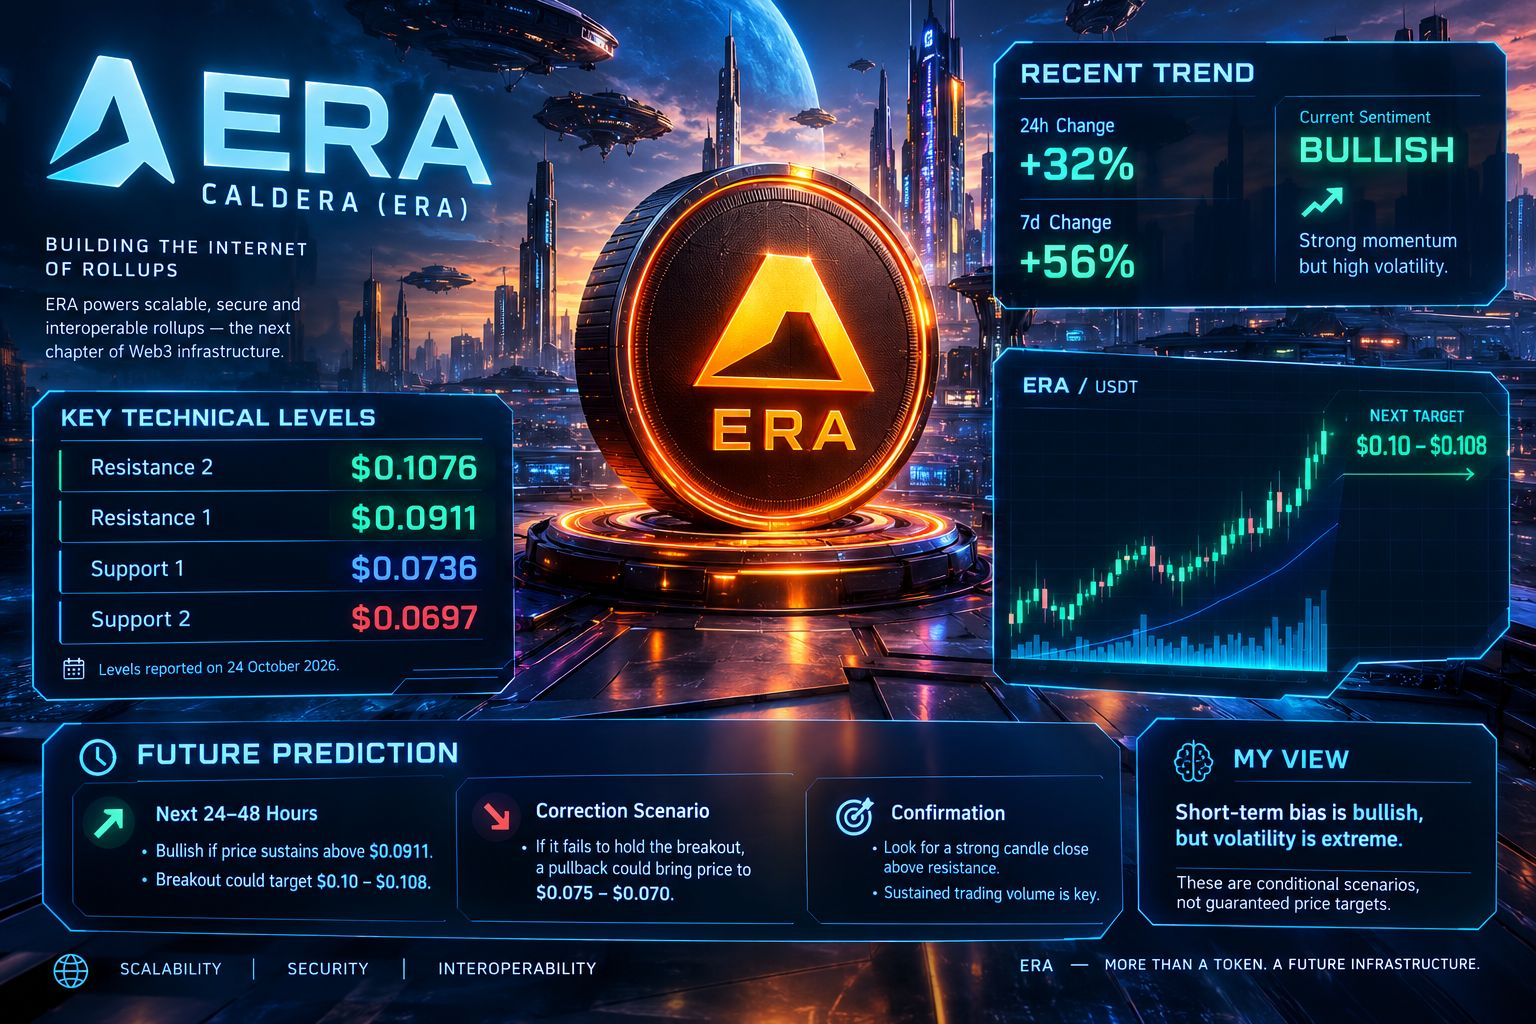
$ERA ERAトークン — 最近の動向と今後の予測
トークン:Caldera(ERA)・分析日:2026年10月24日
短評:強気の勢いがある一方、調整リスクも高い。
最近の市場データによると、ERAは大幅に上昇し、24時間で約32%、7日間で56%の上昇を記録したと報告されています。テクニカル指標も強気傾向を示していますが、これほど急速な上昇は利益確定売りや急反落を招く可能性があります。
注目すべき主要水準
レジスタンス2:$0.1076
レジスタンス1:$0.0911
サポート1:$0.0736
サポート2:$0.0697
テクニカル水準は2026年10月24日時点の報告値です。
今後の予測
今後24~48時間:価格が$0.0911を上回って推移すれば強気。上抜けに成功した場合、$0.10~$0.108が目標となる可能性があります。
調整シナリオ:上抜け水準を維持できなければ、$0.075~$0.070付近まで反落する可能性があります。
確認ポイント:取引量を維持しながら、レジスタンスを上回ってローソク足が強く確定するかを確認しましょう。
私の見解:短期的には強気ですが、ボラティリティは極めて高い状況です。これらは条件付きのシナリオであり、価格目標を保証するものではありません。
#ERA #BMT #Anime #CPIWatch #USJobData
{spot}(ERAUSDT)
{spot}(ANIMEUSDT)
{spot}(BMTUSDT)
$ERA ERAトークン — 最近の動向と今後の予測
トークン:Caldera(ERA)・分析日:2026年10月24日
短評:強気の勢いがある一方、調整リスクも高い。
最近の市場データによると、ERAは大幅に上昇し、24時間で約32%、7日間で56%の上昇を記録したと報告されています。テクニカル指標も強気傾向を示していますが、これほど急速な上昇は利益確定売りや急反落を招く可能性があります。
注目すべき主要水準
レジスタンス2:$0.1076
レジスタンス1:$0.0911
サポート1:$0.0736
サポート2:$0.0697
テクニカル水準は2026年10月24日時点の報告値です。
今後の予測
今後24~48時間:価格が$0.0911を上回って推移すれば強気。上抜けに成功した場合、$0.10~$0.108が目標となる可能性があります。
調整シナリオ:上抜け水準を維持できなければ、$0.075~$0.070付近まで反落する可能性があります。
確認ポイント:取引量を維持しながら、レジスタンスを上回ってローソク足が強く確定するかを確認しましょう。
私の見解:短期的には強気ですが、ボラティリティは極めて高い状況です。これらは条件付きのシナリオであり、価格目標を保証するものではありません。
#ERA #BMT #Anime #CPIWatch #USJobData
トークン:Caldera(ERA)・分析日:2026年10月24日
短評:強気の勢いがある一方、調整リスクも高い。
最近の市場データによると、ERAは大幅に上昇し、24時間で約32%、7日間で56%の上昇を記録したと報告されています。テクニカル指標も強気傾向を示していますが、これほど急速な上昇は利益確定売りや急反落を招く可能性があります。
注目すべき主要水準
レジスタンス2:$0.1076
レジスタンス1:$0.0911
サポート1:$0.0736
サポート2:$0.0697
テクニカル水準は2026年10月24日時点の報告値です。
今後の予測
今後24~48時間:価格が$0.0911を上回って推移すれば強気。上抜けに成功した場合、$0.10~$0.108が目標となる可能性があります。
調整シナリオ:上抜け水準を維持できなければ、$0.075~$0.070付近まで反落する可能性があります。
確認ポイント:取引量を維持しながら、レジスタンスを上回ってローソク足が強く確定するかを確認しましょう。
私の見解:短期的には強気ですが、ボラティリティは極めて高い状況です。これらは条件付きのシナリオであり、価格目標を保証するものではありません。
#ERA #BMT #Anime #CPIWatch #USJobData
383
·
--
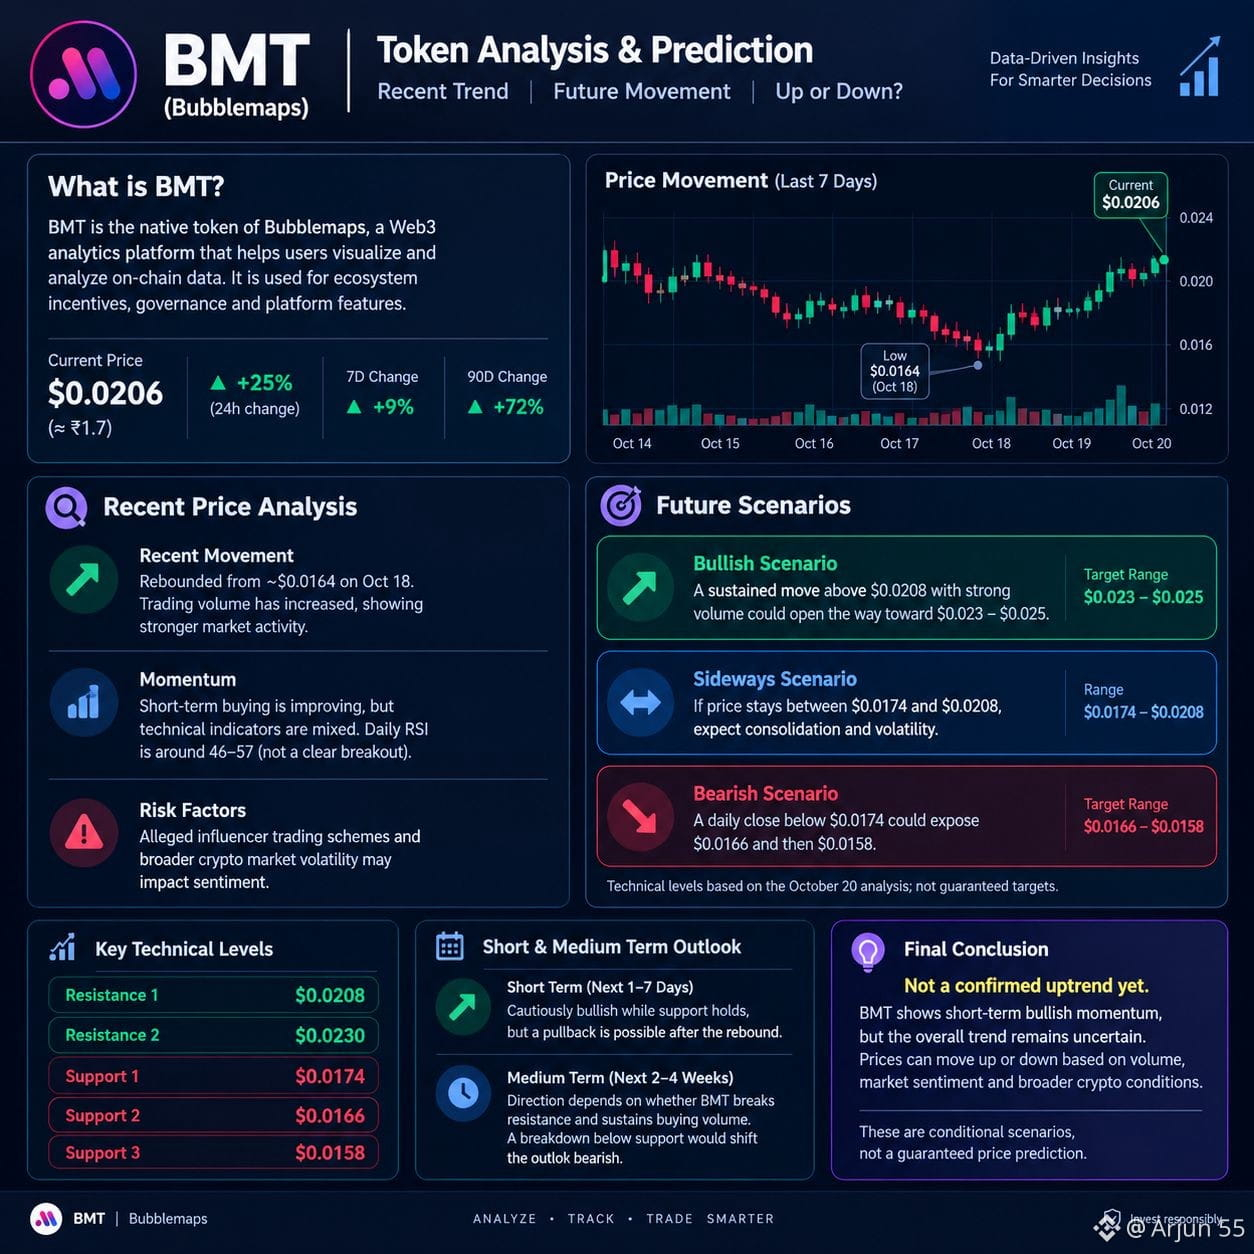
$BMT BMTトークン — 最近の動向と今後の予測
分析日:2026年10月20日 · BMTはBubble Maps(BMT)を指すものと仮定
私の見解:短期的には強気の勢いがありますが、全体的なトレンドは依然として不透明です。BMTは最近反発しましたが、価格が急上昇した後には利益確定売りが出る可能性があります。
確認できた最新の市場データによると、BMTは約$0.0206(約₹1.7)で取引されており、24時間で約25%上昇しました。7日間の変動率は約+9%、90日間では約+72%でした。価格は取引所によって異なり、常に変動しています。
最近の価格分析
最近の値動き:BMTは10月18日の約$0.0164から反発しました。取引量も増加しており、市場活動が活発化していることがうかがえます。
モメンタム:短期的な買いの勢いは改善していますが、テクニカル指標はまちまちです。異なる時点のデータでは、日足RSIは46~57付近と報告されており、明確なブレイクアウトを示すシグナルではありません。
リスク:インフルエンサーによる取引スキーム疑惑に関する最近の報道は、暗号資産市場全体の変動と相まって、市場心理に影響を及ぼす可能性があります。
今後の予測 — 上昇か下落か?
強気シナリオ
取引量を伴って$0.0208を上回る動きが続けば、$0.023~$0.025を目指す展開となる可能性があります。
横ばいシナリオ
価格が約$0.0174~$0.0208の範囲にとどまれば、もみ合いと値動きの荒い展開が予想されます。
弱気シナリオ
日足終値が$0.0174を下回ると、$0.0166、さらに$0.0158まで下落する可能性があります。
テクニカル水準は10月20日時点の分析に基づくものであり、目標価格が達成される保証はありません。
最終結論
短期(今後1~7日):サポートが維持される限り、慎重ながら強気です。ただし、反発後に押し戻される可能性もあります。
中期(今後2~4週間):方向性は、BMTがレジスタンスを突破し、買いの勢いを維持できるかどうかに左右されます。サポートを下抜ければ、見通しは弱気に傾くでしょう。
BMTがすでに上昇トレンドに入ったとは、まだ断言できません。これらは条件付きのシナリオであり、価格予測を保証するものではありません。
#BMT #ALT #GNS #CPIWatch #USJobData
{spot}(BMTUSDT)
{spot}(ALTUSDT)
{spot}(GNSUSDT)
$BMT BMTトークン — 最近の動向と今後の予測
分析日:2026年10月20日 · BMTはBubble Maps(BMT)を指すものと仮定
私の見解:短期的には強気の勢いがありますが、全体的なトレンドは依然として不透明です。BMTは最近反発しましたが、価格が急上昇した後には利益確定売りが出る可能性があります。
確認できた最新の市場データによると、BMTは約$0.0206(約₹1.7)で取引されており、24時間で約25%上昇しました。7日間の変動率は約+9%、90日間では約+72%でした。価格は取引所によって異なり、常に変動しています。
最近の価格分析
最近の値動き:BMTは10月18日の約$0.0164から反発しました。取引量も増加しており、市場活動が活発化していることがうかがえます。
モメンタム:短期的な買いの勢いは改善していますが、テクニカル指標はまちまちです。異なる時点のデータでは、日足RSIは46~57付近と報告されており、明確なブレイクアウトを示すシグナルではありません。
リスク:インフルエンサーによる取引スキーム疑惑に関する最近の報道は、暗号資産市場全体の変動と相まって、市場心理に影響を及ぼす可能性があります。
今後の予測 — 上昇か下落か?
強気シナリオ
取引量を伴って$0.0208を上回る動きが続けば、$0.023~$0.025を目指す展開となる可能性があります。
横ばいシナリオ
価格が約$0.0174~$0.0208の範囲にとどまれば、もみ合いと値動きの荒い展開が予想されます。
弱気シナリオ
日足終値が$0.0174を下回ると、$0.0166、さらに$0.0158まで下落する可能性があります。
テクニカル水準は10月20日時点の分析に基づくものであり、目標価格が達成される保証はありません。
最終結論
短期(今後1~7日):サポートが維持される限り、慎重ながら強気です。ただし、反発後に押し戻される可能性もあります。
中期(今後2~4週間):方向性は、BMTがレジスタンスを突破し、買いの勢いを維持できるかどうかに左右されます。サポートを下抜ければ、見通しは弱気に傾くでしょう。
BMTがすでに上昇トレンドに入ったとは、まだ断言できません。これらは条件付きのシナリオであり、価格予測を保証するものではありません。
#BMT #ALT #GNS #CPIWatch #USJobData
分析日:2026年10月20日 · BMTはBubble Maps(BMT)を指すものと仮定
私の見解:短期的には強気の勢いがありますが、全体的なトレンドは依然として不透明です。BMTは最近反発しましたが、価格が急上昇した後には利益確定売りが出る可能性があります。
確認できた最新の市場データによると、BMTは約$0.0206(約₹1.7)で取引されており、24時間で約25%上昇しました。7日間の変動率は約+9%、90日間では約+72%でした。価格は取引所によって異なり、常に変動しています。
最近の価格分析
最近の値動き:BMTは10月18日の約$0.0164から反発しました。取引量も増加しており、市場活動が活発化していることがうかがえます。
モメンタム:短期的な買いの勢いは改善していますが、テクニカル指標はまちまちです。異なる時点のデータでは、日足RSIは46~57付近と報告されており、明確なブレイクアウトを示すシグナルではありません。
リスク:インフルエンサーによる取引スキーム疑惑に関する最近の報道は、暗号資産市場全体の変動と相まって、市場心理に影響を及ぼす可能性があります。
今後の予測 — 上昇か下落か?
強気シナリオ
取引量を伴って$0.0208を上回る動きが続けば、$0.023~$0.025を目指す展開となる可能性があります。
横ばいシナリオ
価格が約$0.0174~$0.0208の範囲にとどまれば、もみ合いと値動きの荒い展開が予想されます。
弱気シナリオ
日足終値が$0.0174を下回ると、$0.0166、さらに$0.0158まで下落する可能性があります。
テクニカル水準は10月20日時点の分析に基づくものであり、目標価格が達成される保証はありません。
最終結論
短期(今後1~7日):サポートが維持される限り、慎重ながら強気です。ただし、反発後に押し戻される可能性もあります。
中期(今後2~4週間):方向性は、BMTがレジスタンスを突破し、買いの勢いを維持できるかどうかに左右されます。サポートを下抜ければ、見通しは弱気に傾くでしょう。
BMTがすでに上昇トレンドに入ったとは、まだ断言できません。これらは条件付きのシナリオであり、価格予測を保証するものではありません。
#BMT #ALT #GNS #CPIWatch #USJobData
149
·
--
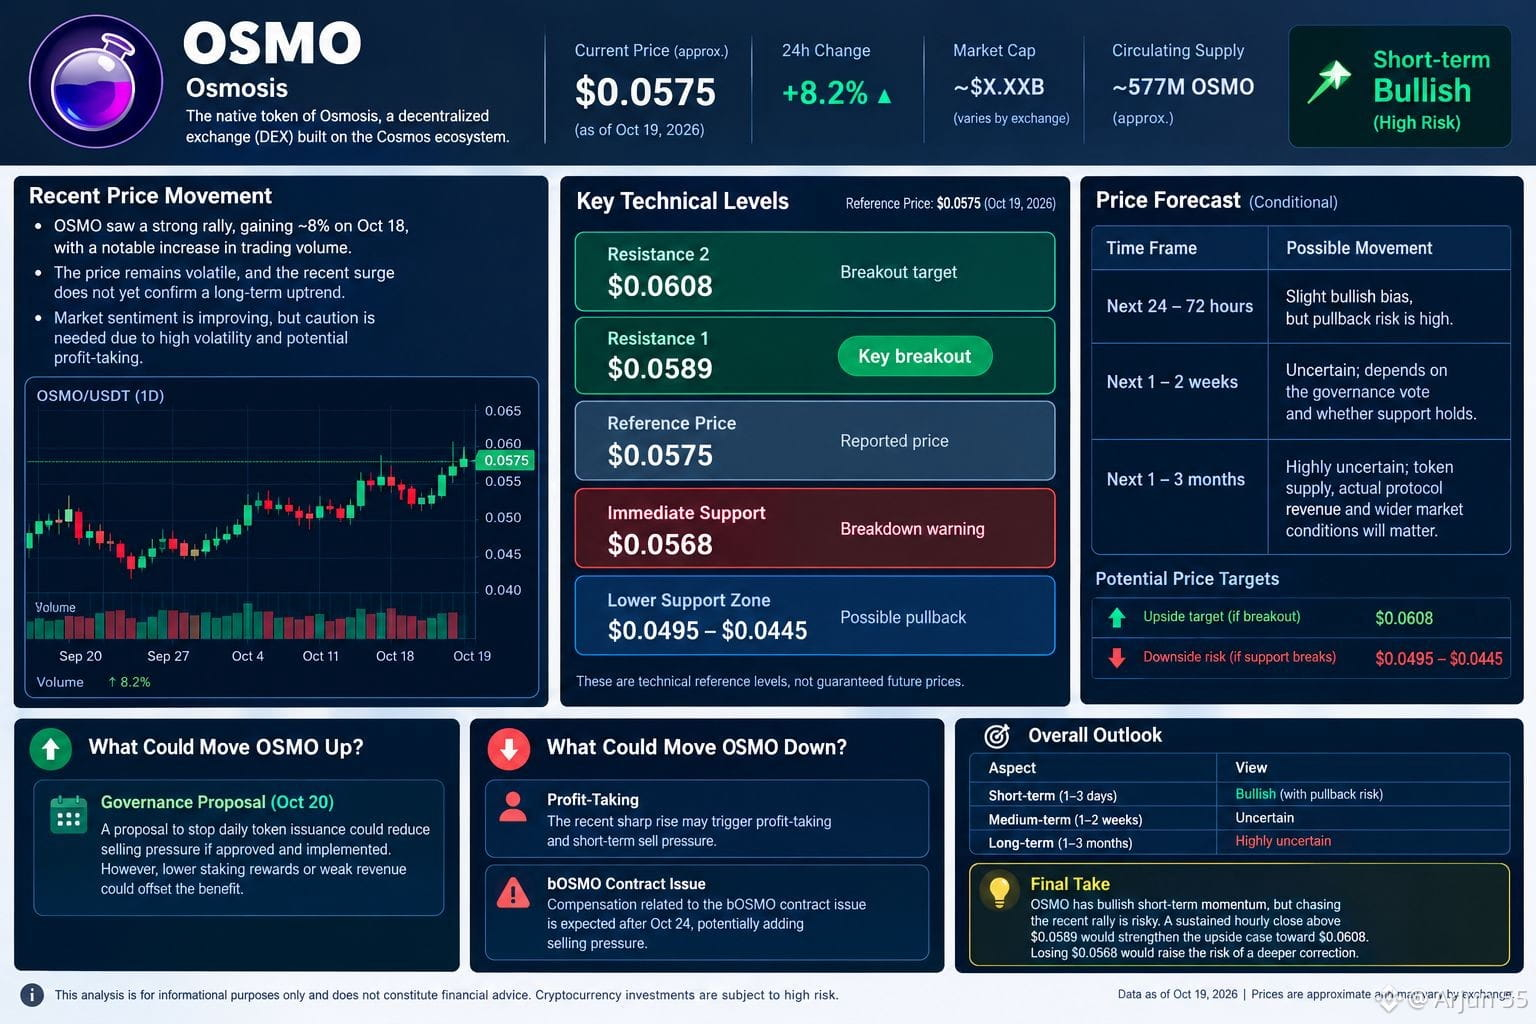
$OSMO トークン分析 — 2026年10月19日
Osmosis(OSMO)
OSMOは最近急騰し、10月18日には1日あたり約8%の上昇が報告されました。
この動きに伴い取引量も大幅に増加しており、買い意欲の高まりがうかがえます。
ただし、価格の変動は非常に激しく、短期的な上昇だけでは、長期的な上昇トレンドが続くとはまだ判断できません。
テクニカル水準と今後の見通し
参考価格:約$0.0575(10月19日報告)。暗号資産の価格は取引所によって異なります。
第2レジスタンス
$0.0608 ブレイクアウト目標
第1レジスタンス
$0.0589
参考価格
$0.0575 報告価格
直近のサポート
$0.0568 下落警戒ライン
下値サポートゾーン
$0.0495–0.0445 押し戻しの可能性
これらはテクニカル上の参考水準であり、将来の価格を保証するものではありません。
弱気リスク:OSMOの急上昇により、利益確定売りが発生する可能性があります。1時間足が$0.0568を下回って引けた場合、目先の強気シナリオは弱まります。
ボラティリティリスク:OSMOのコントラクトに関する問題への補償は10月24日以降に行われる見込みで、売り圧力が強まる可能性があります。
4. 短期見通し
期間 条件付きの見通し
今後24~72時間 やや強気。ただし、押し戻しのリスクは高い
今後1~2週間 不透明。ガバナンス投票の結果とサポートが維持されるかどうかによる
今後1~3か月 非常に不透明。トークン供給量、プロトコルの実際の収益、暗号資産市場全体の状況が影響する
総合見解:OSMOは短期的に上昇の勢いがありますが、直近の急騰を追いかけるのはリスクを伴います。1時間足が$0.0589を上回って継続的に引ければ、$0.0608を目指す上昇シナリオが強まるでしょう。$0.0568を割り込むと、より深い調整のリスクが高まります。これらは条件付きのシナリオであり、価格の上昇または下落を確実視するものではありません。
これは市場分析であり、確実な予測や個人向けの金融アドバイスではありません。
#osmo #AVA #GTC #CPIWatch #USJobData
{spot}(OSMOUSDT)
{spot}(GTCUSDT)
{spot}(AVAUSDT)
$OSMO トークン分析 — 2026年10月19日
Osmosis(OSMO)
OSMOは最近急騰し、10月18日には1日あたり約8%の上昇が報告されました。
この動きに伴い取引量も大幅に増加しており、買い意欲の高まりがうかがえます。
ただし、価格の変動は非常に激しく、短期的な上昇だけでは、長期的な上昇トレンドが続くとはまだ判断できません。
テクニカル水準と今後の見通し
参考価格:約$0.0575(10月19日報告)。暗号資産の価格は取引所によって異なります。
第2レジスタンス
$0.0608 ブレイクアウト目標
第1レジスタンス
$0.0589
参考価格
$0.0575 報告価格
直近のサポート
$0.0568 下落警戒ライン
下値サポートゾーン
$0.0495–0.0445 押し戻しの可能性
これらはテクニカル上の参考水準であり、将来の価格を保証するものではありません。
弱気リスク:OSMOの急上昇により、利益確定売りが発生する可能性があります。1時間足が$0.0568を下回って引けた場合、目先の強気シナリオは弱まります。
ボラティリティリスク:OSMOのコントラクトに関する問題への補償は10月24日以降に行われる見込みで、売り圧力が強まる可能性があります。
4. 短期見通し
期間 条件付きの見通し
今後24~72時間 やや強気。ただし、押し戻しのリスクは高い
今後1~2週間 不透明。ガバナンス投票の結果とサポートが維持されるかどうかによる
今後1~3か月 非常に不透明。トークン供給量、プロトコルの実際の収益、暗号資産市場全体の状況が影響する
総合見解:OSMOは短期的に上昇の勢いがありますが、直近の急騰を追いかけるのはリスクを伴います。1時間足が$0.0589を上回って継続的に引ければ、$0.0608を目指す上昇シナリオが強まるでしょう。$0.0568を割り込むと、より深い調整のリスクが高まります。これらは条件付きのシナリオであり、価格の上昇または下落を確実視するものではありません。
これは市場分析であり、確実な予測や個人向けの金融アドバイスではありません。
#osmo #AVA #GTC #CPIWatch #USJobData
Osmosis(OSMO)
OSMOは最近急騰し、10月18日には1日あたり約8%の上昇が報告されました。
この動きに伴い取引量も大幅に増加しており、買い意欲の高まりがうかがえます。
ただし、価格の変動は非常に激しく、短期的な上昇だけでは、長期的な上昇トレンドが続くとはまだ判断できません。
テクニカル水準と今後の見通し
参考価格:約$0.0575(10月19日報告)。暗号資産の価格は取引所によって異なります。
第2レジスタンス
$0.0608 ブレイクアウト目標
第1レジスタンス
$0.0589
参考価格
$0.0575 報告価格
直近のサポート
$0.0568 下落警戒ライン
下値サポートゾーン
$0.0495–0.0445 押し戻しの可能性
これらはテクニカル上の参考水準であり、将来の価格を保証するものではありません。
弱気リスク:OSMOの急上昇により、利益確定売りが発生する可能性があります。1時間足が$0.0568を下回って引けた場合、目先の強気シナリオは弱まります。
ボラティリティリスク:OSMOのコントラクトに関する問題への補償は10月24日以降に行われる見込みで、売り圧力が強まる可能性があります。
4. 短期見通し
期間 条件付きの見通し
今後24~72時間 やや強気。ただし、押し戻しのリスクは高い
今後1~2週間 不透明。ガバナンス投票の結果とサポートが維持されるかどうかによる
今後1~3か月 非常に不透明。トークン供給量、プロトコルの実際の収益、暗号資産市場全体の状況が影響する
総合見解:OSMOは短期的に上昇の勢いがありますが、直近の急騰を追いかけるのはリスクを伴います。1時間足が$0.0589を上回って継続的に引ければ、$0.0608を目指す上昇シナリオが強まるでしょう。$0.0568を割り込むと、より深い調整のリスクが高まります。これらは条件付きのシナリオであり、価格の上昇または下落を確実視するものではありません。
これは市場分析であり、確実な予測や個人向けの金融アドバイスではありません。
#osmo #AVA #GTC #CPIWatch #USJobData
143
·
--
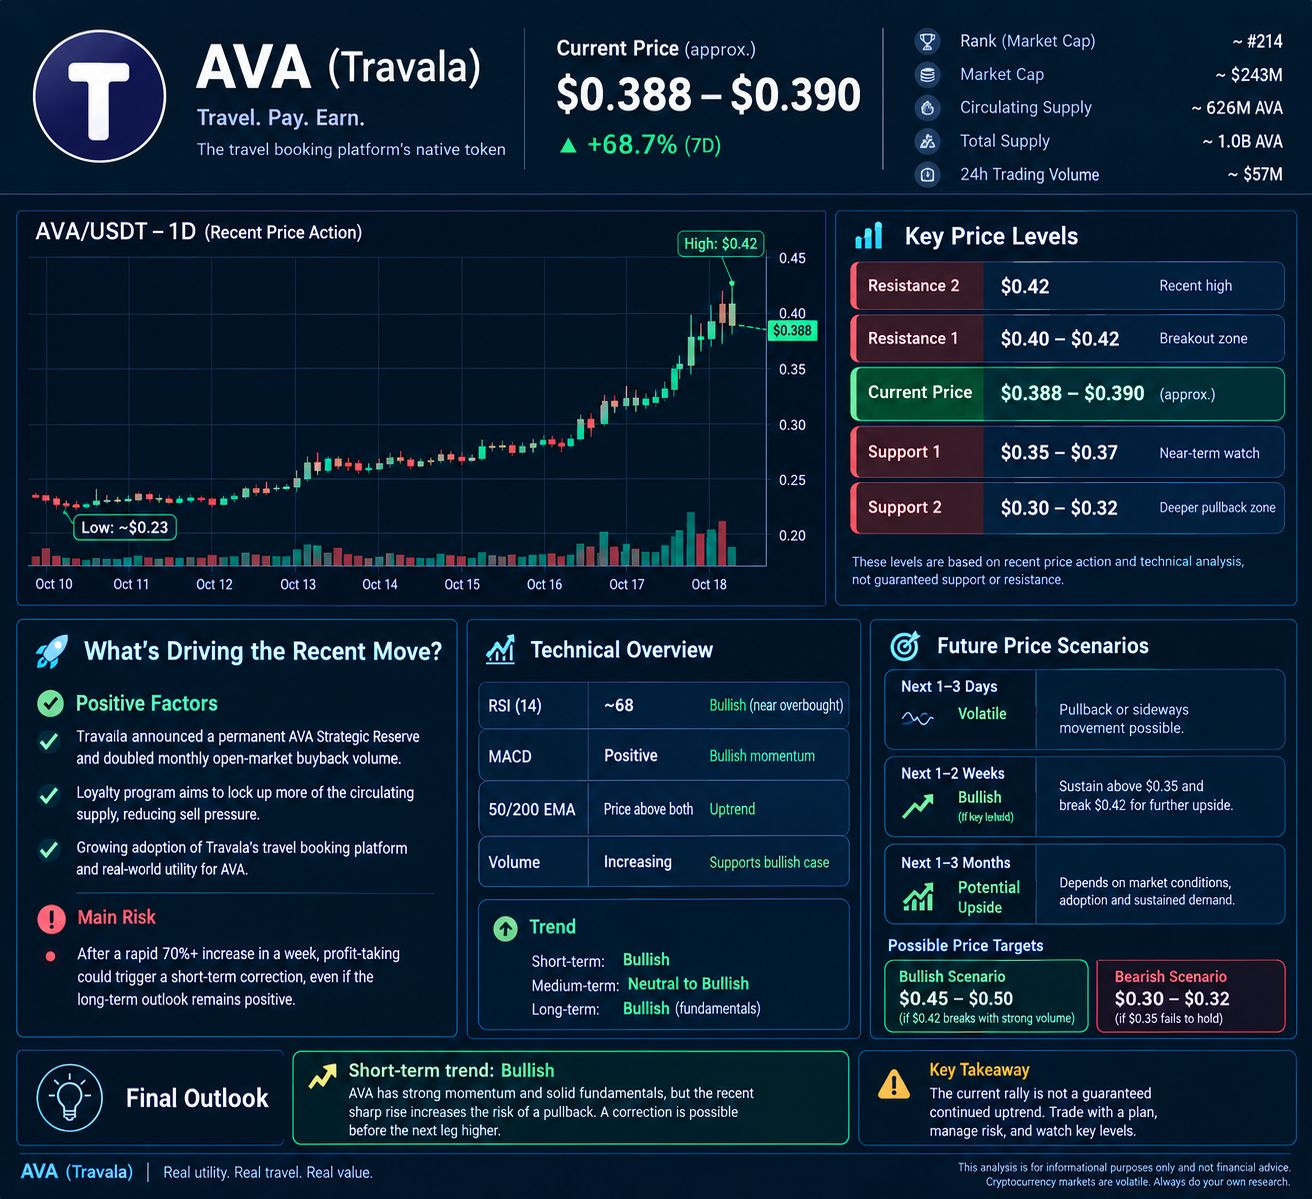
$AVA AVA(トラヴァラ)
$0.388~$0.390
直近は強い上昇モメンタム
表示価格は米ドル建てです。取引所によって価格が異なる場合があります。
1. 最近何が起きた?
AVAは10月12~13日の約$0.23から、10月18日には約$0.39まで急上昇し、報告された日中高値は約$0.42でした。これは短期的に大きく上昇したことを示しますが、利益確定売りのリスクも高まっています。
プラス要因
トラヴァラは、恒久的なAVA戦略準備金の設立を発表し、公開市場での月間買い戻し量を2倍にしました。
同社のロイヤルティプログラムは、流通しているトークン供給量のより多くをロックアップすることを目指しています。
主なリスク:これほど急速に上昇した後は、トレーダーが利益確定のために売却し、長期的な見通しが依然として明るい場合でも、急激な調整が起きる可能性があります。
. 重要な価格水準
レジスタンス2
$0.42 直近高値
レジスタンス1
$0.40~$0.42 ブレイクアウトゾーン
サポート1
$0.35~$0.37 目先の注目水準
サポート2
$0.30~$0.32 より深い押し目のゾーン
直近の取引データに基づく概算の分析ゾーンであり、サポートやレジスタンスが保証されるものではありません。
3. 今後の予測:上昇か下落か?
期間 見通し
今後1~3日 値動きが激しく、押し目または横ばいとなる可能性
今後1~2週間 サポートを維持し、$0.42を上抜ければ強気
今後1~3か月 上昇余地があるものの、市場環境と需要の持続に左右される
強気シナリオ:出来高を伴って$0.42を継続的に上回れば、$0.45~$0.50を目指す展開が期待できます。
弱気シナリオ:$0.35を維持できなければ、$0.30~$0.32が意識される可能性があります。
テクニカル面の注意点:モメンタム指標は総じて強気ですが、一部の数値は上昇が行き過ぎている可能性を示しています。
最終見解:AVAの短期トレンドは強気ですが、急上昇後の調整も十分にあり得ます。現在の上昇が今後も続くことが保証されているとは考えない方がよいでしょう。
これはシナリオに基づく予測であり、確実なものでも、個別の金融アドバイスでもありません。
#AVA #QKCUSDT #GTC #CPIWatch #USJobData
{spot}(AVAUSDT)
{spot}(QKCUSDT)
{spot}(GTCUSDT)
$AVA AVA(トラヴァラ)
$0.388~$0.390
直近は強い上昇モメンタム
表示価格は米ドル建てです。取引所によって価格が異なる場合があります。
1. 最近何が起きた?
AVAは10月12~13日の約$0.23から、10月18日には約$0.39まで急上昇し、報告された日中高値は約$0.42でした。これは短期的に大きく上昇したことを示しますが、利益確定売りのリスクも高まっています。
プラス要因
トラヴァラは、恒久的なAVA戦略準備金の設立を発表し、公開市場での月間買い戻し量を2倍にしました。
同社のロイヤルティプログラムは、流通しているトークン供給量のより多くをロックアップすることを目指しています。
主なリスク:これほど急速に上昇した後は、トレーダーが利益確定のために売却し、長期的な見通しが依然として明るい場合でも、急激な調整が起きる可能性があります。
. 重要な価格水準
レジスタンス2
$0.42 直近高値
レジスタンス1
$0.40~$0.42 ブレイクアウトゾーン
サポート1
$0.35~$0.37 目先の注目水準
サポート2
$0.30~$0.32 より深い押し目のゾーン
直近の取引データに基づく概算の分析ゾーンであり、サポートやレジスタンスが保証されるものではありません。
3. 今後の予測:上昇か下落か?
期間 見通し
今後1~3日 値動きが激しく、押し目または横ばいとなる可能性
今後1~2週間 サポートを維持し、$0.42を上抜ければ強気
今後1~3か月 上昇余地があるものの、市場環境と需要の持続に左右される
強気シナリオ:出来高を伴って$0.42を継続的に上回れば、$0.45~$0.50を目指す展開が期待できます。
弱気シナリオ:$0.35を維持できなければ、$0.30~$0.32が意識される可能性があります。
テクニカル面の注意点:モメンタム指標は総じて強気ですが、一部の数値は上昇が行き過ぎている可能性を示しています。
最終見解:AVAの短期トレンドは強気ですが、急上昇後の調整も十分にあり得ます。現在の上昇が今後も続くことが保証されているとは考えない方がよいでしょう。
これはシナリオに基づく予測であり、確実なものでも、個別の金融アドバイスでもありません。
#AVA #QKCUSDT #GTC #CPIWatch #USJobData
$0.388~$0.390
直近は強い上昇モメンタム
表示価格は米ドル建てです。取引所によって価格が異なる場合があります。
1. 最近何が起きた?
AVAは10月12~13日の約$0.23から、10月18日には約$0.39まで急上昇し、報告された日中高値は約$0.42でした。これは短期的に大きく上昇したことを示しますが、利益確定売りのリスクも高まっています。
プラス要因
トラヴァラは、恒久的なAVA戦略準備金の設立を発表し、公開市場での月間買い戻し量を2倍にしました。
同社のロイヤルティプログラムは、流通しているトークン供給量のより多くをロックアップすることを目指しています。
主なリスク:これほど急速に上昇した後は、トレーダーが利益確定のために売却し、長期的な見通しが依然として明るい場合でも、急激な調整が起きる可能性があります。
. 重要な価格水準
レジスタンス2
$0.42 直近高値
レジスタンス1
$0.40~$0.42 ブレイクアウトゾーン
サポート1
$0.35~$0.37 目先の注目水準
サポート2
$0.30~$0.32 より深い押し目のゾーン
直近の取引データに基づく概算の分析ゾーンであり、サポートやレジスタンスが保証されるものではありません。
3. 今後の予測:上昇か下落か?
期間 見通し
今後1~3日 値動きが激しく、押し目または横ばいとなる可能性
今後1~2週間 サポートを維持し、$0.42を上抜ければ強気
今後1~3か月 上昇余地があるものの、市場環境と需要の持続に左右される
強気シナリオ:出来高を伴って$0.42を継続的に上回れば、$0.45~$0.50を目指す展開が期待できます。
弱気シナリオ:$0.35を維持できなければ、$0.30~$0.32が意識される可能性があります。
テクニカル面の注意点:モメンタム指標は総じて強気ですが、一部の数値は上昇が行き過ぎている可能性を示しています。
最終見解:AVAの短期トレンドは強気ですが、急上昇後の調整も十分にあり得ます。現在の上昇が今後も続くことが保証されているとは考えない方がよいでしょう。
これはシナリオに基づく予測であり、確実なものでも、個別の金融アドバイスでもありません。
#AVA #QKCUSDT #GTC #CPIWatch #USJobData
251
ログインして、さらにコンテンツを読む
厳選トピックで世界の暗号資産トレーダーの仲間入り
⚡️ 暗号資産に関する最新かつ有益な情報が見つかります。
💬 世界最大の暗号資産取引所から信頼されています。
👍 認証を受けたクリエイターから、有益なインサイトを得られます。
メール / 電話番号