
CRYPTO KING 44
34 投稿

CRYPTO KING 44
報告
ユーザーをブロック
12 フォロー
4 フォロワー
14 いいね
投稿
すべて
引用
翻訳参照
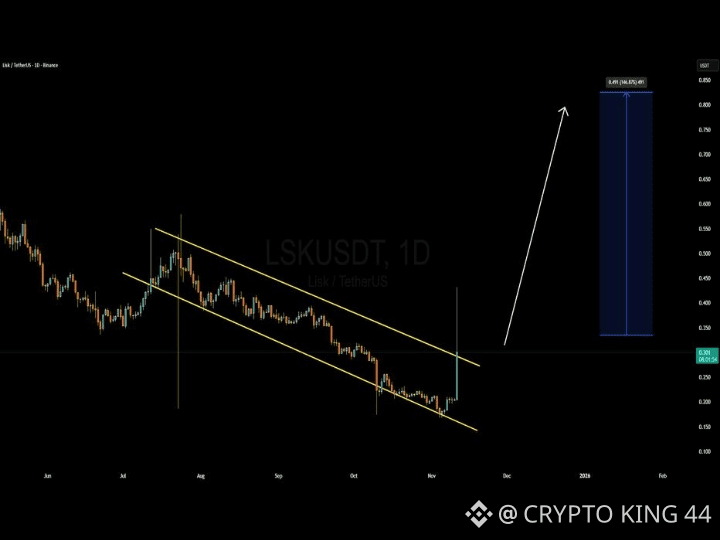
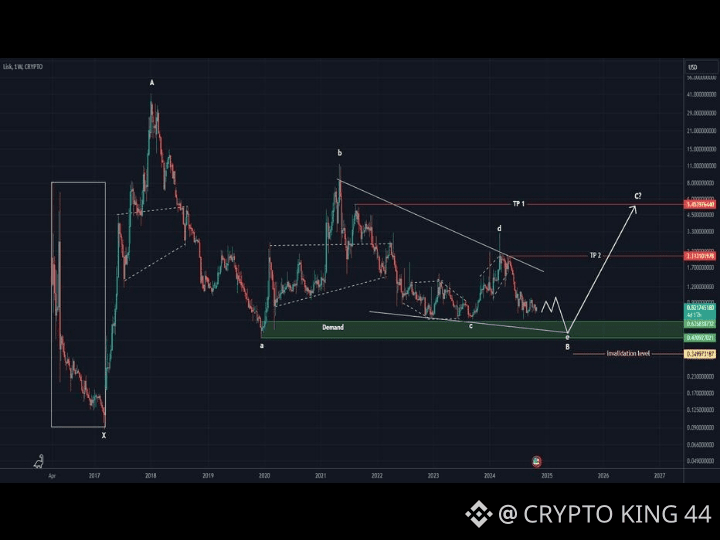
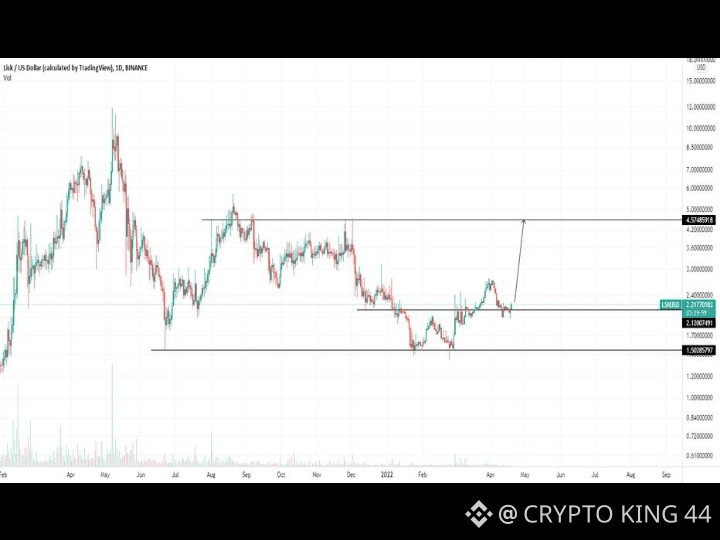
$LSK LSK/USDC — Latest Analysis
Current picture: LSK has just experienced an extremely strong breakout. Latest data puts LSK around $0.23–$0.25, while USDC remains essentially $1.00.
📈 Technical view
Trend: Strongly bullish in the short term.
Momentum: Extremely high — RSI is reported around 96, which means the move is severely overbought.
Volume: Explosive; reported 24h turnover is around $3.5B, with volume roughly 52× its normal level.
LSK moved from roughly $0.10 on Sept. 10 to above $0.25, so chasing the move carries substantial pullback risk.
🎯 Important levels
LevelImportance$0.26–0.27🔴 Major near-term resistance$0.30🔴 Psychological resistance$0.33–0.34🚀 Bullish breakout target$0.23–0.24🟢 First support$0.20–0.21🟢 Stronger support$0.18–0.19🟢 Critical pullback zone
A recent LSK trade signal had targets at $0.204, $0.215 and $0.23, all of which were reached; this confirms how rapidly the current move has developed.
🔥 My scenario
Bullish: If LSK holds $0.23–0.24 and breaks $0.26–0.27 with volume, I would watch $0.30 → $0.33/0.34 next.
Correction: Because RSI is around 96, a sharp retracement is very possible. A loss of $0.23 could send price toward $0.20–0.21. Losing $0.20 would weaken the immediate bullish structure.
Best approach: I would not chase a huge green candle here. A pullback/retest around $0.21–$0.24 with stabilization would offer a much cleaner risk/reward setup.
Overall: 🟢 Bullish trend / 🔴 extremely overbought. The trend favors buyers, but the probability of a violent correction is also elevated.
This is technical analysis, not financial advice. LSK is currently exceptionally volatile.
{spot}(LSKUSDT)
#ClarityActFacesProceduralVoteSept15 #US10YearTreasuryYieldNears5% #RevolutConfirmsFakeGovEmailDataBreach
$LSK LSK/USDC — Latest Analysis
Current picture: LSK has just experienced an extremely strong breakout. Latest data puts LSK around $0.23–$0.25, while USDC remains essentially $1.00.
📈 Technical view
Trend: Strongly bullish in the short term.
Momentum: Extremely high — RSI is reported around 96, which means the move is severely overbought.
Volume: Explosive; reported 24h turnover is around $3.5B, with volume roughly 52× its normal level.
LSK moved from roughly $0.10 on Sept. 10 to above $0.25, so chasing the move carries substantial pullback risk.
🎯 Important levels
LevelImportance$0.26–0.27🔴 Major near-term resistance$0.30🔴 Psychological resistance$0.33–0.34🚀 Bullish breakout target$0.23–0.24🟢 First support$0.20–0.21🟢 Stronger support$0.18–0.19🟢 Critical pullback zone
A recent LSK trade signal had targets at $0.204, $0.215 and $0.23, all of which were reached; this confirms how rapidly the current move has developed.
🔥 My scenario
Bullish: If LSK holds $0.23–0.24 and breaks $0.26–0.27 with volume, I would watch $0.30 → $0.33/0.34 next.
Correction: Because RSI is around 96, a sharp retracement is very possible. A loss of $0.23 could send price toward $0.20–0.21. Losing $0.20 would weaken the immediate bullish structure.
Best approach: I would not chase a huge green candle here. A pullback/retest around $0.21–$0.24 with stabilization would offer a much cleaner risk/reward setup.
Overall: 🟢 Bullish trend / 🔴 extremely overbought. The trend favors buyers, but the probability of a violent correction is also elevated.
This is technical analysis, not financial advice. LSK is currently exceptionally volatile.
#ClarityActFacesProceduralVoteSept15 #US10YearTreasuryYieldNears5% #RevolutConfirmsFakeGovEmailDataBreach
Current picture: LSK has just experienced an extremely strong breakout. Latest data puts LSK around $0.23–$0.25, while USDC remains essentially $1.00.
📈 Technical view
Trend: Strongly bullish in the short term.
Momentum: Extremely high — RSI is reported around 96, which means the move is severely overbought.
Volume: Explosive; reported 24h turnover is around $3.5B, with volume roughly 52× its normal level.
LSK moved from roughly $0.10 on Sept. 10 to above $0.25, so chasing the move carries substantial pullback risk.
🎯 Important levels
LevelImportance$0.26–0.27🔴 Major near-term resistance$0.30🔴 Psychological resistance$0.33–0.34🚀 Bullish breakout target$0.23–0.24🟢 First support$0.20–0.21🟢 Stronger support$0.18–0.19🟢 Critical pullback zone
A recent LSK trade signal had targets at $0.204, $0.215 and $0.23, all of which were reached; this confirms how rapidly the current move has developed.
🔥 My scenario
Bullish: If LSK holds $0.23–0.24 and breaks $0.26–0.27 with volume, I would watch $0.30 → $0.33/0.34 next.
Correction: Because RSI is around 96, a sharp retracement is very possible. A loss of $0.23 could send price toward $0.20–0.21. Losing $0.20 would weaken the immediate bullish structure.
Best approach: I would not chase a huge green candle here. A pullback/retest around $0.21–$0.24 with stabilization would offer a much cleaner risk/reward setup.
Overall: 🟢 Bullish trend / 🔴 extremely overbought. The trend favors buyers, but the probability of a violent correction is also elevated.
This is technical analysis, not financial advice. LSK is currently exceptionally volatile.
#ClarityActFacesProceduralVoteSept15 #US10YearTreasuryYieldNears5% #RevolutConfirmsFakeGovEmailDataBreach
145
翻訳参照
$RAY RAY/USDC — Latest Technical Analysis
Current picture: RAY/USDC is around 1.32–1.36 USDC. The pair has made a very strong recovery recently: from about 0.82 on Sep 4 to above 1.35, with a Sep 9 intraday high around 1.47.
📊 My analysis
Trend: 🟢 Bullish, but highly volatile.
Immediate resistance: 1.40–1.47
Major breakout: A sustained move above 1.47 could open the way toward 1.60–1.70.
First support: 1.25–1.30
Important support: 1.17–1.20
Strong support: 1.05–1.10
Momentum is strong: RAY gained roughly 50% over 7 days according to CoinGecko.
🔥 Trading scenarios
Bullish:
If RAY holds 1.25–1.30 and breaks 1.47 with volume → potential targets 1.60 → 1.75 → 2.00.
Bearish:
If it gets rejected around 1.40–1.47 and loses 1.25, I would watch 1.17, then 1.05–1.10.
My view: 🟢 Bullish above 1.25, but I would avoid chasing a large green candle. A pullback/retest of 1.25–1.30 would give a cleaner risk/reward setup.
The RAY/USDC market itself is showing substantial liquidity and recent high trading activity, although exact prices vary between pools/exchanges.
Not financial advice. Crypto can move extremely quickly.
If you want, I can also give you a .
{spot}(RAYUSDT)
#CPIWatch #BlockstreamRefusesToPayRansomToLiquidAttacker #TrumpDeclinesSaudiRequestToStrikeHouthis
$RAY RAY/USDC — Latest Technical Analysis
Current picture: RAY/USDC is around 1.32–1.36 USDC. The pair has made a very strong recovery recently: from about 0.82 on Sep 4 to above 1.35, with a Sep 9 intraday high around 1.47.
📊 My analysis
Trend: 🟢 Bullish, but highly volatile.
Immediate resistance: 1.40–1.47
Major breakout: A sustained move above 1.47 could open the way toward 1.60–1.70.
First support: 1.25–1.30
Important support: 1.17–1.20
Strong support: 1.05–1.10
Momentum is strong: RAY gained roughly 50% over 7 days according to CoinGecko.
🔥 Trading scenarios
Bullish:
If RAY holds 1.25–1.30 and breaks 1.47 with volume → potential targets 1.60 → 1.75 → 2.00.
Bearish:
If it gets rejected around 1.40–1.47 and loses 1.25, I would watch 1.17, then 1.05–1.10.
My view: 🟢 Bullish above 1.25, but I would avoid chasing a large green candle. A pullback/retest of 1.25–1.30 would give a cleaner risk/reward setup.
The RAY/USDC market itself is showing substantial liquidity and recent high trading activity, although exact prices vary between pools/exchanges.
Not financial advice. Crypto can move extremely quickly.
If you want, I can also give you a .
#CPIWatch #BlockstreamRefusesToPayRansomToLiquidAttacker #TrumpDeclinesSaudiRequestToStrikeHouthis
Current picture: RAY/USDC is around 1.32–1.36 USDC. The pair has made a very strong recovery recently: from about 0.82 on Sep 4 to above 1.35, with a Sep 9 intraday high around 1.47.
📊 My analysis
Trend: 🟢 Bullish, but highly volatile.
Immediate resistance: 1.40–1.47
Major breakout: A sustained move above 1.47 could open the way toward 1.60–1.70.
First support: 1.25–1.30
Important support: 1.17–1.20
Strong support: 1.05–1.10
Momentum is strong: RAY gained roughly 50% over 7 days according to CoinGecko.
🔥 Trading scenarios
Bullish:
If RAY holds 1.25–1.30 and breaks 1.47 with volume → potential targets 1.60 → 1.75 → 2.00.
Bearish:
If it gets rejected around 1.40–1.47 and loses 1.25, I would watch 1.17, then 1.05–1.10.
My view: 🟢 Bullish above 1.25, but I would avoid chasing a large green candle. A pullback/retest of 1.25–1.30 would give a cleaner risk/reward setup.
The RAY/USDC market itself is showing substantial liquidity and recent high trading activity, although exact prices vary between pools/exchanges.
Not financial advice. Crypto can move extremely quickly.
If you want, I can also give you a .
#CPIWatch #BlockstreamRefusesToPayRansomToLiquidAttacker #TrumpDeclinesSaudiRequestToStrikeHouthis


84
翻訳参照
$TFUEL TFUEL/USDC — Latest Technical Analysis
Current TFUEL price: around $0.0094–$0.0095. Recent data shows TFUEL has been consolidating around $0.0095 after recovering from the ~$0.0071 area in August. �
CoinGecko +1
Note: Direct TFUEL/USDC data is less liquid than TFUEL/USDT, so I'm using TFUEL/USD and TFUEL/USDT market data as a close proxy. The levels should therefore be very similar.
📊 Key levels
Level
Zone
Meaning
🔴 Resistance
$0.00985–0.0100
Major near-term breakout
🔴 Resistance
$0.0101–0.0105
Next upside target
🟢 Support
$0.00930–0.00940
Immediate support
🟢 Support
$0.0090–0.0091
Important breakdown level
🟢 Strong support
$0.0088–0.0089
Last major bullish defense
Recent Binance historical data shows TFUEL testing $0.00985–$0.00991 several times without a sustained breakout, while the recent 7-day range is roughly $0.00885–$0.00992. �
Investing.com +1
🟢 Bullish scenario
If TFUEL/USDC closes above $0.0100 with strong volume, the structure becomes significantly more bullish.
Potential targets:
$0.0105 → $0.0115 → $0.0125
A move above $0.0125 would be a much stronger confirmation that the longer-term trend is changing.
🔴 Bearish scenario
If price repeatedly rejects $0.0098–$0.0100 and then loses $0.0093, watch:
$0.0090 → $0.0088 → $0.0082
A decisive break below $0.0088 would weaken the current recovery structure.
🎯 My view
Short term: Neutral → cautiously bullish.
TFUEL has recovered from the August lows, but $0.0100 is the key hurdle. I would not consider the breakout fully confirmed until price gets above that area with volume.
Trading idea:
🟢 Breakout entry: above $0.0100
🎯 Targets: $0.0105 / $0.0115 / $0.0125
🛑 Invalidation: below $0.0090
More aggressive support entry: $0.0091–$0.0093, if that zone holds.
CoinMarketCap currently places TFUEL around $0.00941, with a 24h range of approximately $0.00933–$0.00987 and market cap around $70M. �
CoinMarketCap
Important: TFUEL is highly volatile and these are technical scenarios, not guaranteed price predictions.
{spot}(TFUELUSDT)
$TFUEL TFUEL/USDC — Latest Technical Analysis
Current TFUEL price: around $0.0094–$0.0095. Recent data shows TFUEL has been consolidating around $0.0095 after recovering from the ~$0.0071 area in August. �
CoinGecko +1
Note: Direct TFUEL/USDC data is less liquid than TFUEL/USDT, so I'm using TFUEL/USD and TFUEL/USDT market data as a close proxy. The levels should therefore be very similar.
📊 Key levels
Level
Zone
Meaning
🔴 Resistance
$0.00985–0.0100
Major near-term breakout
🔴 Resistance
$0.0101–0.0105
Next upside target
🟢 Support
$0.00930–0.00940
Immediate support
🟢 Support
$0.0090–0.0091
Important breakdown level
🟢 Strong support
$0.0088–0.0089
Last major bullish defense
Recent Binance historical data shows TFUEL testing $0.00985–$0.00991 several times without a sustained breakout, while the recent 7-day range is roughly $0.00885–$0.00992. �
Investing.com +1
🟢 Bullish scenario
If TFUEL/USDC closes above $0.0100 with strong volume, the structure becomes significantly more bullish.
Potential targets:
$0.0105 → $0.0115 → $0.0125
A move above $0.0125 would be a much stronger confirmation that the longer-term trend is changing.
🔴 Bearish scenario
If price repeatedly rejects $0.0098–$0.0100 and then loses $0.0093, watch:
$0.0090 → $0.0088 → $0.0082
A decisive break below $0.0088 would weaken the current recovery structure.
🎯 My view
Short term: Neutral → cautiously bullish.
TFUEL has recovered from the August lows, but $0.0100 is the key hurdle. I would not consider the breakout fully confirmed until price gets above that area with volume.
Trading idea:
🟢 Breakout entry: above $0.0100
🎯 Targets: $0.0105 / $0.0115 / $0.0125
🛑 Invalidation: below $0.0090
More aggressive support entry: $0.0091–$0.0093, if that zone holds.
CoinMarketCap currently places TFUEL around $0.00941, with a 24h range of approximately $0.00933–$0.00987 and market cap around $70M. �
CoinMarketCap
Important: TFUEL is highly volatile and these are technical scenarios, not guaranteed price predictions.
Current TFUEL price: around $0.0094–$0.0095. Recent data shows TFUEL has been consolidating around $0.0095 after recovering from the ~$0.0071 area in August. �
CoinGecko +1
Note: Direct TFUEL/USDC data is less liquid than TFUEL/USDT, so I'm using TFUEL/USD and TFUEL/USDT market data as a close proxy. The levels should therefore be very similar.
📊 Key levels
Level
Zone
Meaning
🔴 Resistance
$0.00985–0.0100
Major near-term breakout
🔴 Resistance
$0.0101–0.0105
Next upside target
🟢 Support
$0.00930–0.00940
Immediate support
🟢 Support
$0.0090–0.0091
Important breakdown level
🟢 Strong support
$0.0088–0.0089
Last major bullish defense
Recent Binance historical data shows TFUEL testing $0.00985–$0.00991 several times without a sustained breakout, while the recent 7-day range is roughly $0.00885–$0.00992. �
Investing.com +1
🟢 Bullish scenario
If TFUEL/USDC closes above $0.0100 with strong volume, the structure becomes significantly more bullish.
Potential targets:
$0.0105 → $0.0115 → $0.0125
A move above $0.0125 would be a much stronger confirmation that the longer-term trend is changing.
🔴 Bearish scenario
If price repeatedly rejects $0.0098–$0.0100 and then loses $0.0093, watch:
$0.0090 → $0.0088 → $0.0082
A decisive break below $0.0088 would weaken the current recovery structure.
🎯 My view
Short term: Neutral → cautiously bullish.
TFUEL has recovered from the August lows, but $0.0100 is the key hurdle. I would not consider the breakout fully confirmed until price gets above that area with volume.
Trading idea:
🟢 Breakout entry: above $0.0100
🎯 Targets: $0.0105 / $0.0115 / $0.0125
🛑 Invalidation: below $0.0090
More aggressive support entry: $0.0091–$0.0093, if that zone holds.
CoinMarketCap currently places TFUEL around $0.00941, with a 24h range of approximately $0.00933–$0.00987 and market cap around $70M. �
CoinMarketCap
Important: TFUEL is highly volatile and these are technical scenarios, not guaranteed price predictions.

84
翻訳参照
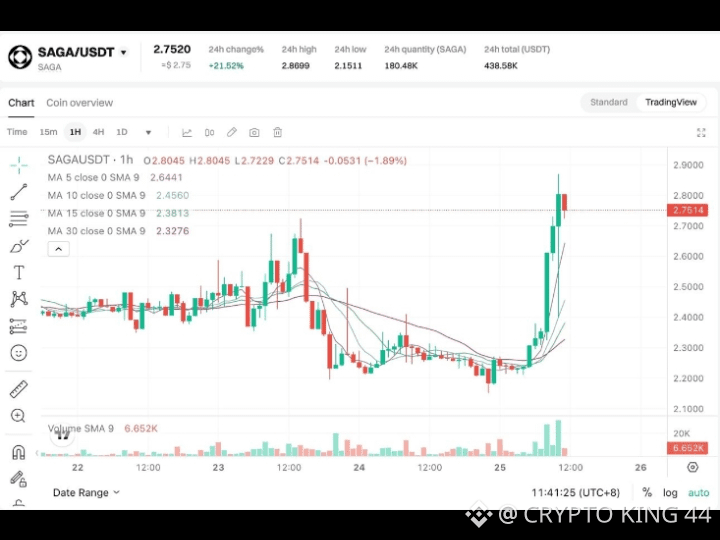
$SAGA SAGA/USDC — Latest Analysis
Current price: around $0.014. Recent data shows SAGA under selling pressure, with daily technical signals largely bearish. �
Investing.com +1
📉 Key levels
Support: $0.0135 → $0.0130
Resistance: $0.0142 → $0.0145
Major resistance: ~$0.0150–$0.0153
Bullish only if: price breaks and holds above $0.0145–$0.0150
Bearish if: $0.0135 breaks → possible move toward $0.0130 or lower. �
CoinMarketCap +1
🔎 My view
Short term: Bearish/weak.
RSI is below 50 and most moving averages remain above price, indicating sellers still have control. �
Investing.com
Trading idea: Don't chase a long at the current level. A stronger setup would be a confirmed breakout above $0.0145–$0.0150, while losing $0.0135 increases downside risk.
*Not financial advice; SAGA is highly volatile.*
{future}(SAGAUSDT)
#US10YTreasuryYieldHitsHighestSinceNov2023 #IranSaysReadyToEscalateWarWithUS #USContinuingJoblessClaims1.774M #AppleDebutsFoldablePhone
$SAGA SAGA/USDC — Latest Analysis
Current price: around $0.014. Recent data shows SAGA under selling pressure, with daily technical signals largely bearish. �
Investing.com +1
📉 Key levels
Support: $0.0135 → $0.0130
Resistance: $0.0142 → $0.0145
Major resistance: ~$0.0150–$0.0153
Bullish only if: price breaks and holds above $0.0145–$0.0150
Bearish if: $0.0135 breaks → possible move toward $0.0130 or lower. �
CoinMarketCap +1
🔎 My view
Short term: Bearish/weak.
RSI is below 50 and most moving averages remain above price, indicating sellers still have control. �
Investing.com
Trading idea: Don't chase a long at the current level. A stronger setup would be a confirmed breakout above $0.0145–$0.0150, while losing $0.0135 increases downside risk.
*Not financial advice; SAGA is highly volatile.*
#US10YTreasuryYieldHitsHighestSinceNov2023 #IranSaysReadyToEscalateWarWithUS #USContinuingJoblessClaims1.774M #AppleDebutsFoldablePhone
Current price: around $0.014. Recent data shows SAGA under selling pressure, with daily technical signals largely bearish. �
Investing.com +1
📉 Key levels
Support: $0.0135 → $0.0130
Resistance: $0.0142 → $0.0145
Major resistance: ~$0.0150–$0.0153
Bullish only if: price breaks and holds above $0.0145–$0.0150
Bearish if: $0.0135 breaks → possible move toward $0.0130 or lower. �
CoinMarketCap +1
🔎 My view
Short term: Bearish/weak.
RSI is below 50 and most moving averages remain above price, indicating sellers still have control. �
Investing.com
Trading idea: Don't chase a long at the current level. A stronger setup would be a confirmed breakout above $0.0145–$0.0150, while losing $0.0135 increases downside risk.
*Not financial advice; SAGA is highly volatile.*
#US10YTreasuryYieldHitsHighestSinceNov2023 #IranSaysReadyToEscalateWarWithUS #USContinuingJoblessClaims1.774M #AppleDebutsFoldablePhone
249
翻訳参照
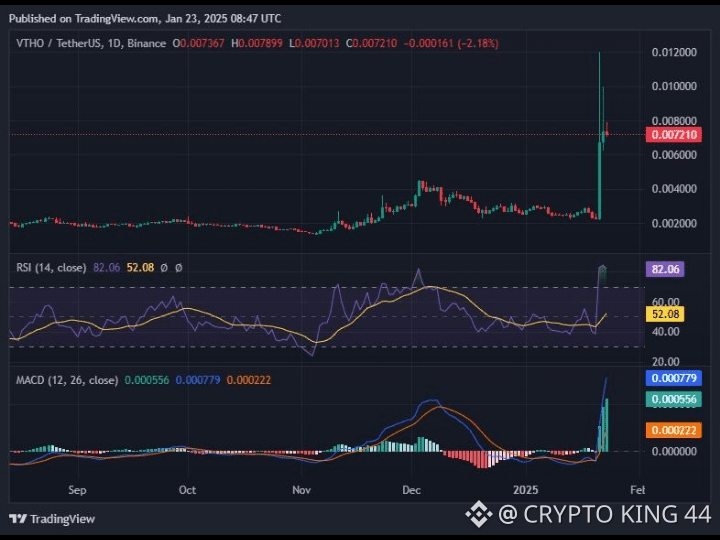
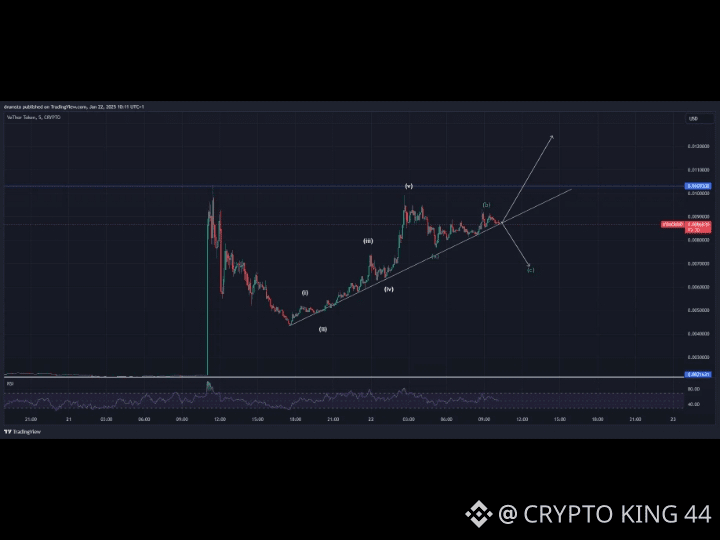
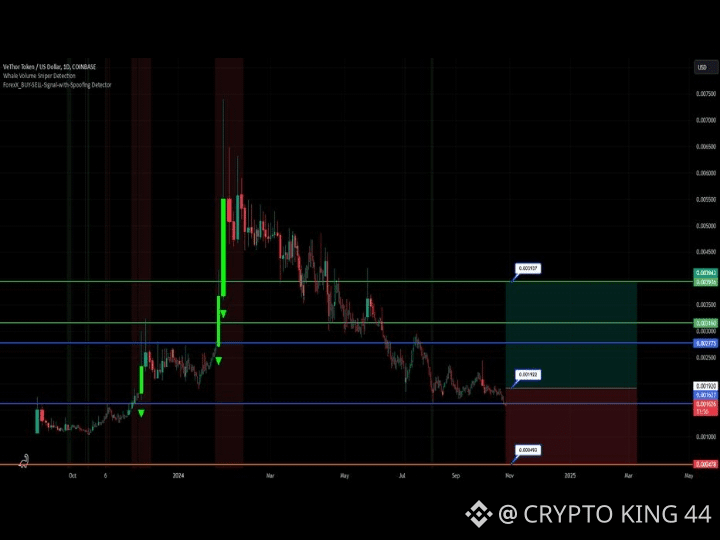
$VTHO VTHO/USDC — Latest Technical View
VeThor (VTHO) is the gas/utility token of the VeChain ecosystem. For VTHO/USDC, I’d treat the setup as high-volatility and confirmation-dependent rather than chase a move.
📊 Current technical outlook
Bias: Neutral → cautiously bullish only if resistance breaks with volume
Key resistance: watch the most recent swing high on your exchange chart.
Key support: the latest higher-low / consolidation floor.
Bullish trigger: daily candle closes above resistance + increasing volume.
Bearish trigger: loss of the latest daily support, especially with strong selling volume.
Momentum: VTHO historically makes very sharp percentage moves, so false breakouts are common.
A previous VTHO/USDC analysis showed the importance of volume and momentum confirmation; VTHO has also demonstrated large spikes followed by rapid retracements.
🎯 Trading scenarios
🟢 Bull case If VTHO breaks its recent resistance and holds it as support, the next move can be substantially higher. I would look for volume expansion + a successful retest before entering.
🔴 Bear case If support fails, avoid assuming the first dip is a buy. VTHO can retrace aggressively after failed breakouts.
🟡 Best setup Rather than entering in the middle of the range, wait for either:
Breakout → retest → long, or
Support sweep → recovery → long.
⚠️ Important: I couldn't verify a reliable live VTHO/USDC quote from the freshest indexed sources, so I don't want to invent a current price or exact entry/TP levels. If you send me a VTHO/USDC screenshot from your exchange (15m, 1H or 4H), I can mark the exact entry, stop-loss, TP1/TP2/TP3 and bullish/bearish levels on it.
{spot}(VTHOUSDT)
#BankOfAmericaGroupPilotsUSBDCStablecoin #USADPWeeklyEmploymentRises12000 #IranSaysReadyToEscalateWarWithUS
$VTHO VTHO/USDC — Latest Technical View
VeThor (VTHO) is the gas/utility token of the VeChain ecosystem. For VTHO/USDC, I’d treat the setup as high-volatility and confirmation-dependent rather than chase a move.
📊 Current technical outlook
Bias: Neutral → cautiously bullish only if resistance breaks with volume
Key resistance: watch the most recent swing high on your exchange chart.
Key support: the latest higher-low / consolidation floor.
Bullish trigger: daily candle closes above resistance + increasing volume.
Bearish trigger: loss of the latest daily support, especially with strong selling volume.
Momentum: VTHO historically makes very sharp percentage moves, so false breakouts are common.
A previous VTHO/USDC analysis showed the importance of volume and momentum confirmation; VTHO has also demonstrated large spikes followed by rapid retracements.
🎯 Trading scenarios
🟢 Bull case If VTHO breaks its recent resistance and holds it as support, the next move can be substantially higher. I would look for volume expansion + a successful retest before entering.
🔴 Bear case If support fails, avoid assuming the first dip is a buy. VTHO can retrace aggressively after failed breakouts.
🟡 Best setup Rather than entering in the middle of the range, wait for either:
Breakout → retest → long, or
Support sweep → recovery → long.
⚠️ Important: I couldn't verify a reliable live VTHO/USDC quote from the freshest indexed sources, so I don't want to invent a current price or exact entry/TP levels. If you send me a VTHO/USDC screenshot from your exchange (15m, 1H or 4H), I can mark the exact entry, stop-loss, TP1/TP2/TP3 and bullish/bearish levels on it.
#BankOfAmericaGroupPilotsUSBDCStablecoin #USADPWeeklyEmploymentRises12000 #IranSaysReadyToEscalateWarWithUS
VeThor (VTHO) is the gas/utility token of the VeChain ecosystem. For VTHO/USDC, I’d treat the setup as high-volatility and confirmation-dependent rather than chase a move.
📊 Current technical outlook
Bias: Neutral → cautiously bullish only if resistance breaks with volume
Key resistance: watch the most recent swing high on your exchange chart.
Key support: the latest higher-low / consolidation floor.
Bullish trigger: daily candle closes above resistance + increasing volume.
Bearish trigger: loss of the latest daily support, especially with strong selling volume.
Momentum: VTHO historically makes very sharp percentage moves, so false breakouts are common.
A previous VTHO/USDC analysis showed the importance of volume and momentum confirmation; VTHO has also demonstrated large spikes followed by rapid retracements.
🎯 Trading scenarios
🟢 Bull case If VTHO breaks its recent resistance and holds it as support, the next move can be substantially higher. I would look for volume expansion + a successful retest before entering.
🔴 Bear case If support fails, avoid assuming the first dip is a buy. VTHO can retrace aggressively after failed breakouts.
🟡 Best setup Rather than entering in the middle of the range, wait for either:
Breakout → retest → long, or
Support sweep → recovery → long.
⚠️ Important: I couldn't verify a reliable live VTHO/USDC quote from the freshest indexed sources, so I don't want to invent a current price or exact entry/TP levels. If you send me a VTHO/USDC screenshot from your exchange (15m, 1H or 4H), I can mark the exact entry, stop-loss, TP1/TP2/TP3 and bullish/bearish levels on it.
#BankOfAmericaGroupPilotsUSBDCStablecoin #USADPWeeklyEmploymentRises12000 #IranSaysReadyToEscalateWarWithUS
143
翻訳参照
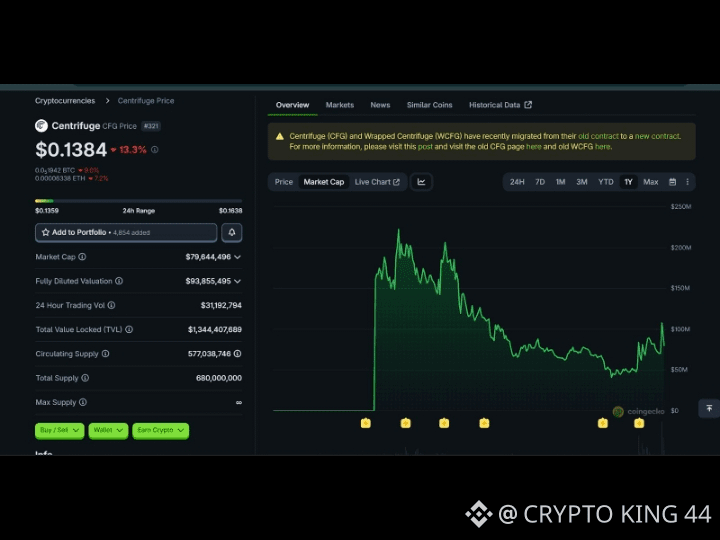
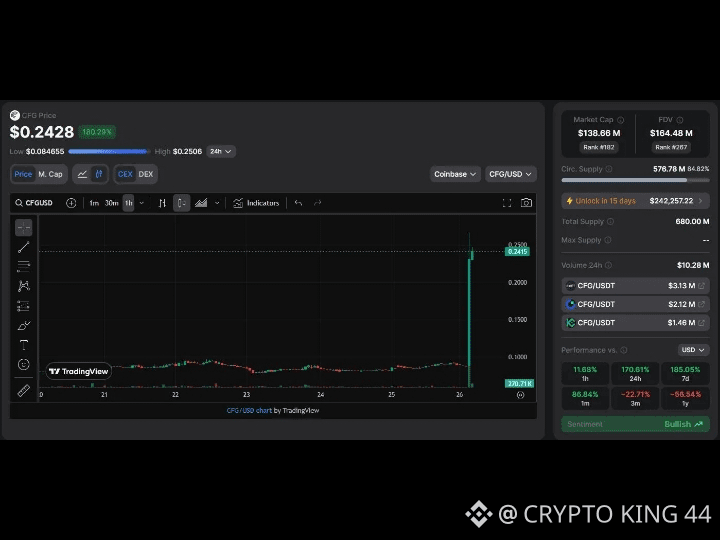
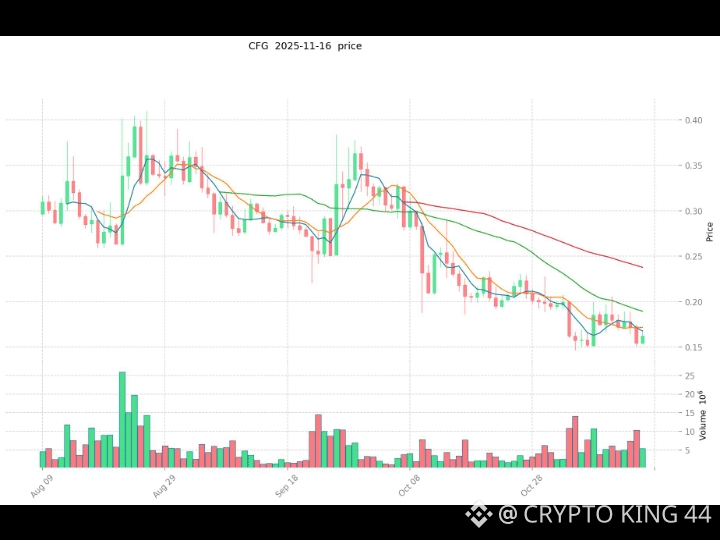
$CFG CFG/USDC — latest analysis
Centrifuge (CFG) is currently trading around the $0.10–$0.11 USDC area. The latest CMC analysis had CFG at about $0.108, up 6.26% over 24h, with the move attributed mainly to renewed interest in the RWA (real-world assets) sector. �
CoinMarketCap
📊 Technical picture
Immediate support: $0.100
Major support: $0.095
First resistance: $0.120
Next resistance: $0.135–$0.140
Stronger resistance: $0.150
Bullish trigger: sustained daily close above $0.120
Bearish trigger: loss of $0.095
Recent price action shows a sharp pullback from roughly $0.158–$0.16 in late August to around $0.10–$0.11 in early September. �
Investing.com Canada +1
🔥 My view
Short term: cautiously bullish above $0.10.
If CFG holds $0.10–$0.095 and breaks $0.12, I would look for:
$0.12 → $0.135 → $0.15
A clean break above $0.15 would substantially improve the structure and could reopen the $0.18–$0.20 zone.
Conversely, a daily close below $0.095 would weaken the setup and could send CFG toward $0.085–$0.09.
The RWA narrative is an important catalyst, but the recent rally has not yet established a clear long-term uptrend. CMC's latest analysis similarly identifies $0.10 as the key level to hold and $0.12 as the near-term resistance. �
CoinMarketCap
Risk/reward: 🟢 Attractive above $0.10, but still high risk because CFG remains a relatively small-cap token.
Trading bias: 0.095–0.100 support → 0.120 breakout → 0.135–0.150 targets
This is market analysis, not financial advice. �
CoinMarketCap +1
{future}(CFGUSDT)
#RussiaUkraineTradeStrikesKushnerWitkoffToKyiv #RussiaUkraine72-hourCeasefire
$CFG CFG/USDC — latest analysis
Centrifuge (CFG) is currently trading around the $0.10–$0.11 USDC area. The latest CMC analysis had CFG at about $0.108, up 6.26% over 24h, with the move attributed mainly to renewed interest in the RWA (real-world assets) sector. �
CoinMarketCap
📊 Technical picture
Immediate support: $0.100
Major support: $0.095
First resistance: $0.120
Next resistance: $0.135–$0.140
Stronger resistance: $0.150
Bullish trigger: sustained daily close above $0.120
Bearish trigger: loss of $0.095
Recent price action shows a sharp pullback from roughly $0.158–$0.16 in late August to around $0.10–$0.11 in early September. �
Investing.com Canada +1
🔥 My view
Short term: cautiously bullish above $0.10.
If CFG holds $0.10–$0.095 and breaks $0.12, I would look for:
$0.12 → $0.135 → $0.15
A clean break above $0.15 would substantially improve the structure and could reopen the $0.18–$0.20 zone.
Conversely, a daily close below $0.095 would weaken the setup and could send CFG toward $0.085–$0.09.
The RWA narrative is an important catalyst, but the recent rally has not yet established a clear long-term uptrend. CMC's latest analysis similarly identifies $0.10 as the key level to hold and $0.12 as the near-term resistance. �
CoinMarketCap
Risk/reward: 🟢 Attractive above $0.10, but still high risk because CFG remains a relatively small-cap token.
Trading bias: 0.095–0.100 support → 0.120 breakout → 0.135–0.150 targets
This is market analysis, not financial advice. �
CoinMarketCap +1
#RussiaUkraineTradeStrikesKushnerWitkoffToKyiv #RussiaUkraine72-hourCeasefire
Centrifuge (CFG) is currently trading around the $0.10–$0.11 USDC area. The latest CMC analysis had CFG at about $0.108, up 6.26% over 24h, with the move attributed mainly to renewed interest in the RWA (real-world assets) sector. �
CoinMarketCap
📊 Technical picture
Immediate support: $0.100
Major support: $0.095
First resistance: $0.120
Next resistance: $0.135–$0.140
Stronger resistance: $0.150
Bullish trigger: sustained daily close above $0.120
Bearish trigger: loss of $0.095
Recent price action shows a sharp pullback from roughly $0.158–$0.16 in late August to around $0.10–$0.11 in early September. �
Investing.com Canada +1
🔥 My view
Short term: cautiously bullish above $0.10.
If CFG holds $0.10–$0.095 and breaks $0.12, I would look for:
$0.12 → $0.135 → $0.15
A clean break above $0.15 would substantially improve the structure and could reopen the $0.18–$0.20 zone.
Conversely, a daily close below $0.095 would weaken the setup and could send CFG toward $0.085–$0.09.
The RWA narrative is an important catalyst, but the recent rally has not yet established a clear long-term uptrend. CMC's latest analysis similarly identifies $0.10 as the key level to hold and $0.12 as the near-term resistance. �
CoinMarketCap
Risk/reward: 🟢 Attractive above $0.10, but still high risk because CFG remains a relatively small-cap token.
Trading bias: 0.095–0.100 support → 0.120 breakout → 0.135–0.150 targets
This is market analysis, not financial advice. �
CoinMarketCap +1
#RussiaUkraineTradeStrikesKushnerWitkoffToKyiv #RussiaUkraine72-hourCeasefire
87
翻訳参照
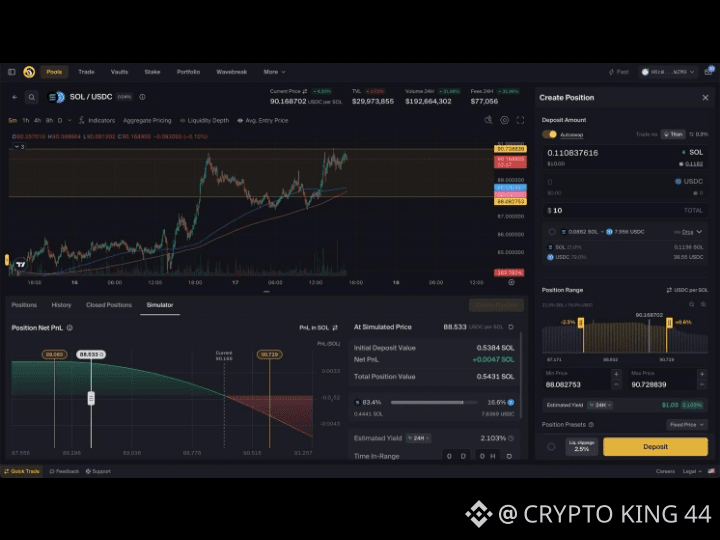
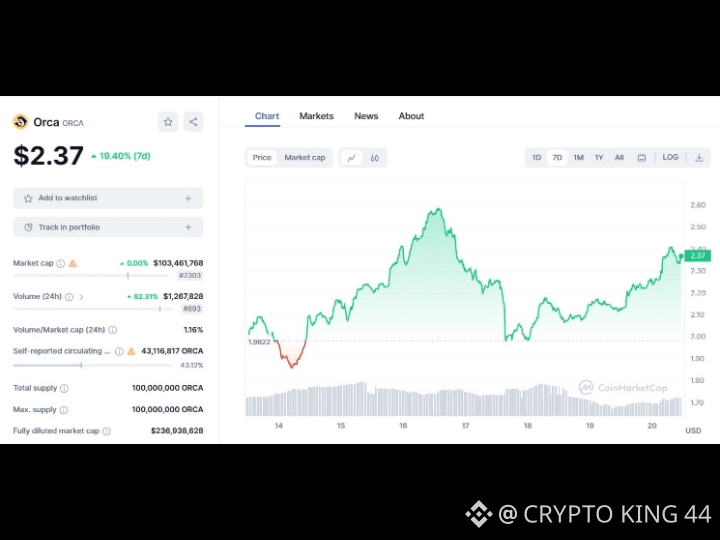
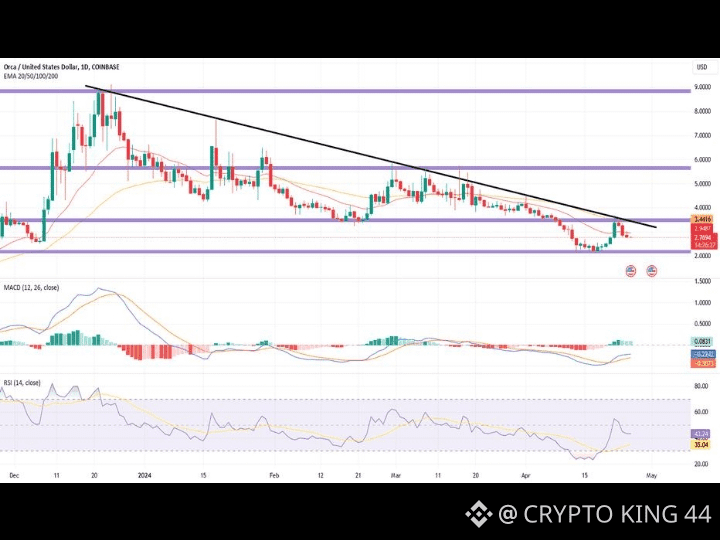
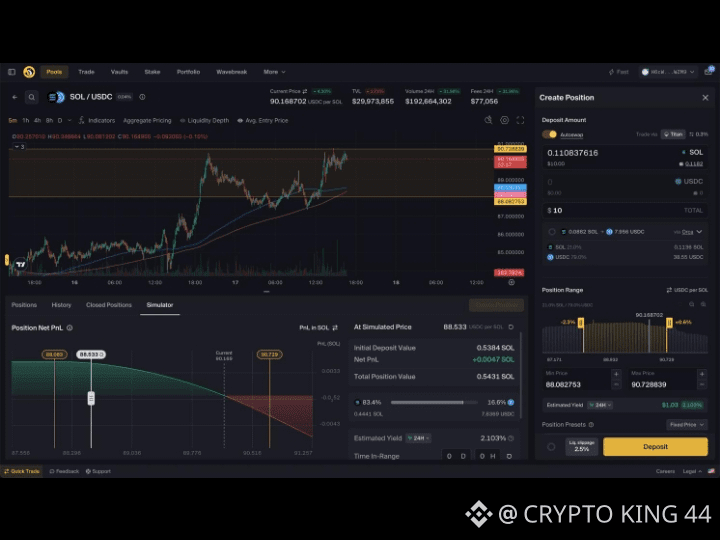
$ORCA ORCA/USDC — Latest Analysis
Current setup: ORCA is showing strong bullish momentum. Current market data puts ORCA around $1.5–$1.7, with the exact quote varying by venue. CoinGecko reports a 24h range of roughly $1.30–$1.73, with volume surging dramatically. �
CoinGecko
📈 Key levels
Level
Zone
Meaning
🔴 Resistance 3
$2.17
Major upside target
🔴 Resistance 2
$1.93
Next breakout target
🔴 Resistance 1
$1.72–1.73
Immediate resistance
🟢 Support 1
$1.45–1.50
Important short-term hold
🟢 Support 2
$1.25–1.30
Deeper pullback support
🟢 Support 3
~$1.06
Major structural support
Recent analysis identifies $1.45 as short-term support and $1.72 as resistance, with a break above $1.72 potentially opening $1.93 and then $2.17. �
CoinLore
🔥 Bullish scenario
If ORCA/USDC closes convincingly above $1.72–$1.73 with strong volume, the next areas I'd watch are:
$1.93 → $2.17
That would represent approximately +12% to +28% from $1.72.
The momentum is notable: ORCA has gained roughly 31% over the last 7 days, while 24h volume has risen sharply. �
CoinGecko
⚠️ Bearish scenario
After such a rapid move, a pullback would not be surprising.
Lose $1.45 → momentum weakens.
Lose $1.25–1.30 → bullish structure becomes much less attractive.
A break toward $1.06 would indicate a substantially deeper correction.
🎯 My read
Short-term bias: 🟢 Bullish, but chasing is risky.
The cleanest setup is either:
A) breakout and successful retest of $1.72, or
B) pullback toward $1.45–1.50 followed by bullish reversal.
I would be cautious about entering after a vertical candle without confirmation. ORCA's recent volume expansion and its connection to growing activity around Orca's Solana liquidity/RWA ecosystem are positive catalysts, but crypto volatility remains very high. Orca has also been expanding into tokenized real-world assets, including a marketplace for regulated tokenized assets launched in May. �
coindesk.com
**Not financial advice — levels can change quickly in crypto.**
{spot}(ORCAUSDT)
#LululemonTumbles20%OnWeakGuidance
$ORCA ORCA/USDC — Latest Analysis
Current setup: ORCA is showing strong bullish momentum. Current market data puts ORCA around $1.5–$1.7, with the exact quote varying by venue. CoinGecko reports a 24h range of roughly $1.30–$1.73, with volume surging dramatically. �
CoinGecko
📈 Key levels
Level
Zone
Meaning
🔴 Resistance 3
$2.17
Major upside target
🔴 Resistance 2
$1.93
Next breakout target
🔴 Resistance 1
$1.72–1.73
Immediate resistance
🟢 Support 1
$1.45–1.50
Important short-term hold
🟢 Support 2
$1.25–1.30
Deeper pullback support
🟢 Support 3
~$1.06
Major structural support
Recent analysis identifies $1.45 as short-term support and $1.72 as resistance, with a break above $1.72 potentially opening $1.93 and then $2.17. �
CoinLore
🔥 Bullish scenario
If ORCA/USDC closes convincingly above $1.72–$1.73 with strong volume, the next areas I'd watch are:
$1.93 → $2.17
That would represent approximately +12% to +28% from $1.72.
The momentum is notable: ORCA has gained roughly 31% over the last 7 days, while 24h volume has risen sharply. �
CoinGecko
⚠️ Bearish scenario
After such a rapid move, a pullback would not be surprising.
Lose $1.45 → momentum weakens.
Lose $1.25–1.30 → bullish structure becomes much less attractive.
A break toward $1.06 would indicate a substantially deeper correction.
🎯 My read
Short-term bias: 🟢 Bullish, but chasing is risky.
The cleanest setup is either:
A) breakout and successful retest of $1.72, or
B) pullback toward $1.45–1.50 followed by bullish reversal.
I would be cautious about entering after a vertical candle without confirmation. ORCA's recent volume expansion and its connection to growing activity around Orca's Solana liquidity/RWA ecosystem are positive catalysts, but crypto volatility remains very high. Orca has also been expanding into tokenized real-world assets, including a marketplace for regulated tokenized assets launched in May. �
coindesk.com
**Not financial advice — levels can change quickly in crypto.**
#LululemonTumbles20%OnWeakGuidance
Current setup: ORCA is showing strong bullish momentum. Current market data puts ORCA around $1.5–$1.7, with the exact quote varying by venue. CoinGecko reports a 24h range of roughly $1.30–$1.73, with volume surging dramatically. �
CoinGecko
📈 Key levels
Level
Zone
Meaning
🔴 Resistance 3
$2.17
Major upside target
🔴 Resistance 2
$1.93
Next breakout target
🔴 Resistance 1
$1.72–1.73
Immediate resistance
🟢 Support 1
$1.45–1.50
Important short-term hold
🟢 Support 2
$1.25–1.30
Deeper pullback support
🟢 Support 3
~$1.06
Major structural support
Recent analysis identifies $1.45 as short-term support and $1.72 as resistance, with a break above $1.72 potentially opening $1.93 and then $2.17. �
CoinLore
🔥 Bullish scenario
If ORCA/USDC closes convincingly above $1.72–$1.73 with strong volume, the next areas I'd watch are:
$1.93 → $2.17
That would represent approximately +12% to +28% from $1.72.
The momentum is notable: ORCA has gained roughly 31% over the last 7 days, while 24h volume has risen sharply. �
CoinGecko
⚠️ Bearish scenario
After such a rapid move, a pullback would not be surprising.
Lose $1.45 → momentum weakens.
Lose $1.25–1.30 → bullish structure becomes much less attractive.
A break toward $1.06 would indicate a substantially deeper correction.
🎯 My read
Short-term bias: 🟢 Bullish, but chasing is risky.
The cleanest setup is either:
A) breakout and successful retest of $1.72, or
B) pullback toward $1.45–1.50 followed by bullish reversal.
I would be cautious about entering after a vertical candle without confirmation. ORCA's recent volume expansion and its connection to growing activity around Orca's Solana liquidity/RWA ecosystem are positive catalysts, but crypto volatility remains very high. Orca has also been expanding into tokenized real-world assets, including a marketplace for regulated tokenized assets launched in May. �
coindesk.com
**Not financial advice — levels can change quickly in crypto.**
#LululemonTumbles20%OnWeakGuidance
66
$ORCA ORCA/USDC — 最新分析
現在の状況:ORCAは強い上昇モメンタムを示しています。現在の市場データではORCAは約$1.5〜$1.7で推移しており、正確な価格は取引所によって変動します。CoinGeckoでは24時間のレンジが約$1.30〜$1.73となっており、出来高が劇的に増加しています。 �
CoinGecko
📈 重要な水準
水準
ゾーン
意味
🔴 レジスタンス3
$2.17
主要な上方目標
🔴 レジスタンス2
$1.93
次のブレイク目標
🔴 レジスタンス1
$1.72〜1.73
直近のレジスタンス
🟢 サポート1
$1.45〜1.50
重要な短期の下支え
🟢 サポート2
$1.25〜1.30
より深い押し目のサポート
🟢 サポート3
約$1.06
主要な構造的サポート
最近の分析では、$1.45が短期サポート、$1.72がレジスタンスであるとされています。$1.72を上抜けることができれば、$1.93、さらに$2.17が視野に入る可能性があります。 �
CoinLore
🔥 強気シナリオ
もしORCA/USDCが強い出来高を伴って$1.72〜$1.73を説得力ある形で終値で上回るなら、次に注目するのは以下です:
$1.93 → $2.17
これは$1.72から概ね+12%〜+28%に相当します。
モメンタムは顕著です:ORCAは過去7日で約31%上昇しており、24時間の出来高も急増しています。 �
CoinGecko
⚠️ 弱気シナリオ
ここまで急な動きの後では、押し目が起きても不思議ではありません。
$1.45を失う → モメンタムが弱まる。
$1.25〜$1.30を失う → 強気の構造が大きく魅力を失う。
$1.06に向けたブレイク → かなり深い調整を示唆。
🎯 私の見立て
短期見通し:🟢 強気、ただし追いかけ買いはリスク。
最もきれいな形は次のどちらかです:
A) ブレイク後、$1.72の再テストが成功する、または
B) $1.45〜1.50付近まで押し、その後に強気の反転。
確定なしに、急騰の「縦のローソク足」後にエントリーするのは慎重であるべきです。ORCAの最近の出来高増加と、OrcaのSolana流動性/RWAエコシステム周辺での活動拡大との関連は前向きな材料ですが、暗号資産のボラティリティは依然として非常に高いです。Orcaは、5月に開始された規制対象のトークン化資産のためのマーケットプレイスを含め、トークン化された現実世界資産へも拡大しています。 �
coindesk.com
**これは金融アドバイスではありません — 暗号資産の水準はすぐに変わる可能性があります。**
{spot}(ORCAUSDT)
#ORCAToken
$ORCA ORCA/USDC — 最新分析
現在の状況:ORCAは強い上昇モメンタムを示しています。現在の市場データではORCAは約$1.5〜$1.7で推移しており、正確な価格は取引所によって変動します。CoinGeckoでは24時間のレンジが約$1.30〜$1.73となっており、出来高が劇的に増加しています。 �
CoinGecko
📈 重要な水準
水準
ゾーン
意味
🔴 レジスタンス3
$2.17
主要な上方目標
🔴 レジスタンス2
$1.93
次のブレイク目標
🔴 レジスタンス1
$1.72〜1.73
直近のレジスタンス
🟢 サポート1
$1.45〜1.50
重要な短期の下支え
🟢 サポート2
$1.25〜1.30
より深い押し目のサポート
🟢 サポート3
約$1.06
主要な構造的サポート
最近の分析では、$1.45が短期サポート、$1.72がレジスタンスであるとされています。$1.72を上抜けることができれば、$1.93、さらに$2.17が視野に入る可能性があります。 �
CoinLore
🔥 強気シナリオ
もしORCA/USDCが強い出来高を伴って$1.72〜$1.73を説得力ある形で終値で上回るなら、次に注目するのは以下です:
$1.93 → $2.17
これは$1.72から概ね+12%〜+28%に相当します。
モメンタムは顕著です:ORCAは過去7日で約31%上昇しており、24時間の出来高も急増しています。 �
CoinGecko
⚠️ 弱気シナリオ
ここまで急な動きの後では、押し目が起きても不思議ではありません。
$1.45を失う → モメンタムが弱まる。
$1.25〜$1.30を失う → 強気の構造が大きく魅力を失う。
$1.06に向けたブレイク → かなり深い調整を示唆。
🎯 私の見立て
短期見通し:🟢 強気、ただし追いかけ買いはリスク。
最もきれいな形は次のどちらかです:
A) ブレイク後、$1.72の再テストが成功する、または
B) $1.45〜1.50付近まで押し、その後に強気の反転。
確定なしに、急騰の「縦のローソク足」後にエントリーするのは慎重であるべきです。ORCAの最近の出来高増加と、OrcaのSolana流動性/RWAエコシステム周辺での活動拡大との関連は前向きな材料ですが、暗号資産のボラティリティは依然として非常に高いです。Orcaは、5月に開始された規制対象のトークン化資産のためのマーケットプレイスを含め、トークン化された現実世界資産へも拡大しています。 �
coindesk.com
**これは金融アドバイスではありません — 暗号資産の水準はすぐに変わる可能性があります。**
#ORCAToken
現在の状況:ORCAは強い上昇モメンタムを示しています。現在の市場データではORCAは約$1.5〜$1.7で推移しており、正確な価格は取引所によって変動します。CoinGeckoでは24時間のレンジが約$1.30〜$1.73となっており、出来高が劇的に増加しています。 �
CoinGecko
📈 重要な水準
水準
ゾーン
意味
🔴 レジスタンス3
$2.17
主要な上方目標
🔴 レジスタンス2
$1.93
次のブレイク目標
🔴 レジスタンス1
$1.72〜1.73
直近のレジスタンス
🟢 サポート1
$1.45〜1.50
重要な短期の下支え
🟢 サポート2
$1.25〜1.30
より深い押し目のサポート
🟢 サポート3
約$1.06
主要な構造的サポート
最近の分析では、$1.45が短期サポート、$1.72がレジスタンスであるとされています。$1.72を上抜けることができれば、$1.93、さらに$2.17が視野に入る可能性があります。 �
CoinLore
🔥 強気シナリオ
もしORCA/USDCが強い出来高を伴って$1.72〜$1.73を説得力ある形で終値で上回るなら、次に注目するのは以下です:
$1.93 → $2.17
これは$1.72から概ね+12%〜+28%に相当します。
モメンタムは顕著です:ORCAは過去7日で約31%上昇しており、24時間の出来高も急増しています。 �
CoinGecko
⚠️ 弱気シナリオ
ここまで急な動きの後では、押し目が起きても不思議ではありません。
$1.45を失う → モメンタムが弱まる。
$1.25〜$1.30を失う → 強気の構造が大きく魅力を失う。
$1.06に向けたブレイク → かなり深い調整を示唆。
🎯 私の見立て
短期見通し:🟢 強気、ただし追いかけ買いはリスク。
最もきれいな形は次のどちらかです:
A) ブレイク後、$1.72の再テストが成功する、または
B) $1.45〜1.50付近まで押し、その後に強気の反転。
確定なしに、急騰の「縦のローソク足」後にエントリーするのは慎重であるべきです。ORCAの最近の出来高増加と、OrcaのSolana流動性/RWAエコシステム周辺での活動拡大との関連は前向きな材料ですが、暗号資産のボラティリティは依然として非常に高いです。Orcaは、5月に開始された規制対象のトークン化資産のためのマーケットプレイスを含め、トークン化された現実世界資産へも拡大しています。 �
coindesk.com
**これは金融アドバイスではありません — 暗号資産の水準はすぐに変わる可能性があります。**
#ORCAToken
88
翻訳参照
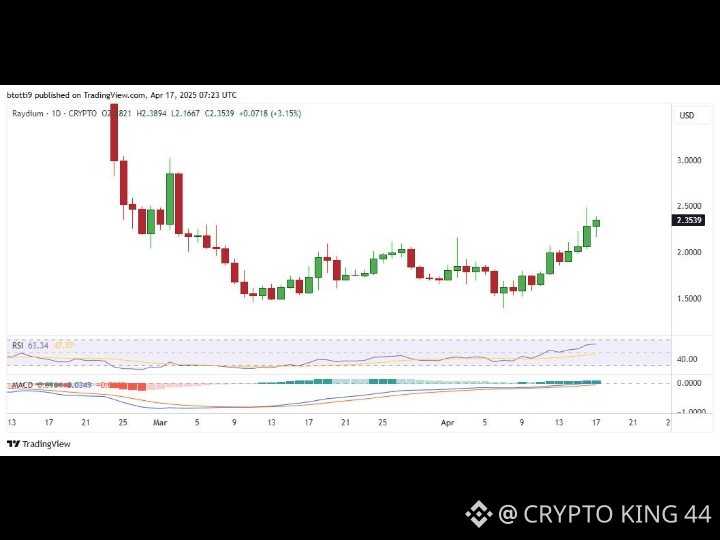
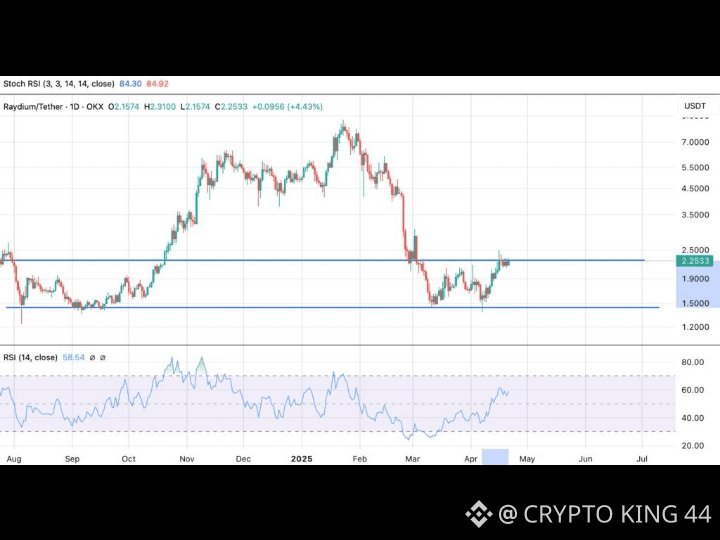
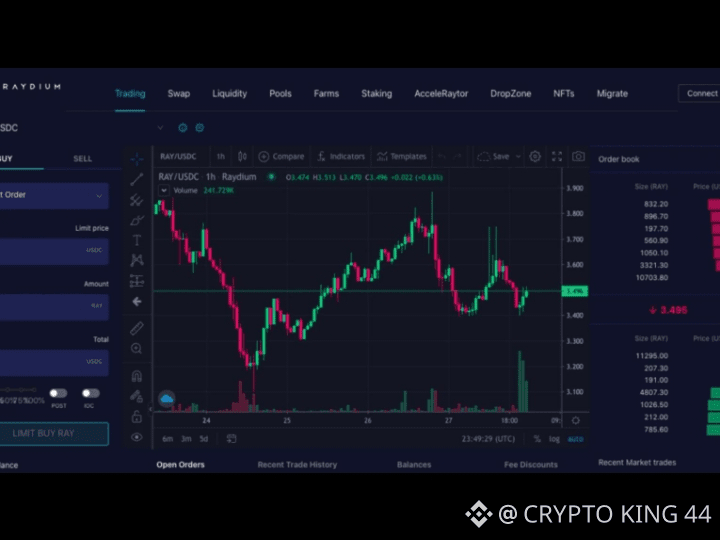
$RAY RAY/USDC — Latest Analysis 📊
Updated: September 6, 2026
The RAY/USDC pair on Raydium is showing a strong bullish move. The latest pair-specific data I found has RAY around $0.91 USDC, up about 10.4% over 24h, with roughly $4.48M TVL and $449K 24h volume in that pool. �
WhatToFarm
🔥 Technical picture
Level
Zone
Importance
Resistance 1
$0.92–$0.95
Immediate breakout area
Resistance 2
$1.00
Major psychological level
Resistance 3
$1.15–$1.20
Strong upside target
Support 1
$0.90
Current breakout area
Support 2
$0.85–$0.82
Important pullback zone
Support 3
$0.77–$0.80
Major structural support
RAY has moved from around $0.62–$0.65 in mid-August to above $0.90, so the short-term trend has clearly improved. Historical data also shows consecutive advances from approximately $0.80 on Sept. 2 to $0.83 on Sept. 3, $0.82 on Sept. 4, and about $0.91 on Sept. 5. �
CoinGecko +1
📈 Bullish scenario
If RAY holds $0.90 and breaks $0.95 with strong volume:
$0.95 → $1.00 → $1.15 → $1.20
A clean break above $1.20 would significantly strengthen the medium-term bullish structure.
⚠️ Bearish scenario
If the current rally fails and RAY loses $0.90, I would watch:
$0.85 → $0.82 → $0.78–$0.80
A sustained move below $0.78 would weaken the bullish setup considerably.
🎯 My view
Short term: 🟢 Bullish, but extended.
The important thing now is not to chase a vertical candle. A pullback that holds around $0.85–$0.90 would be healthier than immediately continuing higher.
One caution: prices vary considerably between venues/pools right now. For example, the Raydium RAY/USDC pool was reported around $0.91, while Binance's RAY/USD data was showing a much higher intraday price, so check the exact exchange/pool before placing an order. �
Investing.com Canada +1
Key level to watch: $0.90.
Above it → bullish continuation remains favored.
Below it → expect a possible retest of $0.85–$0.82.
*This is technical analysis, not financial advice.*
{spot}(RAYUSDT)
#ZECHitsANewAllTimeHigh #ZECHitsANewAllTimeHigh #USAugustJobGrowthNearlyTriplesForecast
$RAY RAY/USDC — Latest Analysis 📊
Updated: September 6, 2026
The RAY/USDC pair on Raydium is showing a strong bullish move. The latest pair-specific data I found has RAY around $0.91 USDC, up about 10.4% over 24h, with roughly $4.48M TVL and $449K 24h volume in that pool. �
WhatToFarm
🔥 Technical picture
Level
Zone
Importance
Resistance 1
$0.92–$0.95
Immediate breakout area
Resistance 2
$1.00
Major psychological level
Resistance 3
$1.15–$1.20
Strong upside target
Support 1
$0.90
Current breakout area
Support 2
$0.85–$0.82
Important pullback zone
Support 3
$0.77–$0.80
Major structural support
RAY has moved from around $0.62–$0.65 in mid-August to above $0.90, so the short-term trend has clearly improved. Historical data also shows consecutive advances from approximately $0.80 on Sept. 2 to $0.83 on Sept. 3, $0.82 on Sept. 4, and about $0.91 on Sept. 5. �
CoinGecko +1
📈 Bullish scenario
If RAY holds $0.90 and breaks $0.95 with strong volume:
$0.95 → $1.00 → $1.15 → $1.20
A clean break above $1.20 would significantly strengthen the medium-term bullish structure.
⚠️ Bearish scenario
If the current rally fails and RAY loses $0.90, I would watch:
$0.85 → $0.82 → $0.78–$0.80
A sustained move below $0.78 would weaken the bullish setup considerably.
🎯 My view
Short term: 🟢 Bullish, but extended.
The important thing now is not to chase a vertical candle. A pullback that holds around $0.85–$0.90 would be healthier than immediately continuing higher.
One caution: prices vary considerably between venues/pools right now. For example, the Raydium RAY/USDC pool was reported around $0.91, while Binance's RAY/USD data was showing a much higher intraday price, so check the exact exchange/pool before placing an order. �
Investing.com Canada +1
Key level to watch: $0.90.
Above it → bullish continuation remains favored.
Below it → expect a possible retest of $0.85–$0.82.
*This is technical analysis, not financial advice.*
#ZECHitsANewAllTimeHigh #ZECHitsANewAllTimeHigh #USAugustJobGrowthNearlyTriplesForecast
Updated: September 6, 2026
The RAY/USDC pair on Raydium is showing a strong bullish move. The latest pair-specific data I found has RAY around $0.91 USDC, up about 10.4% over 24h, with roughly $4.48M TVL and $449K 24h volume in that pool. �
WhatToFarm
🔥 Technical picture
Level
Zone
Importance
Resistance 1
$0.92–$0.95
Immediate breakout area
Resistance 2
$1.00
Major psychological level
Resistance 3
$1.15–$1.20
Strong upside target
Support 1
$0.90
Current breakout area
Support 2
$0.85–$0.82
Important pullback zone
Support 3
$0.77–$0.80
Major structural support
RAY has moved from around $0.62–$0.65 in mid-August to above $0.90, so the short-term trend has clearly improved. Historical data also shows consecutive advances from approximately $0.80 on Sept. 2 to $0.83 on Sept. 3, $0.82 on Sept. 4, and about $0.91 on Sept. 5. �
CoinGecko +1
📈 Bullish scenario
If RAY holds $0.90 and breaks $0.95 with strong volume:
$0.95 → $1.00 → $1.15 → $1.20
A clean break above $1.20 would significantly strengthen the medium-term bullish structure.
⚠️ Bearish scenario
If the current rally fails and RAY loses $0.90, I would watch:
$0.85 → $0.82 → $0.78–$0.80
A sustained move below $0.78 would weaken the bullish setup considerably.
🎯 My view
Short term: 🟢 Bullish, but extended.
The important thing now is not to chase a vertical candle. A pullback that holds around $0.85–$0.90 would be healthier than immediately continuing higher.
One caution: prices vary considerably between venues/pools right now. For example, the Raydium RAY/USDC pool was reported around $0.91, while Binance's RAY/USD data was showing a much higher intraday price, so check the exact exchange/pool before placing an order. �
Investing.com Canada +1
Key level to watch: $0.90.
Above it → bullish continuation remains favored.
Below it → expect a possible retest of $0.85–$0.82.
*This is technical analysis, not financial advice.*
#ZECHitsANewAllTimeHigh #ZECHitsANewAllTimeHigh #USAugustJobGrowthNearlyTriplesForecast
12
翻訳参照
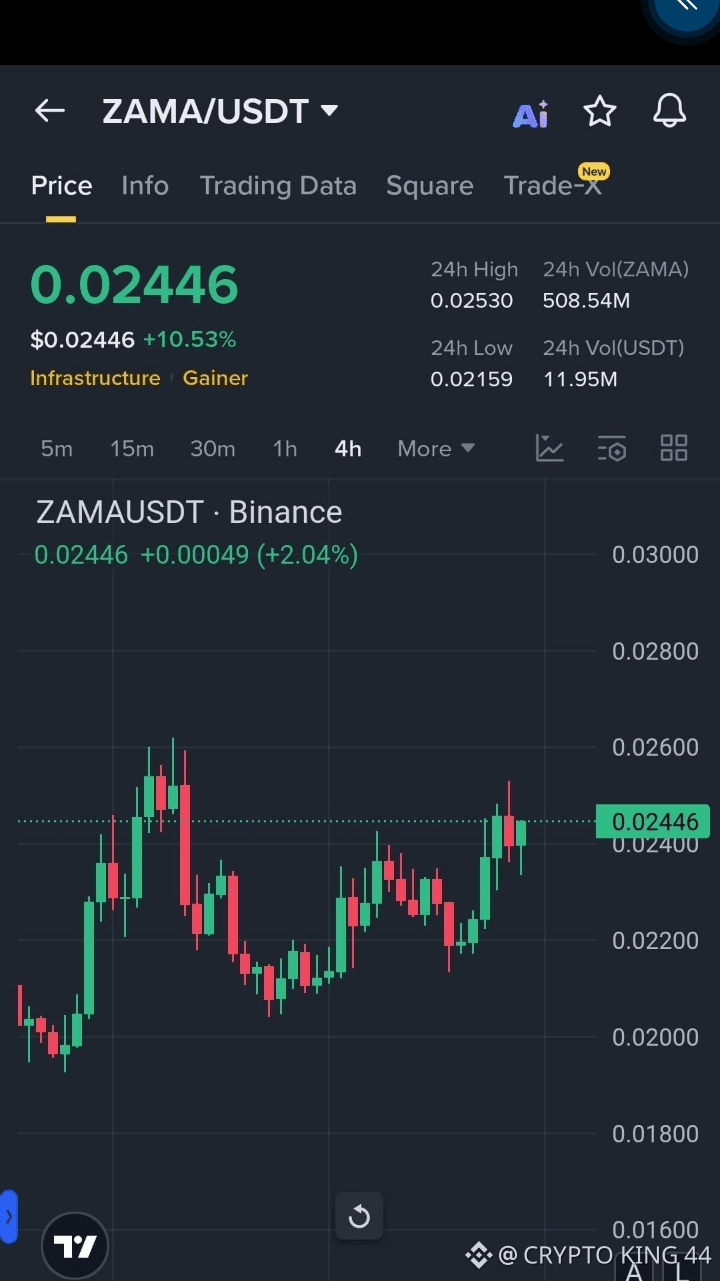
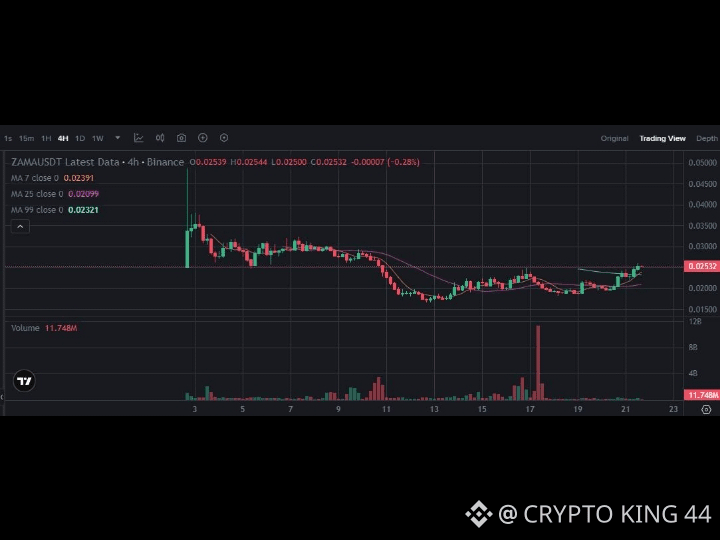
$ZAMA 📊 ZAMA/USDC — Latest Technical Analysis
Latest market check: Binance is showing ZAMA/USDC around $0.05170, down about 1.26% on its latest quote. The quoted market cap is about $163M, with fully diluted valuation around $578M. �
Binance
There is significant exchange-to-exchange price variation at the moment: other major trackers are showing ZAMA around $0.052–$0.062, so the exact level on your exchange matters. �
CoinMarketCap +2
📈 Key levels for ZAMA/USDC
Zone
Level
View
🔴 Major resistance
$0.066–0.067
Previous ATH area
🔴 Resistance
$0.060–0.062
Breakout zone
🟡 Pivot
$0.054–0.055
Needs to reclaim
🟢 Support
$0.049–0.050
Important
🟢 Strong support
$0.045–0.046
Next downside zone
🔵 Major support
$0.040–0.042
Bigger correction area
ZAMA's recent all-time high is approximately $0.066–$0.067, depending on the exchange/data source. �
Bybit +1
🐂 Bullish setup
If ZAMA/USDC holds $0.049–$0.050 and reclaims $0.055, I'd watch:
$0.060 → $0.062 → $0.066–0.067
A decisive close above $0.067 would be a major bullish breakout and could put price discovery back in play.
🐻 Bearish setup
If $0.049 breaks with strong volume, the next areas I'd watch are:
$0.045 → $0.042 → $0.040
A sustained move below $0.040 would significantly damage the current bullish structure.
🎯 My view
Short-term bias: cautiously bullish, but volatile.
The important battle is $0.050–$0.055. Above $0.055, momentum can strengthen toward $0.060+. Below $0.049, I would become much more defensive.
Zama's underlying thesis is its use of fully homomorphic encryption (FHE) for confidential blockchain computation, but ZAMA remains a highly volatile, relatively early-stage crypto asset. Supply/dilution and adoption are important risks.
Not financial advice. Crypto prices can move very quickly, and the ZAMA/USDC quote on your particular exchange may differ from the figures above.
{spot}(ZAMAUSDT)
#ZEC'sMarketCapSurpassedDOGE #BitcoinETFsBiggestDailyInflowSinceJanuary #USAugustJobGrowthNearlyTriplesForecast #USAugustNonfarmPayrollsDueToday
$ZAMA 📊 ZAMA/USDC — Latest Technical Analysis
Latest market check: Binance is showing ZAMA/USDC around $0.05170, down about 1.26% on its latest quote. The quoted market cap is about $163M, with fully diluted valuation around $578M. �
Binance
There is significant exchange-to-exchange price variation at the moment: other major trackers are showing ZAMA around $0.052–$0.062, so the exact level on your exchange matters. �
CoinMarketCap +2
📈 Key levels for ZAMA/USDC
Zone
Level
View
🔴 Major resistance
$0.066–0.067
Previous ATH area
🔴 Resistance
$0.060–0.062
Breakout zone
🟡 Pivot
$0.054–0.055
Needs to reclaim
🟢 Support
$0.049–0.050
Important
🟢 Strong support
$0.045–0.046
Next downside zone
🔵 Major support
$0.040–0.042
Bigger correction area
ZAMA's recent all-time high is approximately $0.066–$0.067, depending on the exchange/data source. �
Bybit +1
🐂 Bullish setup
If ZAMA/USDC holds $0.049–$0.050 and reclaims $0.055, I'd watch:
$0.060 → $0.062 → $0.066–0.067
A decisive close above $0.067 would be a major bullish breakout and could put price discovery back in play.
🐻 Bearish setup
If $0.049 breaks with strong volume, the next areas I'd watch are:
$0.045 → $0.042 → $0.040
A sustained move below $0.040 would significantly damage the current bullish structure.
🎯 My view
Short-term bias: cautiously bullish, but volatile.
The important battle is $0.050–$0.055. Above $0.055, momentum can strengthen toward $0.060+. Below $0.049, I would become much more defensive.
Zama's underlying thesis is its use of fully homomorphic encryption (FHE) for confidential blockchain computation, but ZAMA remains a highly volatile, relatively early-stage crypto asset. Supply/dilution and adoption are important risks.
Not financial advice. Crypto prices can move very quickly, and the ZAMA/USDC quote on your particular exchange may differ from the figures above.
#ZEC'sMarketCapSurpassedDOGE #BitcoinETFsBiggestDailyInflowSinceJanuary #USAugustJobGrowthNearlyTriplesForecast #USAugustNonfarmPayrollsDueToday
Latest market check: Binance is showing ZAMA/USDC around $0.05170, down about 1.26% on its latest quote. The quoted market cap is about $163M, with fully diluted valuation around $578M. �
Binance
There is significant exchange-to-exchange price variation at the moment: other major trackers are showing ZAMA around $0.052–$0.062, so the exact level on your exchange matters. �
CoinMarketCap +2
📈 Key levels for ZAMA/USDC
Zone
Level
View
🔴 Major resistance
$0.066–0.067
Previous ATH area
🔴 Resistance
$0.060–0.062
Breakout zone
🟡 Pivot
$0.054–0.055
Needs to reclaim
🟢 Support
$0.049–0.050
Important
🟢 Strong support
$0.045–0.046
Next downside zone
🔵 Major support
$0.040–0.042
Bigger correction area
ZAMA's recent all-time high is approximately $0.066–$0.067, depending on the exchange/data source. �
Bybit +1
🐂 Bullish setup
If ZAMA/USDC holds $0.049–$0.050 and reclaims $0.055, I'd watch:
$0.060 → $0.062 → $0.066–0.067
A decisive close above $0.067 would be a major bullish breakout and could put price discovery back in play.
🐻 Bearish setup
If $0.049 breaks with strong volume, the next areas I'd watch are:
$0.045 → $0.042 → $0.040
A sustained move below $0.040 would significantly damage the current bullish structure.
🎯 My view
Short-term bias: cautiously bullish, but volatile.
The important battle is $0.050–$0.055. Above $0.055, momentum can strengthen toward $0.060+. Below $0.049, I would become much more defensive.
Zama's underlying thesis is its use of fully homomorphic encryption (FHE) for confidential blockchain computation, but ZAMA remains a highly volatile, relatively early-stage crypto asset. Supply/dilution and adoption are important risks.
Not financial advice. Crypto prices can move very quickly, and the ZAMA/USDC quote on your particular exchange may differ from the figures above.
#ZEC'sMarketCapSurpassedDOGE #BitcoinETFsBiggestDailyInflowSinceJanuary #USAugustJobGrowthNearlyTriplesForecast #USAugustNonfarmPayrollsDueToday
71
翻訳参照
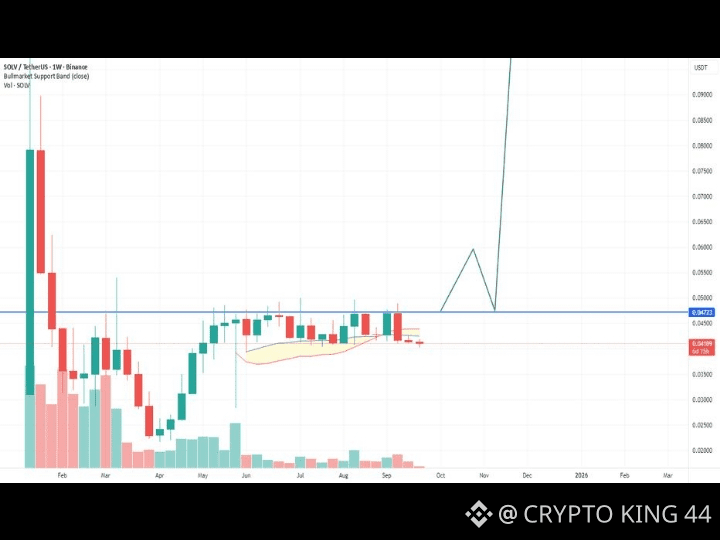
$SOLV SOLV/USDC — Latest Analysis
Current price: around $0.00332 USDC, with SOLV recently up about 8.9% in 24h. CoinDesk currently lists the Binance SOLV/USDC pair at $0.003320. �
CoinDesk
📊 Technical view
Short-term: 🟢 Bullish
24h range: roughly $0.0029–$0.0036. �
Investing.com India +1
Immediate resistance: $0.0036
Breakout target: $0.0040–$0.0042
Next resistance: $0.0045–$0.0050
Support: $0.0030–$0.0031
Major support: $0.0027–$0.0028
Critical floor: around $0.00215–$0.0022, near the recent August low. �
CoinGecko
🔥 My setup
Bullish scenario:
If SOLV holds $0.0030–$0.0031 and breaks $0.0036 with strong volume, the next likely zone is $0.0040, followed by $0.0045–$0.0050.
Bearish scenario:
A rejection around $0.0036 followed by a loss of $0.0030 could send SOLV back toward $0.0027–$0.0028. Losing ~$0.0022 would significantly weaken the structure.
SOLV has recovered substantially from its August all-time-low area, but it remains far below its January 2025 ATH of about $0.20, so this is still a highly speculative/high-volatility setup. �
CoinGecko
⚠️ Risk: Solv Protocol recently suffered a reported $2.7M exploit related to a smart-contract flaw, which adds fundamental risk even if the chart is improving. �
CoinGecko
Overall: Bullish above $0.0030 → breakout watch at $0.0036 → $0.0040/$0.0045 possible. Below $0.0030, I'd become cautious.
If you give me your entry price, I can calculate exact TP1 / TP2 / TP3 + stop-loss levels for SOLVUSDC.
{spot}(SOLVUSDT)
#ZECHitsANewAllTimeHigh #BitcoinETFsBiggestDailyInflowSinceJanuary #USAugustJobGrowthNearlyTriplesForecast #USAugustNonfarmPayrollsDueToday #BitcoinEthereumHitMultiMonthHighs
$SOLV SOLV/USDC — Latest Analysis
Current price: around $0.00332 USDC, with SOLV recently up about 8.9% in 24h. CoinDesk currently lists the Binance SOLV/USDC pair at $0.003320. �
CoinDesk
📊 Technical view
Short-term: 🟢 Bullish
24h range: roughly $0.0029–$0.0036. �
Investing.com India +1
Immediate resistance: $0.0036
Breakout target: $0.0040–$0.0042
Next resistance: $0.0045–$0.0050
Support: $0.0030–$0.0031
Major support: $0.0027–$0.0028
Critical floor: around $0.00215–$0.0022, near the recent August low. �
CoinGecko
🔥 My setup
Bullish scenario:
If SOLV holds $0.0030–$0.0031 and breaks $0.0036 with strong volume, the next likely zone is $0.0040, followed by $0.0045–$0.0050.
Bearish scenario:
A rejection around $0.0036 followed by a loss of $0.0030 could send SOLV back toward $0.0027–$0.0028. Losing ~$0.0022 would significantly weaken the structure.
SOLV has recovered substantially from its August all-time-low area, but it remains far below its January 2025 ATH of about $0.20, so this is still a highly speculative/high-volatility setup. �
CoinGecko
⚠️ Risk: Solv Protocol recently suffered a reported $2.7M exploit related to a smart-contract flaw, which adds fundamental risk even if the chart is improving. �
CoinGecko
Overall: Bullish above $0.0030 → breakout watch at $0.0036 → $0.0040/$0.0045 possible. Below $0.0030, I'd become cautious.
If you give me your entry price, I can calculate exact TP1 / TP2 / TP3 + stop-loss levels for SOLVUSDC.
#ZECHitsANewAllTimeHigh #BitcoinETFsBiggestDailyInflowSinceJanuary #USAugustJobGrowthNearlyTriplesForecast #USAugustNonfarmPayrollsDueToday #BitcoinEthereumHitMultiMonthHighs
Current price: around $0.00332 USDC, with SOLV recently up about 8.9% in 24h. CoinDesk currently lists the Binance SOLV/USDC pair at $0.003320. �
CoinDesk
📊 Technical view
Short-term: 🟢 Bullish
24h range: roughly $0.0029–$0.0036. �
Investing.com India +1
Immediate resistance: $0.0036
Breakout target: $0.0040–$0.0042
Next resistance: $0.0045–$0.0050
Support: $0.0030–$0.0031
Major support: $0.0027–$0.0028
Critical floor: around $0.00215–$0.0022, near the recent August low. �
CoinGecko
🔥 My setup
Bullish scenario:
If SOLV holds $0.0030–$0.0031 and breaks $0.0036 with strong volume, the next likely zone is $0.0040, followed by $0.0045–$0.0050.
Bearish scenario:
A rejection around $0.0036 followed by a loss of $0.0030 could send SOLV back toward $0.0027–$0.0028. Losing ~$0.0022 would significantly weaken the structure.
SOLV has recovered substantially from its August all-time-low area, but it remains far below its January 2025 ATH of about $0.20, so this is still a highly speculative/high-volatility setup. �
CoinGecko
⚠️ Risk: Solv Protocol recently suffered a reported $2.7M exploit related to a smart-contract flaw, which adds fundamental risk even if the chart is improving. �
CoinGecko
Overall: Bullish above $0.0030 → breakout watch at $0.0036 → $0.0040/$0.0045 possible. Below $0.0030, I'd become cautious.
If you give me your entry price, I can calculate exact TP1 / TP2 / TP3 + stop-loss levels for SOLVUSDC.
#ZECHitsANewAllTimeHigh #BitcoinETFsBiggestDailyInflowSinceJanuary #USAugustJobGrowthNearlyTriplesForecast #USAugustNonfarmPayrollsDueToday #BitcoinEthereumHitMultiMonthHighs
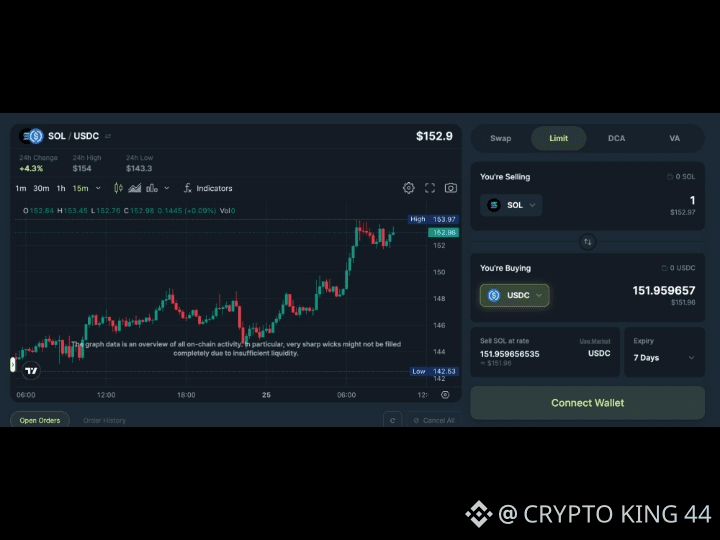
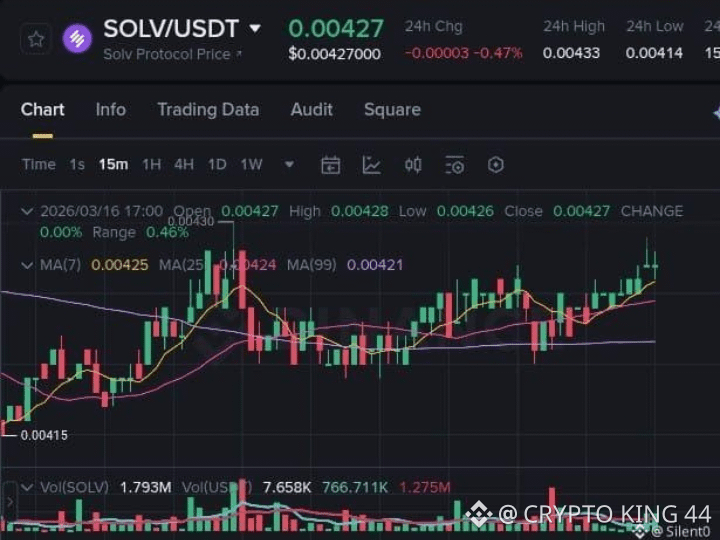
67
翻訳参照
$EPIC 📊 EPIC/USD latest analysis
Current price: around $0.40. CoinMarketCap reports EPIC up about 11.2% over 24 hours, with 24h volume around $16.3M, a substantial increase in trading activity. �
CoinMarketCap
Technical bias: 🟢 Bullish, but extended
RSI: ~59–61 → bullish momentum without being extremely overbought. �
Investing.com Canada +1
MACD: bullish.
ADX: ~26 → trend has reasonable strength.
Moving averages: price is above the 20, 50, 100 and 200-day averages, which is a constructive medium-term signal. �
Investing.com Canada
Volume: the recent breakout was accompanied by a major volume increase, making the move more convincing. �
CoinMarketCap
🎯 Important levels
Level
Interpretation
$0.45
🔴 Major near-term resistance
$0.40–0.42
Current breakout/decision zone
$0.38
🟢 Important support
$0.35–0.36
Stronger support / breakout base
$0.33
🔴 Bearish warning if lost
CoinMarketCap's latest analysis specifically identifies $0.38 as the level EPIC needs to hold and $0.45 as the next important resistance. A move below $0.33 would weaken the bullish setup. �
CoinMarketCap
🔮 My scenario
Bullish: If EPIC holds $0.38–$0.40 and volume remains strong, a test of $0.45 is reasonable. A clean breakout above $0.45 could open the way toward higher resistance levels.
Neutral: A pullback toward $0.35–$0.38 followed by consolidation would be healthy after the recent sharp rise.
Bearish: Losing $0.35, particularly on heavy volume, would suggest the breakout is failing; below $0.33 the short-term bullish structure becomes much weaker.
Overall: Bullish 7/10, but I would avoid chasing a large green candle. Waiting for either a successful retest around $0.38–$0.40 or a confirmed breakout above $0.45 gives a cleaner risk/reward setup.
This is technical analysis, not financial advice. EPIC is a highly volatile crypto asset.
{spot}(EPICUSDT)
#ZECHitsANewAllTimeHigh #BitcoinETFsBiggestDailyInflowSinceJanuary #AdobeSharesFall3%OnCEOTransition #USAugustNonfarmPayrollsDueToday #USAugustAvgHourlyEarningsRise3.1%
$EPIC 📊 EPIC/USD latest analysis
Current price: around $0.40. CoinMarketCap reports EPIC up about 11.2% over 24 hours, with 24h volume around $16.3M, a substantial increase in trading activity. �
CoinMarketCap
Technical bias: 🟢 Bullish, but extended
RSI: ~59–61 → bullish momentum without being extremely overbought. �
Investing.com Canada +1
MACD: bullish.
ADX: ~26 → trend has reasonable strength.
Moving averages: price is above the 20, 50, 100 and 200-day averages, which is a constructive medium-term signal. �
Investing.com Canada
Volume: the recent breakout was accompanied by a major volume increase, making the move more convincing. �
CoinMarketCap
🎯 Important levels
Level
Interpretation
$0.45
🔴 Major near-term resistance
$0.40–0.42
Current breakout/decision zone
$0.38
🟢 Important support
$0.35–0.36
Stronger support / breakout base
$0.33
🔴 Bearish warning if lost
CoinMarketCap's latest analysis specifically identifies $0.38 as the level EPIC needs to hold and $0.45 as the next important resistance. A move below $0.33 would weaken the bullish setup. �
CoinMarketCap
🔮 My scenario
Bullish: If EPIC holds $0.38–$0.40 and volume remains strong, a test of $0.45 is reasonable. A clean breakout above $0.45 could open the way toward higher resistance levels.
Neutral: A pullback toward $0.35–$0.38 followed by consolidation would be healthy after the recent sharp rise.
Bearish: Losing $0.35, particularly on heavy volume, would suggest the breakout is failing; below $0.33 the short-term bullish structure becomes much weaker.
Overall: Bullish 7/10, but I would avoid chasing a large green candle. Waiting for either a successful retest around $0.38–$0.40 or a confirmed breakout above $0.45 gives a cleaner risk/reward setup.
This is technical analysis, not financial advice. EPIC is a highly volatile crypto asset.
#ZECHitsANewAllTimeHigh #BitcoinETFsBiggestDailyInflowSinceJanuary #AdobeSharesFall3%OnCEOTransition #USAugustNonfarmPayrollsDueToday #USAugustAvgHourlyEarningsRise3.1%
Current price: around $0.40. CoinMarketCap reports EPIC up about 11.2% over 24 hours, with 24h volume around $16.3M, a substantial increase in trading activity. �
CoinMarketCap
Technical bias: 🟢 Bullish, but extended
RSI: ~59–61 → bullish momentum without being extremely overbought. �
Investing.com Canada +1
MACD: bullish.
ADX: ~26 → trend has reasonable strength.
Moving averages: price is above the 20, 50, 100 and 200-day averages, which is a constructive medium-term signal. �
Investing.com Canada
Volume: the recent breakout was accompanied by a major volume increase, making the move more convincing. �
CoinMarketCap
🎯 Important levels
Level
Interpretation
$0.45
🔴 Major near-term resistance
$0.40–0.42
Current breakout/decision zone
$0.38
🟢 Important support
$0.35–0.36
Stronger support / breakout base
$0.33
🔴 Bearish warning if lost
CoinMarketCap's latest analysis specifically identifies $0.38 as the level EPIC needs to hold and $0.45 as the next important resistance. A move below $0.33 would weaken the bullish setup. �
CoinMarketCap
🔮 My scenario
Bullish: If EPIC holds $0.38–$0.40 and volume remains strong, a test of $0.45 is reasonable. A clean breakout above $0.45 could open the way toward higher resistance levels.
Neutral: A pullback toward $0.35–$0.38 followed by consolidation would be healthy after the recent sharp rise.
Bearish: Losing $0.35, particularly on heavy volume, would suggest the breakout is failing; below $0.33 the short-term bullish structure becomes much weaker.
Overall: Bullish 7/10, but I would avoid chasing a large green candle. Waiting for either a successful retest around $0.38–$0.40 or a confirmed breakout above $0.45 gives a cleaner risk/reward setup.
This is technical analysis, not financial advice. EPIC is a highly volatile crypto asset.
#ZECHitsANewAllTimeHigh #BitcoinETFsBiggestDailyInflowSinceJanuary #AdobeSharesFall3%OnCEOTransition #USAugustNonfarmPayrollsDueToday #USAugustAvgHourlyEarningsRise3.1%
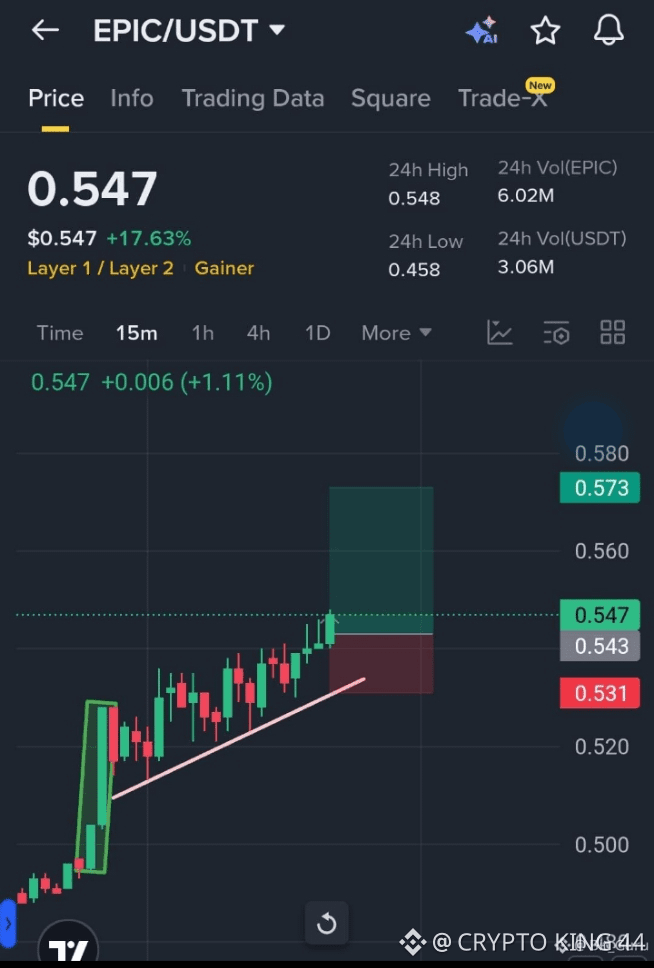
117
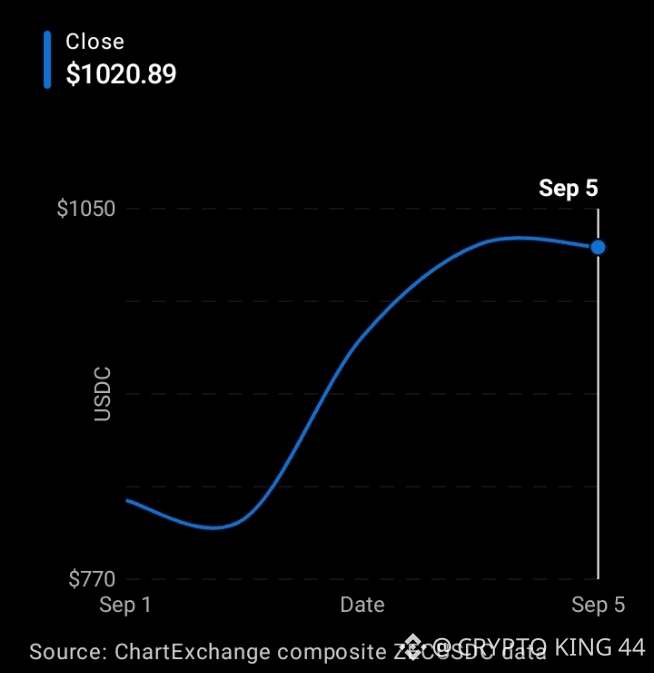
$ZEC ZECUSDC — 最近の日次価格
最新利用可能なZEC/USDC複合データに基づく日次終値。
終値
$1020.89
出典: ChartExchange 複合ZECUSDCデータ
📈 テクニカルビュー
トレンド: 非常に強い強気。ZECは9月1日から9月5日にかけておよそ25%上昇し、特に9月3日〜4日にかけて力強いブレイクアウトが見られました。 �
ChartExchange
レジスタンス: $1,050が直近の重要な上値抵抗。ZECは9月4日に$1,050に到達しました。明確に上抜ければ、心理的・テクニカルに$1,100〜$1,150の領域が開ける可能性があります。
サポート: 最初の支持帯は$1,000〜$997、その次が$950〜$953です。$950を失うと短期的な構造はかなり弱まります。
モメンタム: ZECは直近の急騰後、極めて買われ過ぎの状態です。TradingViewでは、ZECUSDCは1週間で約+7.27%、1か月で+68.45%を示しています。 �
TradingView
ファンダメンタル要因: ZECは最近、10年ぶりに$1,000を上抜け、報告されているスポットETFの流入や機関投資家の関心が強気の物語を後押ししています。 �
CoinMarketCap
🎯 私のシナリオマップ
強気: $1,000を維持 → $1,050を回復 → $1,100 / $1,150
中立: $950〜$1,050の間で持ち合い
弱気: $950を割る → $900〜$930への押し戻しの可能性
バイアス: 🟢 強気だが、高リスク・過熱気味。ここで垂直的なローソク足を追いかけるよりも、$1,050超えの確認済みブレイクアウト、または$950〜$1,000を維持する管理された押し目の方が安心して見られます。
これは市場分析であり、投資助言ではありません。暗号資産はどちらの方向にも急激に動く可能性があります。 �
ChartExchange +1
TradingViewでZECUSDCのライブチャートを開く�
{spot}(ZECUSDT)
#LululemonTumbles20%OnWeakGuidance #USAugustJobGrowthNearlyTriplesForecast #USAugustAvgHourlyEarningsRise3.1% #BitcoinETFsBiggestDailyInflowSinceJanuary
$ZEC ZECUSDC — 最近の日次価格
最新利用可能なZEC/USDC複合データに基づく日次終値。
終値
$1020.89
出典: ChartExchange 複合ZECUSDCデータ
📈 テクニカルビュー
トレンド: 非常に強い強気。ZECは9月1日から9月5日にかけておよそ25%上昇し、特に9月3日〜4日にかけて力強いブレイクアウトが見られました。 �
ChartExchange
レジスタンス: $1,050が直近の重要な上値抵抗。ZECは9月4日に$1,050に到達しました。明確に上抜ければ、心理的・テクニカルに$1,100〜$1,150の領域が開ける可能性があります。
サポート: 最初の支持帯は$1,000〜$997、その次が$950〜$953です。$950を失うと短期的な構造はかなり弱まります。
モメンタム: ZECは直近の急騰後、極めて買われ過ぎの状態です。TradingViewでは、ZECUSDCは1週間で約+7.27%、1か月で+68.45%を示しています。 �
TradingView
ファンダメンタル要因: ZECは最近、10年ぶりに$1,000を上抜け、報告されているスポットETFの流入や機関投資家の関心が強気の物語を後押ししています。 �
CoinMarketCap
🎯 私のシナリオマップ
強気: $1,000を維持 → $1,050を回復 → $1,100 / $1,150
中立: $950〜$1,050の間で持ち合い
弱気: $950を割る → $900〜$930への押し戻しの可能性
バイアス: 🟢 強気だが、高リスク・過熱気味。ここで垂直的なローソク足を追いかけるよりも、$1,050超えの確認済みブレイクアウト、または$950〜$1,000を維持する管理された押し目の方が安心して見られます。
これは市場分析であり、投資助言ではありません。暗号資産はどちらの方向にも急激に動く可能性があります。 �
ChartExchange +1
TradingViewでZECUSDCのライブチャートを開く�
#LululemonTumbles20%OnWeakGuidance #USAugustJobGrowthNearlyTriplesForecast #USAugustAvgHourlyEarningsRise3.1% #BitcoinETFsBiggestDailyInflowSinceJanuary
最新利用可能なZEC/USDC複合データに基づく日次終値。
終値
$1020.89
出典: ChartExchange 複合ZECUSDCデータ
📈 テクニカルビュー
トレンド: 非常に強い強気。ZECは9月1日から9月5日にかけておよそ25%上昇し、特に9月3日〜4日にかけて力強いブレイクアウトが見られました。 �
ChartExchange
レジスタンス: $1,050が直近の重要な上値抵抗。ZECは9月4日に$1,050に到達しました。明確に上抜ければ、心理的・テクニカルに$1,100〜$1,150の領域が開ける可能性があります。
サポート: 最初の支持帯は$1,000〜$997、その次が$950〜$953です。$950を失うと短期的な構造はかなり弱まります。
モメンタム: ZECは直近の急騰後、極めて買われ過ぎの状態です。TradingViewでは、ZECUSDCは1週間で約+7.27%、1か月で+68.45%を示しています。 �
TradingView
ファンダメンタル要因: ZECは最近、10年ぶりに$1,000を上抜け、報告されているスポットETFの流入や機関投資家の関心が強気の物語を後押ししています。 �
CoinMarketCap
🎯 私のシナリオマップ
強気: $1,000を維持 → $1,050を回復 → $1,100 / $1,150
中立: $950〜$1,050の間で持ち合い
弱気: $950を割る → $900〜$930への押し戻しの可能性
バイアス: 🟢 強気だが、高リスク・過熱気味。ここで垂直的なローソク足を追いかけるよりも、$1,050超えの確認済みブレイクアウト、または$950〜$1,000を維持する管理された押し目の方が安心して見られます。
これは市場分析であり、投資助言ではありません。暗号資産はどちらの方向にも急激に動く可能性があります。 �
ChartExchange +1
TradingViewでZECUSDCのライブチャートを開く�
#LululemonTumbles20%OnWeakGuidance #USAugustJobGrowthNearlyTriplesForecast #USAugustAvgHourlyEarningsRise3.1% #BitcoinETFsBiggestDailyInflowSinceJanuary
173
翻訳参照
nice post
nice post

KHAN CRYPTO 444
·
--
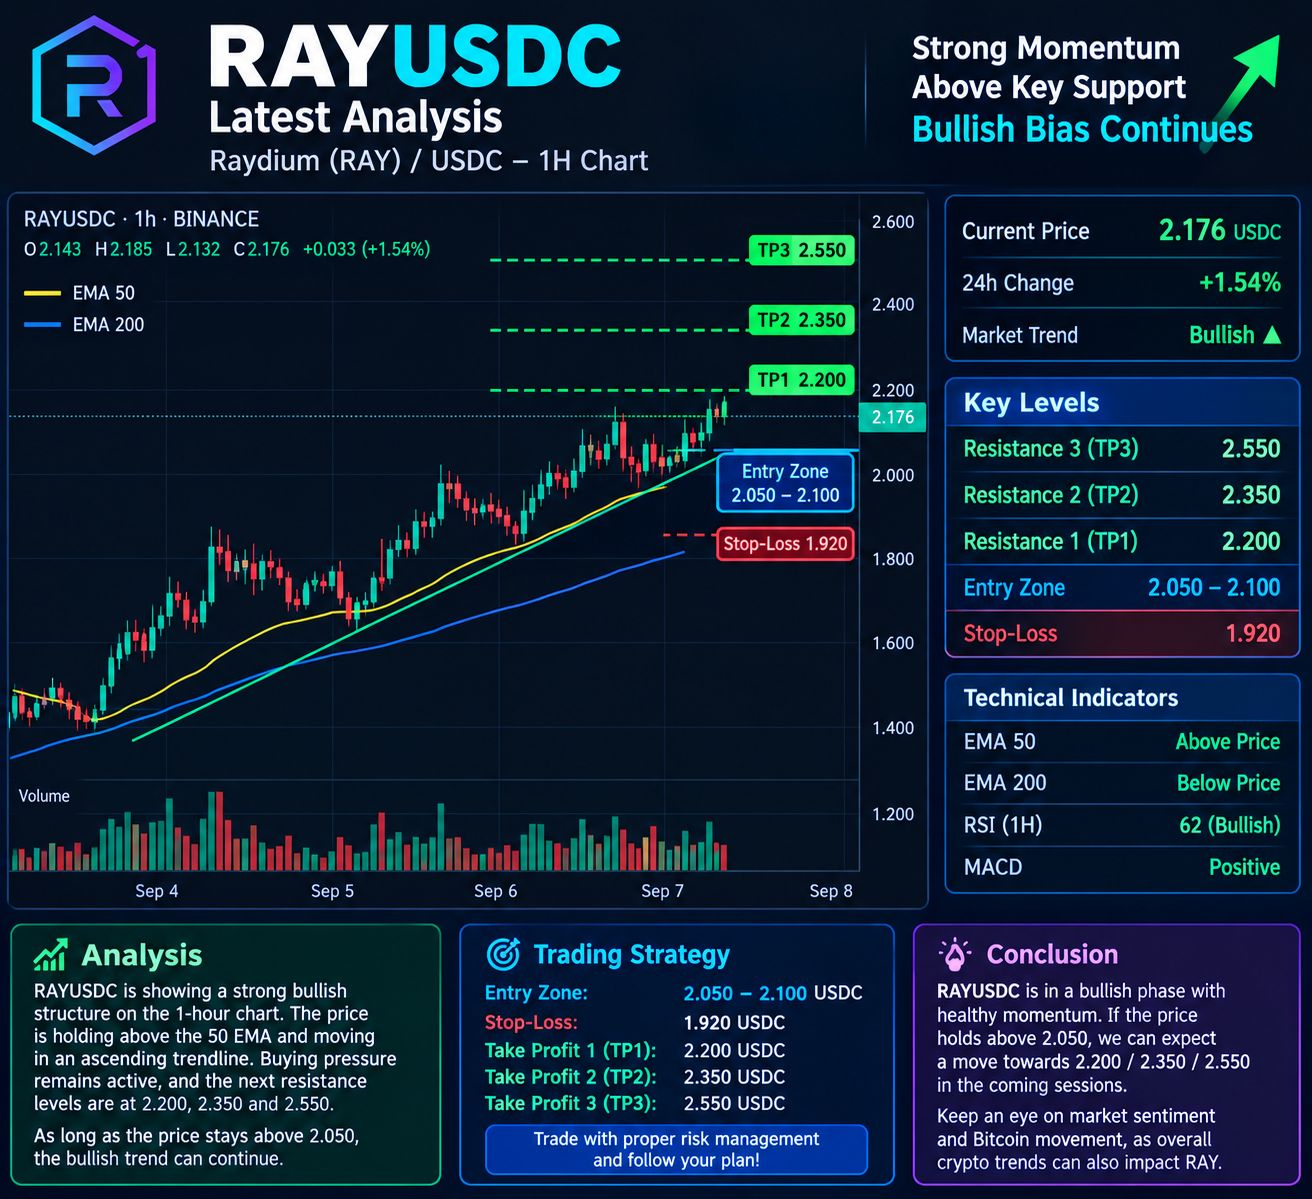
$RAY RAYUSDC — 最新の分析
現在の市場:RAYは最近、強い上昇モメンタムを示しており、価格は約0.95ドル、直近の高値は0.97ドル近辺です。 �
Investing.com UK +1
トレンド:🟢 強気(ただし過熱気味)
レジスタンス:1.00〜1.01ドル
ブレイクアウト目標:1.10〜1.15ドル
次の目標:1.30ドル
サポート:0.90ドル、次いで0.80ドル
1.01ドルを上抜けし、その状態が維持されれば、1.30ドル付近へ向かう道が開ける可能性があります。 �
CoinLore
取引アイデア:
🟢 買いゾーン:押し目で0.90〜0.93ドル
🛑 ストップロス:0.86ドル
🎯 TP1:1.01ドル
🎯 TP2:1.10〜1.15ドル
🎯 TP3:1.30ドル
⚠️ リスク:RAYは直近数セッションで既に大きく上昇しているため、大きなローソク足の後に価格を追いかけるのは危険になり得ます。 確認を待つか、押し目を待ちましょう。
*水準はテクニカルなシナリオであり、保証された目標ではありません。暗号資産は急速に動くことがあります。*
#ZECHitsANewAllTimeHigh #BitcoinETFsBiggestDailyInflowSinceJanuary #LululemonTumbles20%OnWeakGuidance #USAugustAvgHourlyEarningsRise3.1% #BitcoinEthereumHitMultiMonthHighs
現在の市場:RAYは最近、強い上昇モメンタムを示しており、価格は約0.95ドル、直近の高値は0.97ドル近辺です。 �
Investing.com UK +1
トレンド:🟢 強気(ただし過熱気味)
レジスタンス:1.00〜1.01ドル
ブレイクアウト目標:1.10〜1.15ドル
次の目標:1.30ドル
サポート:0.90ドル、次いで0.80ドル
1.01ドルを上抜けし、その状態が維持されれば、1.30ドル付近へ向かう道が開ける可能性があります。 �
CoinLore
取引アイデア:
🟢 買いゾーン:押し目で0.90〜0.93ドル
🛑 ストップロス:0.86ドル
🎯 TP1:1.01ドル
🎯 TP2:1.10〜1.15ドル
🎯 TP3:1.30ドル
⚠️ リスク:RAYは直近数セッションで既に大きく上昇しているため、大きなローソク足の後に価格を追いかけるのは危険になり得ます。 確認を待つか、押し目を待ちましょう。
*水準はテクニカルなシナリオであり、保証された目標ではありません。暗号資産は急速に動くことがあります。*
#ZECHitsANewAllTimeHigh #BitcoinETFsBiggestDailyInflowSinceJanuary #LululemonTumbles20%OnWeakGuidance #USAugustAvgHourlyEarningsRise3.1% #BitcoinEthereumHitMultiMonthHighs
1
1
翻訳参照
nice post
nice post
KHAN CRYPTO 444
·
--
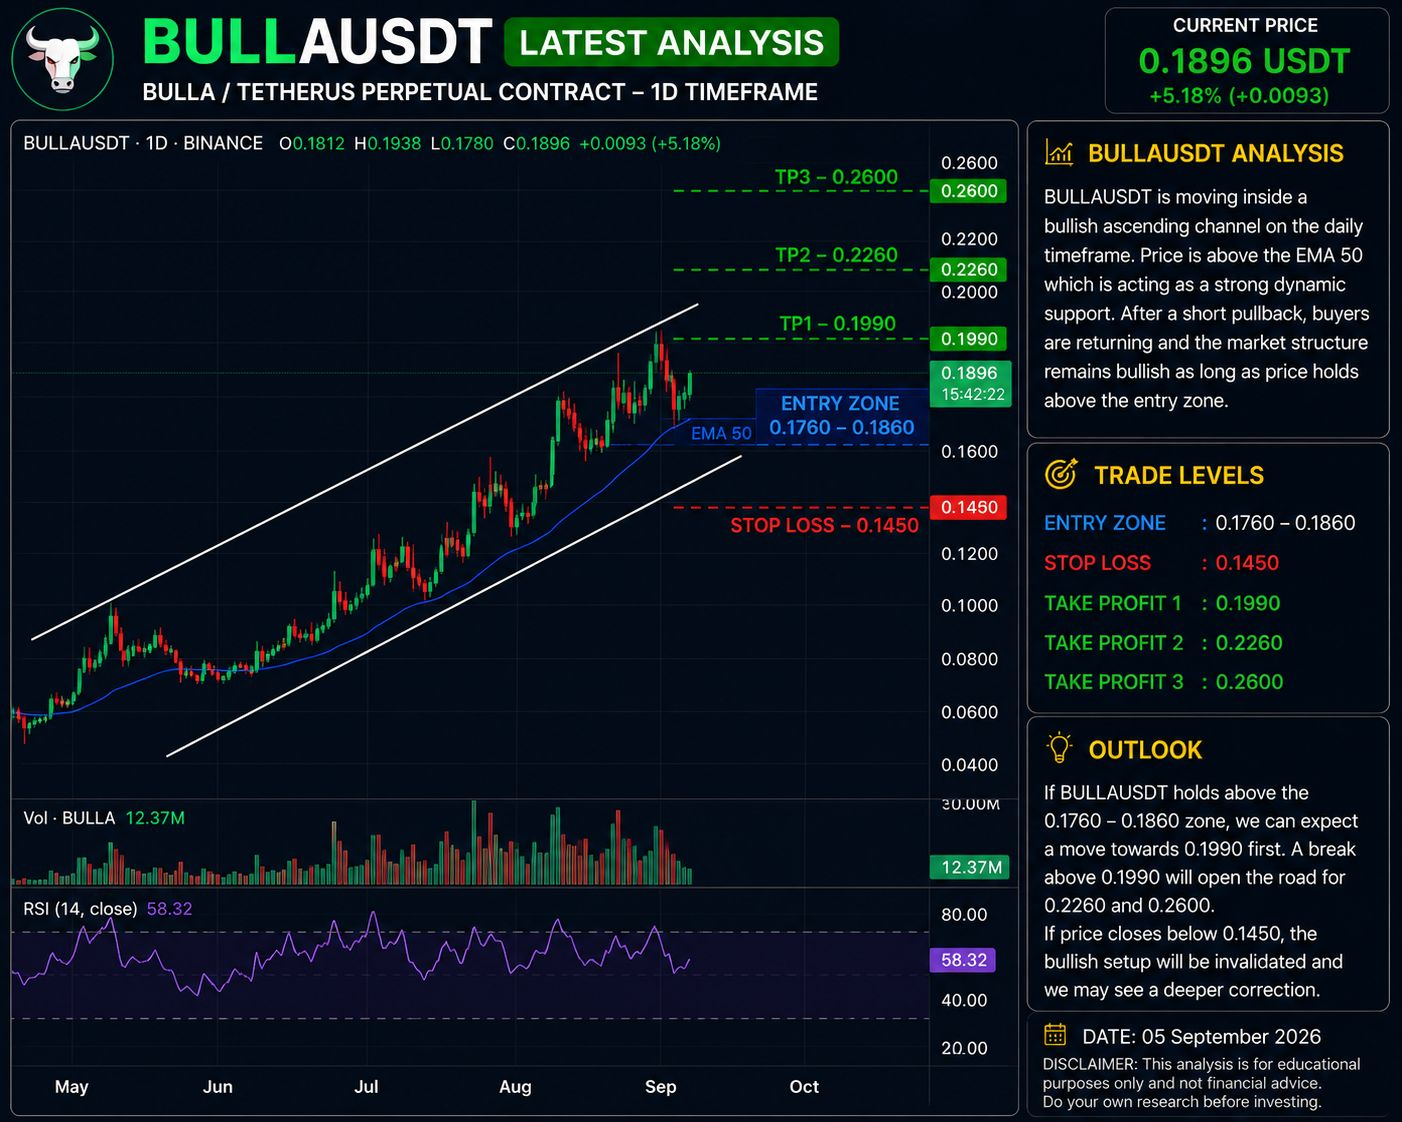
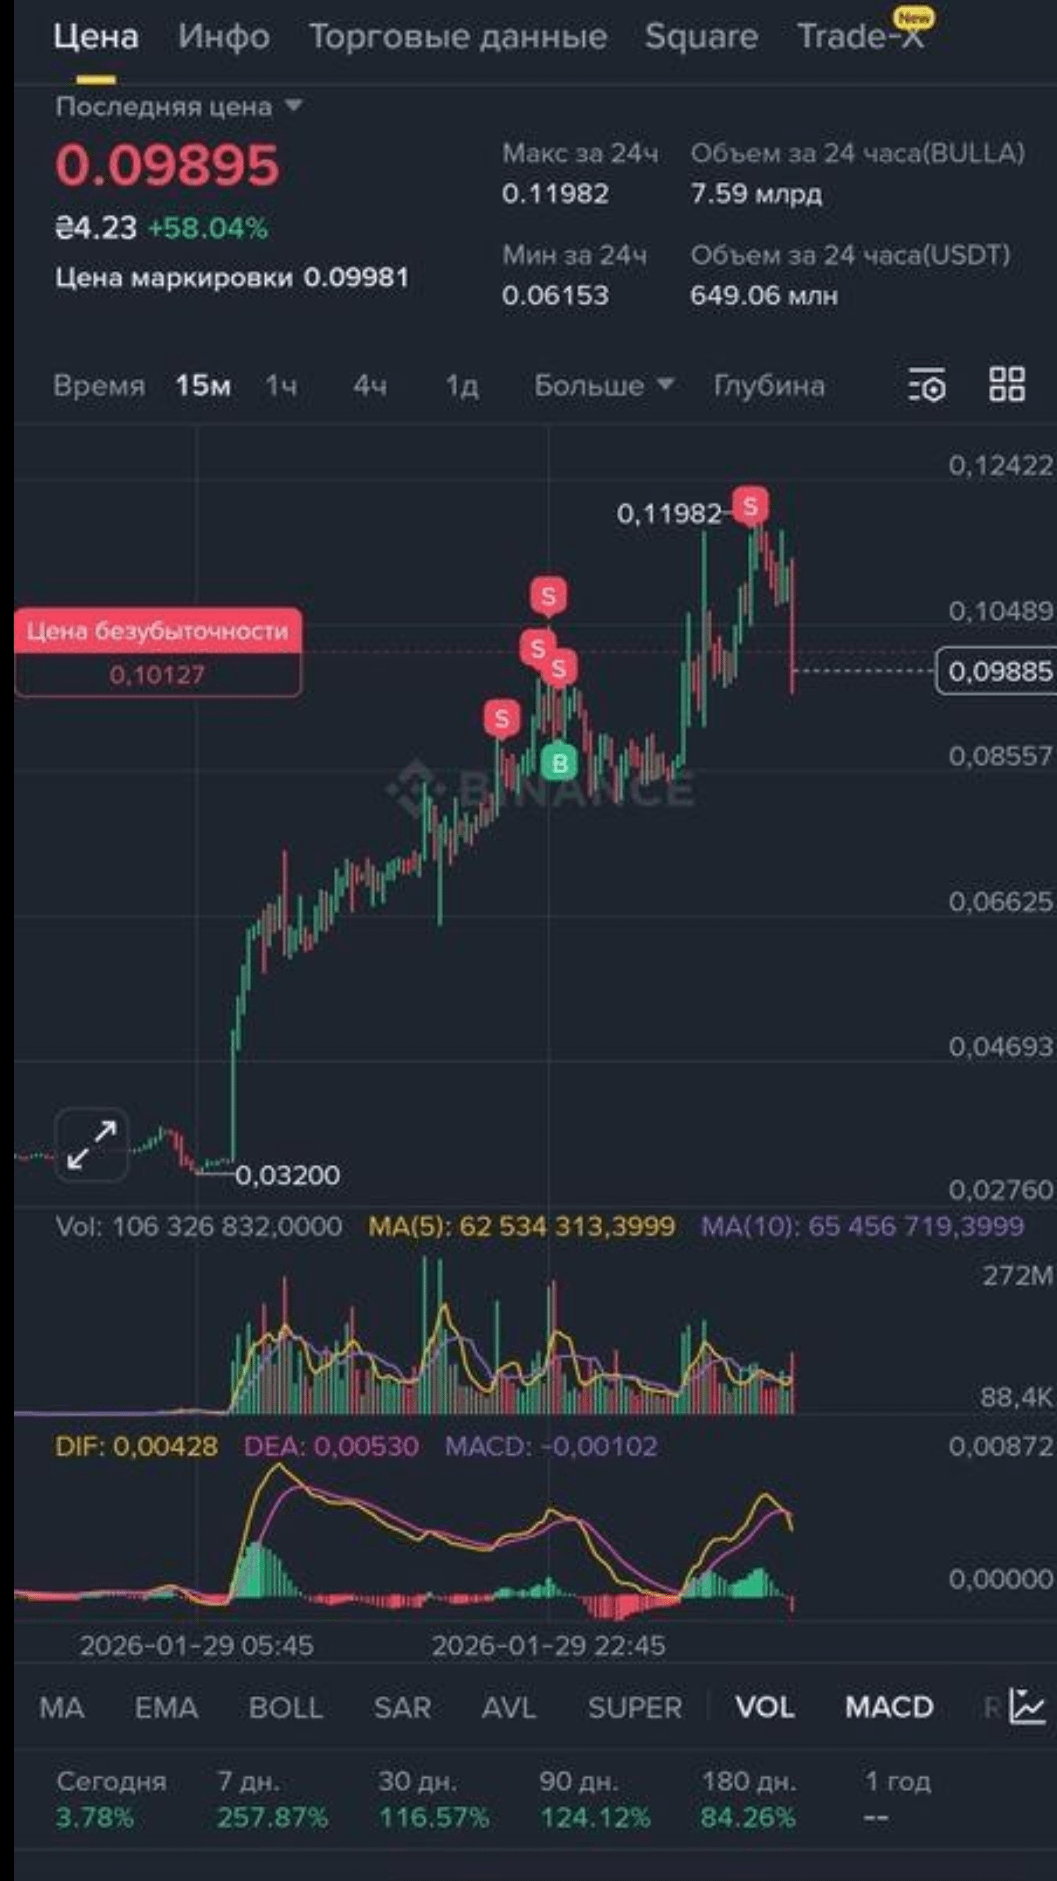
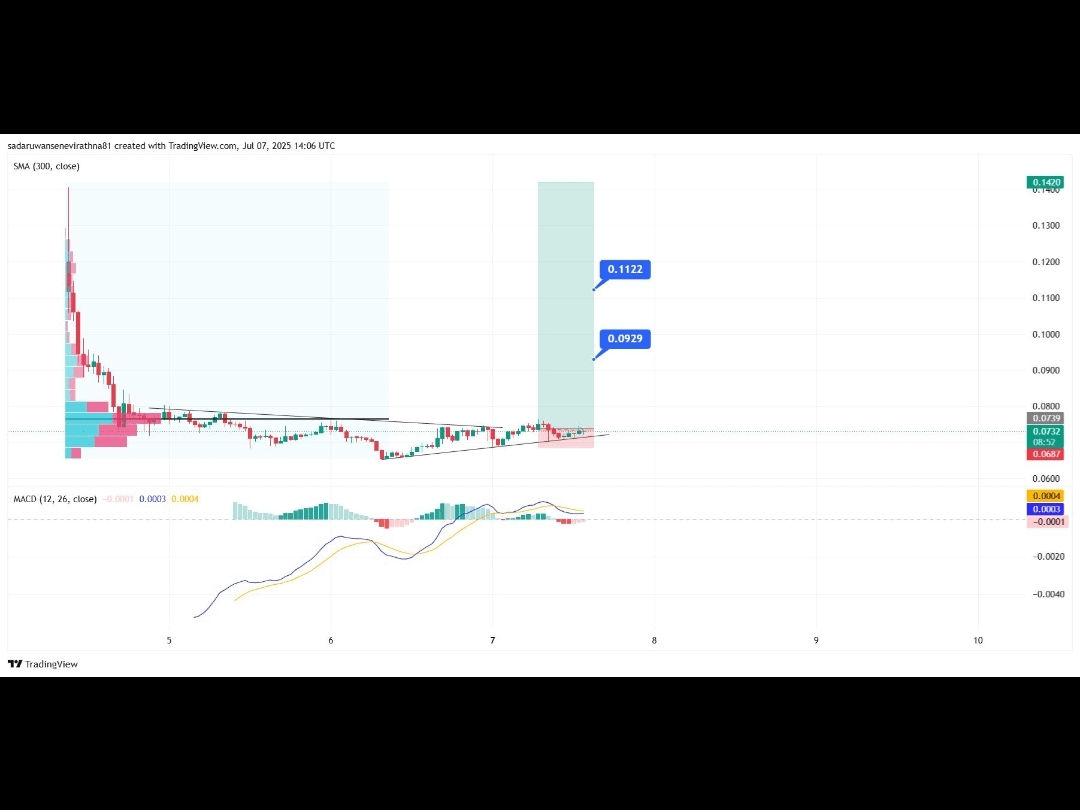
$BULLA BULLAUSDT 最新分析 — 2026年9月5日
現在の価格:市場/フィードにより約$0.028〜$0.035。TradingViewではBULLAUSDTは約$0.0284、Binanceのパーペチュアルデータは約$0.0345。 �
TradingView +1
📊 テクニカル見通し
🟢 トレンド:強気だが非常にボラティリティが高い
📈 7日間の値動き:約+68%(CoinGeckoのBULLAフィード)。 �
CoinGecko
🔥 レジスタンス:$0.035〜$0.039
🟢 サポート:$0.029〜$0.030
🎯 上昇目標:$0.040 → $0.045 → $0.050
🛑 弱気の無効ライン:〜$0.029を下回る状態が継続した場合
取引アイデア:大きな緑の足を追いかけるより、押し目での調整/サポートの再確認を待つ。BULLAは時価総額が小さく変動の大きいトークンなので、ポジションサイズと損切りが重要。
教育目的の分析のみであり、金融助言ではありません。 �
CoinGecko +1
#USWeeklyInitialJoblessClaimsRiseTo206000 #BitcoinETFsBiggestDailyInflowSinceJanuary #USAugustJobGrowthNearlyTriplesForecast #USAugustJobGrowthNearlyTriplesForecast
現在の価格:市場/フィードにより約$0.028〜$0.035。TradingViewではBULLAUSDTは約$0.0284、Binanceのパーペチュアルデータは約$0.0345。 �
TradingView +1
📊 テクニカル見通し
🟢 トレンド:強気だが非常にボラティリティが高い
📈 7日間の値動き:約+68%(CoinGeckoのBULLAフィード)。 �
CoinGecko
🔥 レジスタンス:$0.035〜$0.039
🟢 サポート:$0.029〜$0.030
🎯 上昇目標:$0.040 → $0.045 → $0.050
🛑 弱気の無効ライン:〜$0.029を下回る状態が継続した場合
取引アイデア:大きな緑の足を追いかけるより、押し目での調整/サポートの再確認を待つ。BULLAは時価総額が小さく変動の大きいトークンなので、ポジションサイズと損切りが重要。
教育目的の分析のみであり、金融助言ではありません。 �
CoinGecko +1
#USWeeklyInitialJoblessClaimsRiseTo206000 #BitcoinETFsBiggestDailyInflowSinceJanuary #USAugustJobGrowthNearlyTriplesForecast #USAugustJobGrowthNearlyTriplesForecast
1
1
翻訳参照
nice post
nice post
KHAN CRYPTO 444
·
--
$BULLA BULLAUSDT 最新分析 — 2026年9月5日
現在の価格:市場/フィードにより約$0.028〜$0.035。TradingViewではBULLAUSDTは約$0.0284、Binanceのパーペチュアルデータは約$0.0345。 �
TradingView +1
📊 テクニカル見通し
🟢 トレンド:強気だが非常にボラティリティが高い
📈 7日間の値動き:約+68%(CoinGeckoのBULLAフィード)。 �
CoinGecko
🔥 レジスタンス:$0.035〜$0.039
🟢 サポート:$0.029〜$0.030
🎯 上昇目標:$0.040 → $0.045 → $0.050
🛑 弱気の無効ライン:〜$0.029を下回る状態が継続した場合
取引アイデア:大きな緑の足を追いかけるより、押し目での調整/サポートの再確認を待つ。BULLAは時価総額が小さく変動の大きいトークンなので、ポジションサイズと損切りが重要。
教育目的の分析のみであり、金融助言ではありません。 �
CoinGecko +1
#USWeeklyInitialJoblessClaimsRiseTo206000 #BitcoinETFsBiggestDailyInflowSinceJanuary #USAugustJobGrowthNearlyTriplesForecast #USAugustJobGrowthNearlyTriplesForecast
現在の価格:市場/フィードにより約$0.028〜$0.035。TradingViewではBULLAUSDTは約$0.0284、Binanceのパーペチュアルデータは約$0.0345。 �
TradingView +1
📊 テクニカル見通し
🟢 トレンド:強気だが非常にボラティリティが高い
📈 7日間の値動き:約+68%(CoinGeckoのBULLAフィード)。 �
CoinGecko
🔥 レジスタンス:$0.035〜$0.039
🟢 サポート:$0.029〜$0.030
🎯 上昇目標:$0.040 → $0.045 → $0.050
🛑 弱気の無効ライン:〜$0.029を下回る状態が継続した場合
取引アイデア:大きな緑の足を追いかけるより、押し目での調整/サポートの再確認を待つ。BULLAは時価総額が小さく変動の大きいトークンなので、ポジションサイズと損切りが重要。
教育目的の分析のみであり、金融助言ではありません。 �
CoinGecko +1
#USWeeklyInitialJoblessClaimsRiseTo206000 #BitcoinETFsBiggestDailyInflowSinceJanuary #USAugustJobGrowthNearlyTriplesForecast #USAugustJobGrowthNearlyTriplesForecast
1
1
翻訳参照
nice post
nice post
KHAN CRYPTO 444
·
--
$BULLA BULLAUSDT 最新分析 — 2026年9月5日
現在の価格:市場/フィードにより約$0.028〜$0.035。TradingViewではBULLAUSDTは約$0.0284、Binanceのパーペチュアルデータは約$0.0345。 �
TradingView +1
📊 テクニカル見通し
🟢 トレンド:強気だが非常にボラティリティが高い
📈 7日間の値動き:約+68%(CoinGeckoのBULLAフィード)。 �
CoinGecko
🔥 レジスタンス:$0.035〜$0.039
🟢 サポート:$0.029〜$0.030
🎯 上昇目標:$0.040 → $0.045 → $0.050
🛑 弱気の無効ライン:〜$0.029を下回る状態が継続した場合
取引アイデア:大きな緑の足を追いかけるより、押し目での調整/サポートの再確認を待つ。BULLAは時価総額が小さく変動の大きいトークンなので、ポジションサイズと損切りが重要。
教育目的の分析のみであり、金融助言ではありません。 �
CoinGecko +1
#USWeeklyInitialJoblessClaimsRiseTo206000 #BitcoinETFsBiggestDailyInflowSinceJanuary #USAugustJobGrowthNearlyTriplesForecast #USAugustJobGrowthNearlyTriplesForecast
現在の価格:市場/フィードにより約$0.028〜$0.035。TradingViewではBULLAUSDTは約$0.0284、Binanceのパーペチュアルデータは約$0.0345。 �
TradingView +1
📊 テクニカル見通し
🟢 トレンド:強気だが非常にボラティリティが高い
📈 7日間の値動き:約+68%(CoinGeckoのBULLAフィード)。 �
CoinGecko
🔥 レジスタンス:$0.035〜$0.039
🟢 サポート:$0.029〜$0.030
🎯 上昇目標:$0.040 → $0.045 → $0.050
🛑 弱気の無効ライン:〜$0.029を下回る状態が継続した場合
取引アイデア:大きな緑の足を追いかけるより、押し目での調整/サポートの再確認を待つ。BULLAは時価総額が小さく変動の大きいトークンなので、ポジションサイズと損切りが重要。
教育目的の分析のみであり、金融助言ではありません。 �
CoinGecko +1
#USWeeklyInitialJoblessClaimsRiseTo206000 #BitcoinETFsBiggestDailyInflowSinceJanuary #USAugustJobGrowthNearlyTriplesForecast #USAugustJobGrowthNearlyTriplesForecast
1
1
翻訳参照
nice post
nice post
KHAN CRYPTO 444
·
--
$BULLA BULLAUSDT 最新分析 — 2026年9月5日
現在の価格:市場/フィードにより約$0.028〜$0.035。TradingViewではBULLAUSDTは約$0.0284、Binanceのパーペチュアルデータは約$0.0345。 �
TradingView +1
📊 テクニカル見通し
🟢 トレンド:強気だが非常にボラティリティが高い
📈 7日間の値動き:約+68%(CoinGeckoのBULLAフィード)。 �
CoinGecko
🔥 レジスタンス:$0.035〜$0.039
🟢 サポート:$0.029〜$0.030
🎯 上昇目標:$0.040 → $0.045 → $0.050
🛑 弱気の無効ライン:〜$0.029を下回る状態が継続した場合
取引アイデア:大きな緑の足を追いかけるより、押し目での調整/サポートの再確認を待つ。BULLAは時価総額が小さく変動の大きいトークンなので、ポジションサイズと損切りが重要。
教育目的の分析のみであり、金融助言ではありません。 �
CoinGecko +1
#USWeeklyInitialJoblessClaimsRiseTo206000 #BitcoinETFsBiggestDailyInflowSinceJanuary #USAugustJobGrowthNearlyTriplesForecast #USAugustJobGrowthNearlyTriplesForecast
現在の価格:市場/フィードにより約$0.028〜$0.035。TradingViewではBULLAUSDTは約$0.0284、Binanceのパーペチュアルデータは約$0.0345。 �
TradingView +1
📊 テクニカル見通し
🟢 トレンド:強気だが非常にボラティリティが高い
📈 7日間の値動き:約+68%(CoinGeckoのBULLAフィード)。 �
CoinGecko
🔥 レジスタンス:$0.035〜$0.039
🟢 サポート:$0.029〜$0.030
🎯 上昇目標:$0.040 → $0.045 → $0.050
🛑 弱気の無効ライン:〜$0.029を下回る状態が継続した場合
取引アイデア:大きな緑の足を追いかけるより、押し目での調整/サポートの再確認を待つ。BULLAは時価総額が小さく変動の大きいトークンなので、ポジションサイズと損切りが重要。
教育目的の分析のみであり、金融助言ではありません。 �
CoinGecko +1
#USWeeklyInitialJoblessClaimsRiseTo206000 #BitcoinETFsBiggestDailyInflowSinceJanuary #USAugustJobGrowthNearlyTriplesForecast #USAugustJobGrowthNearlyTriplesForecast
1
1
翻訳参照
nice post
nice post
KHAN CRYPTO 444
·
--
$BULLA BULLAUSDT 最新分析 — 2026年9月5日
現在の価格:市場/フィードにより約$0.028〜$0.035。TradingViewではBULLAUSDTは約$0.0284、Binanceのパーペチュアルデータは約$0.0345。 �
TradingView +1
📊 テクニカル見通し
🟢 トレンド:強気だが非常にボラティリティが高い
📈 7日間の値動き:約+68%(CoinGeckoのBULLAフィード)。 �
CoinGecko
🔥 レジスタンス:$0.035〜$0.039
🟢 サポート:$0.029〜$0.030
🎯 上昇目標:$0.040 → $0.045 → $0.050
🛑 弱気の無効ライン:〜$0.029を下回る状態が継続した場合
取引アイデア:大きな緑の足を追いかけるより、押し目での調整/サポートの再確認を待つ。BULLAは時価総額が小さく変動の大きいトークンなので、ポジションサイズと損切りが重要。
教育目的の分析のみであり、金融助言ではありません。 �
CoinGecko +1
#USWeeklyInitialJoblessClaimsRiseTo206000 #BitcoinETFsBiggestDailyInflowSinceJanuary #USAugustJobGrowthNearlyTriplesForecast #USAugustJobGrowthNearlyTriplesForecast
現在の価格:市場/フィードにより約$0.028〜$0.035。TradingViewではBULLAUSDTは約$0.0284、Binanceのパーペチュアルデータは約$0.0345。 �
TradingView +1
📊 テクニカル見通し
🟢 トレンド:強気だが非常にボラティリティが高い
📈 7日間の値動き:約+68%(CoinGeckoのBULLAフィード)。 �
CoinGecko
🔥 レジスタンス:$0.035〜$0.039
🟢 サポート:$0.029〜$0.030
🎯 上昇目標:$0.040 → $0.045 → $0.050
🛑 弱気の無効ライン:〜$0.029を下回る状態が継続した場合
取引アイデア:大きな緑の足を追いかけるより、押し目での調整/サポートの再確認を待つ。BULLAは時価総額が小さく変動の大きいトークンなので、ポジションサイズと損切りが重要。
教育目的の分析のみであり、金融助言ではありません。 �
CoinGecko +1
#USWeeklyInitialJoblessClaimsRiseTo206000 #BitcoinETFsBiggestDailyInflowSinceJanuary #USAugustJobGrowthNearlyTriplesForecast #USAugustJobGrowthNearlyTriplesForecast
1
1
ログインして、さらにコンテンツを読む
厳選トピックで世界の暗号資産トレーダーの仲間入り
⚡️ 暗号資産に関する最新かつ有益な情報が見つかります。
💬 世界最大の暗号資産取引所から信頼されています。
👍 認証を受けたクリエイターから、有益なインサイトを得られます。
メール / 電話番号
トレンドトピック
SECReceivesGrayscaleLitecoinTrustETFFiling
閲覧回数 62,625
1,157人が討論中
#secreceivesgrayscalelitecointrustetffiling
SEC、グレースケールのライトコインETF申請を受理:LTCがまた注目を浴びる 🚨
市場は静かに動いていたところに、別のライトコインの見出しが飛び込んできました。傍観しているトレーダーにとって、立ち止まってこう考えたくなるような申請です――機関投資家のアクセスは、いよいよ近づいてきているのでしょうか?
グレースケールのライトコイン・トラストは、提案されている移行とNYSE Arcaの上場プロセスに関連する最近の申請により、ETF構造に向けてさらに一歩進みました。SECの記録には、グレースケールのライトコイン提案をめぐる過去の手続きが示されており、最新の申請活動によってこのストーリーは引き続き生きています。
重要なのは、申請は承認ではないという点です。投資家は、規制の進展と、すぐにETFがローンチされるといった期待を切り分けて考えるべきです。
私の見解:より大きなテーマは「アクセスのしやすさ」です。ETFの形になれば、暗号資産を直接保有するのではなく、規制された市場商品を好む従来型の投資家にとって、LTCへのエクスポージャーがより簡単になる可能性があります。
ライトコインは現在、Binanceで約$53.69で取引されています。資産の24時間の値動きは小さめです。これにより、単なるヘッドライン主導の価格反応を追うよりも、規制の展開のほうが興味深いものになります。
真の試練は次に来ます。規制上の判断、市場の需要、流動性、そして機関投資家の関心が、書類の後に本当に続くかどうかです。
申請は扉を開けるかもしれませんが、開いた後に何が起きるかは需要が決めます。
❓グレースケールのライトコインETFは、LTCの機関投資家による需要を実質的に変え得ると思いますか?
免責事項:本内容は情報提供のみを目的としており、投資助言ではありません。暗号資産は価格変動が大きく、規制の結果は不確実です。
#Litecoin #CryptoETF #GrowWithSAC $LTC $ETH $SOL
#SECReceivesGrayscaleLitecoinTrustETFFiling
Sienna Leo-你真棒-带我走
·いいね:2件
·閲覧回数 2.1k
ClarityActFacesProceduralVoteSept15
閲覧回数 184,863
2,061人が討論中
US10YearTreasuryYieldNears5%
閲覧回数 63,561
1,130人が討論中