
Alexander Walwyn k7fg
10 投稿

Alexander Walwyn k7fg
報告
ユーザーをブロック
1 フォロー
0 フォロワー
0 いいね
投稿
HYPE USDT – テクニカル分析 📊
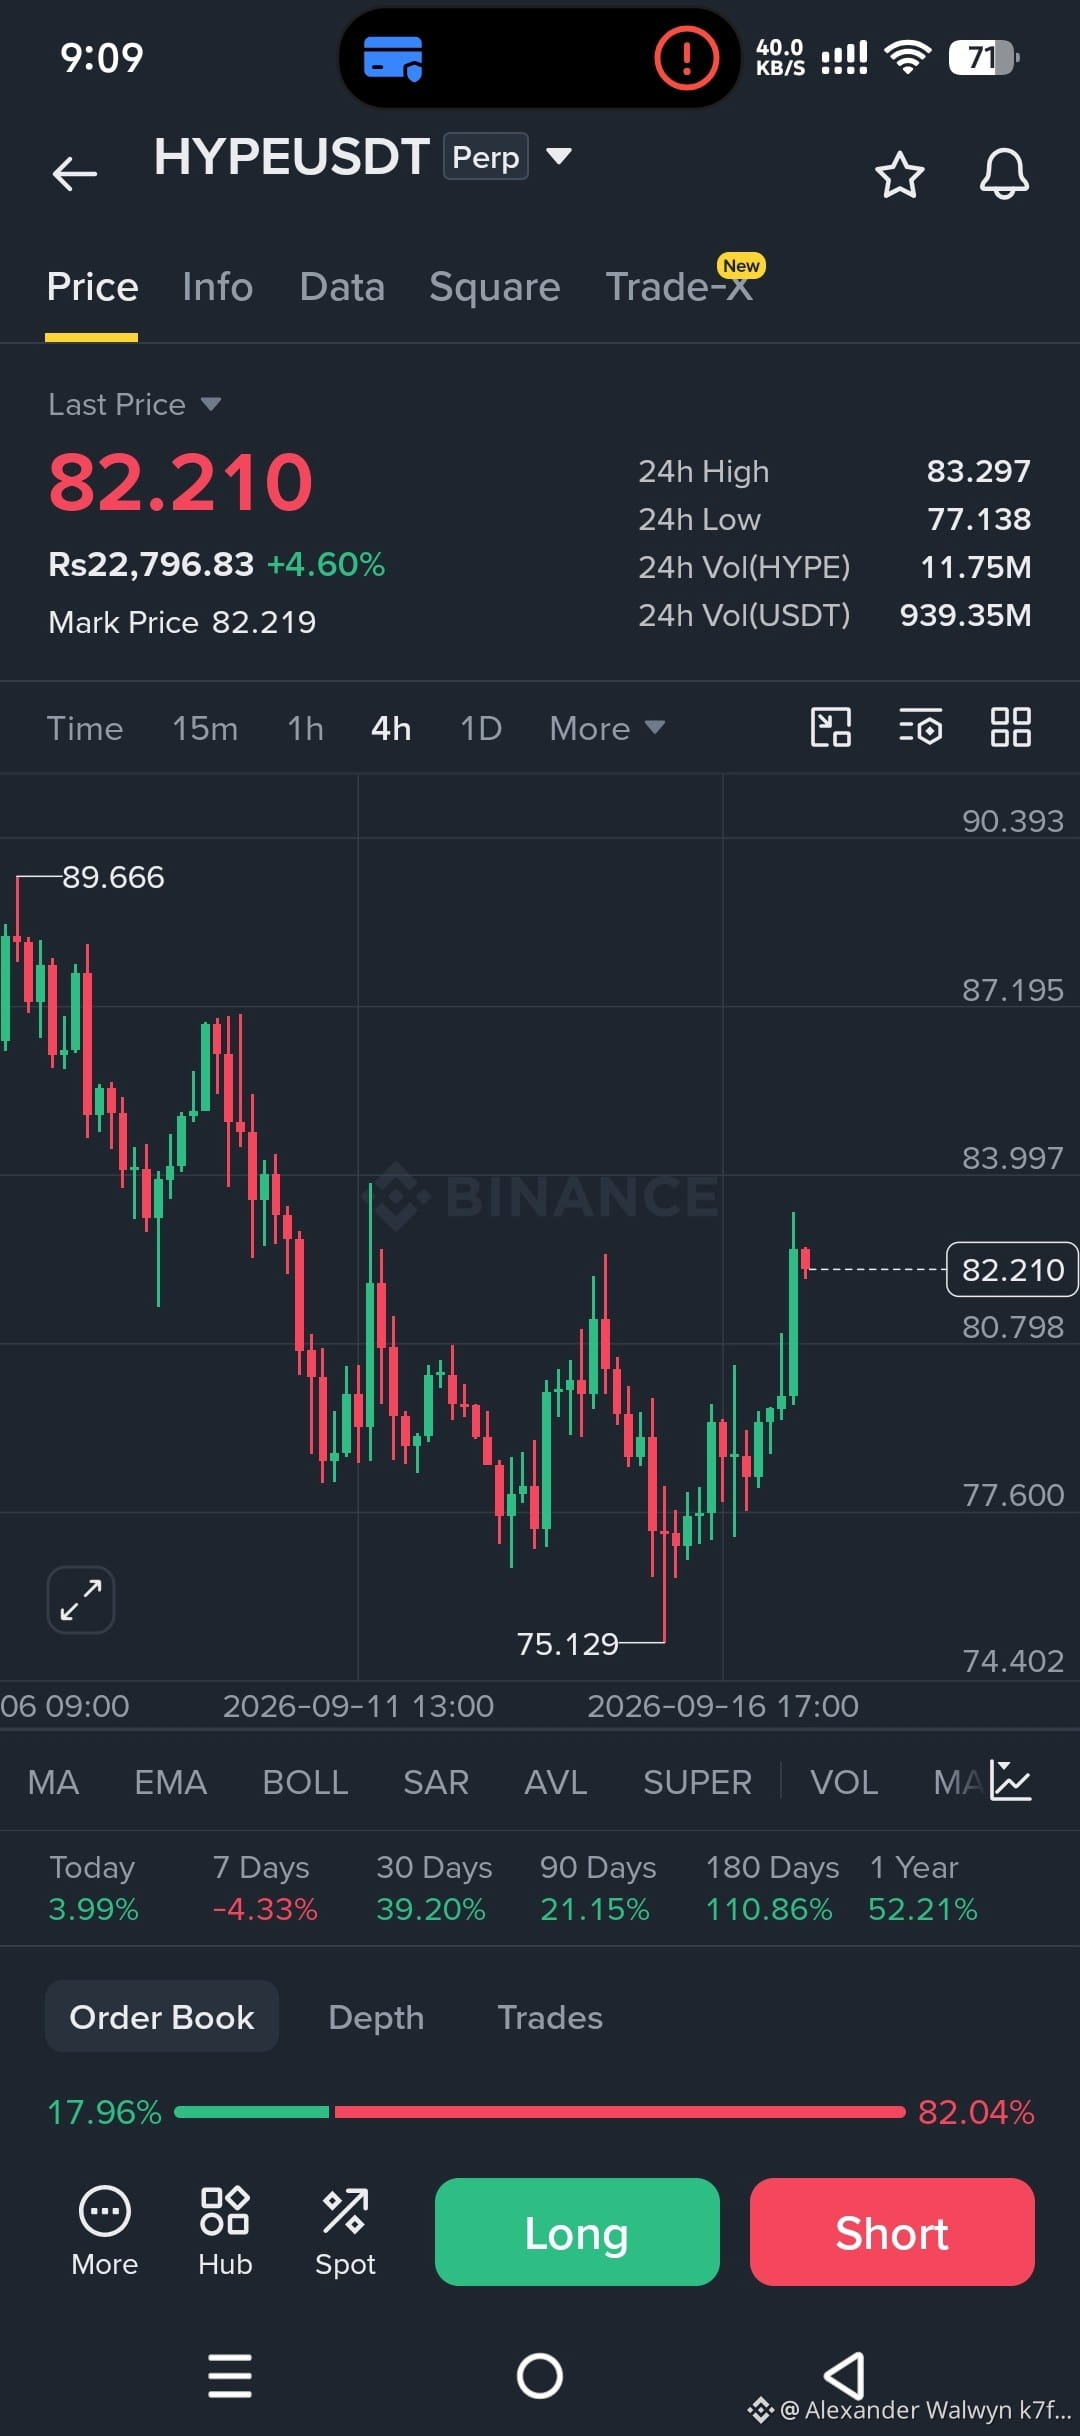
現在、価格は75.129の安値から強く反発した後、82.210で推移しています。
構造:
89.66 → 75.13 までの明確な下降トレンド
回復が進行中
短期の構造が強気へ転換
重要レベル:
サポート:
80.80 – 80.00(直近)
77.60 – 77.10
75.13(主要)
レジスタンス:
83.30 – 84.00(直近)
87.20
89.60 – 90.40
見通し:
価格が80.80を上回っている限り強気。
83.30を上抜けて終値で確定できれば、87~89.5に向かう道が開けます。
無効化条件:80.00を下抜けること。
慎重に取引し、リスク管理を行ってください。
#HYPEUSDT #Crypto #TechnicalAnalysis
HYPE USDT – テクニカル分析 📊
現在、価格は75.129の安値から強く反発した後、82.210で推移しています。
構造:
89.66 → 75.13 までの明確な下降トレンド
回復が進行中
短期の構造が強気へ転換
重要レベル:
サポート:
80.80 – 80.00(直近)
77.60 – 77.10
75.13(主要)
レジスタンス:
83.30 – 84.00(直近)
87.20
89.60 – 90.40
見通し:
価格が80.80を上回っている限り強気。
83.30を上抜けて終値で確定できれば、87~89.5に向かう道が開けます。
無効化条件:80.00を下抜けること。
慎重に取引し、リスク管理を行ってください。
#HYPEUSDT #Crypto #TechnicalAnalysis
現在、価格は75.129の安値から強く反発した後、82.210で推移しています。
構造:
89.66 → 75.13 までの明確な下降トレンド
回復が進行中
短期の構造が強気へ転換
重要レベル:
サポート:
80.80 – 80.00(直近)
77.60 – 77.10
75.13(主要)
レジスタンス:
83.30 – 84.00(直近)
87.20
89.60 – 90.40
見通し:
価格が80.80を上回っている限り強気。
83.30を上抜けて終値で確定できれば、87~89.5に向かう道が開けます。
無効化条件:80.00を下抜けること。
慎重に取引し、リスク管理を行ってください。
#HYPEUSDT #Crypto #TechnicalAnalysis
39
LINK/USDT 最新テクニカル分析
(最新のBinance 4Hチャートに基づく
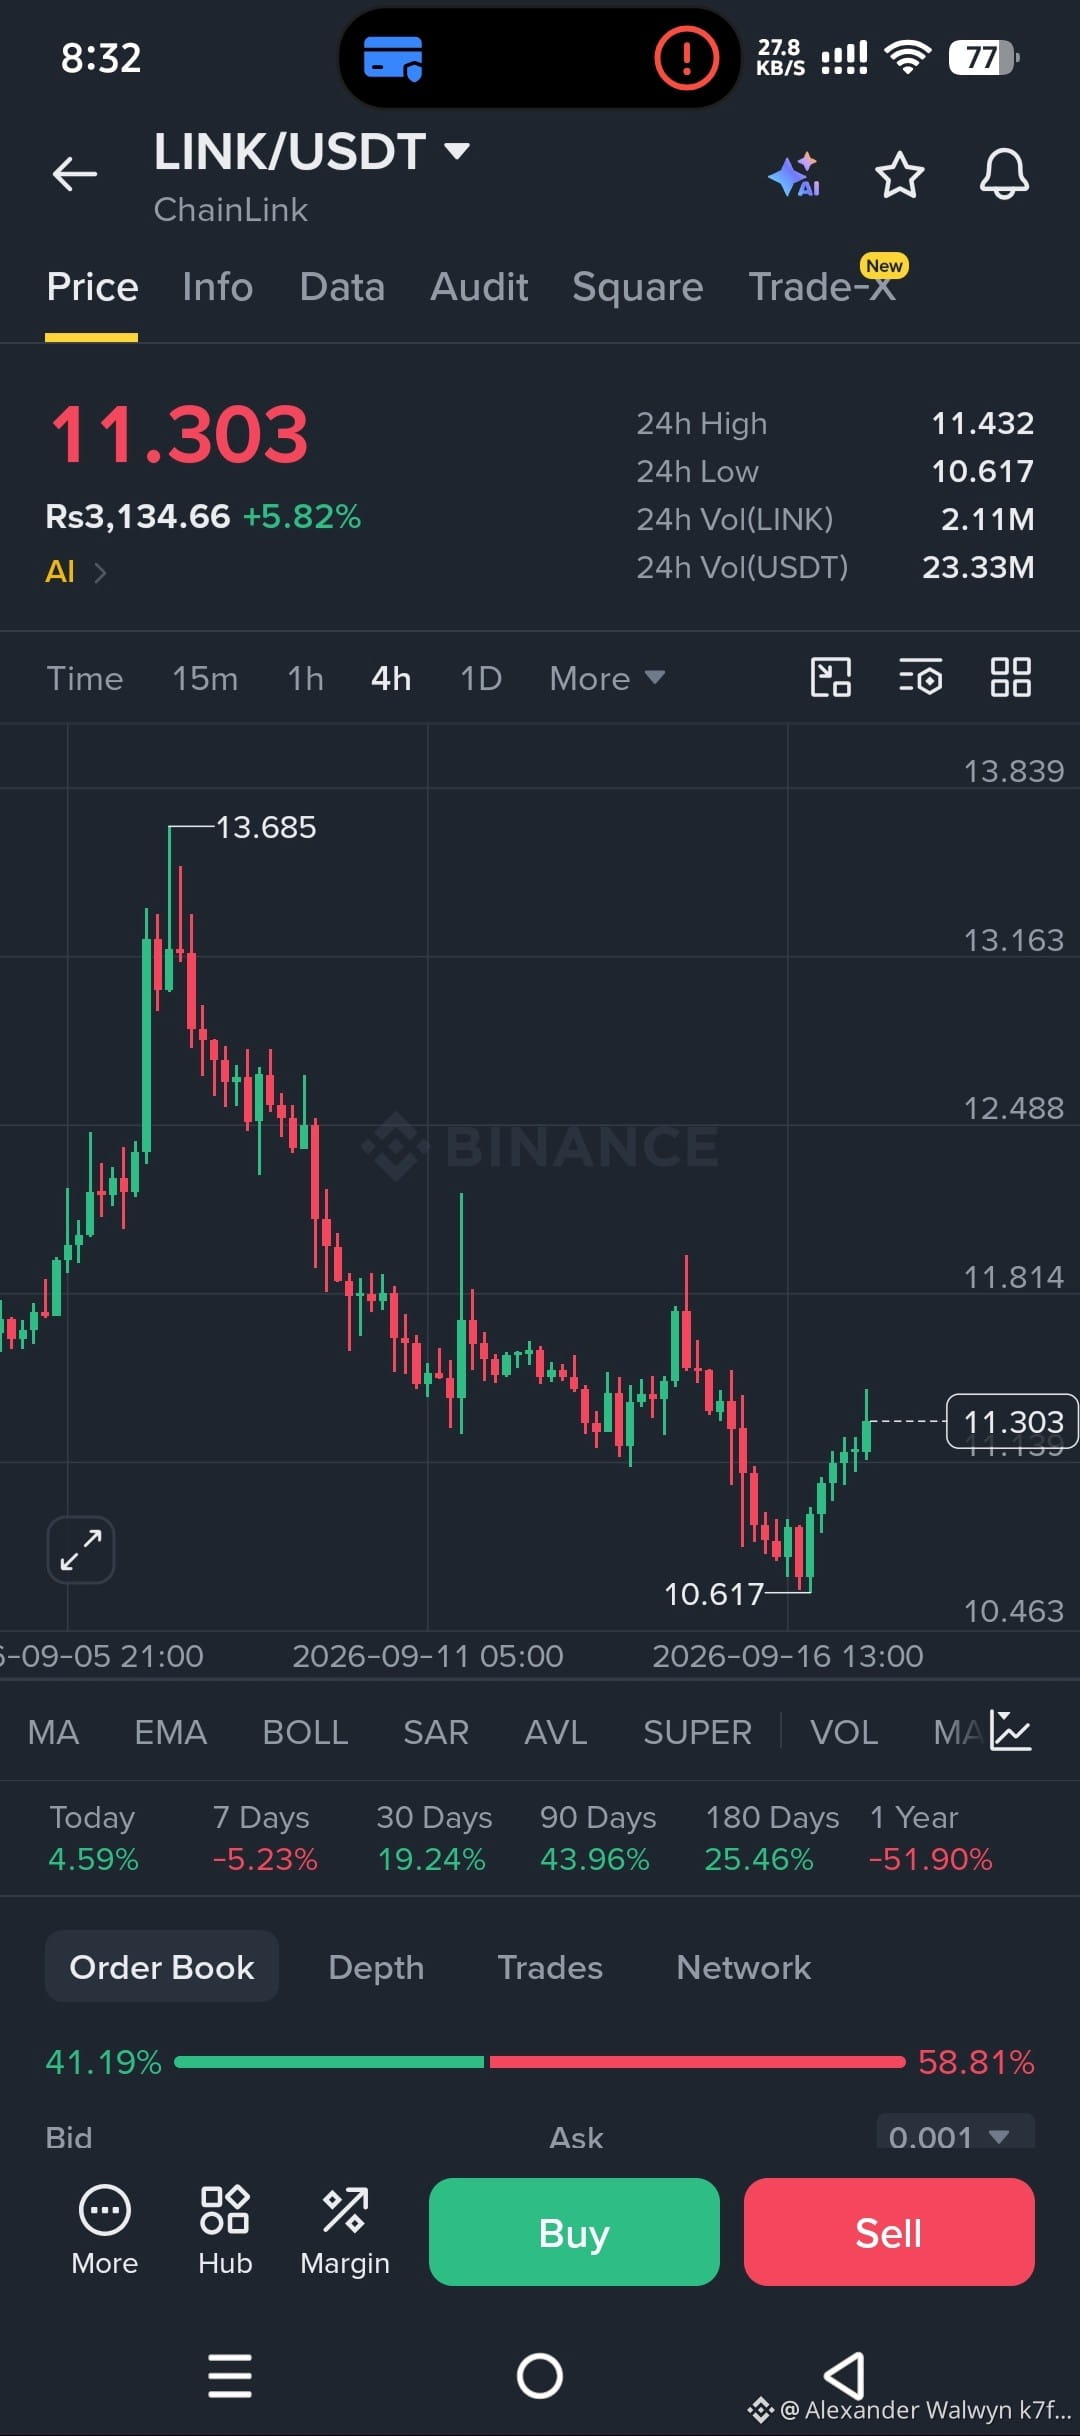
現在価格:$11.303
24時間変化:+5.82%
24時間の値幅:$10.617 – $11.432
出来高:2.11M LINK | 23.33M USDT
チャート概要(4H時間軸)
LINKは$10.617で明確な直近のローカル底を形成し、その後は連続する強い緑の足で上昇を積み重ねています。下げの回復はクリーンで、これまでのところ直近のスイング安値を上回って維持しています。
チャート上で確認できる主要レベル:
直近のレジスタンス:$11.43 – $11.50(24時間高値ゾーン)
次のレジスタンス:$11.80 – $12.00
主要レジスタンス:$12.48 – $13.16(過去の供給ゾーン)
強いサポート:$10.60 – $10.70
ブレイクダウン・レベル:$10.46を下回った場合
マーケット構造
価格は$13.68の高値を拒否し、そして数週間にわたる下落トレンドに入りました。
直近の安値$10.617は、買い手が防衛し続けるなら「切り上げ高値(高値更新の安値)」形成の可能性があるように見えます。
短期のモメンタムは、安値からの反発後に強気へと反転しています。
オーダーブックでは現在、売り圧力がやや強いことを示しています(売り58.81% vs 買い41.19%)。
パフォーマンス・スナップショット
期間 変化
今日 +4.59%
7日 –5.23%
30日 +19.24%
90日 +43.96%
180日 +25.46%
1年 –51.90%
短期の見通し
$10.60が維持される限り強気です。
$11.45–$11.50を堅い形で上抜けし、終値で上回れば、$11.80–$12.20に向かう動きの道が開けます。
$10.60を維持できない場合は、心理的節目の$10.00–$10.20への再テストのリスクがあります。
取引アイデア(投資助言ではありません)
ロング・セットアップ:
エントリー・ゾーン:$11.15 – $11.30
無効化:$10.60を下回る終値
目標:$11.80 → $12.20 → $12.80
ショート・セットアップ(拒否が出た場合のみ):
エントリー:出来高を伴う$11.45–$11.55からの反発(拒否)
ターゲット:$10.80 – $10.60
まとめ:
LINKは$10.62の安値から力強く反発しており、短期的な強さを見せています。次の数本の4H足が、それが単なるリリーフラリーなのか、より大きな回復の始まりなのかを判断するでしょう。$11.45の水準に注目してください。
冷静に対応し、リスク管理を徹底しましょう
LINK/USDT 最新テクニカル分析
(最新のBinance 4Hチャートに基づく
現在価格:$11.303
24時間変化:+5.82%
24時間の値幅:$10.617 – $11.432
出来高:2.11M LINK | 23.33M USDT
チャート概要(4H時間軸)
LINKは$10.617で明確な直近のローカル底を形成し、その後は連続する強い緑の足で上昇を積み重ねています。下げの回復はクリーンで、これまでのところ直近のスイング安値を上回って維持しています。
チャート上で確認できる主要レベル:
直近のレジスタンス:$11.43 – $11.50(24時間高値ゾーン)
次のレジスタンス:$11.80 – $12.00
主要レジスタンス:$12.48 – $13.16(過去の供給ゾーン)
強いサポート:$10.60 – $10.70
ブレイクダウン・レベル:$10.46を下回った場合
マーケット構造
価格は$13.68の高値を拒否し、そして数週間にわたる下落トレンドに入りました。
直近の安値$10.617は、買い手が防衛し続けるなら「切り上げ高値(高値更新の安値)」形成の可能性があるように見えます。
短期のモメンタムは、安値からの反発後に強気へと反転しています。
オーダーブックでは現在、売り圧力がやや強いことを示しています(売り58.81% vs 買い41.19%)。
パフォーマンス・スナップショット
期間 変化
今日 +4.59%
7日 –5.23%
30日 +19.24%
90日 +43.96%
180日 +25.46%
1年 –51.90%
短期の見通し
$10.60が維持される限り強気です。
$11.45–$11.50を堅い形で上抜けし、終値で上回れば、$11.80–$12.20に向かう動きの道が開けます。
$10.60を維持できない場合は、心理的節目の$10.00–$10.20への再テストのリスクがあります。
取引アイデア(投資助言ではありません)
ロング・セットアップ:
エントリー・ゾーン:$11.15 – $11.30
無効化:$10.60を下回る終値
目標:$11.80 → $12.20 → $12.80
ショート・セットアップ(拒否が出た場合のみ):
エントリー:出来高を伴う$11.45–$11.55からの反発(拒否)
ターゲット:$10.80 – $10.60
まとめ:
LINKは$10.62の安値から力強く反発しており、短期的な強さを見せています。次の数本の4H足が、それが単なるリリーフラリーなのか、より大きな回復の始まりなのかを判断するでしょう。$11.45の水準に注目してください。
冷静に対応し、リスク管理を徹底しましょう
(最新のBinance 4Hチャートに基づく
現在価格:$11.303
24時間変化:+5.82%
24時間の値幅:$10.617 – $11.432
出来高:2.11M LINK | 23.33M USDT
チャート概要(4H時間軸)
LINKは$10.617で明確な直近のローカル底を形成し、その後は連続する強い緑の足で上昇を積み重ねています。下げの回復はクリーンで、これまでのところ直近のスイング安値を上回って維持しています。
チャート上で確認できる主要レベル:
直近のレジスタンス:$11.43 – $11.50(24時間高値ゾーン)
次のレジスタンス:$11.80 – $12.00
主要レジスタンス:$12.48 – $13.16(過去の供給ゾーン)
強いサポート:$10.60 – $10.70
ブレイクダウン・レベル:$10.46を下回った場合
マーケット構造
価格は$13.68の高値を拒否し、そして数週間にわたる下落トレンドに入りました。
直近の安値$10.617は、買い手が防衛し続けるなら「切り上げ高値(高値更新の安値)」形成の可能性があるように見えます。
短期のモメンタムは、安値からの反発後に強気へと反転しています。
オーダーブックでは現在、売り圧力がやや強いことを示しています(売り58.81% vs 買い41.19%)。
パフォーマンス・スナップショット
期間 変化
今日 +4.59%
7日 –5.23%
30日 +19.24%
90日 +43.96%
180日 +25.46%
1年 –51.90%
短期の見通し
$10.60が維持される限り強気です。
$11.45–$11.50を堅い形で上抜けし、終値で上回れば、$11.80–$12.20に向かう動きの道が開けます。
$10.60を維持できない場合は、心理的節目の$10.00–$10.20への再テストのリスクがあります。
取引アイデア(投資助言ではありません)
ロング・セットアップ:
エントリー・ゾーン:$11.15 – $11.30
無効化:$10.60を下回る終値
目標:$11.80 → $12.20 → $12.80
ショート・セットアップ(拒否が出た場合のみ):
エントリー:出来高を伴う$11.45–$11.55からの反発(拒否)
ターゲット:$10.80 – $10.60
まとめ:
LINKは$10.62の安値から力強く反発しており、短期的な強さを見せています。次の数本の4H足が、それが単なるリリーフラリーなのか、より大きな回復の始まりなのかを判断するでしょう。$11.45の水準に注目してください。
冷静に対応し、リスク管理を徹底しましょう
48
DOGE/USDT 分析(Binance 4H チャート – 2026年9月17日)
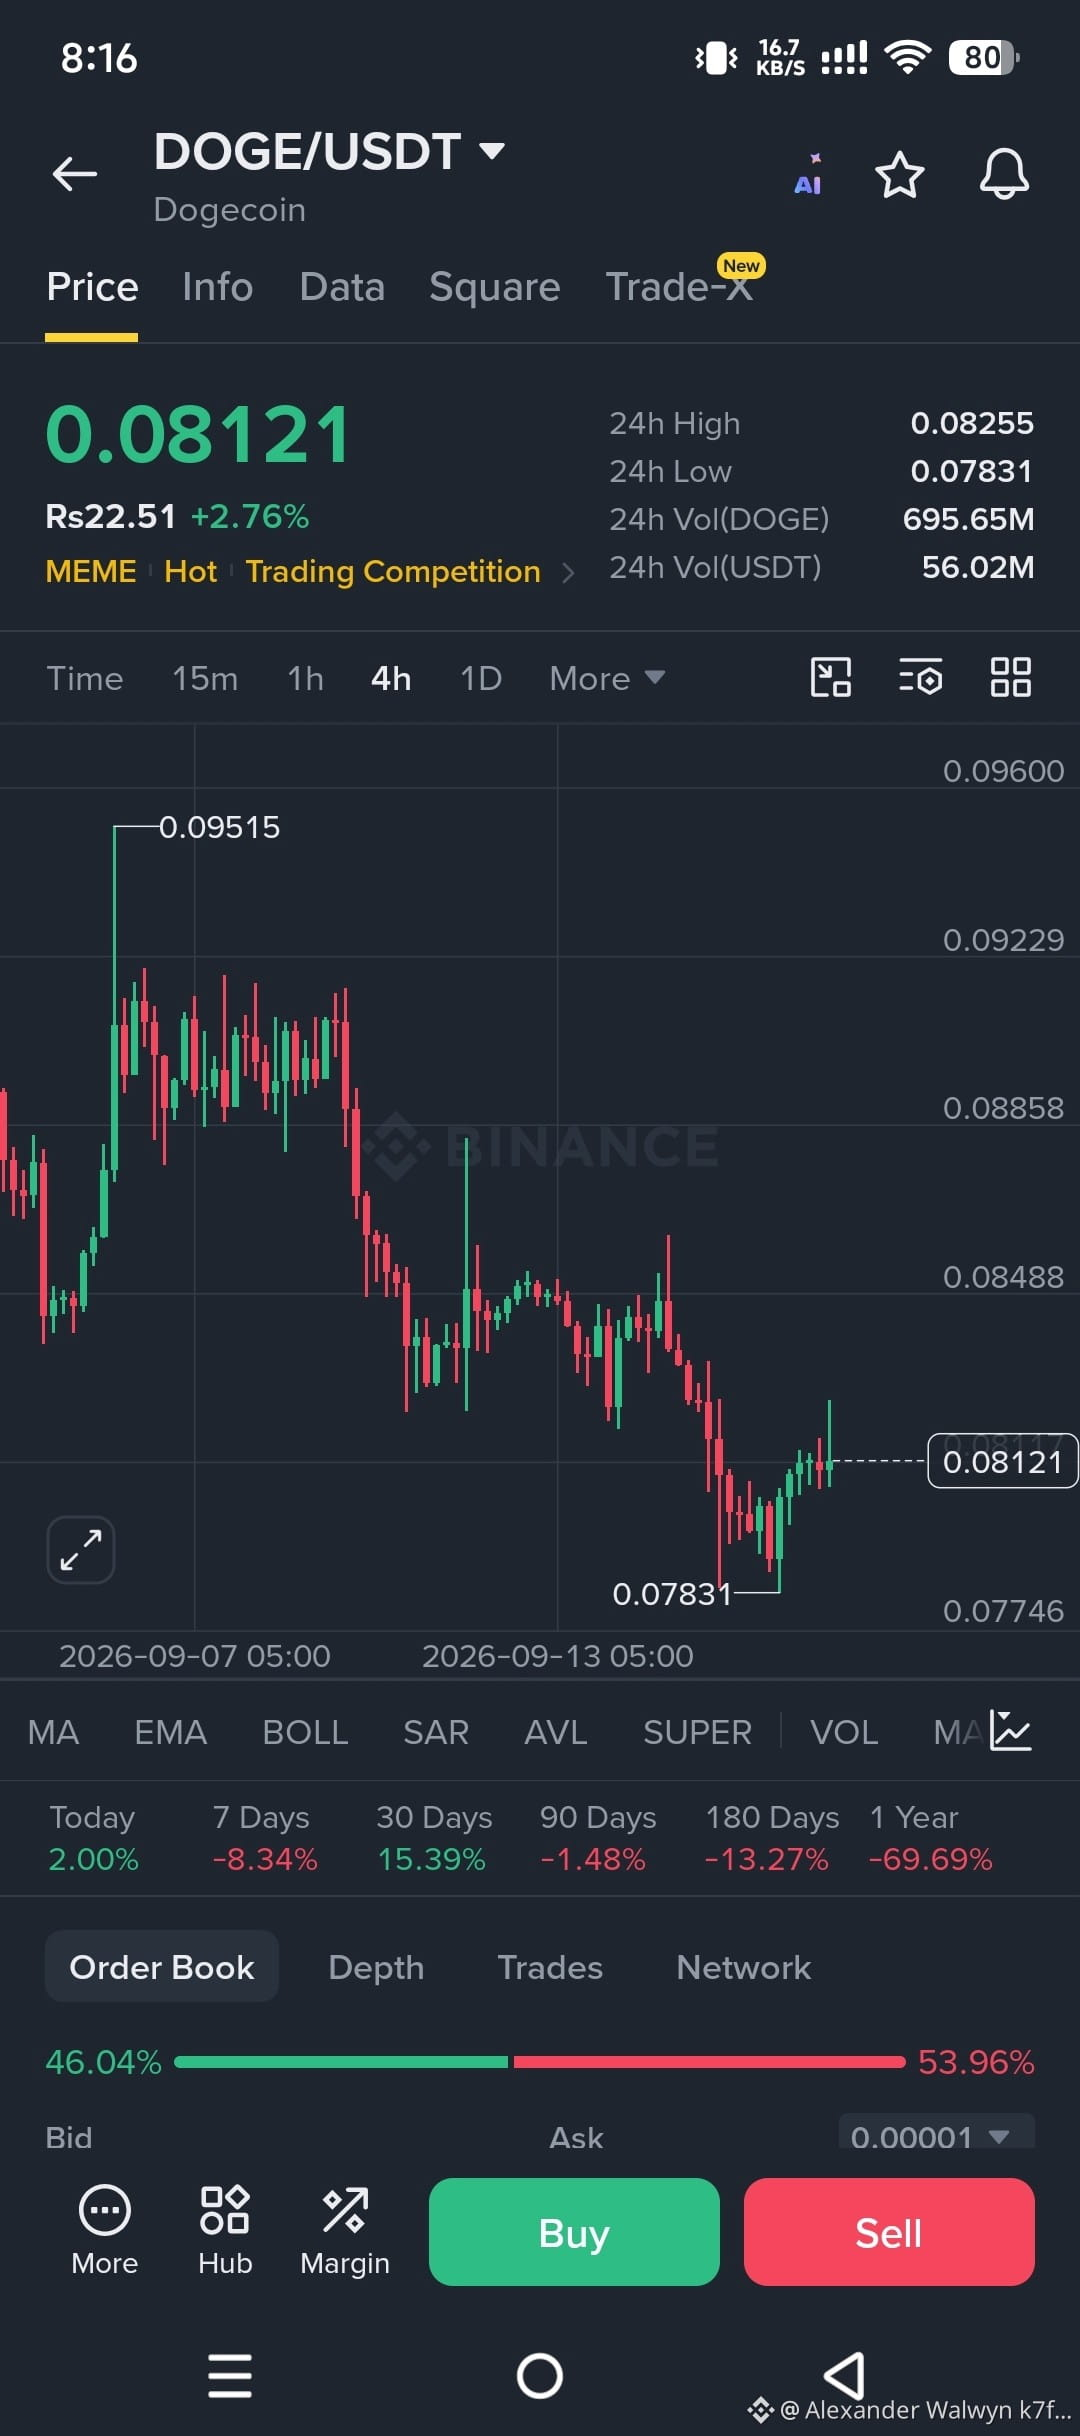
現在価格: $0.08121
24時間変化: +2.76%
24時間レンジ: $0.07831 – $0.08255
24時間出来高: 695.65M DOGE / $56M USDT
チャート概要
7月9日頃に $0.09515 付近で明確な高値をつけ、その後強い下落トレンドに入りました。安値は $0.07831 でつけ、現在は短期的なリバウンドを示しています。
一方で、4Hでは依然として切り下げ高値+切り下げ安値の構造のままです。つまり、この回復は現在、より大きな下落トレンドの中の「安心感(リリーフ)を伴う反発」に過ぎません。
重要レベル
サポート: $0.0783(直近の安値)→ 強い需要ゾーン
直近のレジスタンス: $0.0825–0.0840
主要レジスタンス: $0.0885–0.0920
$0.0840 を上抜けして終値が確認できれば、短期構造は改善します。このゾーンでの跳ね返り(リジェクション)が起きれば、$0.078–0.079 の再テストへ戻る可能性が高いです。
モメンタム&マーケット構造
7日間のパフォーマンスは依然として赤(–8.34%)
30日間は緑(+15.39%)→ 中期の買い手はまだ活動的
1年間は大きく赤(–69.69%)→ 長期保有者は深い含み損の状態
板(オーダーブック)はわずかに売り側に傾いています(46% ビッド / 54% アスク)。
想定シナリオ
強気シナリオ
$0.0795 を上回って推移しつつ、出来高を伴って $0.0840 をブレイク → 次の目標は $0.088–0.092
弱気シナリオ
$0.080 を維持できず、$0.0783 を割り込む → 下方向の流れが開き、$0.075–0.072 に向かう
まとめ
DOGE は $0.095 付近からの急落の後、短期的な回復局面にあります。現時点の反発は健全に見えますが、4Hの構造を強気に切り替えるには $0.0840 を奪還する必要があります。それまでは、レンジ/リリーフ・ラリーの環境が続く見込みです。
価格は感情ではなく、レベルで取引しよう。
DOGE/USDT 分析(Binance 4H チャート – 2026年9月17日)
現在価格: $0.08121
24時間変化: +2.76%
24時間レンジ: $0.07831 – $0.08255
24時間出来高: 695.65M DOGE / $56M USDT
チャート概要
7月9日頃に $0.09515 付近で明確な高値をつけ、その後強い下落トレンドに入りました。安値は $0.07831 でつけ、現在は短期的なリバウンドを示しています。
一方で、4Hでは依然として切り下げ高値+切り下げ安値の構造のままです。つまり、この回復は現在、より大きな下落トレンドの中の「安心感(リリーフ)を伴う反発」に過ぎません。
重要レベル
サポート: $0.0783(直近の安値)→ 強い需要ゾーン
直近のレジスタンス: $0.0825–0.0840
主要レジスタンス: $0.0885–0.0920
$0.0840 を上抜けして終値が確認できれば、短期構造は改善します。このゾーンでの跳ね返り(リジェクション)が起きれば、$0.078–0.079 の再テストへ戻る可能性が高いです。
モメンタム&マーケット構造
7日間のパフォーマンスは依然として赤(–8.34%)
30日間は緑(+15.39%)→ 中期の買い手はまだ活動的
1年間は大きく赤(–69.69%)→ 長期保有者は深い含み損の状態
板(オーダーブック)はわずかに売り側に傾いています(46% ビッド / 54% アスク)。
想定シナリオ
強気シナリオ
$0.0795 を上回って推移しつつ、出来高を伴って $0.0840 をブレイク → 次の目標は $0.088–0.092
弱気シナリオ
$0.080 を維持できず、$0.0783 を割り込む → 下方向の流れが開き、$0.075–0.072 に向かう
まとめ
DOGE は $0.095 付近からの急落の後、短期的な回復局面にあります。現時点の反発は健全に見えますが、4Hの構造を強気に切り替えるには $0.0840 を奪還する必要があります。それまでは、レンジ/リリーフ・ラリーの環境が続く見込みです。
価格は感情ではなく、レベルで取引しよう。
現在価格: $0.08121
24時間変化: +2.76%
24時間レンジ: $0.07831 – $0.08255
24時間出来高: 695.65M DOGE / $56M USDT
チャート概要
7月9日頃に $0.09515 付近で明確な高値をつけ、その後強い下落トレンドに入りました。安値は $0.07831 でつけ、現在は短期的なリバウンドを示しています。
一方で、4Hでは依然として切り下げ高値+切り下げ安値の構造のままです。つまり、この回復は現在、より大きな下落トレンドの中の「安心感(リリーフ)を伴う反発」に過ぎません。
重要レベル
サポート: $0.0783(直近の安値)→ 強い需要ゾーン
直近のレジスタンス: $0.0825–0.0840
主要レジスタンス: $0.0885–0.0920
$0.0840 を上抜けして終値が確認できれば、短期構造は改善します。このゾーンでの跳ね返り(リジェクション)が起きれば、$0.078–0.079 の再テストへ戻る可能性が高いです。
モメンタム&マーケット構造
7日間のパフォーマンスは依然として赤(–8.34%)
30日間は緑(+15.39%)→ 中期の買い手はまだ活動的
1年間は大きく赤(–69.69%)→ 長期保有者は深い含み損の状態
板(オーダーブック)はわずかに売り側に傾いています(46% ビッド / 54% アスク)。
想定シナリオ
強気シナリオ
$0.0795 を上回って推移しつつ、出来高を伴って $0.0840 をブレイク → 次の目標は $0.088–0.092
弱気シナリオ
$0.080 を維持できず、$0.0783 を割り込む → 下方向の流れが開き、$0.075–0.072 に向かう
まとめ
DOGE は $0.095 付近からの急落の後、短期的な回復局面にあります。現時点の反発は健全に見えますが、4Hの構造を強気に切り替えるには $0.0840 を奪還する必要があります。それまでは、レンジ/リリーフ・ラリーの環境が続く見込みです。
価格は感情ではなく、レベルで取引しよう。
25
SUI/USDT — 4時間テクニカル分析 📊
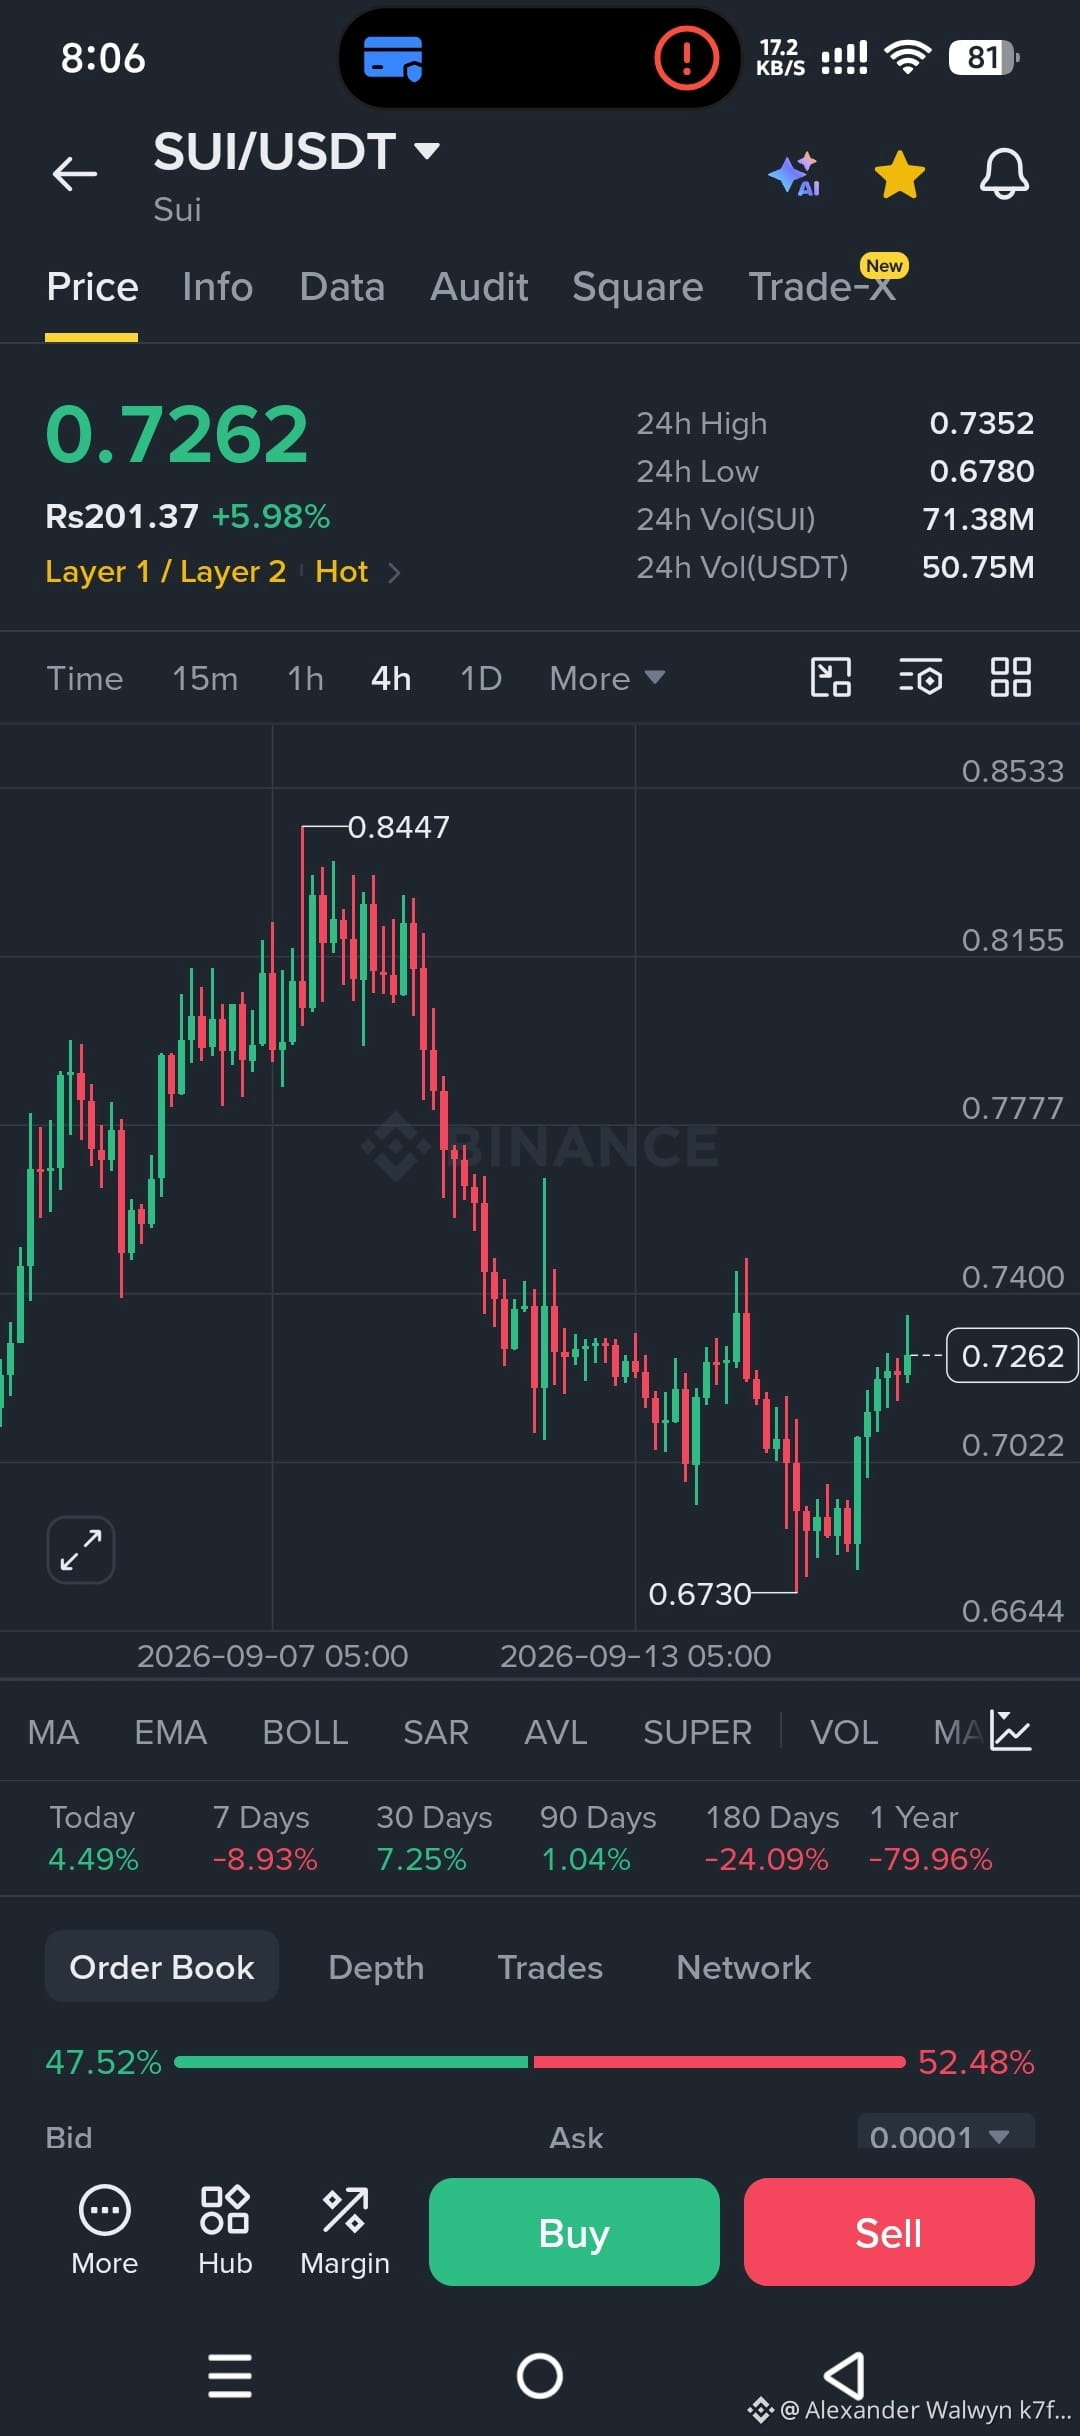
SUIは、$0.67〜$0.70のサポートエリアを防衛した後、強い短期のリバウンドを見せています。
🔹 現在の価格帯: 約$0.72
🔹 直近のレジスタンス: $0.735
🔹 主要なレジスタンス: $0.75
🔹 重要なサポート: $0.704
🔹 主要なサポート: $0.67〜$0.68
📈 強気シナリオ:
SUIが$0.75を上抜けして、強い出来高を伴って維持できるなら、次に注目すべき水準は約$0.77〜$0.80です。
📉 弱気シナリオ:
SUIが$0.735〜$0.75付近で跳ね返され、$0.704を失う場合、価格は$0.68〜$0.67の再テストを行う可能性があります。
⚠️ テクニカル見解:
4時間足の構造は回復を示していますが、より大きな確証が得られるのは、$0.75を明確に上抜けした後だけです。それまでは、SUIは確定したトレンド転換というより、回復/レンジ構造の範囲にとどまります。
🔥 注目すべき重要な水準: $0.75
※投資助言ではありません。常にリスク管理を行いましょう。
#SUI #SUIUSDT #Crypto #BinanceSquare #SuiNetwork #Altcoins #CryptoAnalysis #TechnicalAnalysis
SUI/USDT — 4時間テクニカル分析 📊
SUIは、$0.67〜$0.70のサポートエリアを防衛した後、強い短期のリバウンドを見せています。
🔹 現在の価格帯: 約$0.72
🔹 直近のレジスタンス: $0.735
🔹 主要なレジスタンス: $0.75
🔹 重要なサポート: $0.704
🔹 主要なサポート: $0.67〜$0.68
📈 強気シナリオ:
SUIが$0.75を上抜けして、強い出来高を伴って維持できるなら、次に注目すべき水準は約$0.77〜$0.80です。
📉 弱気シナリオ:
SUIが$0.735〜$0.75付近で跳ね返され、$0.704を失う場合、価格は$0.68〜$0.67の再テストを行う可能性があります。
⚠️ テクニカル見解:
4時間足の構造は回復を示していますが、より大きな確証が得られるのは、$0.75を明確に上抜けした後だけです。それまでは、SUIは確定したトレンド転換というより、回復/レンジ構造の範囲にとどまります。
🔥 注目すべき重要な水準: $0.75
※投資助言ではありません。常にリスク管理を行いましょう。
#SUI #SUIUSDT #Crypto #BinanceSquare #SuiNetwork #Altcoins #CryptoAnalysis #TechnicalAnalysis
SUIは、$0.67〜$0.70のサポートエリアを防衛した後、強い短期のリバウンドを見せています。
🔹 現在の価格帯: 約$0.72
🔹 直近のレジスタンス: $0.735
🔹 主要なレジスタンス: $0.75
🔹 重要なサポート: $0.704
🔹 主要なサポート: $0.67〜$0.68
📈 強気シナリオ:
SUIが$0.75を上抜けして、強い出来高を伴って維持できるなら、次に注目すべき水準は約$0.77〜$0.80です。
📉 弱気シナリオ:
SUIが$0.735〜$0.75付近で跳ね返され、$0.704を失う場合、価格は$0.68〜$0.67の再テストを行う可能性があります。
⚠️ テクニカル見解:
4時間足の構造は回復を示していますが、より大きな確証が得られるのは、$0.75を明確に上抜けした後だけです。それまでは、SUIは確定したトレンド転換というより、回復/レンジ構造の範囲にとどまります。
🔥 注目すべき重要な水準: $0.75
※投資助言ではありません。常にリスク管理を行いましょう。
#SUI #SUIUSDT #Crypto #BinanceSquare #SuiNetwork #Altcoins #CryptoAnalysis #TechnicalAnalysis
32
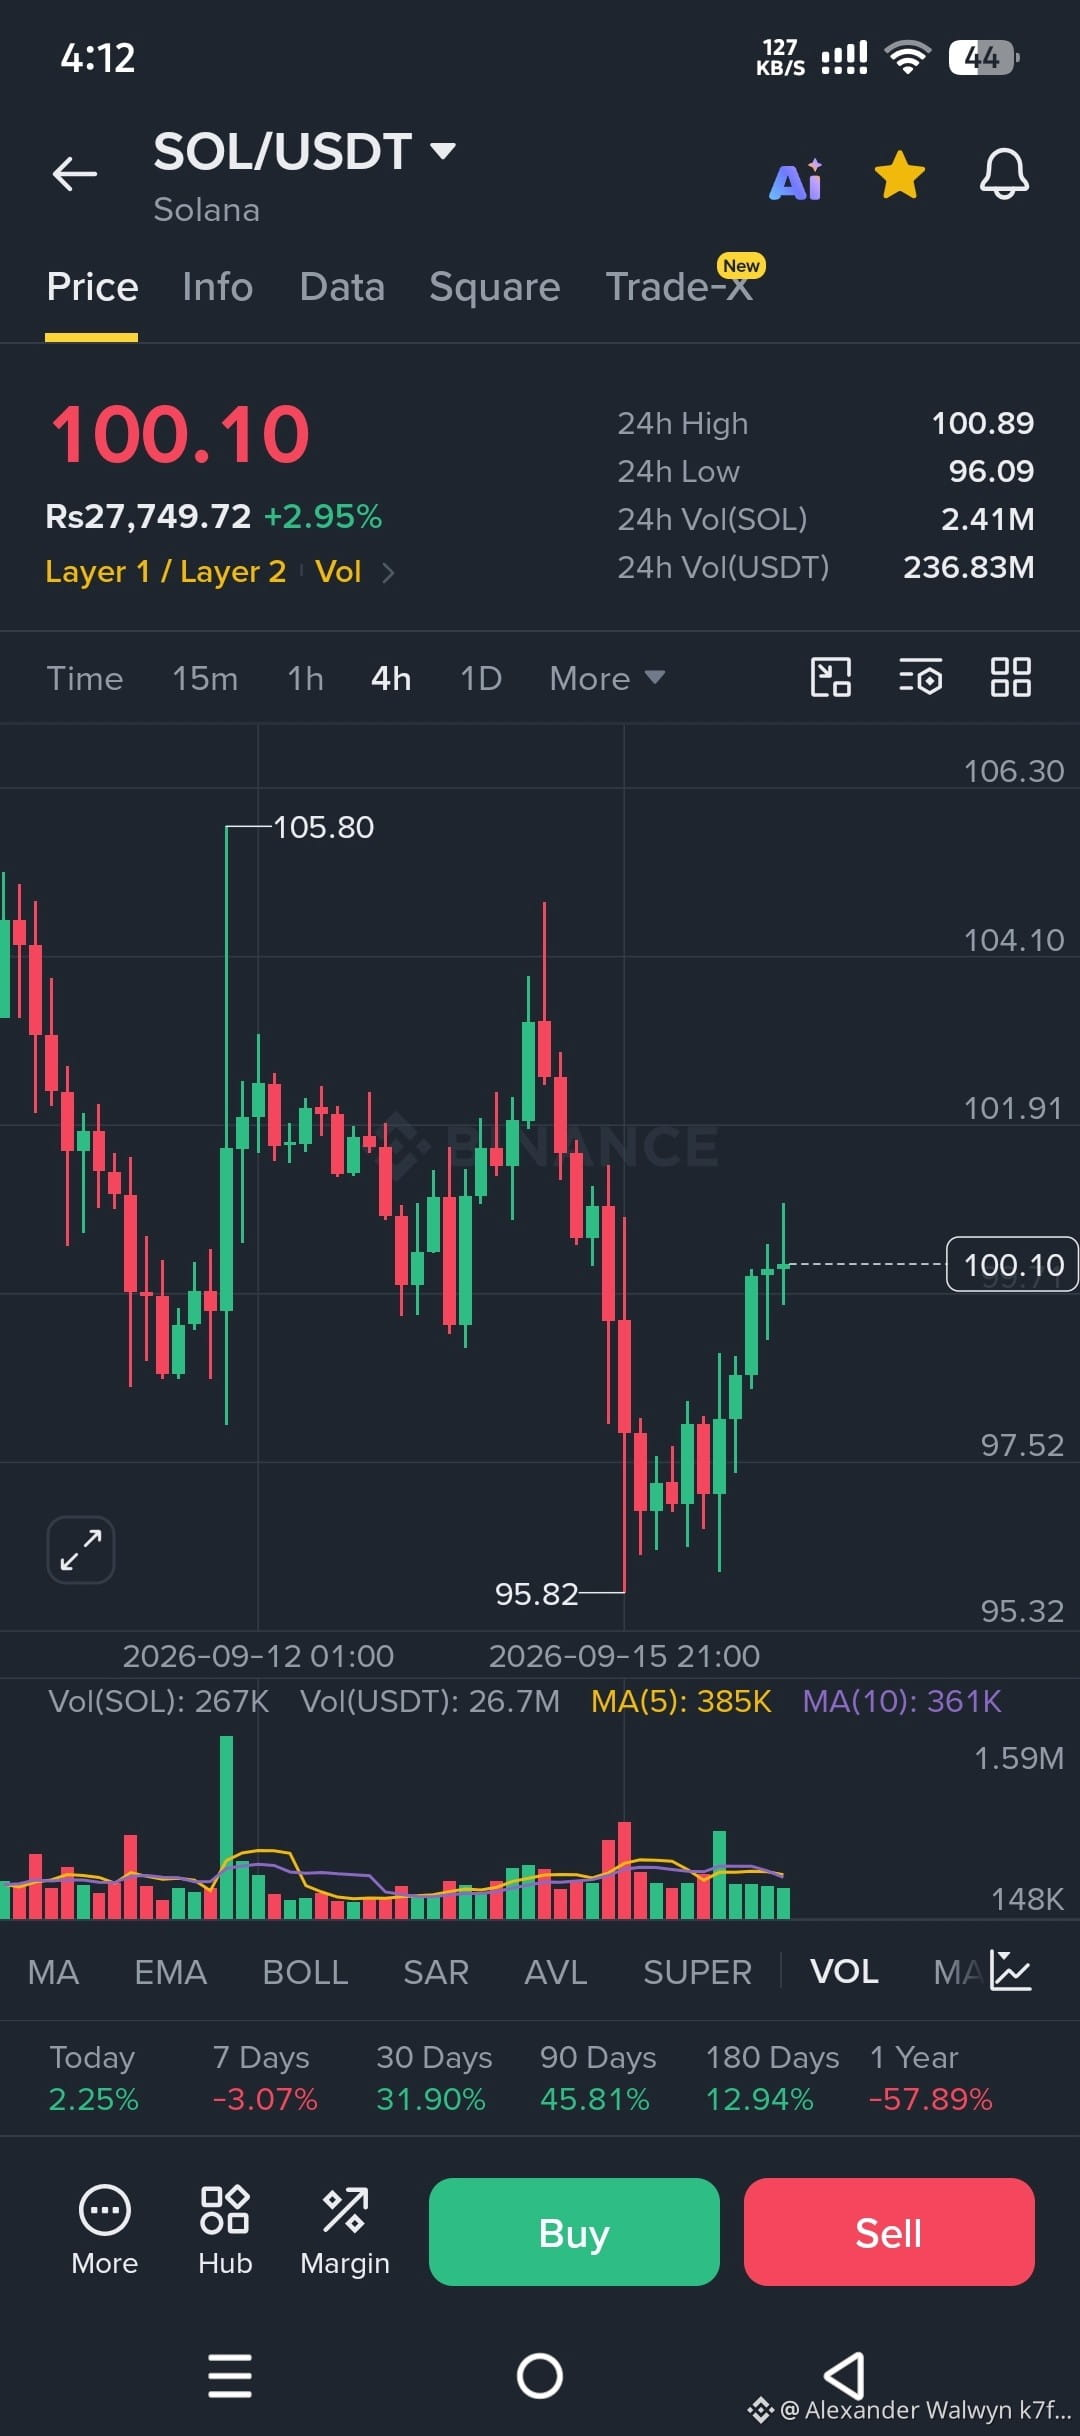
SOL/USDT | 市場分析
価格: 100.10 USDT(+2.95%)
24時間レンジ: 96.09 – 100.89
出来高: 2.41M SOL | 236.83M USDT
ソラナは95.80–96.10付近で強いサポートを確認し、反発して反騰。4Hチャートでは、より良い構造と高値更新(切り上げ)により、100レベルを取り戻しました。
主要レベル
レジスタンス: 100.90 – 101.50 | 103.50 | 105.80
サポート: 98.50 – 99.00 | 96.00 | 95.30
見通し
98.50を上回って維持できれば、短期の見通しは強気(ブル)を維持します。出来高を伴った101.50の明確なブレイクが起これば、103.50–105.80への道が開けます。価格が96.00を下回る場合は、より深い再テストが起こり得ます。
取引は慎重に。常にリスク管理を行ってください。
投資助言ではありません。DYOR。
#SOL #Solana #SOLUSDT #Crypto #Trading #Binance #TechnicalAnalysis #Altcoins
SOL/USDT | 市場分析
価格: 100.10 USDT(+2.95%)
24時間レンジ: 96.09 – 100.89
出来高: 2.41M SOL | 236.83M USDT
ソラナは95.80–96.10付近で強いサポートを確認し、反発して反騰。4Hチャートでは、より良い構造と高値更新(切り上げ)により、100レベルを取り戻しました。
主要レベル
レジスタンス: 100.90 – 101.50 | 103.50 | 105.80
サポート: 98.50 – 99.00 | 96.00 | 95.30
見通し
98.50を上回って維持できれば、短期の見通しは強気(ブル)を維持します。出来高を伴った101.50の明確なブレイクが起これば、103.50–105.80への道が開けます。価格が96.00を下回る場合は、より深い再テストが起こり得ます。
取引は慎重に。常にリスク管理を行ってください。
投資助言ではありません。DYOR。
#SOL #Solana #SOLUSDT #Crypto #Trading #Binance #TechnicalAnalysis #Altcoins
価格: 100.10 USDT(+2.95%)
24時間レンジ: 96.09 – 100.89
出来高: 2.41M SOL | 236.83M USDT
ソラナは95.80–96.10付近で強いサポートを確認し、反発して反騰。4Hチャートでは、より良い構造と高値更新(切り上げ)により、100レベルを取り戻しました。
主要レベル
レジスタンス: 100.90 – 101.50 | 103.50 | 105.80
サポート: 98.50 – 99.00 | 96.00 | 95.30
見通し
98.50を上回って維持できれば、短期の見通しは強気(ブル)を維持します。出来高を伴った101.50の明確なブレイクが起これば、103.50–105.80への道が開けます。価格が96.00を下回る場合は、より深い再テストが起こり得ます。
取引は慎重に。常にリスク管理を行ってください。
投資助言ではありません。DYOR。
#SOL #Solana #SOLUSDT #Crypto #Trading #Binance #TechnicalAnalysis #Altcoins
38
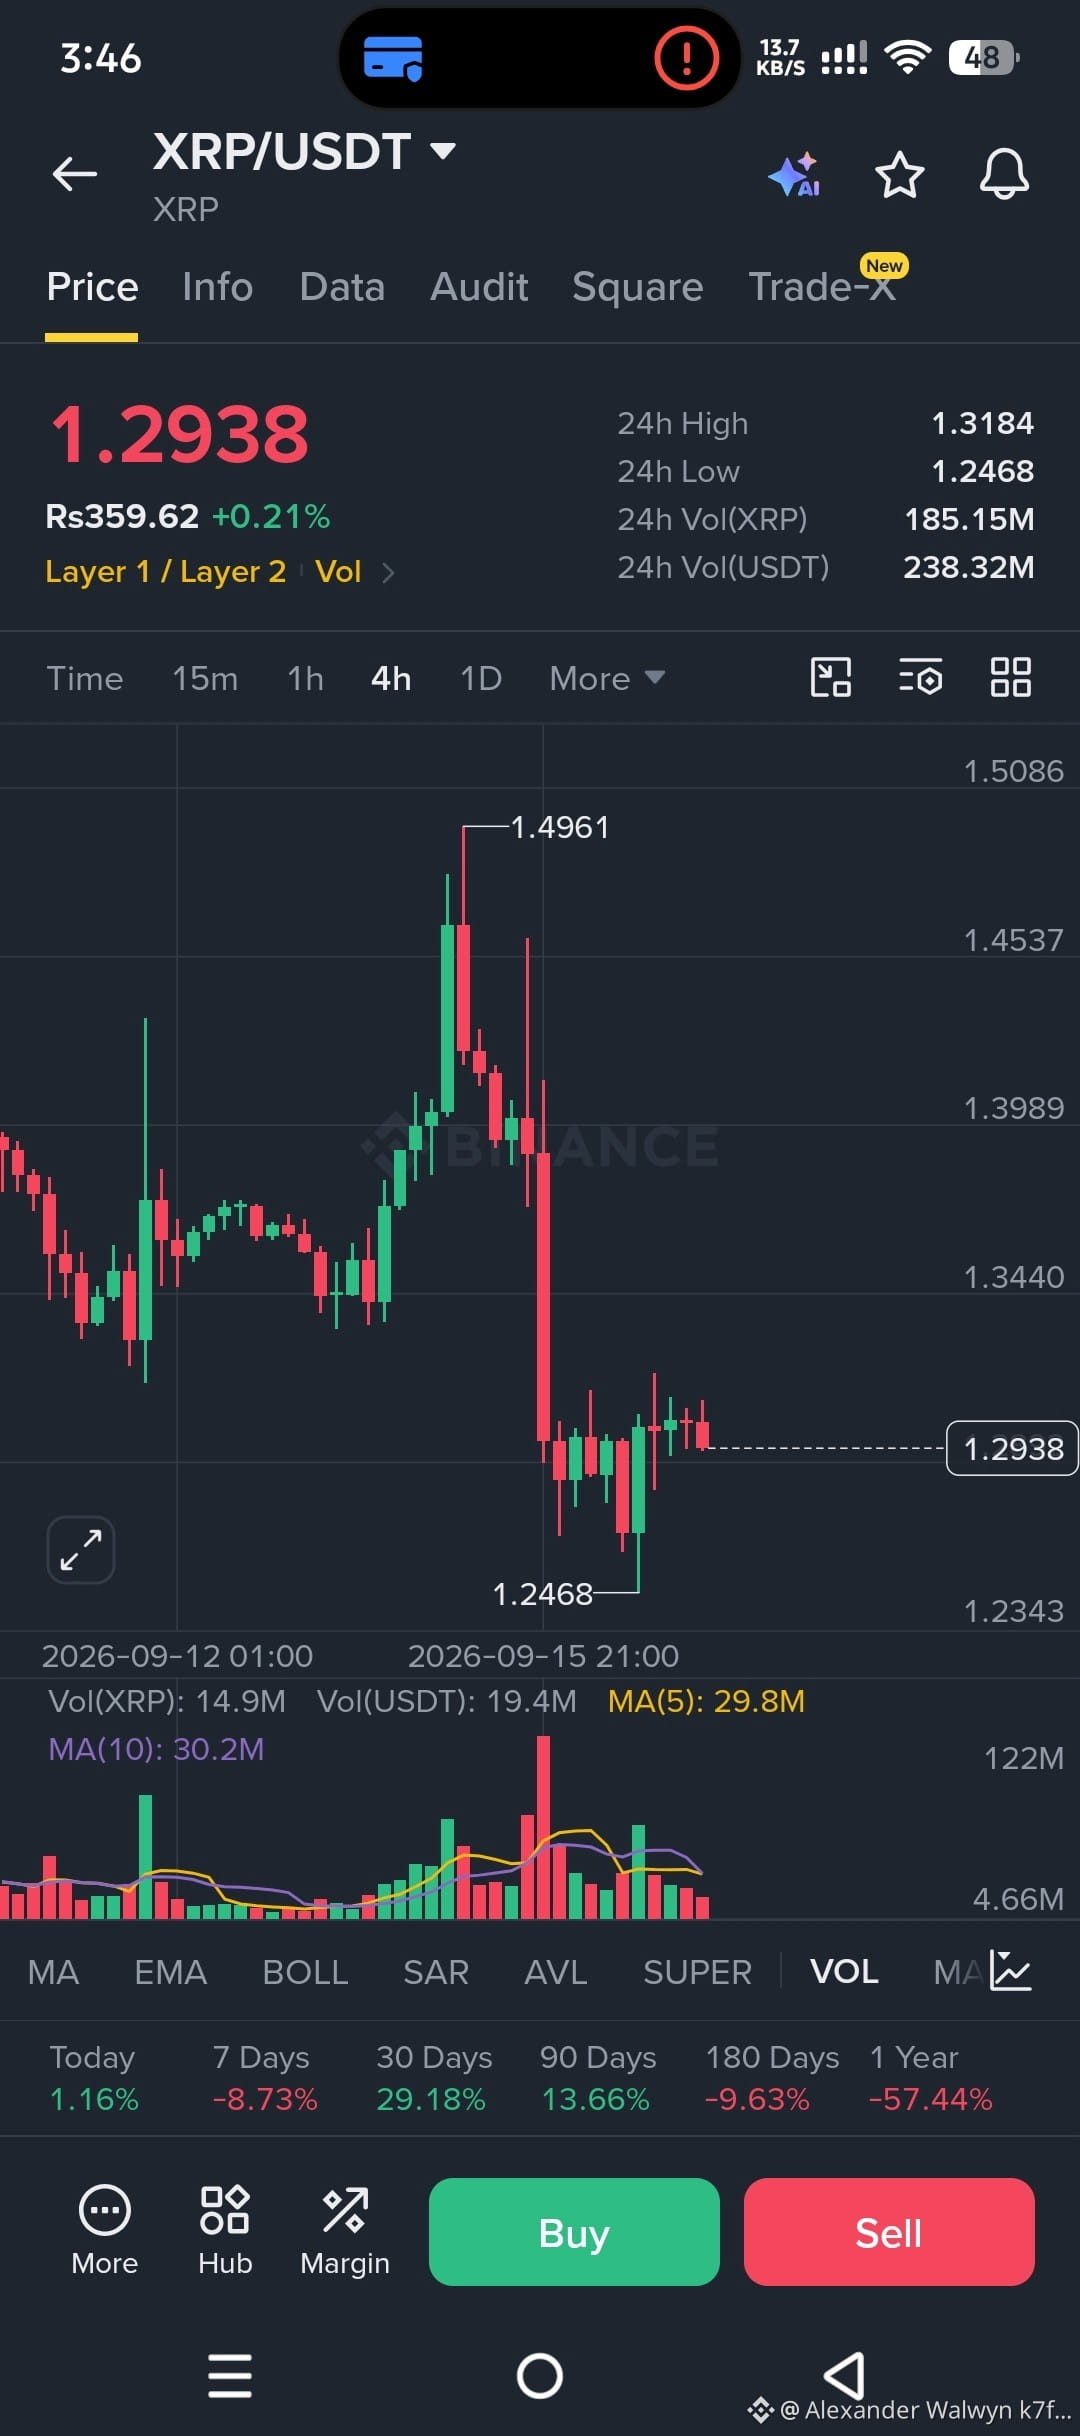
XRPアップデート — 今なにが起きている?
XRPは現在、1.2938ドルで取引されています。
チャートの主な水準:
24時間高値:1.3184ドル
24時間安値:1.2468ドル
1.4961の高値から強い反発
価格は1.2468の安値から大きく跳ね返った
急落の後、XRPは1.29付近で安定しようとしています。出来高はまだ十分で、直近の安値より上を維持しています。
これまでのパフォーマンス:
今日:+1.16%
7日:-8.73%
30日:+29.18%
大きな下落は、いわゆる“ふるい落とし”のように見えます。1.32〜1.35ドルを取り戻して維持できれば、モメンタムが戻る可能性があります。1.25ドルを下回ると次の警戒ゾーンになります。
あなたはどう思いますか——ここが底でしょうか?それとも、次の下落の前の一時停止にすぎないのでしょうか?
#XRP #Ripple #Crypto #XRPUSDT
XRPアップデート — 今なにが起きている?
XRPは現在、1.2938ドルで取引されています。
チャートの主な水準:
24時間高値:1.3184ドル
24時間安値:1.2468ドル
1.4961の高値から強い反発
価格は1.2468の安値から大きく跳ね返った
急落の後、XRPは1.29付近で安定しようとしています。出来高はまだ十分で、直近の安値より上を維持しています。
これまでのパフォーマンス:
今日:+1.16%
7日:-8.73%
30日:+29.18%
大きな下落は、いわゆる“ふるい落とし”のように見えます。1.32〜1.35ドルを取り戻して維持できれば、モメンタムが戻る可能性があります。1.25ドルを下回ると次の警戒ゾーンになります。
あなたはどう思いますか——ここが底でしょうか?それとも、次の下落の前の一時停止にすぎないのでしょうか?
#XRP #Ripple #Crypto #XRPUSDT
XRPは現在、1.2938ドルで取引されています。
チャートの主な水準:
24時間高値:1.3184ドル
24時間安値:1.2468ドル
1.4961の高値から強い反発
価格は1.2468の安値から大きく跳ね返った
急落の後、XRPは1.29付近で安定しようとしています。出来高はまだ十分で、直近の安値より上を維持しています。
これまでのパフォーマンス:
今日:+1.16%
7日:-8.73%
30日:+29.18%
大きな下落は、いわゆる“ふるい落とし”のように見えます。1.32〜1.35ドルを取り戻して維持できれば、モメンタムが戻る可能性があります。1.25ドルを下回ると次の警戒ゾーンになります。
あなたはどう思いますか——ここが底でしょうか?それとも、次の下落の前の一時停止にすぎないのでしょうか?
#XRP #Ripple #Crypto #XRPUSDT
67
翻訳参照
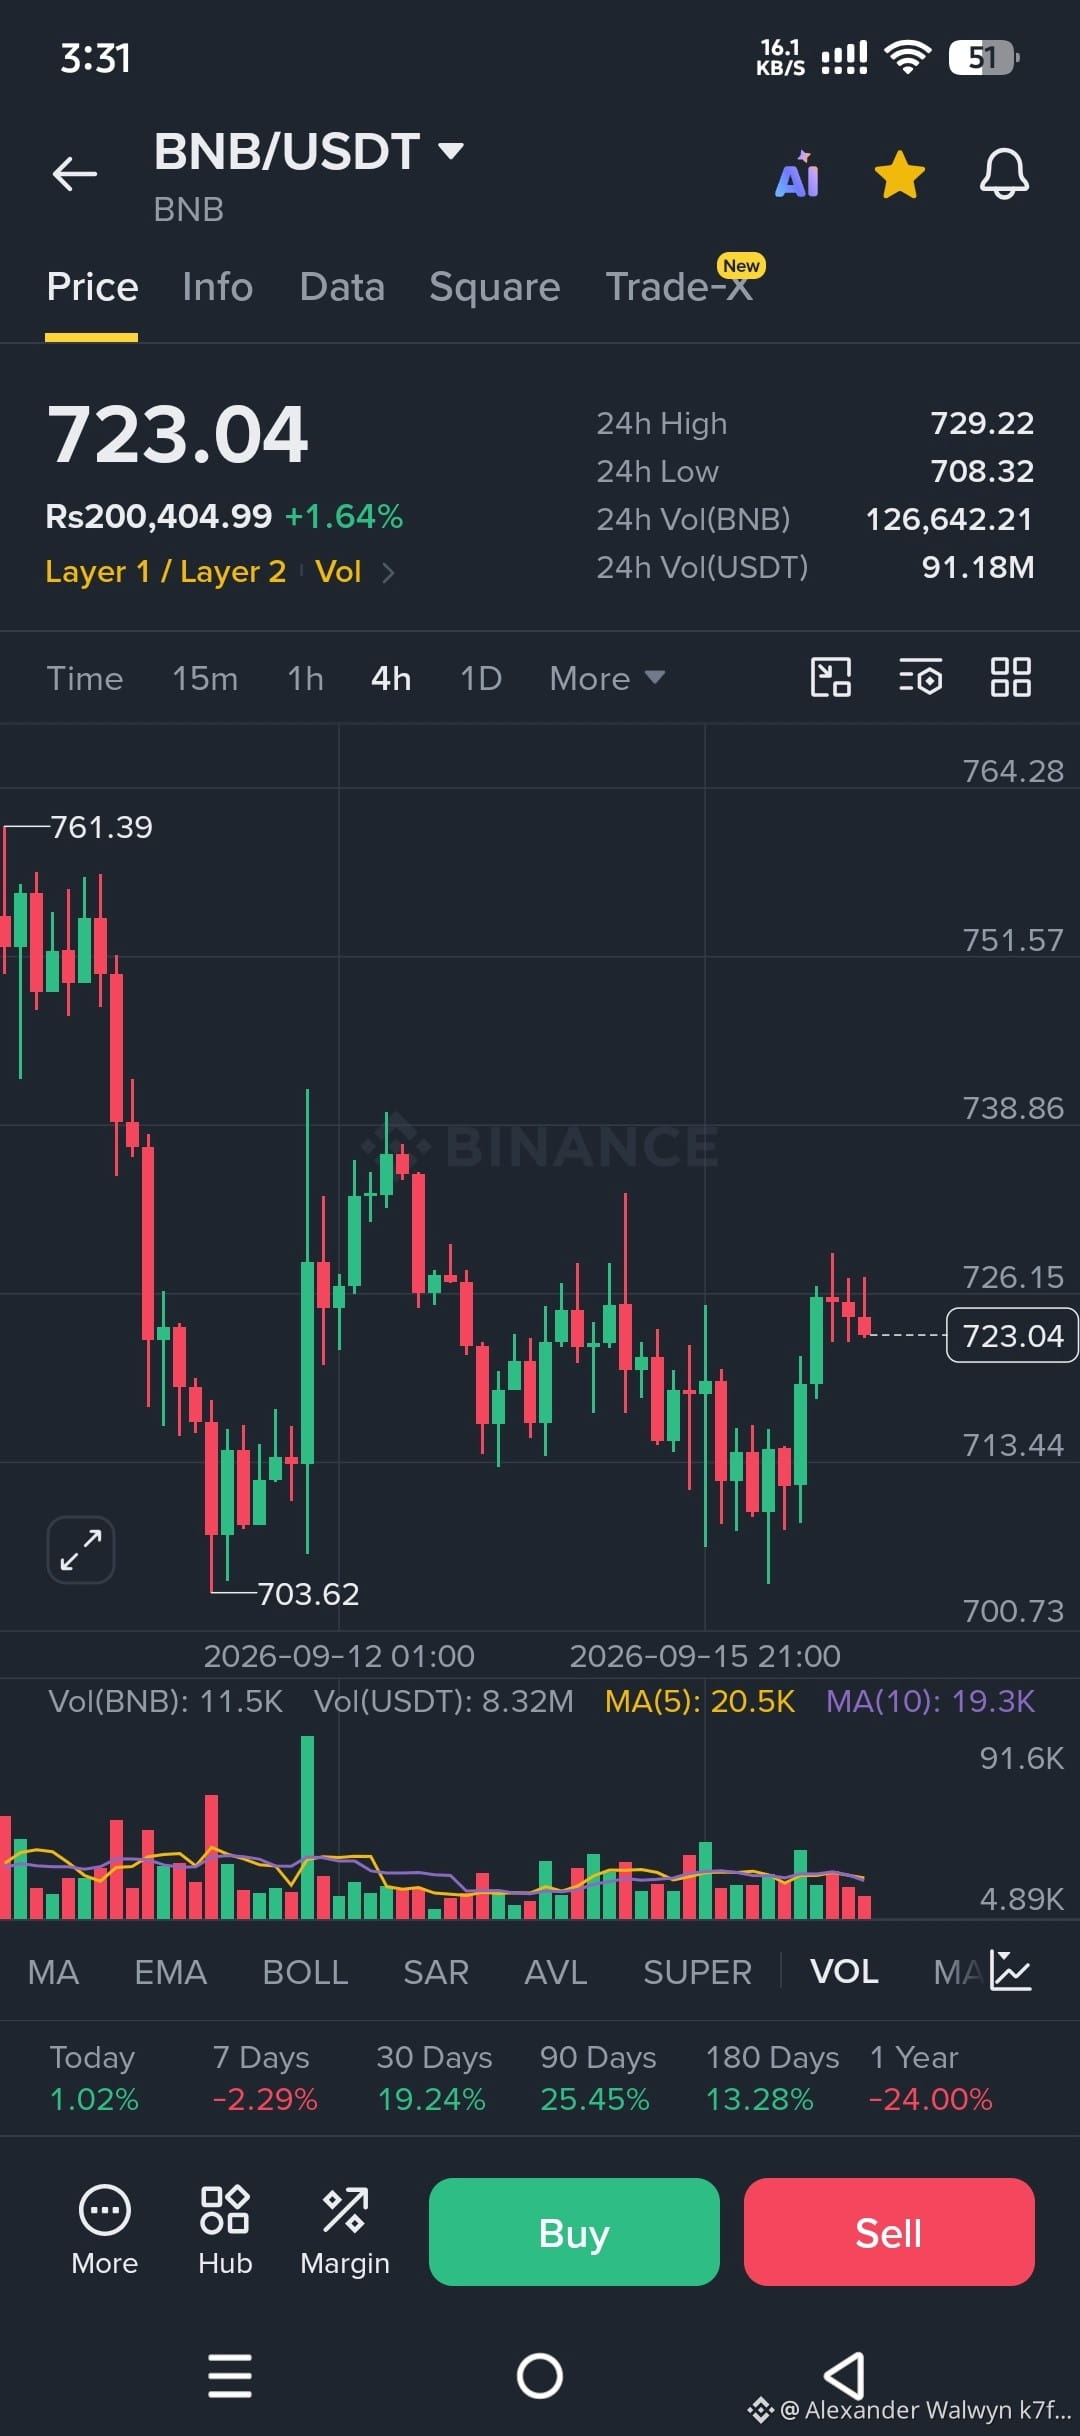
🔥 BNB/USDT 4H Chart Breakdown – The Dip That Built Strength
Look closely at this chart.
BNB just delivered one of the cleanest “shakeout + recovery” setups we’ve seen in weeks.
### What the chart is screaming:
From the peak near **761**, BNB went into a sharp, high-volume sell-off, slicing all the way down to **703.62**. That was pure panic. Weak hands got flushed. Liquidity was grabbed.
And then?
Buyers stepped in hard.
Price bounced, reclaimed key levels, and is now sitting at **723.04** — up **+1.64%** in the last 24 hours with a solid 24h high of **729.22** and low of **708.32**.
### Key Technical Observations (4H):
- Strong demand zone established around **703–710**
- Price is currently holding above the recent higher low structure
- Volume is cooling after the big flush — classic sign that selling pressure is exhausting
- Short-term moving averages on volume are starting to flatten (MA5 at 20.5K / MA10 at 19.3K)
This is not random chop. This is a **controlled recovery** after a liquidity hunt.
### Bigger Picture:
BNB has been ranging and absorbing for days. The violent dump to 703 was the final stop-hunt before potential continuation. As long as price holds above **710–715**, the structure remains constructive.
A clean break and hold above **730–735** opens the door for a move back toward **750+**.
Lose **708** with volume and we could retest the lows.
### Sentiment Check:
While most people are still traumatized by the drop from 761, smart money is quietly accumulating the discount.
This is the kind of chart that looks ugly in the middle… and beautiful in hindsight.
---
**What’s your bias from here?**
Are you buying this dip or waiting for a clearer breakout confirmation?
Drop your levels below. Let’s see who’s actually watching structure vs. who’s just reacting to red candles.
#BNB #Binance #CryptoAnalysis #BNBUSDT #TechnicalAnalysis #CryptoTrading
🔥 BNB/USDT 4H Chart Breakdown – The Dip That Built Strength
Look closely at this chart.
BNB just delivered one of the cleanest “shakeout + recovery” setups we’ve seen in weeks.
### What the chart is screaming:
From the peak near **761**, BNB went into a sharp, high-volume sell-off, slicing all the way down to **703.62**. That was pure panic. Weak hands got flushed. Liquidity was grabbed.
And then?
Buyers stepped in hard.
Price bounced, reclaimed key levels, and is now sitting at **723.04** — up **+1.64%** in the last 24 hours with a solid 24h high of **729.22** and low of **708.32**.
### Key Technical Observations (4H):
- Strong demand zone established around **703–710**
- Price is currently holding above the recent higher low structure
- Volume is cooling after the big flush — classic sign that selling pressure is exhausting
- Short-term moving averages on volume are starting to flatten (MA5 at 20.5K / MA10 at 19.3K)
This is not random chop. This is a **controlled recovery** after a liquidity hunt.
### Bigger Picture:
BNB has been ranging and absorbing for days. The violent dump to 703 was the final stop-hunt before potential continuation. As long as price holds above **710–715**, the structure remains constructive.
A clean break and hold above **730–735** opens the door for a move back toward **750+**.
Lose **708** with volume and we could retest the lows.
### Sentiment Check:
While most people are still traumatized by the drop from 761, smart money is quietly accumulating the discount.
This is the kind of chart that looks ugly in the middle… and beautiful in hindsight.
---
**What’s your bias from here?**
Are you buying this dip or waiting for a clearer breakout confirmation?
Drop your levels below. Let’s see who’s actually watching structure vs. who’s just reacting to red candles.
#BNB #Binance #CryptoAnalysis #BNBUSDT #TechnicalAnalysis #CryptoTrading
Look closely at this chart.
BNB just delivered one of the cleanest “shakeout + recovery” setups we’ve seen in weeks.
### What the chart is screaming:
From the peak near **761**, BNB went into a sharp, high-volume sell-off, slicing all the way down to **703.62**. That was pure panic. Weak hands got flushed. Liquidity was grabbed.
And then?
Buyers stepped in hard.
Price bounced, reclaimed key levels, and is now sitting at **723.04** — up **+1.64%** in the last 24 hours with a solid 24h high of **729.22** and low of **708.32**.
### Key Technical Observations (4H):
- Strong demand zone established around **703–710**
- Price is currently holding above the recent higher low structure
- Volume is cooling after the big flush — classic sign that selling pressure is exhausting
- Short-term moving averages on volume are starting to flatten (MA5 at 20.5K / MA10 at 19.3K)
This is not random chop. This is a **controlled recovery** after a liquidity hunt.
### Bigger Picture:
BNB has been ranging and absorbing for days. The violent dump to 703 was the final stop-hunt before potential continuation. As long as price holds above **710–715**, the structure remains constructive.
A clean break and hold above **730–735** opens the door for a move back toward **750+**.
Lose **708** with volume and we could retest the lows.
### Sentiment Check:
While most people are still traumatized by the drop from 761, smart money is quietly accumulating the discount.
This is the kind of chart that looks ugly in the middle… and beautiful in hindsight.
---
**What’s your bias from here?**
Are you buying this dip or waiting for a clearer breakout confirmation?
Drop your levels below. Let’s see who’s actually watching structure vs. who’s just reacting to red candles.
#BNB #Binance #CryptoAnalysis #BNBUSDT #TechnicalAnalysis #CryptoTrading
63
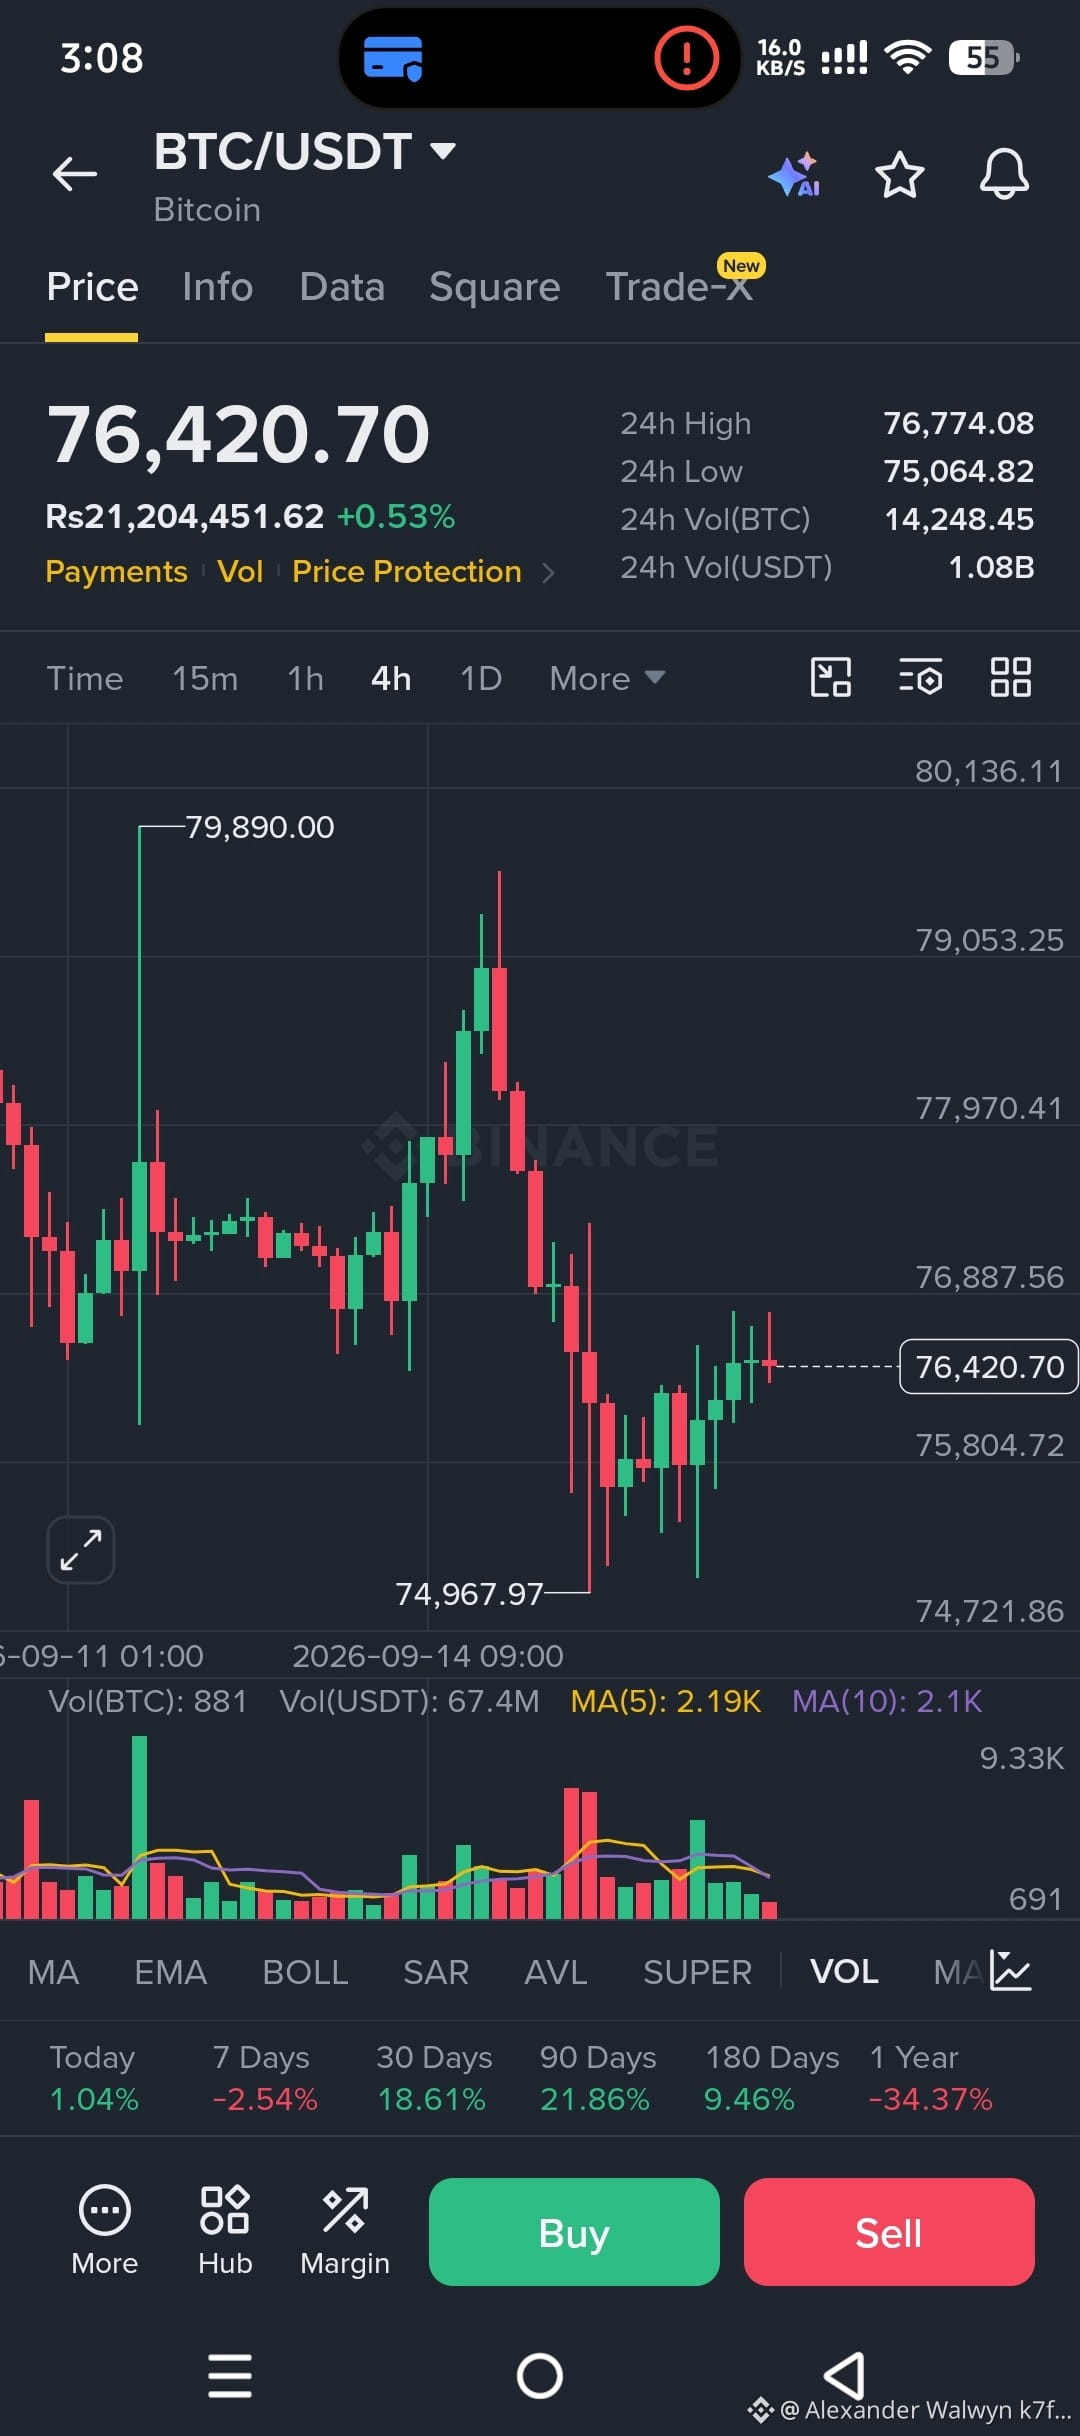
BTC/USDT 詳細分析 📊
現在価格: $76,420.70 | +0.53%
24時間 高値: $76,774
24時間 安値: $75,064
4H チャート概要:
ビットコインは$79,890のゾーンから鋭く拒否され、大きく下落して$74,967に明確な安値を形成しました。それ以来、価格は回復し、現在は$76,400付近で推移しています。
注目すべき重要レベル:
• 強いサポート: $75,800 – $76,000
• 次のサポート: $74,900 – $75,000
• 直近のレジスタンス: $76,880
• 主要レジスタンス: $77,970 – $79,000
出来高分析:
大きな売りが出た後、出来高は落ち着き始めています。これは、売り圧が弱まっており、下値の土台が形成されつつある可能性を示すため、しばしば健全なサインです。
市場構造:
4H全体の構造は、直近の下落後もまだ調整(コレクティブ)に見えます。価格が$75,800を上回って維持される限り、強気派にはより高い水準へ押し上げるチャンスがあります。出来高を伴う、$76,880を明確に上抜けて終値がつくことで、$77,970の再テスト、そして最終的に$79kゾーンへの道が開ける可能性があります。
下方向では、$75,800が崩れる場合、$74,900の安値に向けたもう一段の下落が見込まれます。
パフォーマンス概要:
• 今日: +1.04%
• 7日: -2.54%
• 30日: +18.61%
• 90日: +21.86%
短期見通し:
$75,800を上回っている限り、ニュートラル〜やや強気。方向性の確認を待っています。
ここからのBTCについて、あなたはどう見ていますか?ロングを狙っていますか、それともまだ待っていますか?
#BTC #Bitcoin #BTCUSDT #CryptoAnalysis
BTC/USDT 詳細分析 📊
現在価格: $76,420.70 | +0.53%
24時間 高値: $76,774
24時間 安値: $75,064
4H チャート概要:
ビットコインは$79,890のゾーンから鋭く拒否され、大きく下落して$74,967に明確な安値を形成しました。それ以来、価格は回復し、現在は$76,400付近で推移しています。
注目すべき重要レベル:
• 強いサポート: $75,800 – $76,000
• 次のサポート: $74,900 – $75,000
• 直近のレジスタンス: $76,880
• 主要レジスタンス: $77,970 – $79,000
出来高分析:
大きな売りが出た後、出来高は落ち着き始めています。これは、売り圧が弱まっており、下値の土台が形成されつつある可能性を示すため、しばしば健全なサインです。
市場構造:
4H全体の構造は、直近の下落後もまだ調整(コレクティブ)に見えます。価格が$75,800を上回って維持される限り、強気派にはより高い水準へ押し上げるチャンスがあります。出来高を伴う、$76,880を明確に上抜けて終値がつくことで、$77,970の再テスト、そして最終的に$79kゾーンへの道が開ける可能性があります。
下方向では、$75,800が崩れる場合、$74,900の安値に向けたもう一段の下落が見込まれます。
パフォーマンス概要:
• 今日: +1.04%
• 7日: -2.54%
• 30日: +18.61%
• 90日: +21.86%
短期見通し:
$75,800を上回っている限り、ニュートラル〜やや強気。方向性の確認を待っています。
ここからのBTCについて、あなたはどう見ていますか?ロングを狙っていますか、それともまだ待っていますか?
#BTC #Bitcoin #BTCUSDT #CryptoAnalysis
現在価格: $76,420.70 | +0.53%
24時間 高値: $76,774
24時間 安値: $75,064
4H チャート概要:
ビットコインは$79,890のゾーンから鋭く拒否され、大きく下落して$74,967に明確な安値を形成しました。それ以来、価格は回復し、現在は$76,400付近で推移しています。
注目すべき重要レベル:
• 強いサポート: $75,800 – $76,000
• 次のサポート: $74,900 – $75,000
• 直近のレジスタンス: $76,880
• 主要レジスタンス: $77,970 – $79,000
出来高分析:
大きな売りが出た後、出来高は落ち着き始めています。これは、売り圧が弱まっており、下値の土台が形成されつつある可能性を示すため、しばしば健全なサインです。
市場構造:
4H全体の構造は、直近の下落後もまだ調整(コレクティブ)に見えます。価格が$75,800を上回って維持される限り、強気派にはより高い水準へ押し上げるチャンスがあります。出来高を伴う、$76,880を明確に上抜けて終値がつくことで、$77,970の再テスト、そして最終的に$79kゾーンへの道が開ける可能性があります。
下方向では、$75,800が崩れる場合、$74,900の安値に向けたもう一段の下落が見込まれます。
パフォーマンス概要:
• 今日: +1.04%
• 7日: -2.54%
• 30日: +18.61%
• 90日: +21.86%
短期見通し:
$75,800を上回っている限り、ニュートラル〜やや強気。方向性の確認を待っています。
ここからのBTCについて、あなたはどう見ていますか?ロングを狙っていますか、それともまだ待っていますか?
#BTC #Bitcoin #BTCUSDT #CryptoAnalysis
72
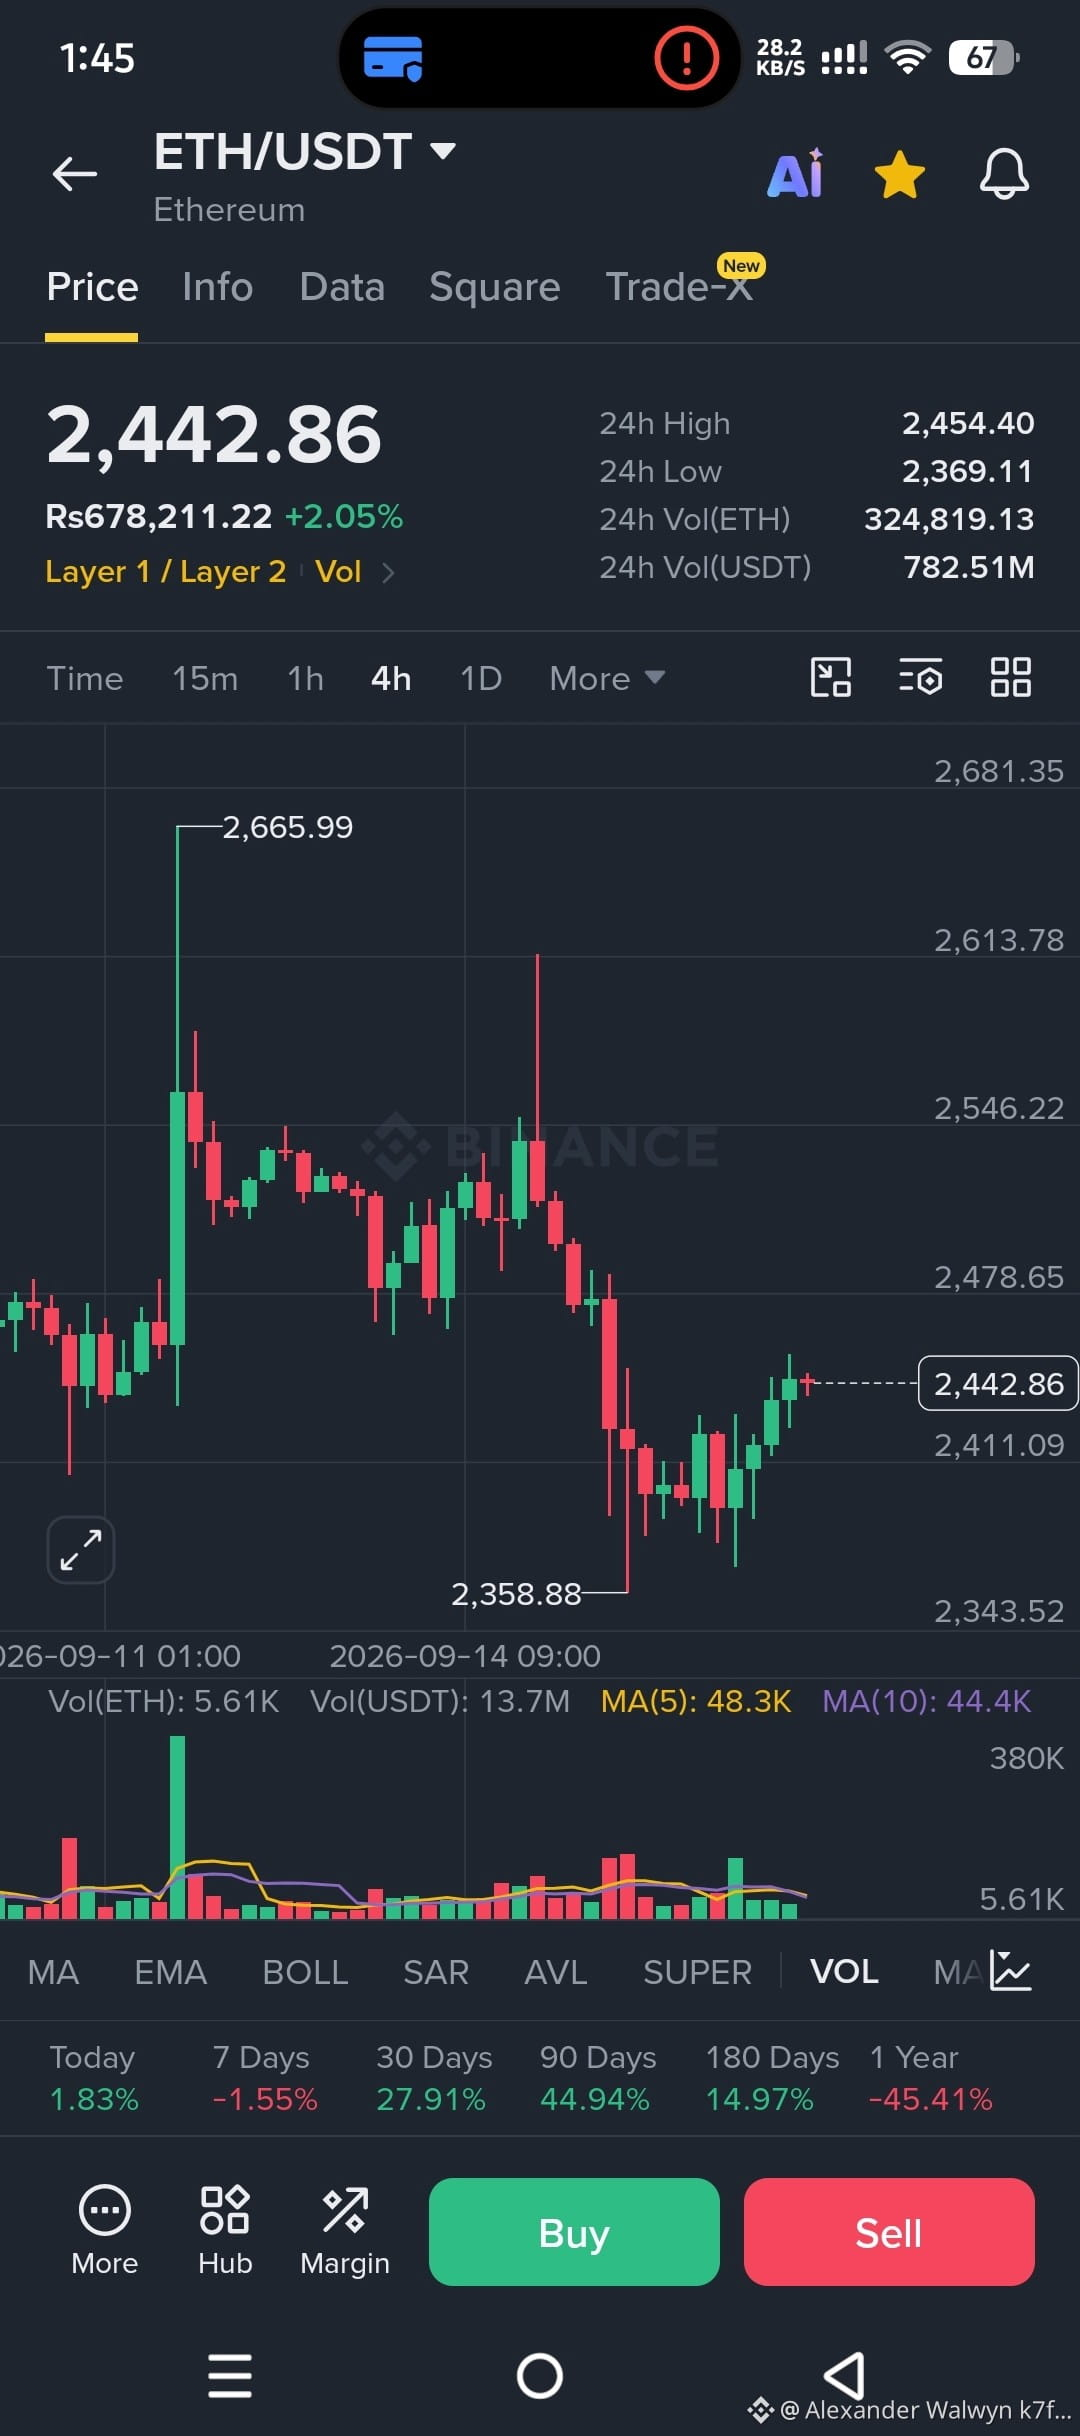
ETH/USDT分析 | 4Hチャート
現在価格: $2,442.86 (+2.05%)
24Hのレンジ: $2,369 – $2,454
チャートからの重要レベル:
直近の高値: $2,665.99
最近の安値: $2,358.88
直近のレジスタンス: $2,478 – $2,546
強いサポート: $2,358 – $2,370
テクニカル見解: $2,665までの急激なスパイクの後、ETHは強いリジェクトを受け、調整局面に入りました。売りが$2,358まで押し下げましたが、現在は価格が安定し、より高い安値を形成しています。現在の構造は、$2,370〜$2,400ゾーンを買い手が守ることで短期的な回復を示唆しています。
出来高は中程度です。ETHが$2,370を上回っている限り、$2,480〜$2,550に向かう動きが可能です。$2,358を下抜けると、$2,300〜$2,280方向への道が開けます。
グローバル市場の文脈:
ビットコインの優位性は依然として高く、アルトコインに圧力がかかっています。
米国市場はまちまちで、リスク選好はまだ慎重です。
イーサリアム・エコシステム活動(レイヤー2+ステーキング)は引き続き強く、土台となる支えになっています。
マクロ: 今週の暗号資産の方向性を決める主な要因は、FRBの利上げ見通しとUSDの強さです。
バイアス: $2,370が維持されている限り、4Hでは中立〜やや強気です。$2,480の水準は注意深く見てください。出来高を伴う明確なブレイクが次の上昇局面を引き起こす可能性があります。
ここでのETHはどう見ていますか?ロングですか、それともより良いエントリーを待ちますか?
#ETH #Ethereum #Binance #CryptoAnalysis #ETHUSDT
ETH/USDT分析 | 4Hチャート
現在価格: $2,442.86 (+2.05%)
24Hのレンジ: $2,369 – $2,454
チャートからの重要レベル:
直近の高値: $2,665.99
最近の安値: $2,358.88
直近のレジスタンス: $2,478 – $2,546
強いサポート: $2,358 – $2,370
テクニカル見解: $2,665までの急激なスパイクの後、ETHは強いリジェクトを受け、調整局面に入りました。売りが$2,358まで押し下げましたが、現在は価格が安定し、より高い安値を形成しています。現在の構造は、$2,370〜$2,400ゾーンを買い手が守ることで短期的な回復を示唆しています。
出来高は中程度です。ETHが$2,370を上回っている限り、$2,480〜$2,550に向かう動きが可能です。$2,358を下抜けると、$2,300〜$2,280方向への道が開けます。
グローバル市場の文脈:
ビットコインの優位性は依然として高く、アルトコインに圧力がかかっています。
米国市場はまちまちで、リスク選好はまだ慎重です。
イーサリアム・エコシステム活動(レイヤー2+ステーキング)は引き続き強く、土台となる支えになっています。
マクロ: 今週の暗号資産の方向性を決める主な要因は、FRBの利上げ見通しとUSDの強さです。
バイアス: $2,370が維持されている限り、4Hでは中立〜やや強気です。$2,480の水準は注意深く見てください。出来高を伴う明確なブレイクが次の上昇局面を引き起こす可能性があります。
ここでのETHはどう見ていますか?ロングですか、それともより良いエントリーを待ちますか?
#ETH #Ethereum #Binance #CryptoAnalysis #ETHUSDT
現在価格: $2,442.86 (+2.05%)
24Hのレンジ: $2,369 – $2,454
チャートからの重要レベル:
直近の高値: $2,665.99
最近の安値: $2,358.88
直近のレジスタンス: $2,478 – $2,546
強いサポート: $2,358 – $2,370
テクニカル見解: $2,665までの急激なスパイクの後、ETHは強いリジェクトを受け、調整局面に入りました。売りが$2,358まで押し下げましたが、現在は価格が安定し、より高い安値を形成しています。現在の構造は、$2,370〜$2,400ゾーンを買い手が守ることで短期的な回復を示唆しています。
出来高は中程度です。ETHが$2,370を上回っている限り、$2,480〜$2,550に向かう動きが可能です。$2,358を下抜けると、$2,300〜$2,280方向への道が開けます。
グローバル市場の文脈:
ビットコインの優位性は依然として高く、アルトコインに圧力がかかっています。
米国市場はまちまちで、リスク選好はまだ慎重です。
イーサリアム・エコシステム活動(レイヤー2+ステーキング)は引き続き強く、土台となる支えになっています。
マクロ: 今週の暗号資産の方向性を決める主な要因は、FRBの利上げ見通しとUSDの強さです。
バイアス: $2,370が維持されている限り、4Hでは中立〜やや強気です。$2,480の水準は注意深く見てください。出来高を伴う明確なブレイクが次の上昇局面を引き起こす可能性があります。
ここでのETHはどう見ていますか?ロングですか、それともより良いエントリーを待ちますか?
#ETH #Ethereum #Binance #CryptoAnalysis #ETHUSDT
116
ログインして、さらにコンテンツを読む
厳選トピックで世界の暗号資産トレーダーの仲間入り
⚡️ 暗号資産に関する最新かつ有益な情報が見つかります。
💬 世界最大の暗号資産取引所から信頼されています。
👍 認証を受けたクリエイターから、有益なインサイトを得られます。
メール / 電話番号
トレンドトピック
BTCBreaks80K
閲覧回数 57,182
1,349人が討論中
米連邦準備制度(FED)の爆撃と、$80Kの空白:ビットコインの流動性トラップ 🐋📊
連邦準備制度のマクロ経済ニュースによる騒音の後、相場は熱狂状態。上昇の追い風が一撃で入り、ビットコインは$80,989.99の“ぴったり”の高値を付けた。ニュースに導かれてこの水準で買うのは、数学的なパラシュートなしで宙に飛び込むことだ。
スキャナーの冷徹な数字が明かすのは、臨界的な過熱(オーバーエクステンション):
🔥 クオンティタティブ・イージング(4H):勢いのあるローソク足が重力を突き破った。4時間足のKDJオシレーターは極端な買われ過ぎで燃え上がっており、ライン「J」が100.83の上限をブチ破っている。価格は、構造的な主要サポートであるEMA20から危険なほど乖離しており、そのEMA20は下の$77,270.34に置き去りにされたままだ。
📐 フィボナッチの檻:インパルスの起点である$74,967.97から、$80,989.99の高値までのリトレースを引くと、38.2%のフィボナッチ・レベルが精密に合流する。狙うべき「ターミナルの確認」は?その水準は、1HのSuperTrendのダイナミックなフロアである$78,702.50とまったく一致する。
🩸 短期ドレイン(1H):慣性はすでに割れ始めている。1時間足のKDJでは「J」ラインが87.22まで後退しており、ニュースの燃料が尽きつつあることを確認している。
フリーライターのセットアップ(FOMOゼロ):
$80,748の水準を、3,000ドル以上も離れたEMAで取引することは、リスク管理を完全に破壊する。
🔴 トラップゾーン:現在の天井である“FEDの熱狂”を買うことは、すでに売り分け(ディストリビュート)に使っている機関投資家に流動性をプレゼントすることだ。
🟢 構造的な狩場ゾーン:規律は、平均回帰を待つことを命じる。私たちの数学的な“釣り網”は、フィボナッチ38.2%と1HのSuperTrendが重なる合流地点で展開され、安全なブロックである$78,700台を狙っている。
統計はニュースではなく、後に残る“構造”を動かす。📐
$BTC #BTCBreaks80K
RelatoCriptoPRO
·いいね:2件
·閲覧回数 1.2k
比特币突破8万
閲覧回数 56,209
206人が討論中
BuffettBecomesBerkshireChairmanEmeritus
閲覧回数 12,922
464人が討論中