LINK/USDT Fresh Technical Analysis
(Based on the latest Binance 4H chart
Current Price: $11.303
24H Change: +5.82%
24H Range: $10.617 – $11.432
Volume: 2.11M LINK | 23.33M USDT
Chart Overview (4H Timeframe)
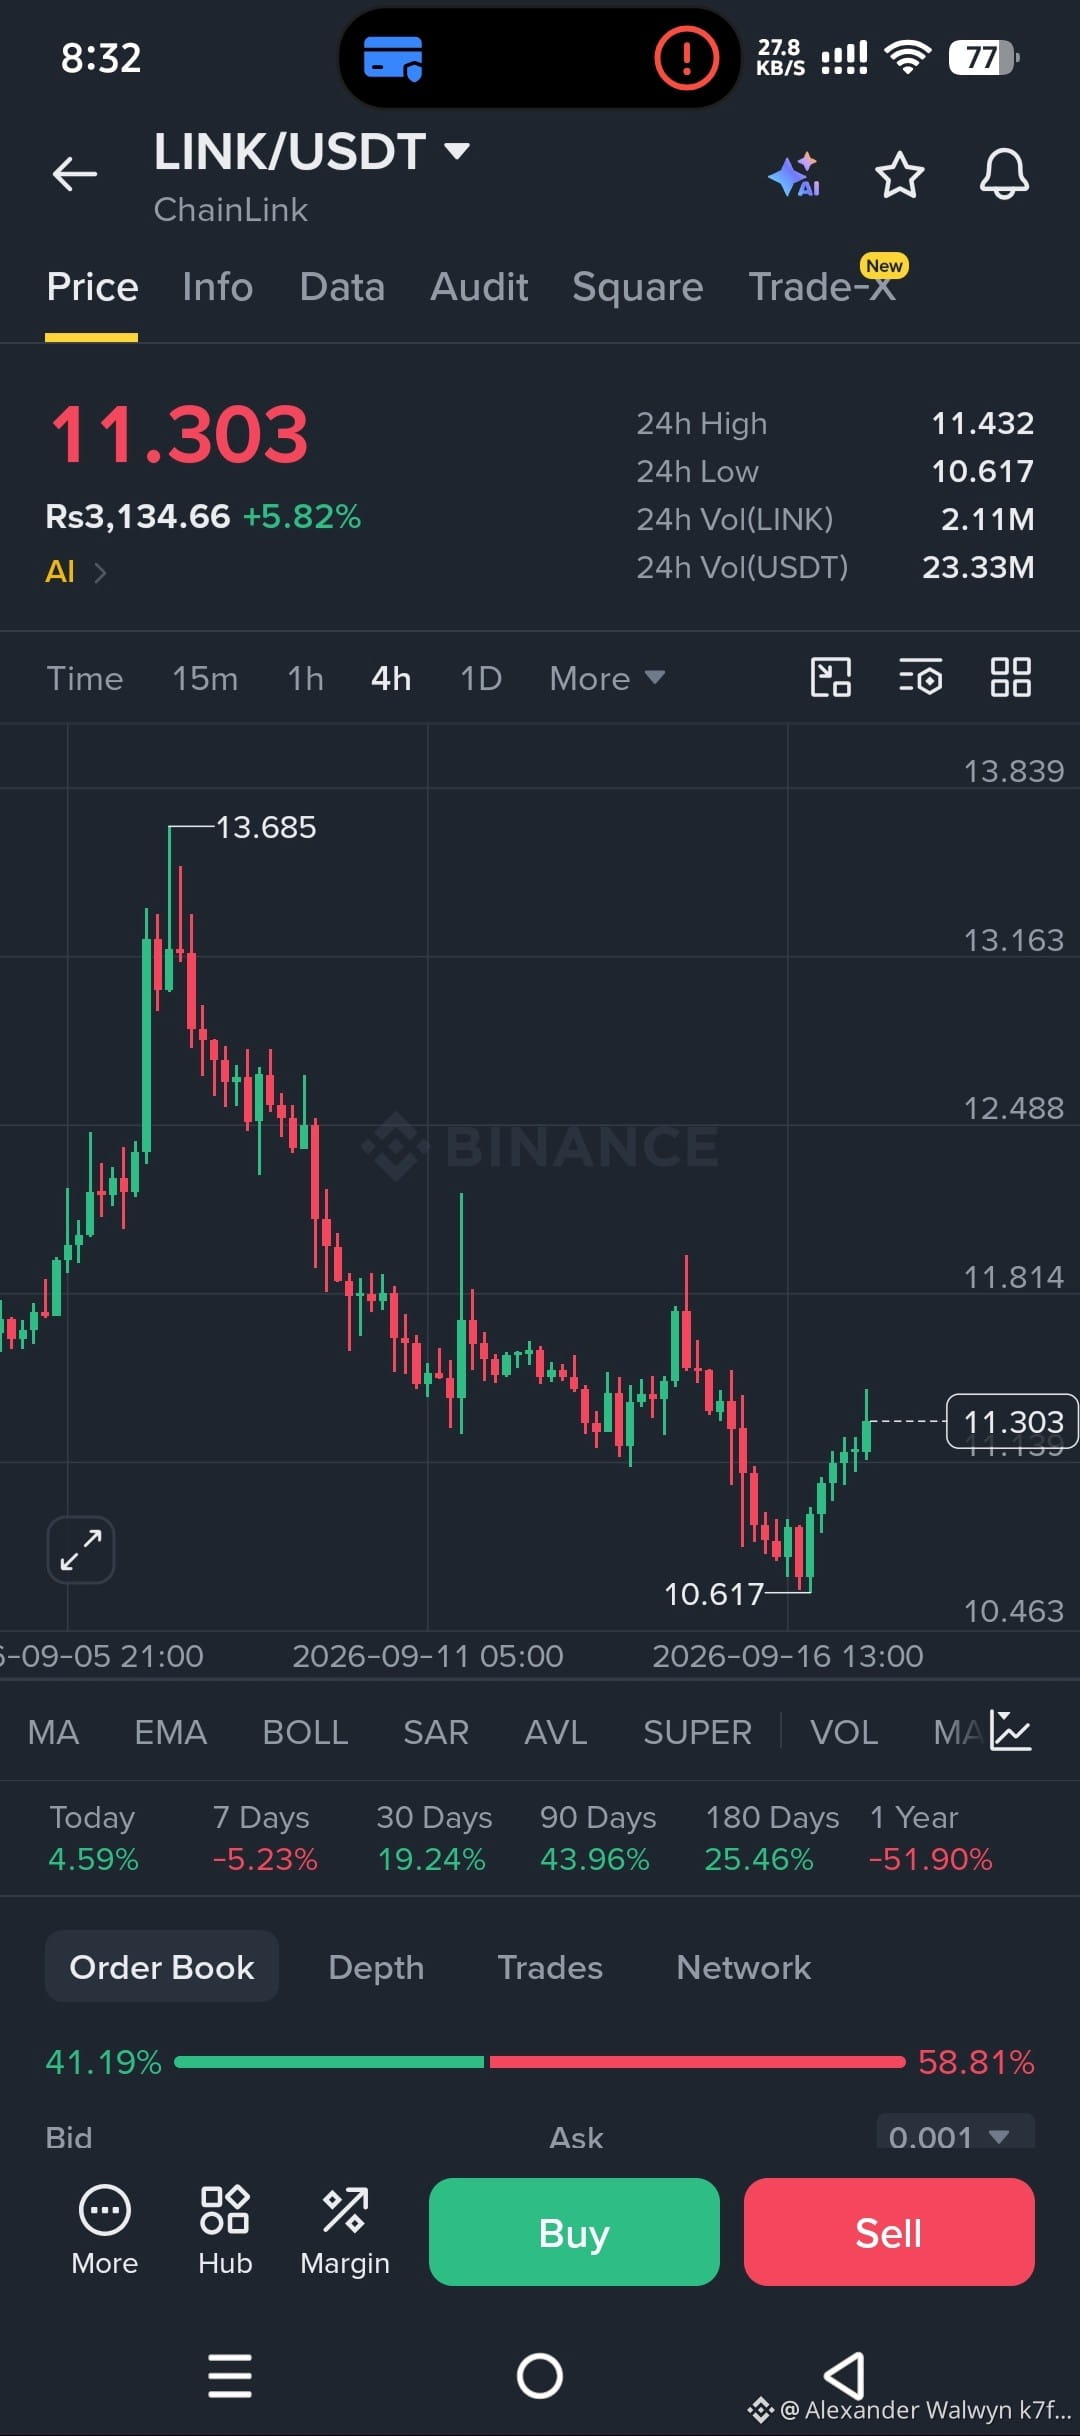
LINK printed a clear local bottom at $10.617 and has been grinding higher with consecutive green candles. The recovery is clean and so far holds above the recent swing low.
Key levels visible on the chart:
Immediate Resistance: $11.43 – $11.50 (24H high zone)
Next Resistance: $11.80 – $12.00
Major Resistance: $12.48 – $13.16 (previous supply zone)
Strong Support: $10.60 – $10.70
Breakdown Level: Below $10.46
Market Structure
Price rejected the $13.68 high and entered a multi-week downtrend.
The recent low at $10.617 looks like a potential higher-low formation if buyers continue to defend it.
Short-term momentum has flipped bullish after the bounce from the lows.
Order book currently shows slightly more sell pressure (Ask 58.81% vs Bid 41.19%).
Performance Snapshot
PeriodChangeToday+4.59%7 Days–5.23%30 Days+19.24%90 Days+43.96%180 Days+25.46%1 Year–51.90%
Short-Term Bias
Bullish as long as $10.60 holds.
A sustained break and close above $11.45–$11.50 would open the door for a move toward $11.80–$12.20.
Failure to hold $10.60 risks a retest of the $10.00–$10.20 psychological zone.
Trade Ideas (Not Financial Advice)
Long Setup:
Entry zone: $11.15 – $11.30
Invalidation: Close below $10.60
Targets: $11.80 → $12.20 → $12.80
Short Setup (only on rejection):
Entry: Rejection from $11.45–$11.55 with volume
Target: $10.80 – $10.60
Summary:
LINK has bounced strongly from the $10.62 low and is showing short-term strength. The next few 4H candles will decide whether this is just a relief rally or the start of a larger recovery. Watch the $11.45 level closely.
Stay sharp and manage risk
(Based on the latest Binance 4H chart
Current Price: $11.303
24H Change: +5.82%
24H Range: $10.617 – $11.432
Volume: 2.11M LINK | 23.33M USDT
Chart Overview (4H Timeframe)
LINK printed a clear local bottom at $10.617 and has been grinding higher with consecutive green candles. The recovery is clean and so far holds above the recent swing low.
Key levels visible on the chart:
Immediate Resistance: $11.43 – $11.50 (24H high zone)
Next Resistance: $11.80 – $12.00
Major Resistance: $12.48 – $13.16 (previous supply zone)
Strong Support: $10.60 – $10.70
Breakdown Level: Below $10.46
Market Structure
Price rejected the $13.68 high and entered a multi-week downtrend.
The recent low at $10.617 looks like a potential higher-low formation if buyers continue to defend it.
Short-term momentum has flipped bullish after the bounce from the lows.
Order book currently shows slightly more sell pressure (Ask 58.81% vs Bid 41.19%).
Performance Snapshot
PeriodChangeToday+4.59%7 Days–5.23%30 Days+19.24%90 Days+43.96%180 Days+25.46%1 Year–51.90%
Short-Term Bias
Bullish as long as $10.60 holds.
A sustained break and close above $11.45–$11.50 would open the door for a move toward $11.80–$12.20.
Failure to hold $10.60 risks a retest of the $10.00–$10.20 psychological zone.
Trade Ideas (Not Financial Advice)
Long Setup:
Entry zone: $11.15 – $11.30
Invalidation: Close below $10.60
Targets: $11.80 → $12.20 → $12.80
Short Setup (only on rejection):
Entry: Rejection from $11.45–$11.55 with volume
Target: $10.80 – $10.60
Summary:
LINK has bounced strongly from the $10.62 low and is showing short-term strength. The next few 4H candles will decide whether this is just a relief rally or the start of a larger recovery. Watch the $11.45 level closely.
Stay sharp and manage risk