

CHAUDHRYAYAZ
48 投稿

CHAUDHRYAYAZ
報告
ユーザーをブロック
2 フォロー
5 フォロワー
4 いいね
投稿
·
--
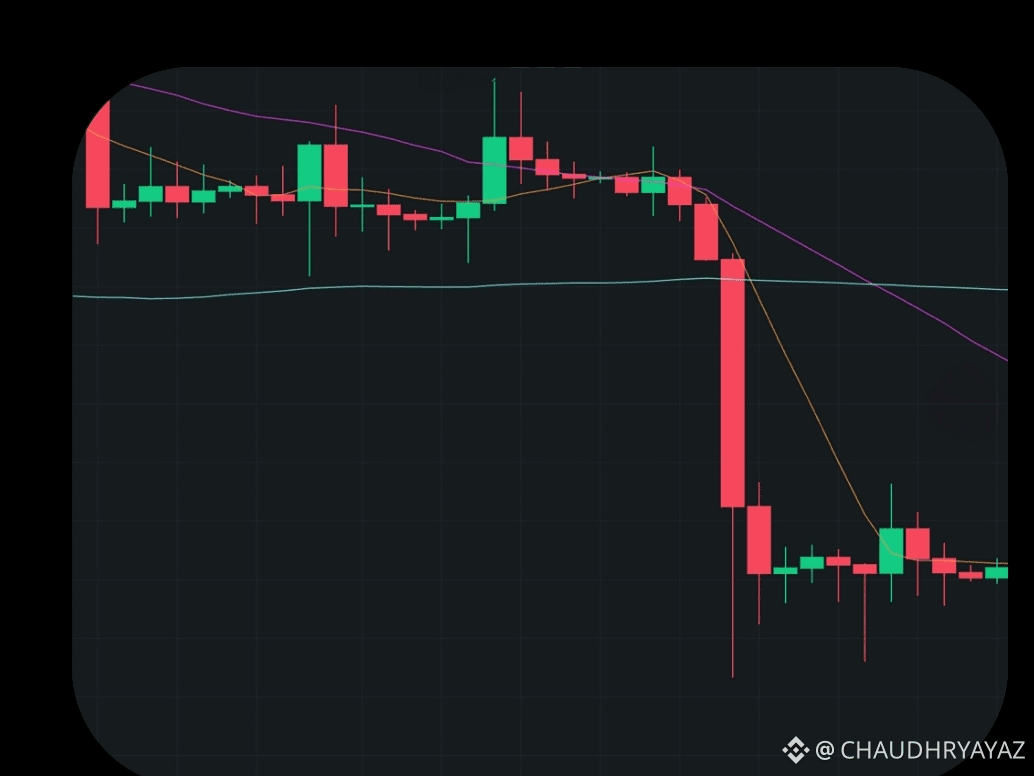
$ADA カルダノ(ADA)は、暗号資産市場全体で短期的な下落圧力を受けた後、現在、0.20~0.23ドル付近の重要なサポートゾーンを試しています。#ThailandSupremeCourtRulesBitcoinIsProperty #CanMicrosoftDeliverOnAI
{spot}(ADAUSDT)
$ADA カルダノ(ADA)は、暗号資産市場全体で短期的な下落圧力を受けた後、現在、0.20~0.23ドル付近の重要なサポートゾーンを試しています。#ThailandSupremeCourtRulesBitcoinIsProperty #CanMicrosoftDeliverOnAI
1
2
242
·
--
翻訳参照
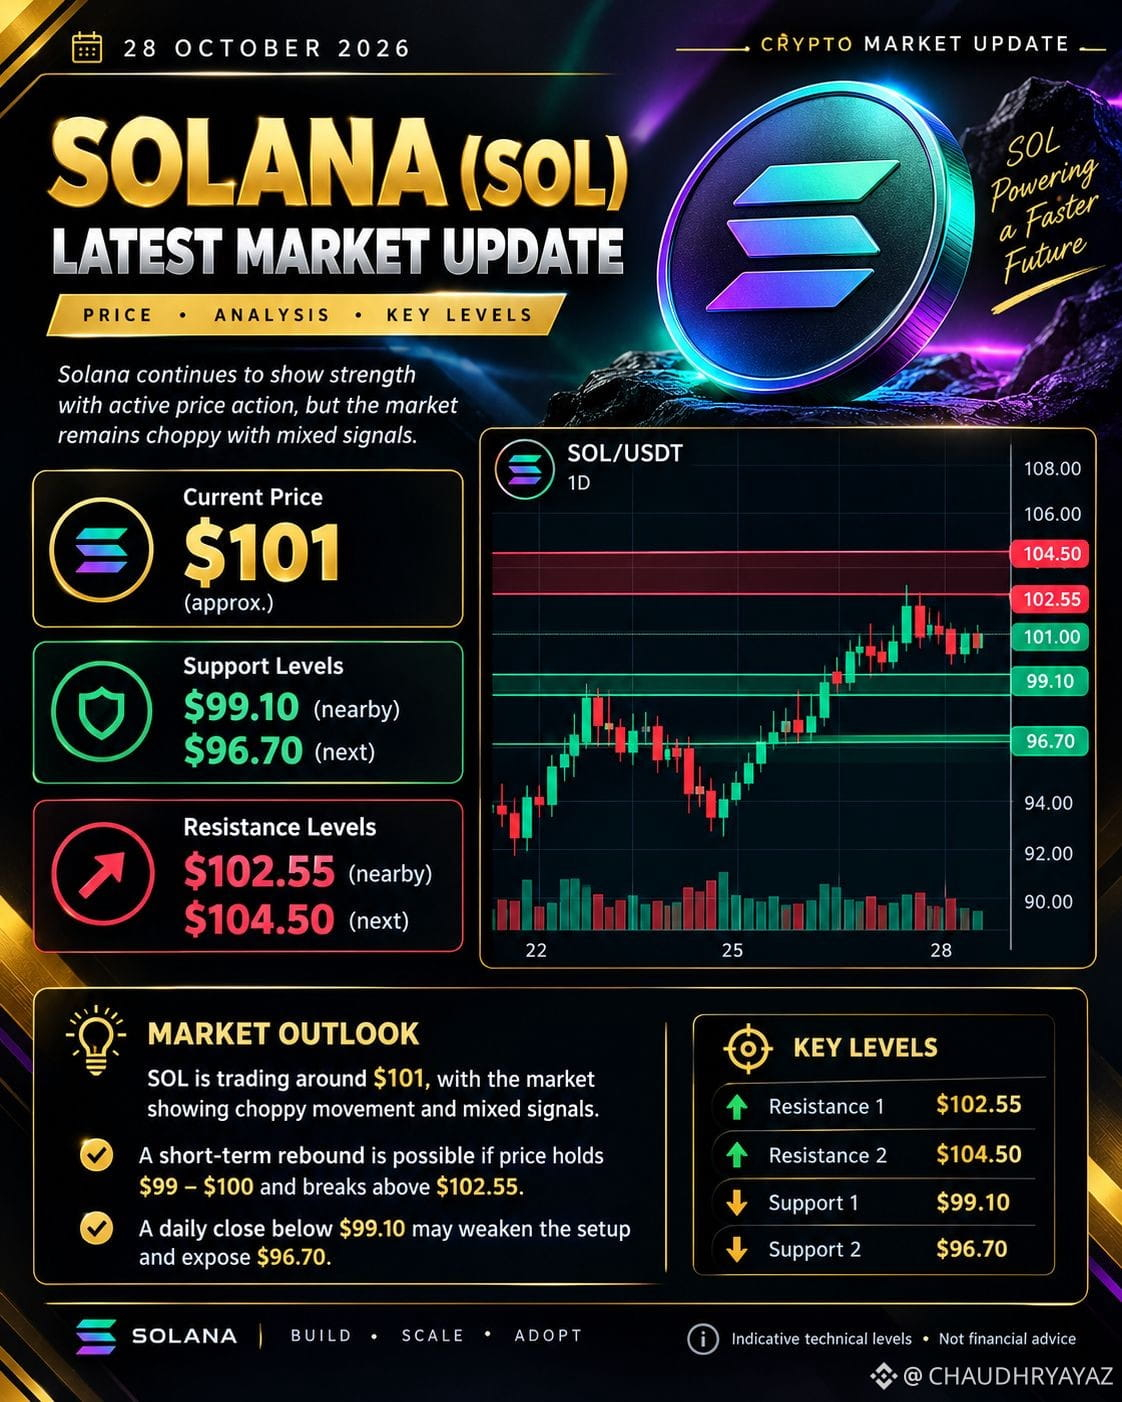
$SOL SOL is trading around $101, with mixed signals and short-term volatility. Buyers need to break resistance to confirm a stronger recovery.
Resistance 1: $102.55
Resistance 2: $104.50
Support 1: $99.10
Support 2: $96.70
Bullish scenario: A breakout above $102.55 could open the way toward $104.50.
Bearish scenario: A break below $99.10 could expose $96.70.
Strategy: Wait for breakout confirmation and use proper stop-loss protection. Levels are indicative.#RobinhoodFalls8.4%AfterItsResults #CanMicrosoftDeliverOnAI
{spot}(SOLUSDT)
$SOL SOL is trading around $101, with mixed signals and short-term volatility. Buyers need to break resistance to confirm a stronger recovery.
Resistance 1: $102.55
Resistance 2: $104.50
Support 1: $99.10
Support 2: $96.70
Bullish scenario: A breakout above $102.55 could open the way toward $104.50.
Bearish scenario: A break below $99.10 could expose $96.70.
Strategy: Wait for breakout confirmation and use proper stop-loss protection. Levels are indicative.#RobinhoodFalls8.4%AfterItsResults #CanMicrosoftDeliverOnAI
58
·
--
翻訳参照
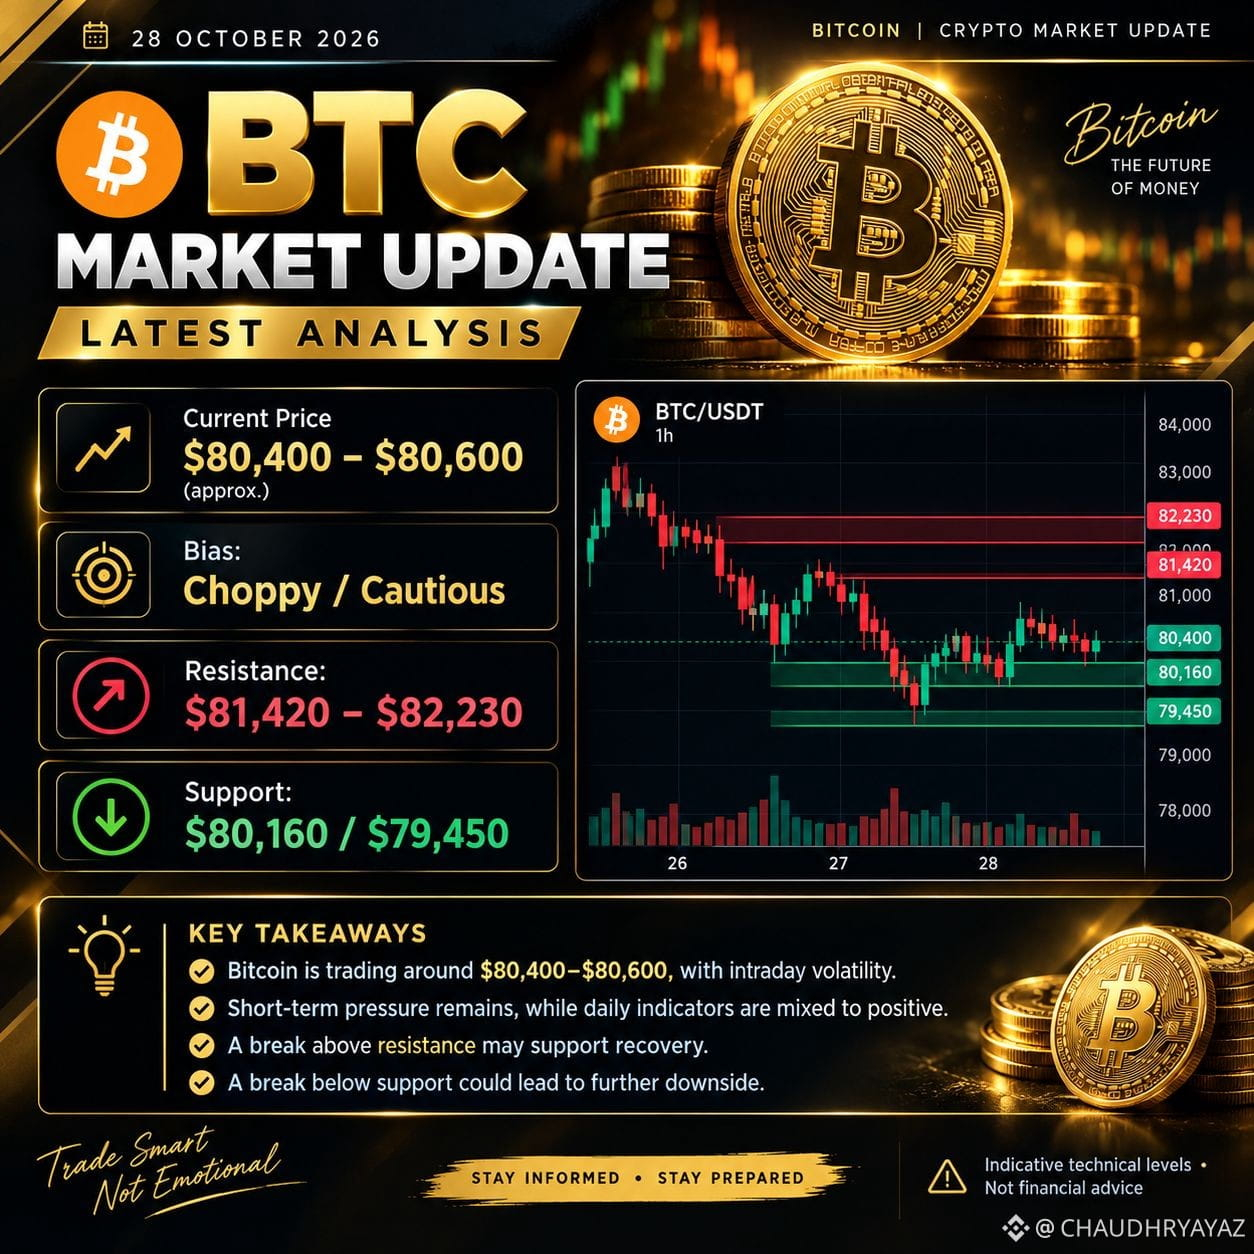
$BTC BTC Latest Analysis — 28 October 2026
Premium Look • Bitcoin Market Update
BTC is trading around $80,400–$80,600, with volatility elevated ahead of the Federal Reserve decision.
Resistance: $81,420 – $82,230
Support: $80,160
Next support: $79,450
Bullish scenario: A breakout above $82,230 could support further recovery.
Bearish scenario: A breakdown below $80,160 could push BTC toward $79,450.
Strategy: Wait for breakout confirmation and manage risk carefully. These are indicative technical levels, not guaranteed targets.#EarningsSeason #CanMicrosoftDeliverOnAI
{spot}(BTCUSDT)
$BTC BTC Latest Analysis — 28 October 2026
Premium Look • Bitcoin Market Update
BTC is trading around $80,400–$80,600, with volatility elevated ahead of the Federal Reserve decision.
Resistance: $81,420 – $82,230
Support: $80,160
Next support: $79,450
Bullish scenario: A breakout above $82,230 could support further recovery.
Bearish scenario: A breakdown below $80,160 could push BTC toward $79,450.
Strategy: Wait for breakout confirmation and manage risk carefully. These are indicative technical levels, not guaranteed targets.#EarningsSeason #CanMicrosoftDeliverOnAI
68
·
--
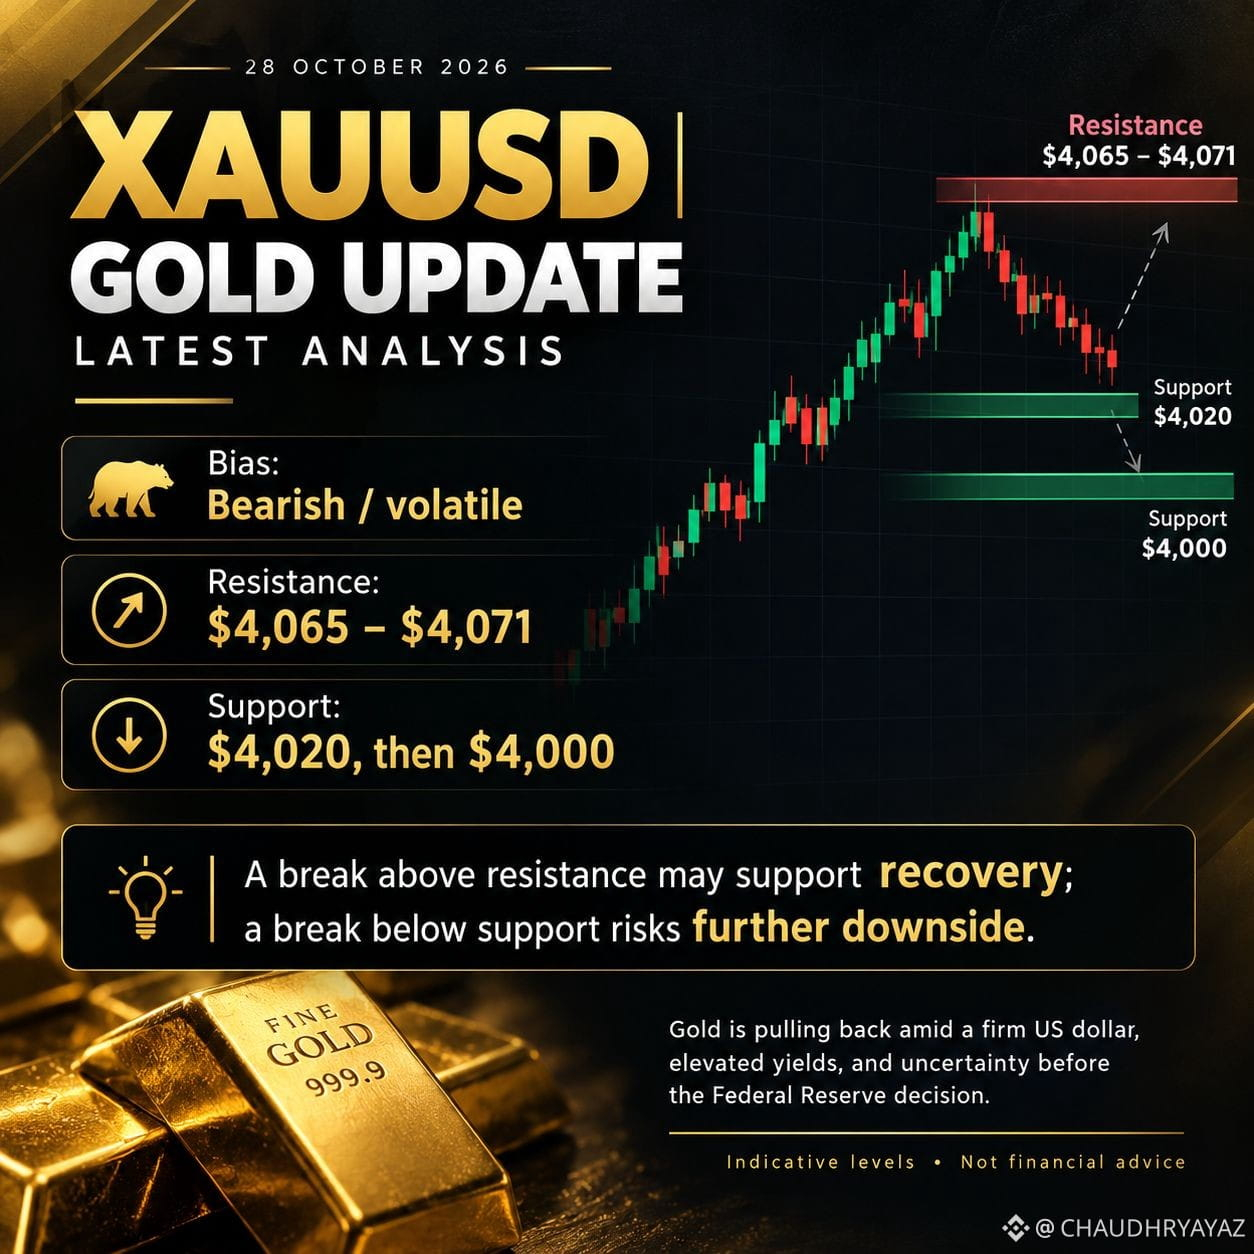
$XAUT XAUUSD 最新分析 — 2026年10月28日
プレミアム・ルック • 金市場アップデート
米連邦準備制度理事会(FRB)の決定を前に、金には売り圧力がかかっています。現物金は最近、1オンスあたり約4,030ドルで取引されました。
注目すべき水準
レジスタンス:4,065~4,071ドル
サポート:4,020ドル
次のサポート:4,000ドル
強気シナリオ:レジスタンスを明確に上抜ければ、回復につながる可能性があります。
弱気シナリオ:4,020ドルを下回ると、4,000ドルまで下落する可能性があります。これらは参考用のテクニカル水準であり、リアルタイムの取引シグナルではありません。取引前に、利用しているブローカーで現在価格を確認してください。#KOSPISurges6.63%BackAbove6000 #CanGoogleDefindItsCore
{spot}(XAUTUSDT)
$XAUT XAUUSD 最新分析 — 2026年10月28日
プレミアム・ルック • 金市場アップデート
米連邦準備制度理事会(FRB)の決定を前に、金には売り圧力がかかっています。現物金は最近、1オンスあたり約4,030ドルで取引されました。
注目すべき水準
レジスタンス:4,065~4,071ドル
サポート:4,020ドル
次のサポート:4,000ドル
強気シナリオ:レジスタンスを明確に上抜ければ、回復につながる可能性があります。
弱気シナリオ:4,020ドルを下回ると、4,000ドルまで下落する可能性があります。これらは参考用のテクニカル水準であり、リアルタイムの取引シグナルではありません。取引前に、利用しているブローカーで現在価格を確認してください。#KOSPISurges6.63%BackAbove6000 #CanGoogleDefindItsCore
441
·
--
$ETH 現在価格: ~$2,550~$2,680
市場バイアス: 慎重ながら強気 ⚖️
注目ポイント: $2,750付近のレジスタンスを試す展開
📊 テクニカル状況と重要水準
レイヤー2の活動が拡大し、ガス代の構造的な動きも安定するなか、イーサリアムは狭いレンジ内での保ち合いが続いています。
🔴 主要レジスタンス: $2,750~$2,820 — この壁を日足で力強く上抜ければ、心理的節目である$3,000のレジスタンスを目指す展開が視野に入ります。
🟢 主要サポートゾーン: $2,450~$2,500 — 買い手は引き続き、この主要な移動平均線の下支えを守っています。このゾーンを下抜けると、$2,320を再び試すリスクがあります。
🔥 ファンダメンタルズ上の材料
L2のスケーリングとネットワーク活動: Arbitrum、Optimism、Baseで高いトランザクション処理量が続き、長期的なネットワーク需要を下支えしています。
ステーキング利回りと供給動向: ステーキングへの参加が安定していることで、市場で流通する供給量が抑えられています。
🎯 トレード戦略: $2,820を上回る高出来高でのブレイクアウトを確認してから、上昇継続を狙ったロングを検討しましょう。一方で、$2,450を下回った場合に備え、厳格なリスク管理を徹底してください。#Ethereum #ETH #暗号資産分析 #トレード #アルトコイン #defi #ThailandLaunchesWORPTStablecoinToQRPaymentApp #SouthKoreaConsidersEducationTaxOnCryptoExchanges
{spot}(ETHUSDT)
$ETH 現在価格: ~$2,550~$2,680
市場バイアス: 慎重ながら強気 ⚖️
注目ポイント: $2,750付近のレジスタンスを試す展開
📊 テクニカル状況と重要水準
レイヤー2の活動が拡大し、ガス代の構造的な動きも安定するなか、イーサリアムは狭いレンジ内での保ち合いが続いています。
🔴 主要レジスタンス: $2,750~$2,820 — この壁を日足で力強く上抜ければ、心理的節目である$3,000のレジスタンスを目指す展開が視野に入ります。
🟢 主要サポートゾーン: $2,450~$2,500 — 買い手は引き続き、この主要な移動平均線の下支えを守っています。このゾーンを下抜けると、$2,320を再び試すリスクがあります。
🔥 ファンダメンタルズ上の材料
L2のスケーリングとネットワーク活動: Arbitrum、Optimism、Baseで高いトランザクション処理量が続き、長期的なネットワーク需要を下支えしています。
ステーキング利回りと供給動向: ステーキングへの参加が安定していることで、市場で流通する供給量が抑えられています。
🎯 トレード戦略: $2,820を上回る高出来高でのブレイクアウトを確認してから、上昇継続を狙ったロングを検討しましょう。一方で、$2,450を下回った場合に備え、厳格なリスク管理を徹底してください。#Ethereum #ETH #暗号資産分析 #トレード #アルトコイン #defi #ThailandLaunchesWORPTStablecoinToQRPaymentApp #SouthKoreaConsidersEducationTaxOnCryptoExchanges

95
·
--
$SOL 現在価格: 約$185~$192
市場見通し: 強気継続 🚀
注目期間: 主要レジスタンスゾーンを試す展開
📊 テクニカル分析と主要水準
Solanaは、高い処理能力とオンチェーンのDeFi取引量の強さを背景に、レイヤー1銘柄の中で相対的な強さを維持しています。
🔴 主要レジスタンス: $200~$210 — $210を明確に上抜ければ、前サイクルの高値である$240付近が次の目標となります。
🟢 主要サポートゾーン: $175~$180 — 強気派はこの重要な再テスト水準を維持しています。このゾーンを割り込むと、$160まで下落する可能性があります。
🔥 ファンダメンタルズ上の katalyst
DeFiとDEXの取引量: Solanaの分散型取引所の取引量は、非常に高速な決済を背景に、大きな市場シェアを獲得し続けています。
機関投資家の関心: エコシステムの普及拡大と機関投資家による財務資産としての関心が高まり、SOLは主要なスマートコントラクト資産としての地位を固めています。
🎯 取引計画: 継続を狙うセットアップでは、$185を上回る高出来高での保ち合い、または$210を明確に上抜けたことの確認を待ちつつ、$175を下回るリスクに注意しましょう。
#Solana #SOL #暗号資産分析 #トレード #アルトコイン #DeFi: #ThailandLaunchesWORPTStablecoinToQRPaymentApp #OCCUrgesCommunityBanksToEnterStablecoinPayments
{spot}(SOLUSDT)
$SOL 現在価格: 約$185~$192
市場見通し: 強気継続 🚀
注目期間: 主要レジスタンスゾーンを試す展開
📊 テクニカル分析と主要水準
Solanaは、高い処理能力とオンチェーンのDeFi取引量の強さを背景に、レイヤー1銘柄の中で相対的な強さを維持しています。
🔴 主要レジスタンス: $200~$210 — $210を明確に上抜ければ、前サイクルの高値である$240付近が次の目標となります。
🟢 主要サポートゾーン: $175~$180 — 強気派はこの重要な再テスト水準を維持しています。このゾーンを割り込むと、$160まで下落する可能性があります。
🔥 ファンダメンタルズ上の katalyst
DeFiとDEXの取引量: Solanaの分散型取引所の取引量は、非常に高速な決済を背景に、大きな市場シェアを獲得し続けています。
機関投資家の関心: エコシステムの普及拡大と機関投資家による財務資産としての関心が高まり、SOLは主要なスマートコントラクト資産としての地位を固めています。
🎯 取引計画: 継続を狙うセットアップでは、$185を上回る高出来高での保ち合い、または$210を明確に上抜けたことの確認を待ちつつ、$175を下回るリスクに注意しましょう。
#Solana #SOL #暗号資産分析 #トレード #アルトコイン #DeFi: #ThailandLaunchesWORPTStablecoinToQRPaymentApp #OCCUrgesCommunityBanksToEnterStablecoinPayments

68
·
--
$XRP 現在価格: ~$1.29~$1.31
市場バイアス: 中立~慎重な強気 ⚖️
重要な注目点: 重要サポート$1.25の維持
📊 テクニカル分析と重要水準
XRPは重要な構造的水準を試しています。暗号資産市場全体はマクロ経済の不確実性と、$80K付近でのビットコインの最近の変動に直面しています。
🔴 主なレジスタンス: $1.34~$1.37 — 日足終値で$1.37を明確に上回れば、$1.43~$1.50に向けて流動性が広がります。
🟢 中核サポートゾーン: $1.25~$1.28 — 強気派がこの下限を積極的に守っています。ここを割り込むと、$1.20まで下落するリスクが高まります。
🔥 ファンダメンタルズ面の材料
銀行・機関投資家への拡大: Rippleの最近の規制面での進展とOCCの動きが、機関投資家の構造的なセンチメントを引き続き支えています。
XRP Ledgerの実用性: クロスチェーン流動性の拡大と決済基盤の導入が、長期的なオーダーブックの安定につながっています。
マクロセンチメント: 市場全体の方向性は、ビットコインの持ち合いと機関投資家によるETF資金フローの推移に大きく左右されます。
🎯 トレード計画: 積極的なロングポジションを取る前に、$1.37を上回る高出来高でのブレイクアウトを確認しましょう。$1.25を下回らないよう、厳格なリスク管理を徹底してください。
#XRP #Ripple #CryptoAnalysis #Trading #Altcoins #TechnicalAnalysis #OCCUrgesCommunityBanksToEnterStablecoinPayments #ThailandLaunchesWORPTStablecoinToQRPaymentApp
{spot}(XRPUSDT)
$XRP 現在価格: ~$1.29~$1.31
市場バイアス: 中立~慎重な強気 ⚖️
重要な注目点: 重要サポート$1.25の維持
📊 テクニカル分析と重要水準
XRPは重要な構造的水準を試しています。暗号資産市場全体はマクロ経済の不確実性と、$80K付近でのビットコインの最近の変動に直面しています。
🔴 主なレジスタンス: $1.34~$1.37 — 日足終値で$1.37を明確に上回れば、$1.43~$1.50に向けて流動性が広がります。
🟢 中核サポートゾーン: $1.25~$1.28 — 強気派がこの下限を積極的に守っています。ここを割り込むと、$1.20まで下落するリスクが高まります。
🔥 ファンダメンタルズ面の材料
銀行・機関投資家への拡大: Rippleの最近の規制面での進展とOCCの動きが、機関投資家の構造的なセンチメントを引き続き支えています。
XRP Ledgerの実用性: クロスチェーン流動性の拡大と決済基盤の導入が、長期的なオーダーブックの安定につながっています。
マクロセンチメント: 市場全体の方向性は、ビットコインの持ち合いと機関投資家によるETF資金フローの推移に大きく左右されます。
🎯 トレード計画: 積極的なロングポジションを取る前に、$1.37を上回る高出来高でのブレイクアウトを確認しましょう。$1.25を下回らないよう、厳格なリスク管理を徹底してください。
#XRP #Ripple #CryptoAnalysis #Trading #Altcoins #TechnicalAnalysis #OCCUrgesCommunityBanksToEnterStablecoinPayments #ThailandLaunchesWORPTStablecoinToQRPaymentApp

90
·
--
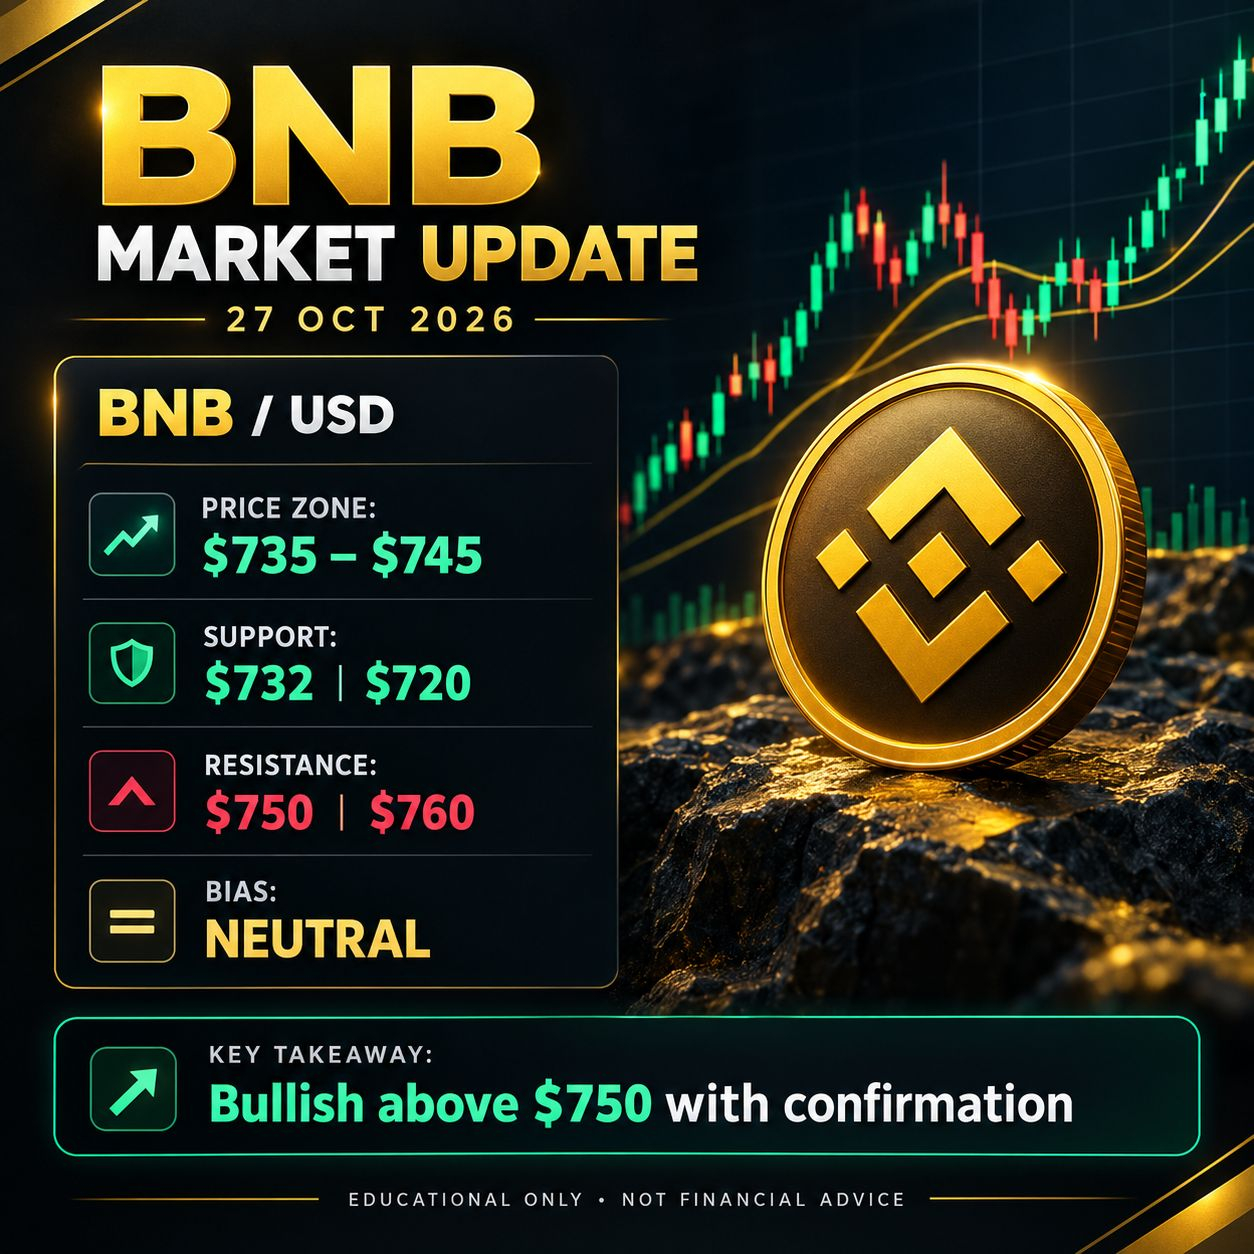
$BNB 現在の見通し:中立 — ブレイクアウトを注視。
BNBは$735~$745のゾーンで値固めしています。強気の勢いを強めるには、買い手が$750を明確に上抜ける必要があります。
🟢 サポート:$732 / $720
🔴 レジスタンス:$750 / $760
🚀 強気の目標:勢いが確認された場合、$780~$800
⚠️ 弱気シグナル:$720を下抜け
取引戦略:明確なブレイクアウトまたはブレイクダウンを確認してからエントリーしましょう。リスクを慎重に管理してください。
教育目的の分析であり、金融アドバイスではありません。価格は急速に変動する場合があります。#SouthKoreaConsidersEducationTaxOnCryptoExchanges #ThailandLaunchesWORPTStablecoinToQRPaymentApp
{spot}(BNBUSDT)
$BNB 現在の見通し:中立 — ブレイクアウトを注視。
BNBは$735~$745のゾーンで値固めしています。強気の勢いを強めるには、買い手が$750を明確に上抜ける必要があります。
🟢 サポート:$732 / $720
🔴 レジスタンス:$750 / $760
🚀 強気の目標:勢いが確認された場合、$780~$800
⚠️ 弱気シグナル:$720を下抜け
取引戦略:明確なブレイクアウトまたはブレイクダウンを確認してからエントリーしましょう。リスクを慎重に管理してください。
教育目的の分析であり、金融アドバイスではありません。価格は急速に変動する場合があります。#SouthKoreaConsidersEducationTaxOnCryptoExchanges #ThailandLaunchesWORPTStablecoinToQRPaymentApp
59
·
--
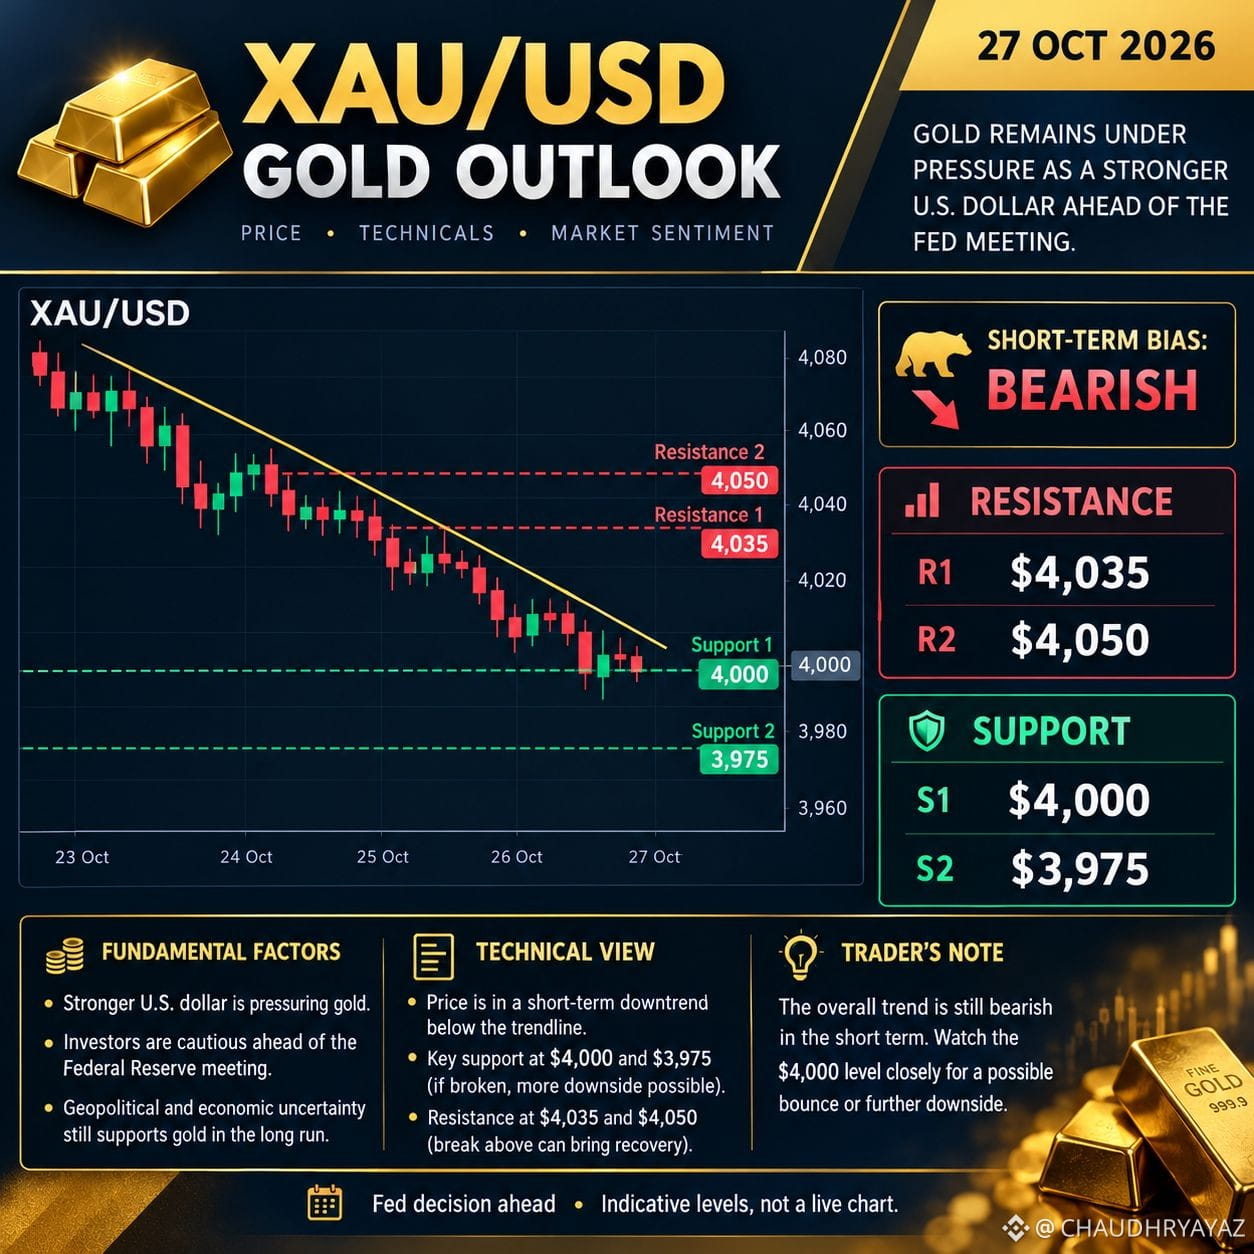
$XAUT XAU/USD — 最新の金分析
2026年10月27日 | 短期見通し
弱気 📉
金は1オンスあたり4,000ドル前後で取引されており、米連邦準備制度理事会(FRB)の決定を前に米ドル高の圧力を受けています。
市場の参考スナップショットです。価格は急速に変動します。
サポート:4,000ドル、3,975ドル
レジスタンス:4,035ドル、4,050ドル
弱気シナリオ:4,000ドルを明確に下回ると、さらに下落する可能性があります。
強気シナリオ:4,035ドルを上回る水準を維持できれば、回復を後押しする可能性があります。 #ThailandLaunchesWORPTStablecoinToQRPaymentApp #BitmineAdds10452ETH
{spot}(XAUTUSDT)
$XAUT XAU/USD — 最新の金分析
2026年10月27日 | 短期見通し
弱気 📉
金は1オンスあたり4,000ドル前後で取引されており、米連邦準備制度理事会(FRB)の決定を前に米ドル高の圧力を受けています。
市場の参考スナップショットです。価格は急速に変動します。
サポート:4,000ドル、3,975ドル
レジスタンス:4,035ドル、4,050ドル
弱気シナリオ:4,000ドルを明確に下回ると、さらに下落する可能性があります。
強気シナリオ:4,035ドルを上回る水準を維持できれば、回復を後押しする可能性があります。 #ThailandLaunchesWORPTStablecoinToQRPaymentApp #BitmineAdds10452ETH
238
·
--
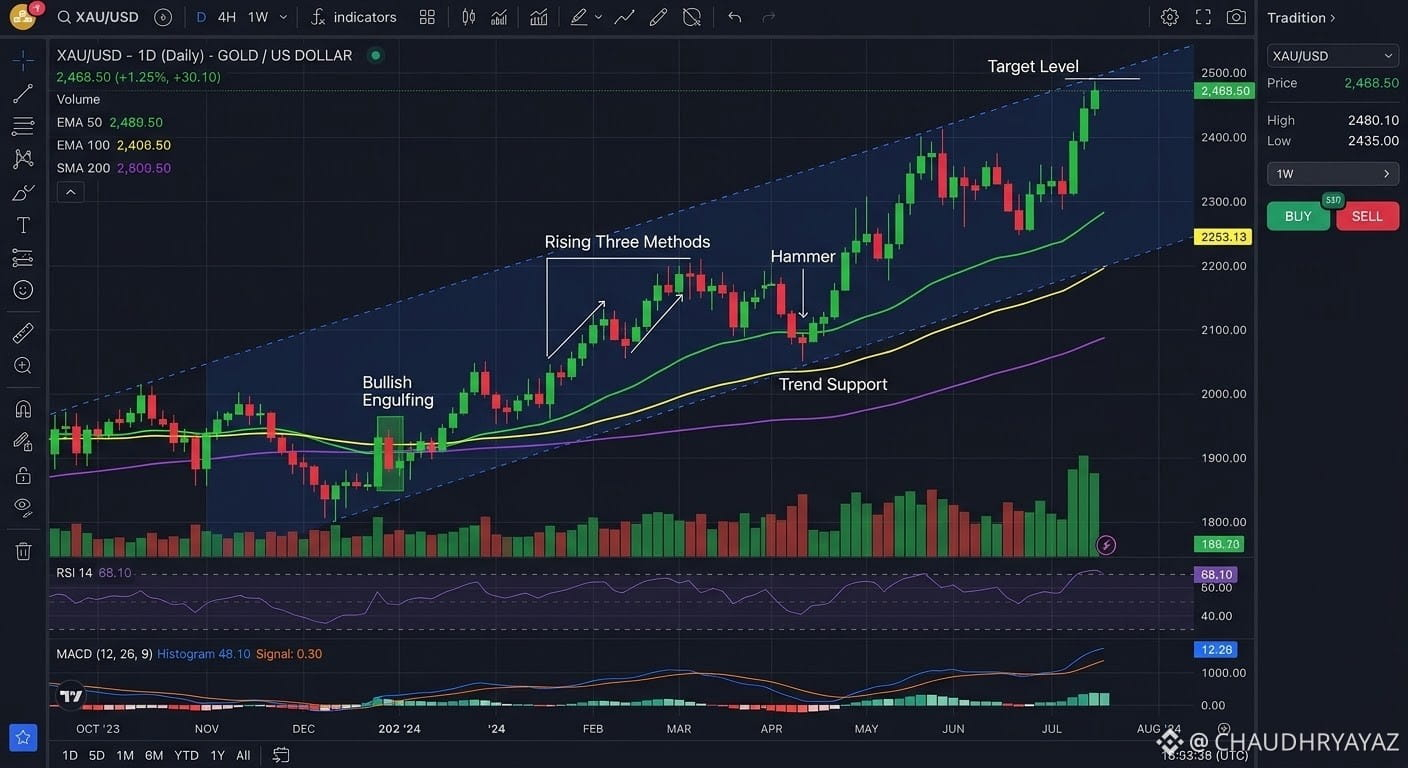
$XAUT XAU/USD市場分析:金は重要なサポート付近で持ち合い
金(XAU/USD)は重要な持ち合い局面にあり、トレーダーがマクロ経済要因や今後の米連邦準備制度理事会(FRB)の政策見通しを見極めるなか、心理的節目である4,000~4,015ドル付近を維持しています。
#FranklinTempletonFilesForTwoDividendToBitcoinETFs #AnthropicTTMRevenueGrewAbout1200%
{spot}(XAUTUSDT)
$XAUT XAU/USD市場分析:金は重要なサポート付近で持ち合い
金(XAU/USD)は重要な持ち合い局面にあり、トレーダーがマクロ経済要因や今後の米連邦準備制度理事会(FRB)の政策見通しを見極めるなか、心理的節目である4,000~4,015ドル付近を維持しています。
#FranklinTempletonFilesForTwoDividendToBitcoinETFs #AnthropicTTMRevenueGrewAbout1200%
金(XAU/USD)は重要な持ち合い局面にあり、トレーダーがマクロ経済要因や今後の米連邦準備制度理事会(FRB)の政策見通しを見極めるなか、心理的節目である4,000~4,015ドル付近を維持しています。
#FranklinTempletonFilesForTwoDividendToBitcoinETFs #AnthropicTTMRevenueGrewAbout1200%
213
·
--
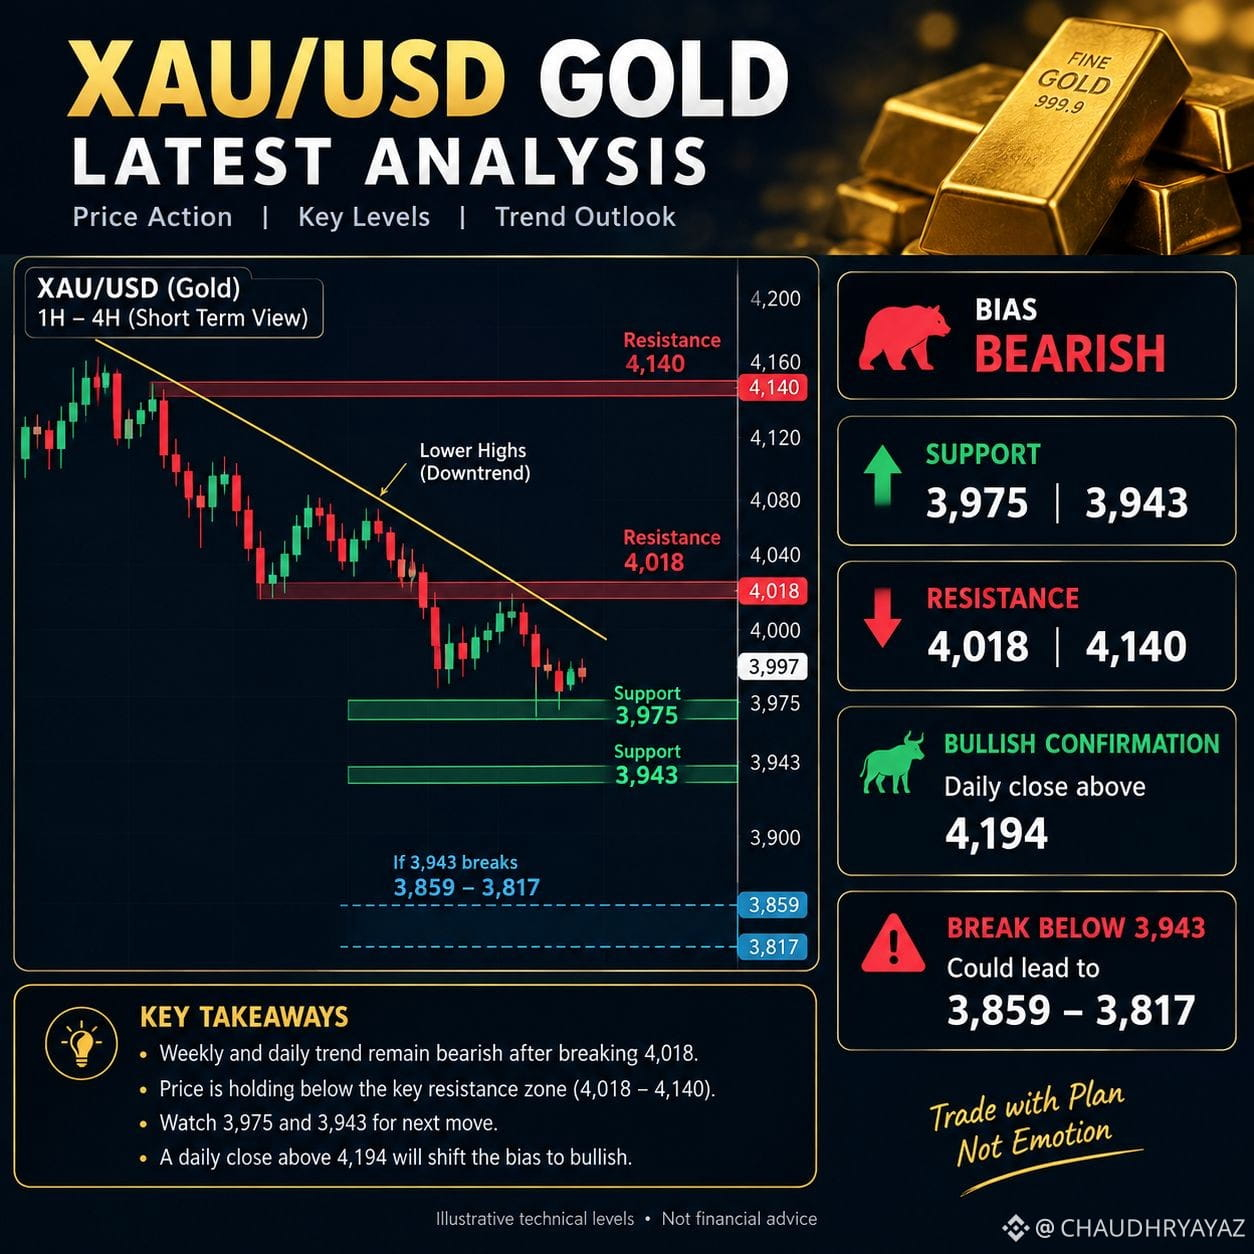
$XAU サポート 2 $3,943
下値目標 $3,859–$3,817
取引見通し
売りシナリオ:$3,943を明確に下抜ければ、$3,859–$3,817に向かう可能性があります。
買いシナリオ:$4,018を上回って回復すれば、短期的な反発を示唆する可能性があります。日足終値が$4,194を上回れば、より強い強気の確認材料となります。
見通し:価格が明確な回復を示すまでは弱気です。
私の見解:急落後に取引を追いかけるのは避けましょう。値動きの確認を待ち、損切りを設定してください。これらはテクニカル上の水準であり、目標到達を保証するものではありません。#ElectrumFixesHighRiskExploitInVersionsBefore4.8.3 #USQ3GDPAndSeptemberPCEDueNextWeek
{future}(XAUTUSDT)
$XAU サポート 2 $3,943
下値目標 $3,859–$3,817
取引見通し
売りシナリオ:$3,943を明確に下抜ければ、$3,859–$3,817に向かう可能性があります。
買いシナリオ:$4,018を上回って回復すれば、短期的な反発を示唆する可能性があります。日足終値が$4,194を上回れば、より強い強気の確認材料となります。
見通し:価格が明確な回復を示すまでは弱気です。
私の見解:急落後に取引を追いかけるのは避けましょう。値動きの確認を待ち、損切りを設定してください。これらはテクニカル上の水準であり、目標到達を保証するものではありません。#ElectrumFixesHighRiskExploitInVersionsBefore4.8.3 #USQ3GDPAndSeptemberPCEDueNextWeek
381
·
--
翻訳参照
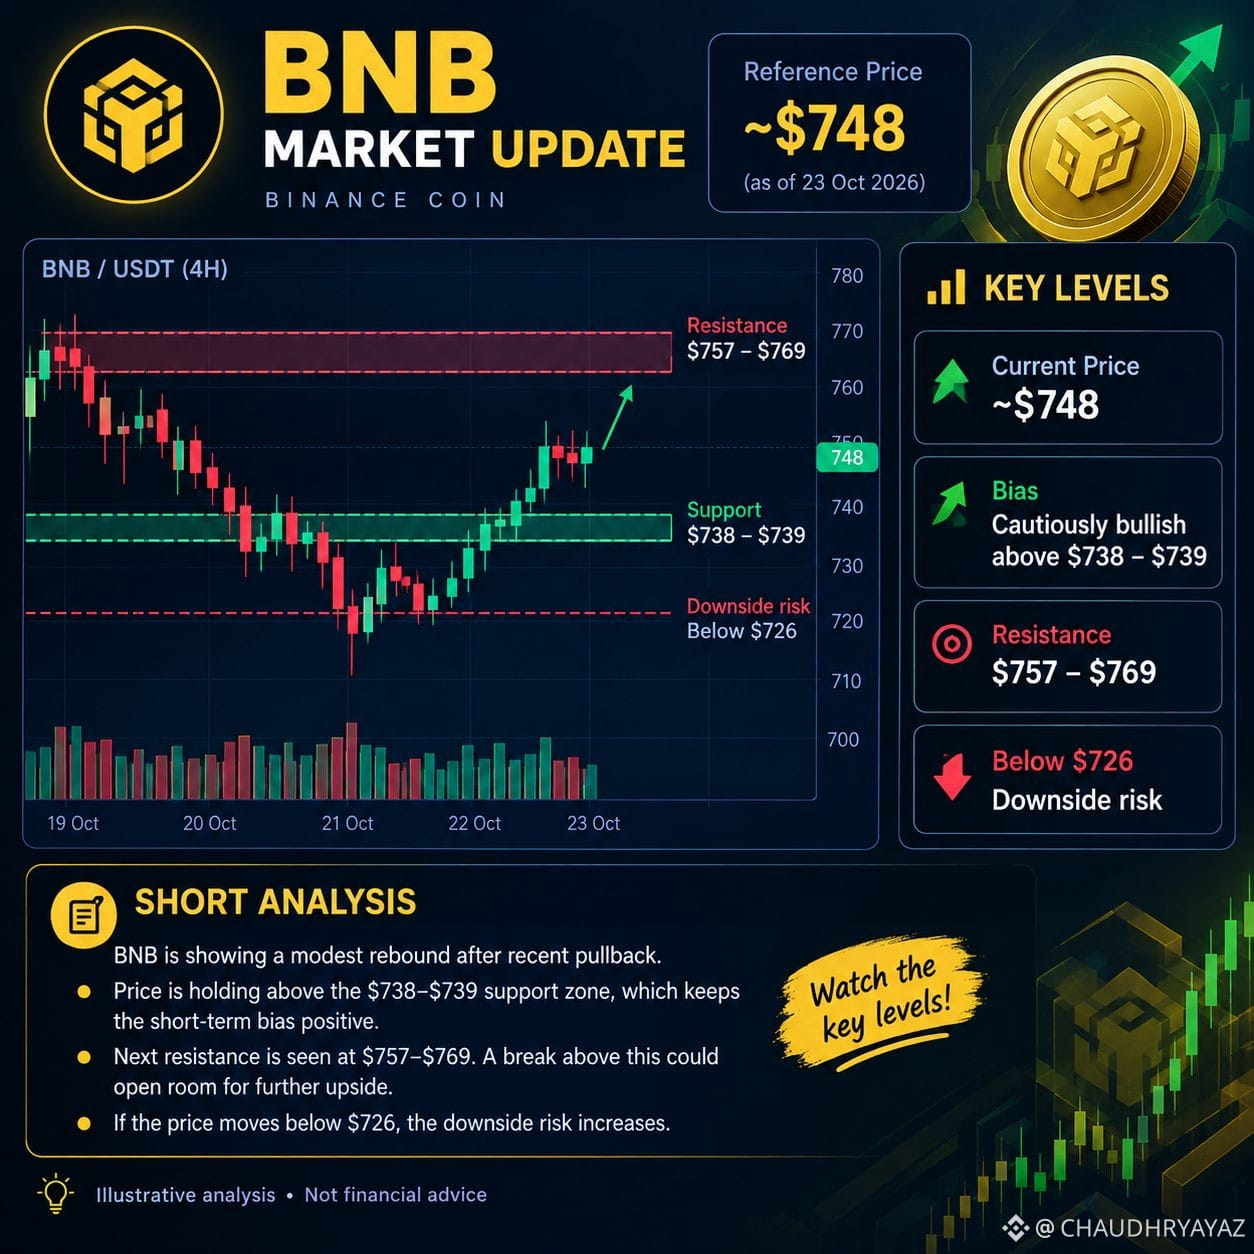
$BNB BNB is showing a possible bullish rebound, with price near $748 in the latest reference data.
Reference price: ~$748
Support: $738–$739
Resistance: $757–$769
Bullish target: A confirmed breakout above $757 could open the way toward higher levels.
Bearish risk: A drop below $726 could signal further weakness.
Market bias: Cautiously bullish above support. Wait for confirmation before entering a trade.
Note: These are reference levels, not a verified live Binance quote. This is not financial advice.#OCCRemovesStablecoinSevenDayRedemptionExtension #MarketsPriceJust10%ChanceOfFedHikeNextWeek
{spot}(BNBUSDT)
$BNB BNB is showing a possible bullish rebound, with price near $748 in the latest reference data.
Reference price: ~$748
Support: $738–$739
Resistance: $757–$769
Bullish target: A confirmed breakout above $757 could open the way toward higher levels.
Bearish risk: A drop below $726 could signal further weakness.
Market bias: Cautiously bullish above support. Wait for confirmation before entering a trade.
Note: These are reference levels, not a verified live Binance quote. This is not financial advice.#OCCRemovesStablecoinSevenDayRedemptionExtension #MarketsPriceJust10%ChanceOfFedHikeNextWeek
28
·
--
翻訳参照
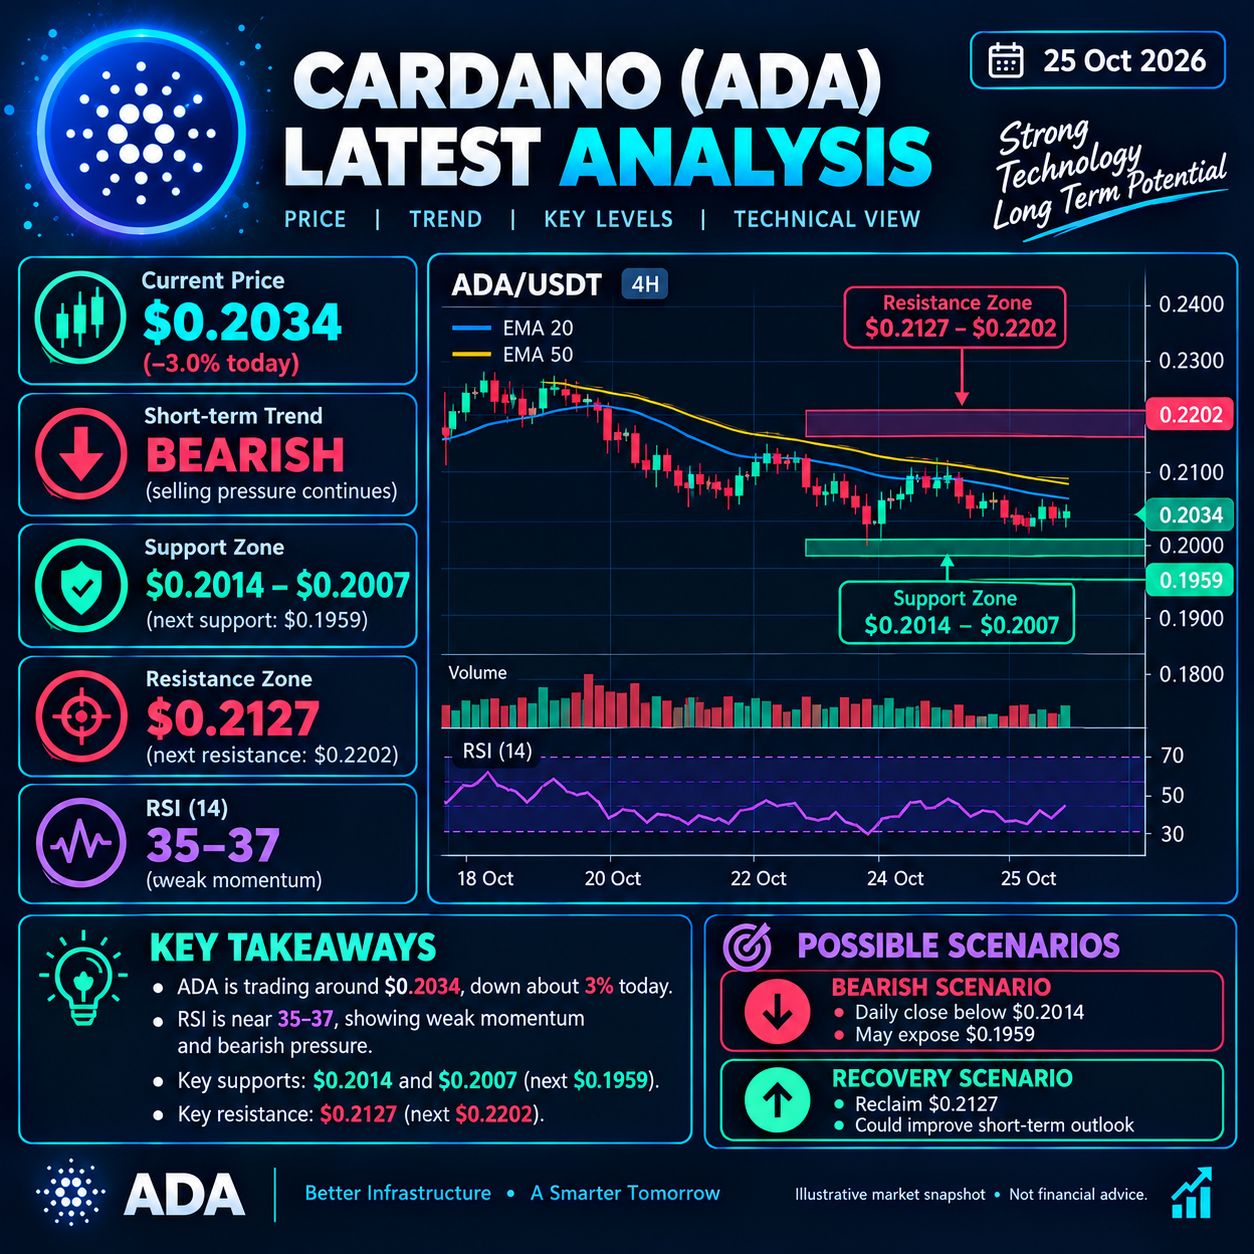
$ADA Reference price $0.2034
24-hour change −3.0%
Short-term trend
Support
$0.2014–$0.2007
Next: $0.1959
Resistance
$0.2127
Next: $0.2202
Market outlook: ADA is under selling pressure, with RSI near 35 indicating weak momentum.
🟢 Bullish: Reclaim $0.2127 to improve the short-term outlook.
🔴 Bearish: A break below $0.2007 could expose $0.1959.
⚠️ Strategy: Wait for confirmation before entering a trade.
Price is an indicative market snapshot, not a guaranteed live quote. Educational purposes only; not financial advice.#OCCRemovesStablecoinSevenDayRedemptionExtension #DowDrops653Points
{spot}(ADAUSDT)
$ADA Reference price $0.2034
24-hour change −3.0%
Short-term trend
Support
$0.2014–$0.2007
Next: $0.1959
Resistance
$0.2127
Next: $0.2202
Market outlook: ADA is under selling pressure, with RSI near 35 indicating weak momentum.
🟢 Bullish: Reclaim $0.2127 to improve the short-term outlook.
🔴 Bearish: A break below $0.2007 could expose $0.1959.
⚠️ Strategy: Wait for confirmation before entering a trade.
Price is an indicative market snapshot, not a guaranteed live quote. Educational purposes only; not financial advice.#OCCRemovesStablecoinSevenDayRedemptionExtension #DowDrops653Points
85
·
--
$XAUT
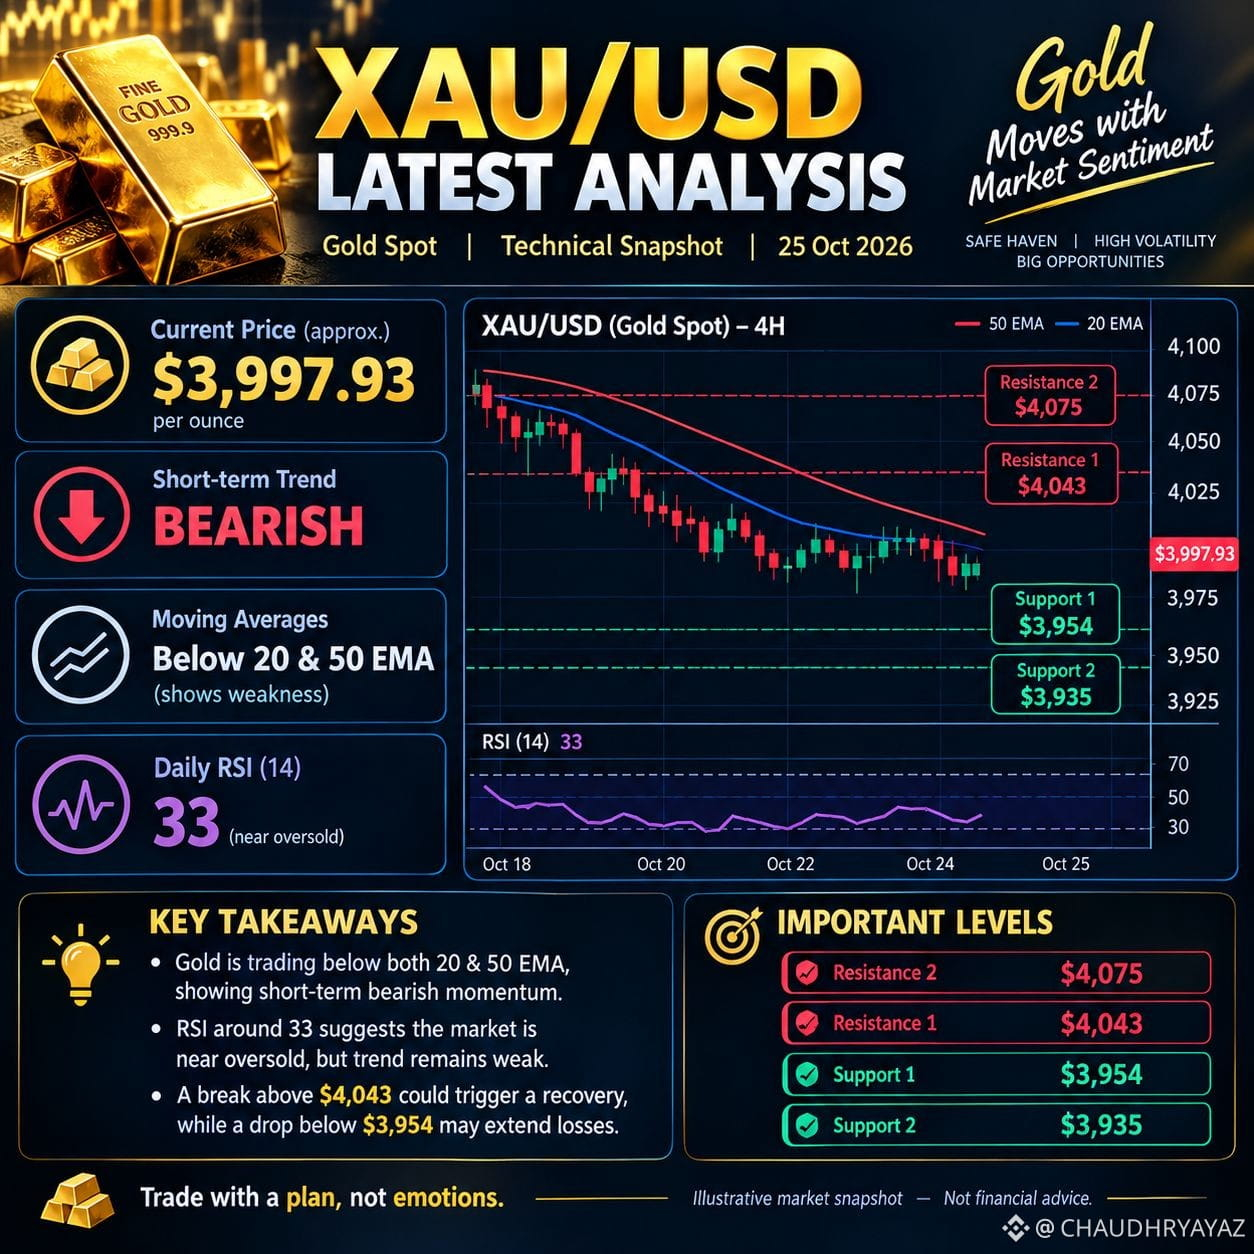
概算価格 $3,997.93
短期トレンド
サポート
$3,954
次の水準:$3,935
レジスタンス
$4,043
次の水準:$4,075
市場見通し:金は弱気の勢いを示しており、主要な移動平均線を下回って取引されています。RSIは33前後で、勢いの弱さと売られ過ぎの可能性を示唆しています。
強気シナリオ:$4,043を上抜ければ、回復を支える可能性があります。
弱気シナリオ:$3,954を下回ると、$3,935に向かう可能性があります。
取引のヒント:取引に入る前に、確認を待ちましょう。
価格は市場の参考スナップショットであり、リアルタイム価格を保証するものではありません。教育目的のみであり、金融アドバイスではありません。#IRSPlansLowerTaxDisclosurePenaltiesForCryptoCases #MarketsPriceJust10%ChanceOfFedHikeNextWeek
{spot}(XAUTUSDT)
$XAUT
概算価格 $3,997.93
短期トレンド
サポート
$3,954
次の水準:$3,935
レジスタンス
$4,043
次の水準:$4,075
市場見通し:金は弱気の勢いを示しており、主要な移動平均線を下回って取引されています。RSIは33前後で、勢いの弱さと売られ過ぎの可能性を示唆しています。
強気シナリオ:$4,043を上抜ければ、回復を支える可能性があります。
弱気シナリオ:$3,954を下回ると、$3,935に向かう可能性があります。
取引のヒント:取引に入る前に、確認を待ちましょう。
価格は市場の参考スナップショットであり、リアルタイム価格を保証するものではありません。教育目的のみであり、金融アドバイスではありません。#IRSPlansLowerTaxDisclosurePenaltiesForCryptoCases #MarketsPriceJust10%ChanceOfFedHikeNextWeek
308
·
--
ブリッシュ
翻訳参照
$BNB BNB Latest Market Analysis
Updated reference: October 24, 2026 · Binance Coin (BNB/USDT)
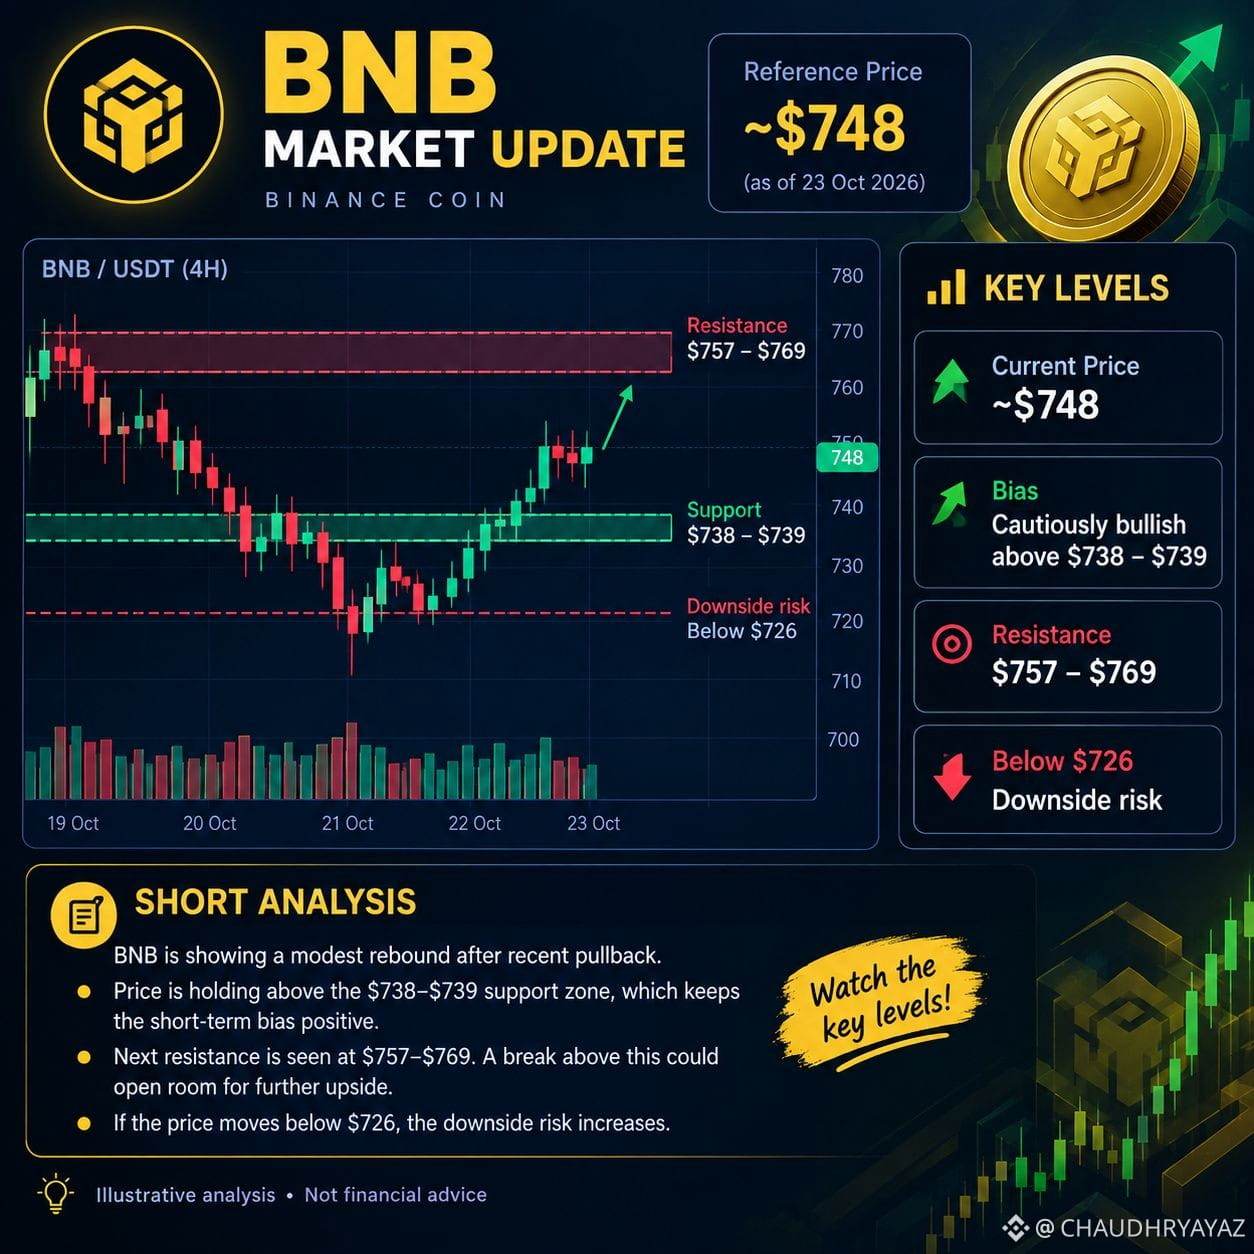
BNB is showing a possible bullish rebound, with price near $748 in the latest reference data.
Reference price: ~$748
Support: $738–$739
Resistance: $757–$769
Bullish target: A confirmed breakout above $757 could open the way toward higher levels.
Bearish risk: A drop below $726 could signal further weakness.
Market bias: Cautiously bullish above support. Wait for confirmation before entering a trade.
Note: These are reference levels, not a verified live Binance quote. This is not financial advice.#EthereumHoodiTestnetGlamsterdamHardForkDelayed #SwedishCentralBankUrgesEKronaReview
{spot}(BNBUSDT)
$BNB BNB Latest Market Analysis
Updated reference: October 24, 2026 · Binance Coin (BNB/USDT)
BNB is showing a possible bullish rebound, with price near $748 in the latest reference data.
Reference price: ~$748
Support: $738–$739
Resistance: $757–$769
Bullish target: A confirmed breakout above $757 could open the way toward higher levels.
Bearish risk: A drop below $726 could signal further weakness.
Market bias: Cautiously bullish above support. Wait for confirmation before entering a trade.
Note: These are reference levels, not a verified live Binance quote. This is not financial advice.#EthereumHoodiTestnetGlamsterdamHardForkDelayed #SwedishCentralBankUrgesEKronaReview
3
·
--
翻訳参照
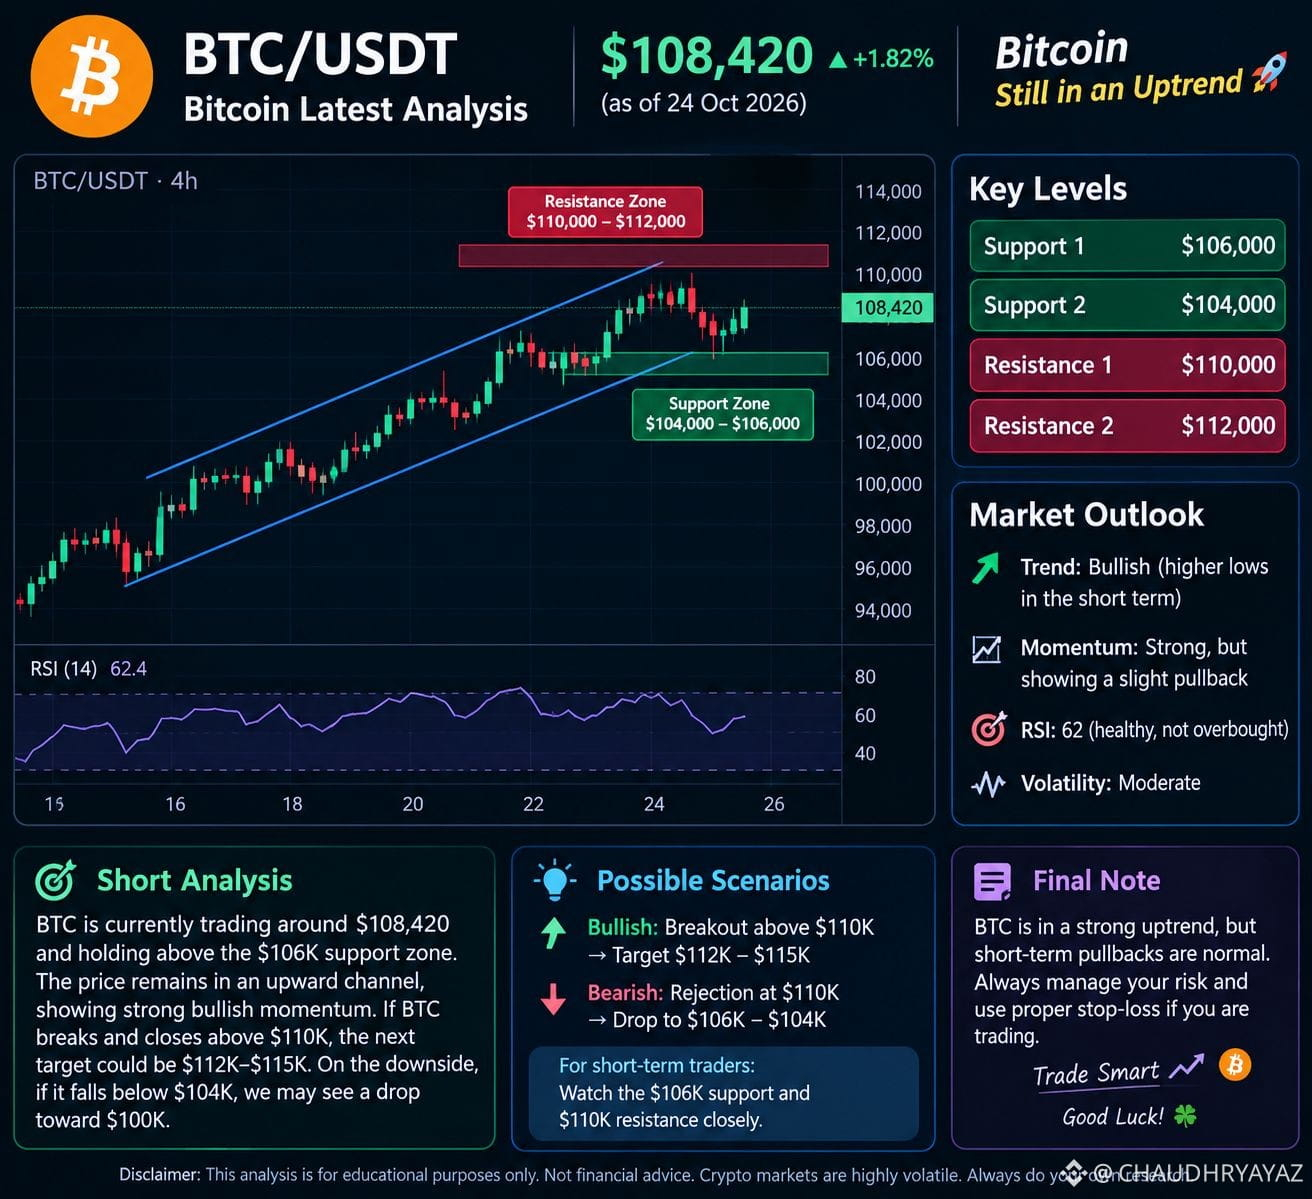
$BTC Key levels to watch
Support
$80,000–$81,000
Resistance
$83,000–$84,000
Bullish scenario: A confirmed breakout above $84,000 may open the way toward $86,000.
Bearish scenario: A break below $80,000 could bring further downside pressure.
📈 Trading view
Bias: Wait for confirmation.
Entry: Avoid chasing the price; watch support and breakout confirmation.
Risk management: Always set a stop-loss. These are potential scenarios, not guaranteed targets.
Educational analysis only, not financial advice. Crypto trading involves significant risk.#EthereumHoodiTestnetGlamsterdamHardForkDelayed #BinancePick
{spot}(BTCUSDT)
$BTC Key levels to watch
Support
$80,000–$81,000
Resistance
$83,000–$84,000
Bullish scenario: A confirmed breakout above $84,000 may open the way toward $86,000.
Bearish scenario: A break below $80,000 could bring further downside pressure.
📈 Trading view
Bias: Wait for confirmation.
Entry: Avoid chasing the price; watch support and breakout confirmation.
Risk management: Always set a stop-loss. These are potential scenarios, not guaranteed targets.
Educational analysis only, not financial advice. Crypto trading involves significant risk.#EthereumHoodiTestnetGlamsterdamHardForkDelayed #BinancePick
1
153
·
--
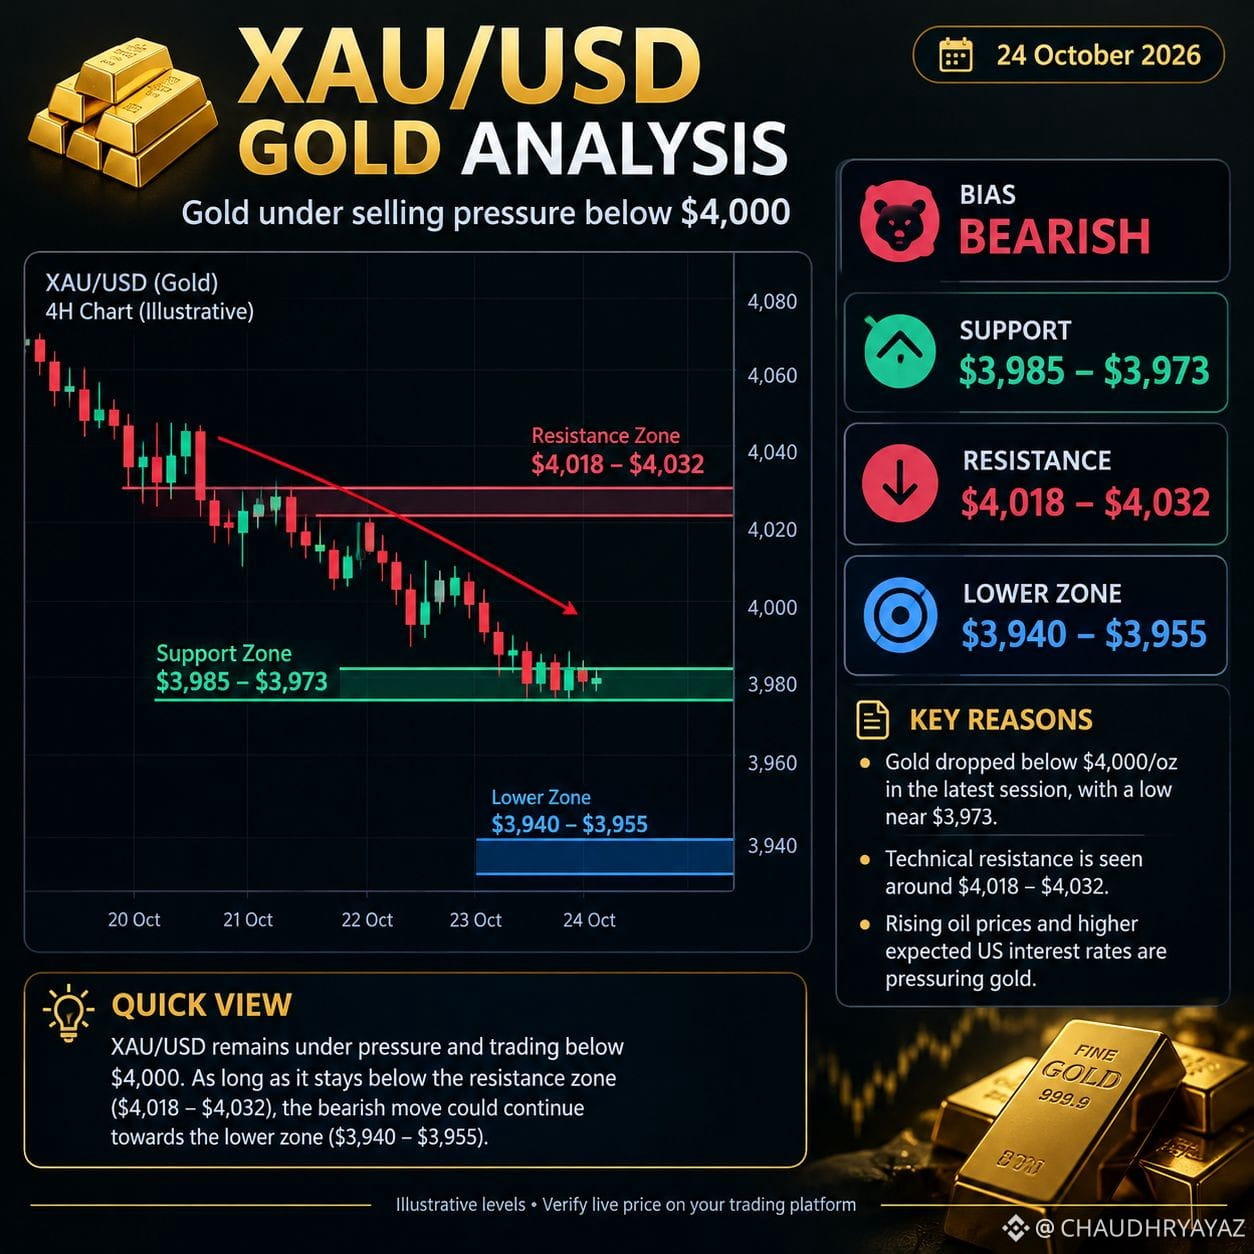
$XAU 24 2026年10月 · 短期見通し
金は強い売り圧力にさらされ、10月23日に重要な1オンスあたり4,000ドルの水準を下回りました。原油価格の上昇と米国の金利上昇予想が、金相場の重しとなっています。
サポート:$3,985–$3,973
レジスタンス:$4,018–$4,032
次の下値目処:$3,940–$3,955
見通し:価格がレジスタンスを下回っている間は弱気。#EthereumHoodiTestnetGlamsterdamHardForkDelayed #BitcoinHashrateHitsSevenMonthHigh
{future}(XAUUSDT)
$XAU 24 2026年10月 · 短期見通し
金は強い売り圧力にさらされ、10月23日に重要な1オンスあたり4,000ドルの水準を下回りました。原油価格の上昇と米国の金利上昇予想が、金相場の重しとなっています。
サポート:$3,985–$3,973
レジスタンス:$4,018–$4,032
次の下値目処:$3,940–$3,955
見通し:価格がレジスタンスを下回っている間は弱気。#EthereumHoodiTestnetGlamsterdamHardForkDelayed #BitcoinHashrateHitsSevenMonthHigh
金は強い売り圧力にさらされ、10月23日に重要な1オンスあたり4,000ドルの水準を下回りました。原油価格の上昇と米国の金利上昇予想が、金相場の重しとなっています。
サポート:$3,985–$3,973
レジスタンス:$4,018–$4,032
次の下値目処:$3,940–$3,955
見通し:価格がレジスタンスを下回っている間は弱気。#EthereumHoodiTestnetGlamsterdamHardForkDelayed #BitcoinHashrateHitsSevenMonthHigh
137
·
--
翻訳参照
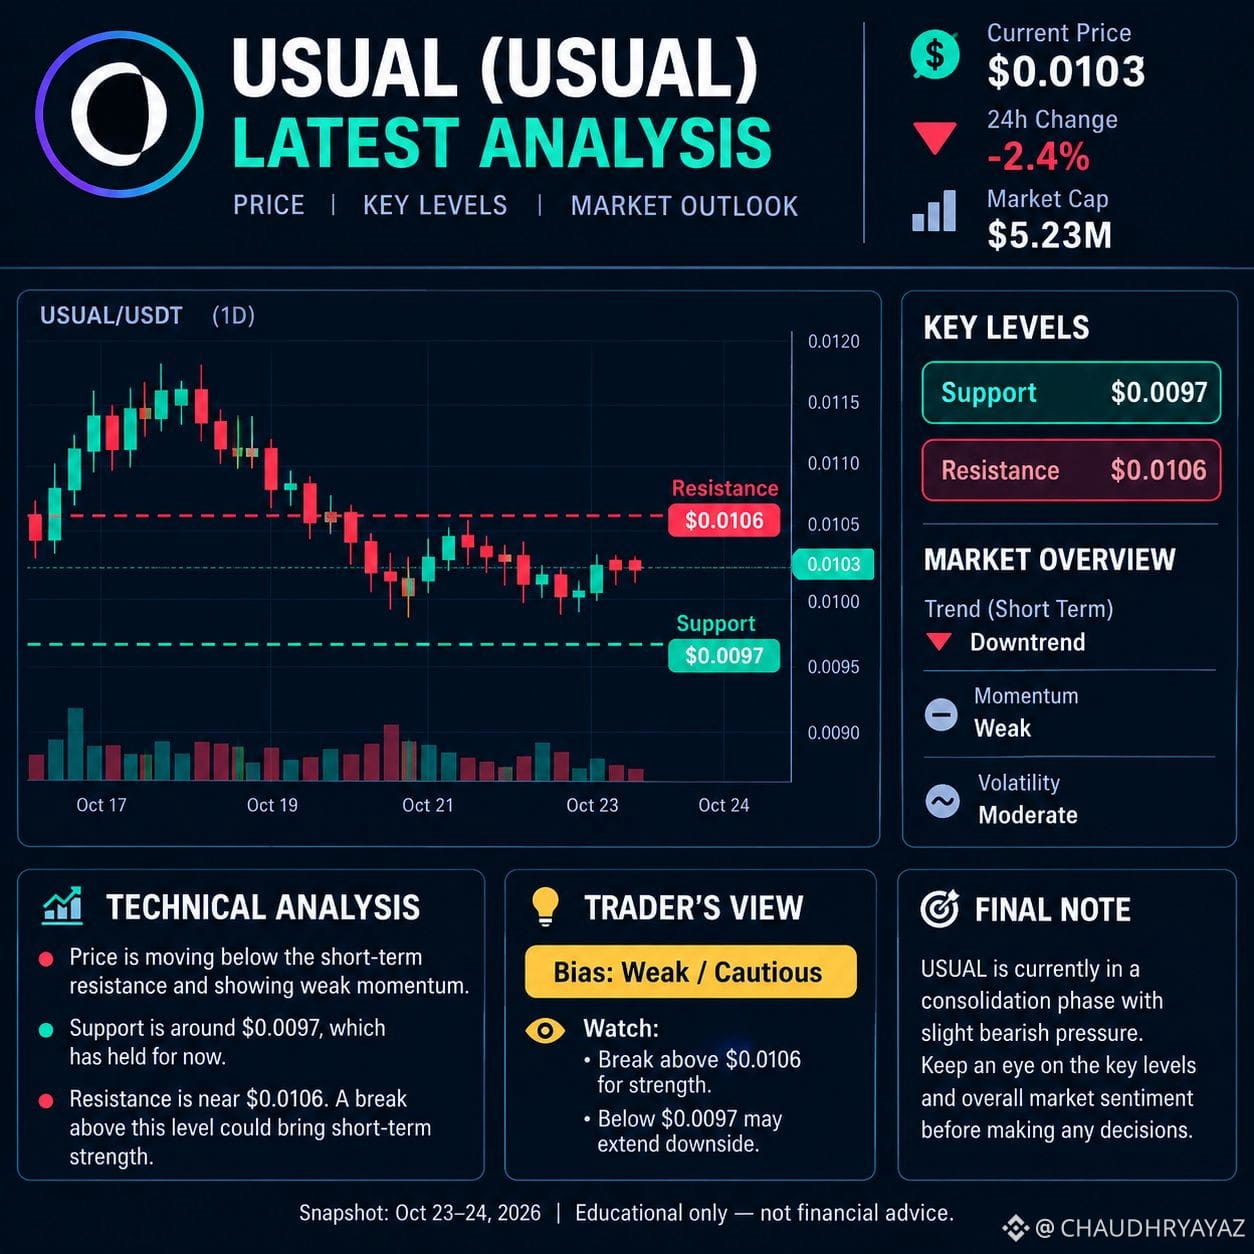
$USUAL
📈 Technical outlook
Support $0.0097
Resistance $0.0106
Short-term trend
🔍 Trading view
Bullish: A breakout above $0.0106 could signal short-term strength.
Bearish: A drop below $0.0097 could lead to further downside.
Strategy: Wait for confirmation rather than entering on a guess.
The levels above are based on the retrieved market snapshot, not a verified live Binance chart. Crypto is highly volatile; this is educational analysis, not financial advice.#BinancePick #EarningsSeason
{spot}(USUALUSDT)
$USUAL
📈 Technical outlook
Support $0.0097
Resistance $0.0106
Short-term trend
🔍 Trading view
Bullish: A breakout above $0.0106 could signal short-term strength.
Bearish: A drop below $0.0097 could lead to further downside.
Strategy: Wait for confirmation rather than entering on a guess.
The levels above are based on the retrieved market snapshot, not a verified live Binance chart. Crypto is highly volatile; this is educational analysis, not financial advice.#BinancePick #EarningsSeason
777
·
--
翻訳参照
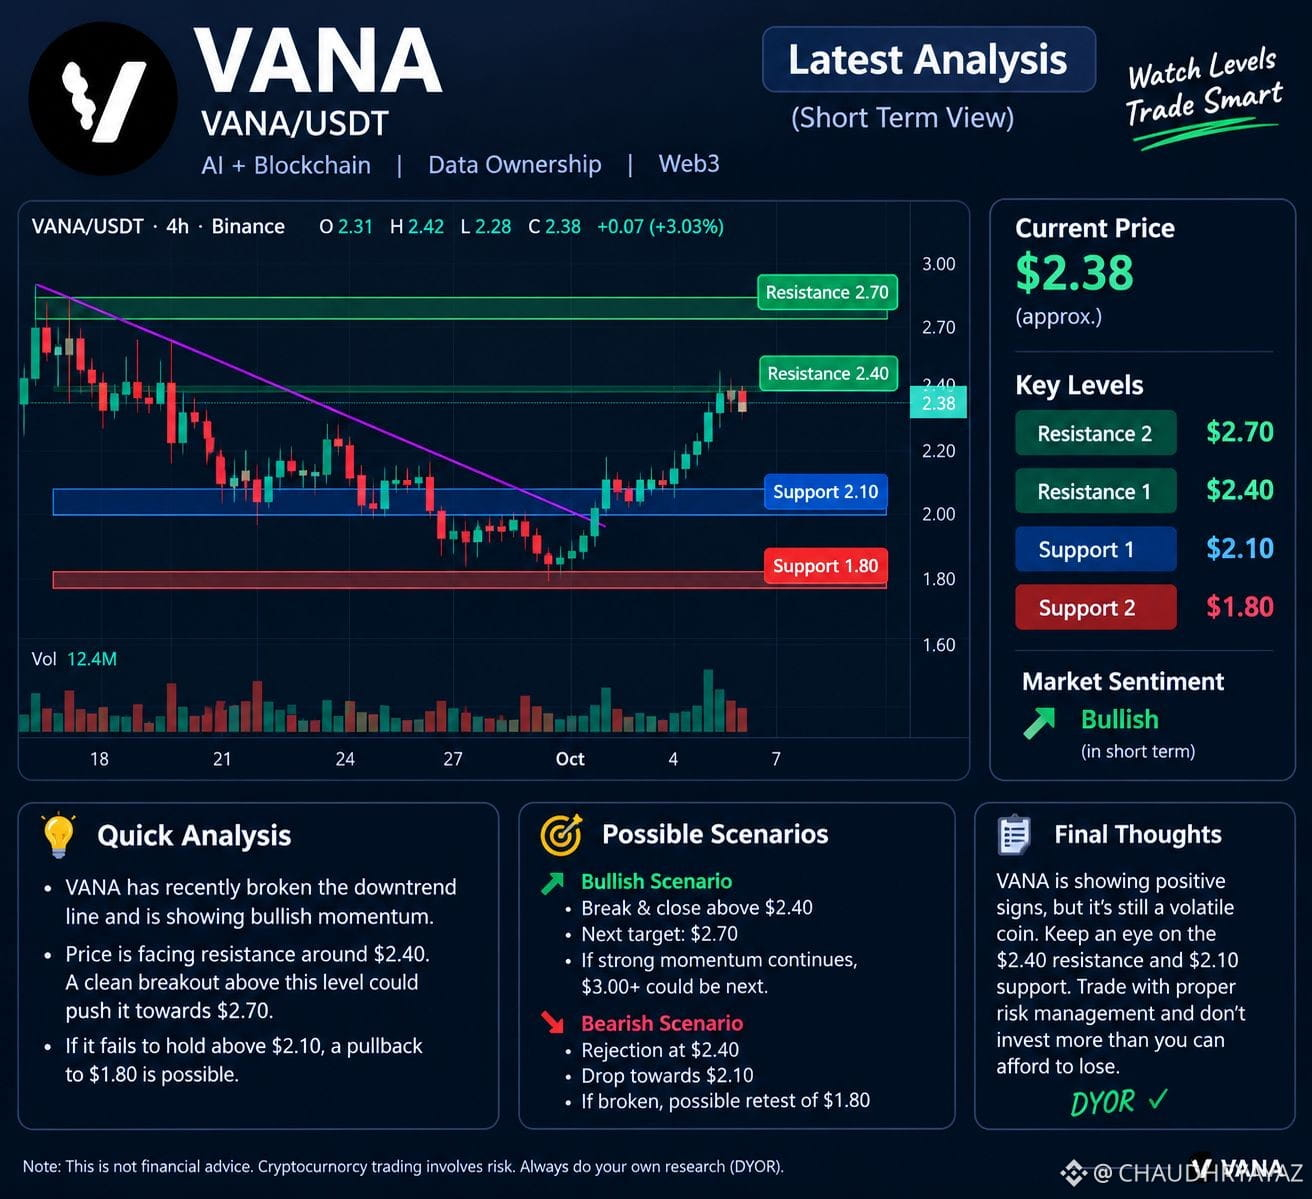
$VANA Current price: Approximately $2.38 (illustrative).
Resistance: $2.40 and $2.70.
Support: $2.10 and $1.80.
Bullish scenario: A strong breakout above $2.40 could open a move toward $2.70 and potentially $3.00.
Bearish scenario: Rejection at $2.40 could send price toward $2.10 or $1.80.
My view: VANA may have short-term bullish momentum, but confirmation above $2.40 is important. Wait for confirmation and manage risk carefully.#SwedishCentralBankUrgesEKronaReview #BitcoinHashrateHitsSevenMonthHigh
{spot}(VANAUSDT)
$VANA Current price: Approximately $2.38 (illustrative).
Resistance: $2.40 and $2.70.
Support: $2.10 and $1.80.
Bullish scenario: A strong breakout above $2.40 could open a move toward $2.70 and potentially $3.00.
Bearish scenario: Rejection at $2.40 could send price toward $2.10 or $1.80.
My view: VANA may have short-term bullish momentum, but confirmation above $2.40 is important. Wait for confirmation and manage risk carefully.#SwedishCentralBankUrgesEKronaReview #BitcoinHashrateHitsSevenMonthHigh
331
·
--
翻訳参照
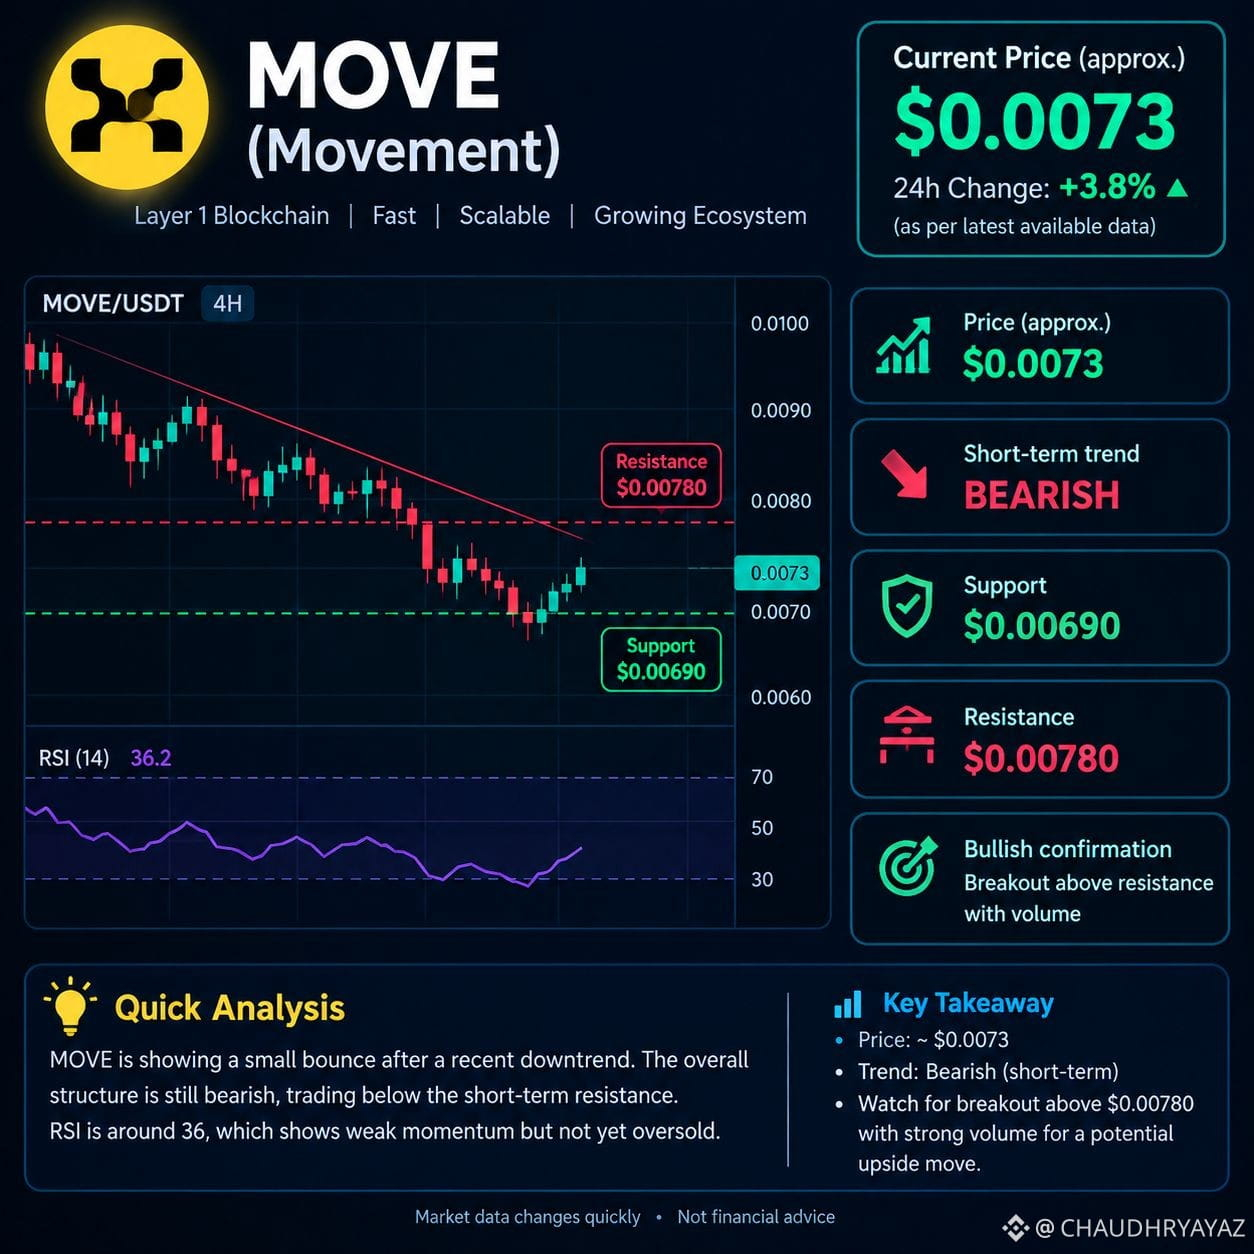
$MOVE Level Price
Resistance $0.00780
Current price ~$0.00730
Support $0.00690
Quick analysis: MOVE is showing a small recovery, but the overall trend remains bearish. A breakout above $0.00780 with strong volume could signal bullish momentum. A drop below $0.00690 may indicate further downside.
MOVE analysis picture
The infographic above shows the price chart, support, resistance, and short-term trend.
My suggestion: Avoid rushing into a trade. Wait for confirmation above resistance or a clear reaction at support. This is technical analysis, not a guaranteed prediction.#BitcoinHashrateHitsSevenMonthHigh #PepeJumps14%ToLeadAltcoinRebound
{spot}(MOVEUSDT)
$MOVE Level Price
Resistance $0.00780
Current price ~$0.00730
Support $0.00690
Quick analysis: MOVE is showing a small recovery, but the overall trend remains bearish. A breakout above $0.00780 with strong volume could signal bullish momentum. A drop below $0.00690 may indicate further downside.
MOVE analysis picture
The infographic above shows the price chart, support, resistance, and short-term trend.
My suggestion: Avoid rushing into a trade. Wait for confirmation above resistance or a clear reaction at support. This is technical analysis, not a guaranteed prediction.#BitcoinHashrateHitsSevenMonthHigh #PepeJumps14%ToLeadAltcoinRebound
252
ログインして、さらにコンテンツを読む
厳選トピックで世界の暗号資産トレーダーの仲間入り
⚡️ 暗号資産に関する最新かつ有益な情報が見つかります。
💬 世界最大の暗号資産取引所から信頼されています。
👍 認証を受けたクリエイターから、有益なインサイトを得られます。
メール / 電話番号