

AH ASIF
7 投稿

AH ASIF
報告
ユーザーをブロック
取引を発注
高頻度トレーダー
2.1年
2 フォロー
2 フォロワー
0 いいね
投稿
ポートフォリオ
·
--
翻訳参照
#BinanceLaunchesBinanceIntelligence #Bitcoin❗ #BNB走势 #USDT #BTC走势分析
Bitcoin (BTC) is the world’s first decentralized cryptocurrency. It works without a central bank and uses blockchain technology to record transactions.
BTC has a limited supply: Only 21 million Bitcoin can ever exist.
Price: Bitcoin is highly volatile, so its price can rise or fall quickly.
Market trend: Traders usually watch support, resistance, trading volume, and market sentiment.
Long-term view: Many investors consider Bitcoin a digital asset and a possible store of value, but it also carries significant risk.
Important: Never invest money you cannot afford to lose, especially because crypto prices can change very quickly.
#BinanceLaunchesBinanceIntelligence #Bitcoin❗ #BNB走势 #USDT #BTC走势分析
Bitcoin (BTC) is the world’s first decentralized cryptocurrency. It works without a central bank and uses blockchain technology to record transactions.
BTC has a limited supply: Only 21 million Bitcoin can ever exist.
Price: Bitcoin is highly volatile, so its price can rise or fall quickly.
Market trend: Traders usually watch support, resistance, trading volume, and market sentiment.
Long-term view: Many investors consider Bitcoin a digital asset and a possible store of value, but it also carries significant risk.
Important: Never invest money you cannot afford to lose, especially because crypto prices can change very quickly.
Bitcoin (BTC) is the world’s first decentralized cryptocurrency. It works without a central bank and uses blockchain technology to record transactions.
BTC has a limited supply: Only 21 million Bitcoin can ever exist.
Price: Bitcoin is highly volatile, so its price can rise or fall quickly.
Market trend: Traders usually watch support, resistance, trading volume, and market sentiment.
Long-term view: Many investors consider Bitcoin a digital asset and a possible store of value, but it also carries significant risk.
Important: Never invest money you cannot afford to lose, especially because crypto prices can change very quickly.
91
·
--
#Bitcoin❗ #Bianace #BNB_Market_Update #CoinClub #All_Time_High
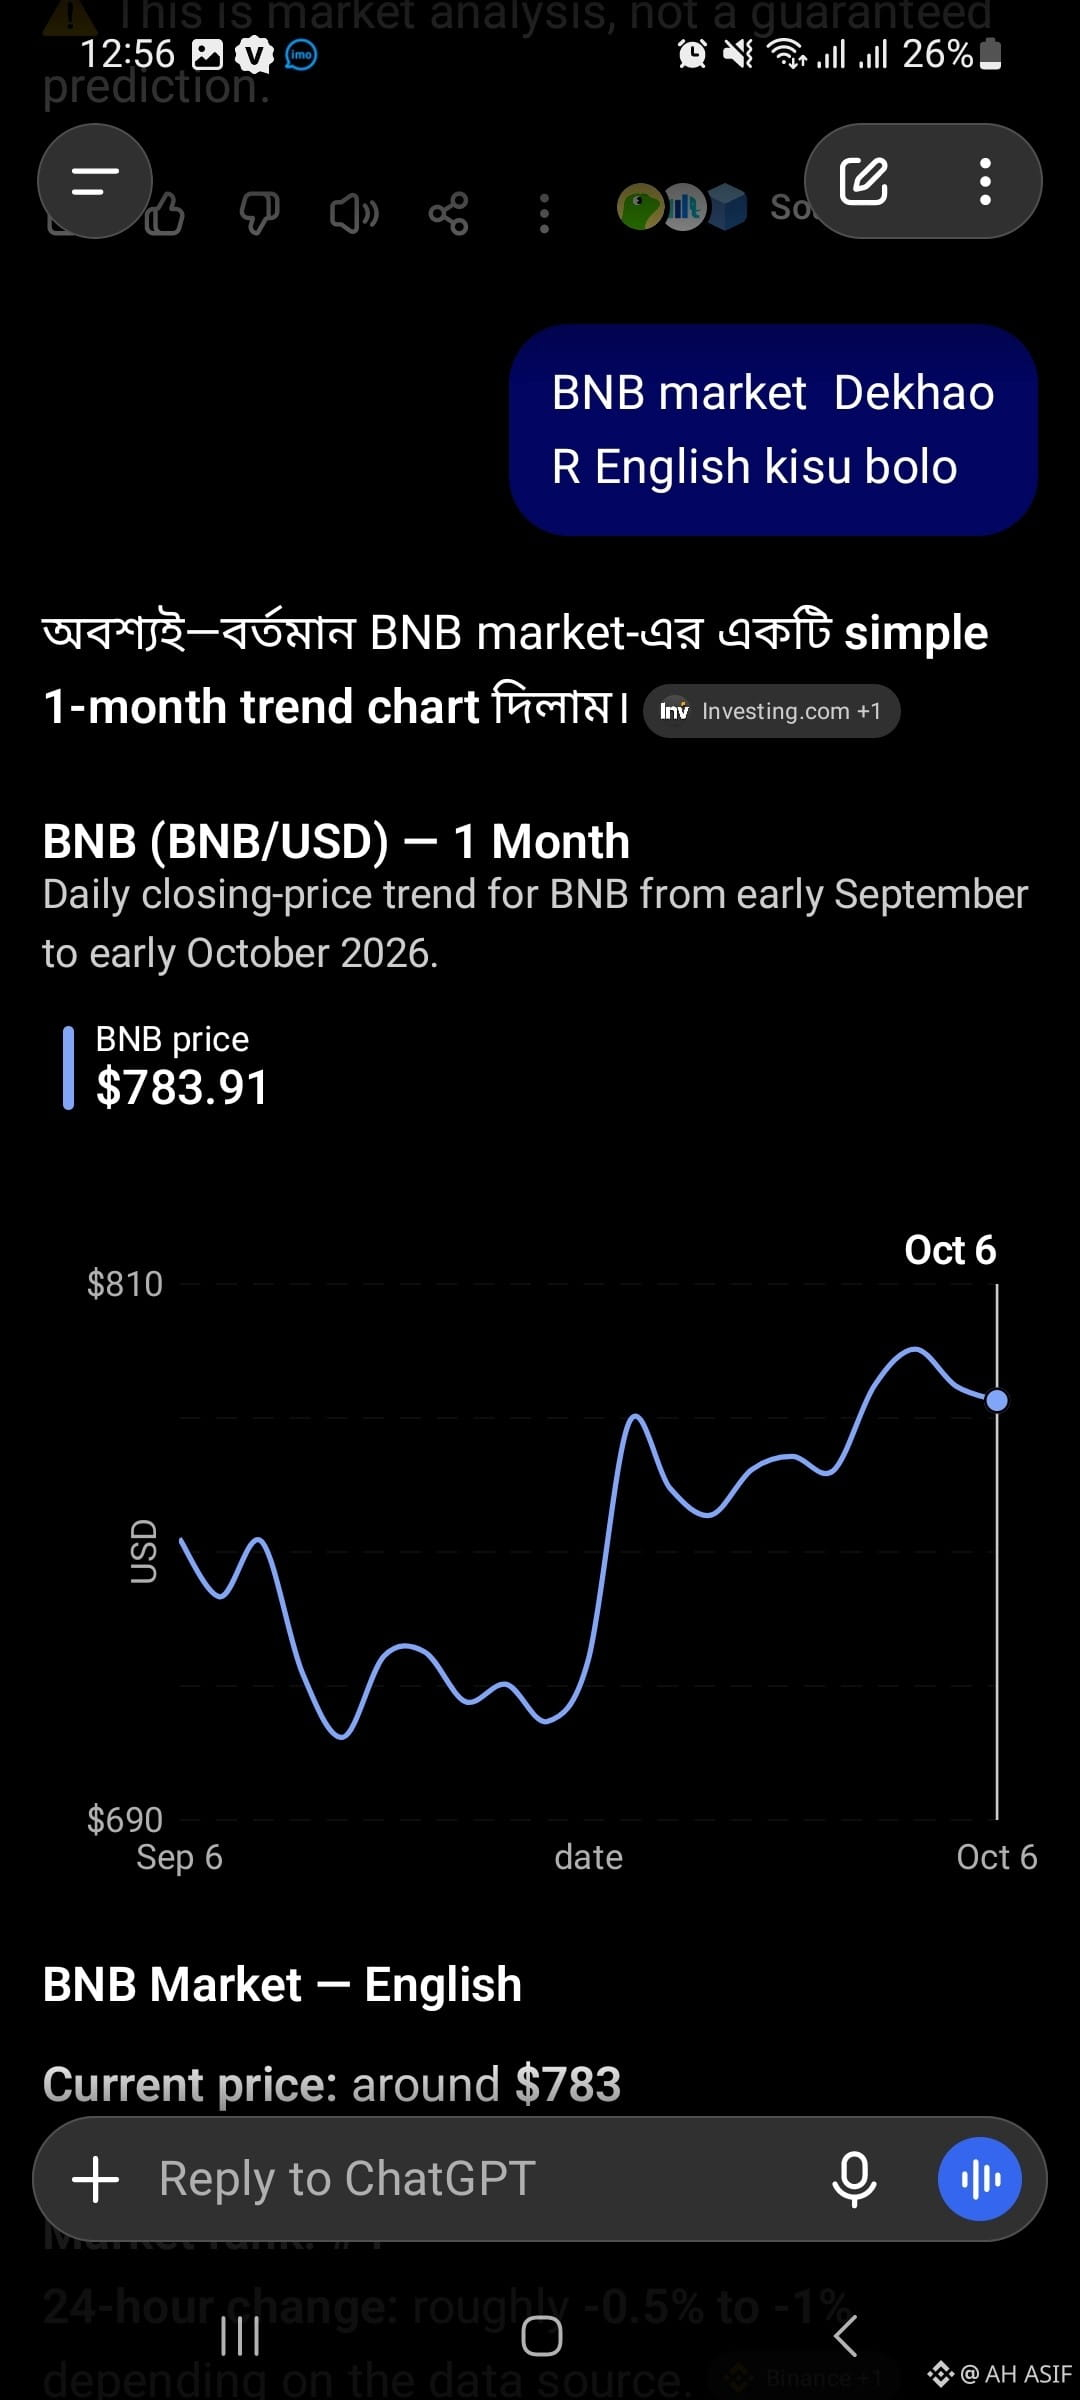
BNB市場 — 英語
現在価格:約783ドル
時価総額:約1,040億ドル
市場ランキング:4位
24時間の変動率:データソースによって異なりますが、およそ-0.5%~-1%。�
Binance +1
1か月間のパフォーマンス:BNBは過去30日間でおよそ+5%です。�
Bybit
重要な価格帯:
🟢 サポート:約760~770ドル
🔴 レジスタンス:約800~810ドル
🚀 810ドルを上回る水準を維持できれば、チャートはさらに強気になる可能性があります。
⚠️ 760ドル付近を下回ると、短期的な値動きの構造が弱まるでしょう。
簡単な英語:
「BNBは過去1か月間で力強く回復しました。現在は783ドル付近で取引されており、重要な800~810ドルのレジスタンスゾーンに近づいています。このゾーンを力強く上抜ければ、さらなる上昇を示唆する可能性があります。一方、上値を抑えられた場合は、価格が760~770ドルのサポートゾーンまで戻る可能性があります。」
#Bitcoin❗ #Bianace #BNB_Market_Update #CoinClub #All_Time_High
BNB市場 — 英語
現在価格:約783ドル
時価総額:約1,040億ドル
市場ランキング:4位
24時間の変動率:データソースによって異なりますが、およそ-0.5%~-1%。�
Binance +1
1か月間のパフォーマンス:BNBは過去30日間でおよそ+5%です。�
Bybit
重要な価格帯:
🟢 サポート:約760~770ドル
🔴 レジスタンス:約800~810ドル
🚀 810ドルを上回る水準を維持できれば、チャートはさらに強気になる可能性があります。
⚠️ 760ドル付近を下回ると、短期的な値動きの構造が弱まるでしょう。
簡単な英語:
「BNBは過去1か月間で力強く回復しました。現在は783ドル付近で取引されており、重要な800~810ドルのレジスタンスゾーンに近づいています。このゾーンを力強く上抜ければ、さらなる上昇を示唆する可能性があります。一方、上値を抑えられた場合は、価格が760~770ドルのサポートゾーンまで戻る可能性があります。」
BNB市場 — 英語
現在価格:約783ドル
時価総額:約1,040億ドル
市場ランキング:4位
24時間の変動率:データソースによって異なりますが、およそ-0.5%~-1%。�
Binance +1
1か月間のパフォーマンス:BNBは過去30日間でおよそ+5%です。�
Bybit
重要な価格帯:
🟢 サポート:約760~770ドル
🔴 レジスタンス:約800~810ドル
🚀 810ドルを上回る水準を維持できれば、チャートはさらに強気になる可能性があります。
⚠️ 760ドル付近を下回ると、短期的な値動きの構造が弱まるでしょう。
簡単な英語:
「BNBは過去1か月間で力強く回復しました。現在は783ドル付近で取引されており、重要な800~810ドルのレジスタンスゾーンに近づいています。このゾーンを力強く上抜ければ、さらなる上昇を示唆する可能性があります。一方、上値を抑えられた場合は、価格が760~770ドルのサポートゾーンまで戻る可能性があります。」
36
·
--
翻訳参照
#BinanceLaunchesBinanceIntelligence
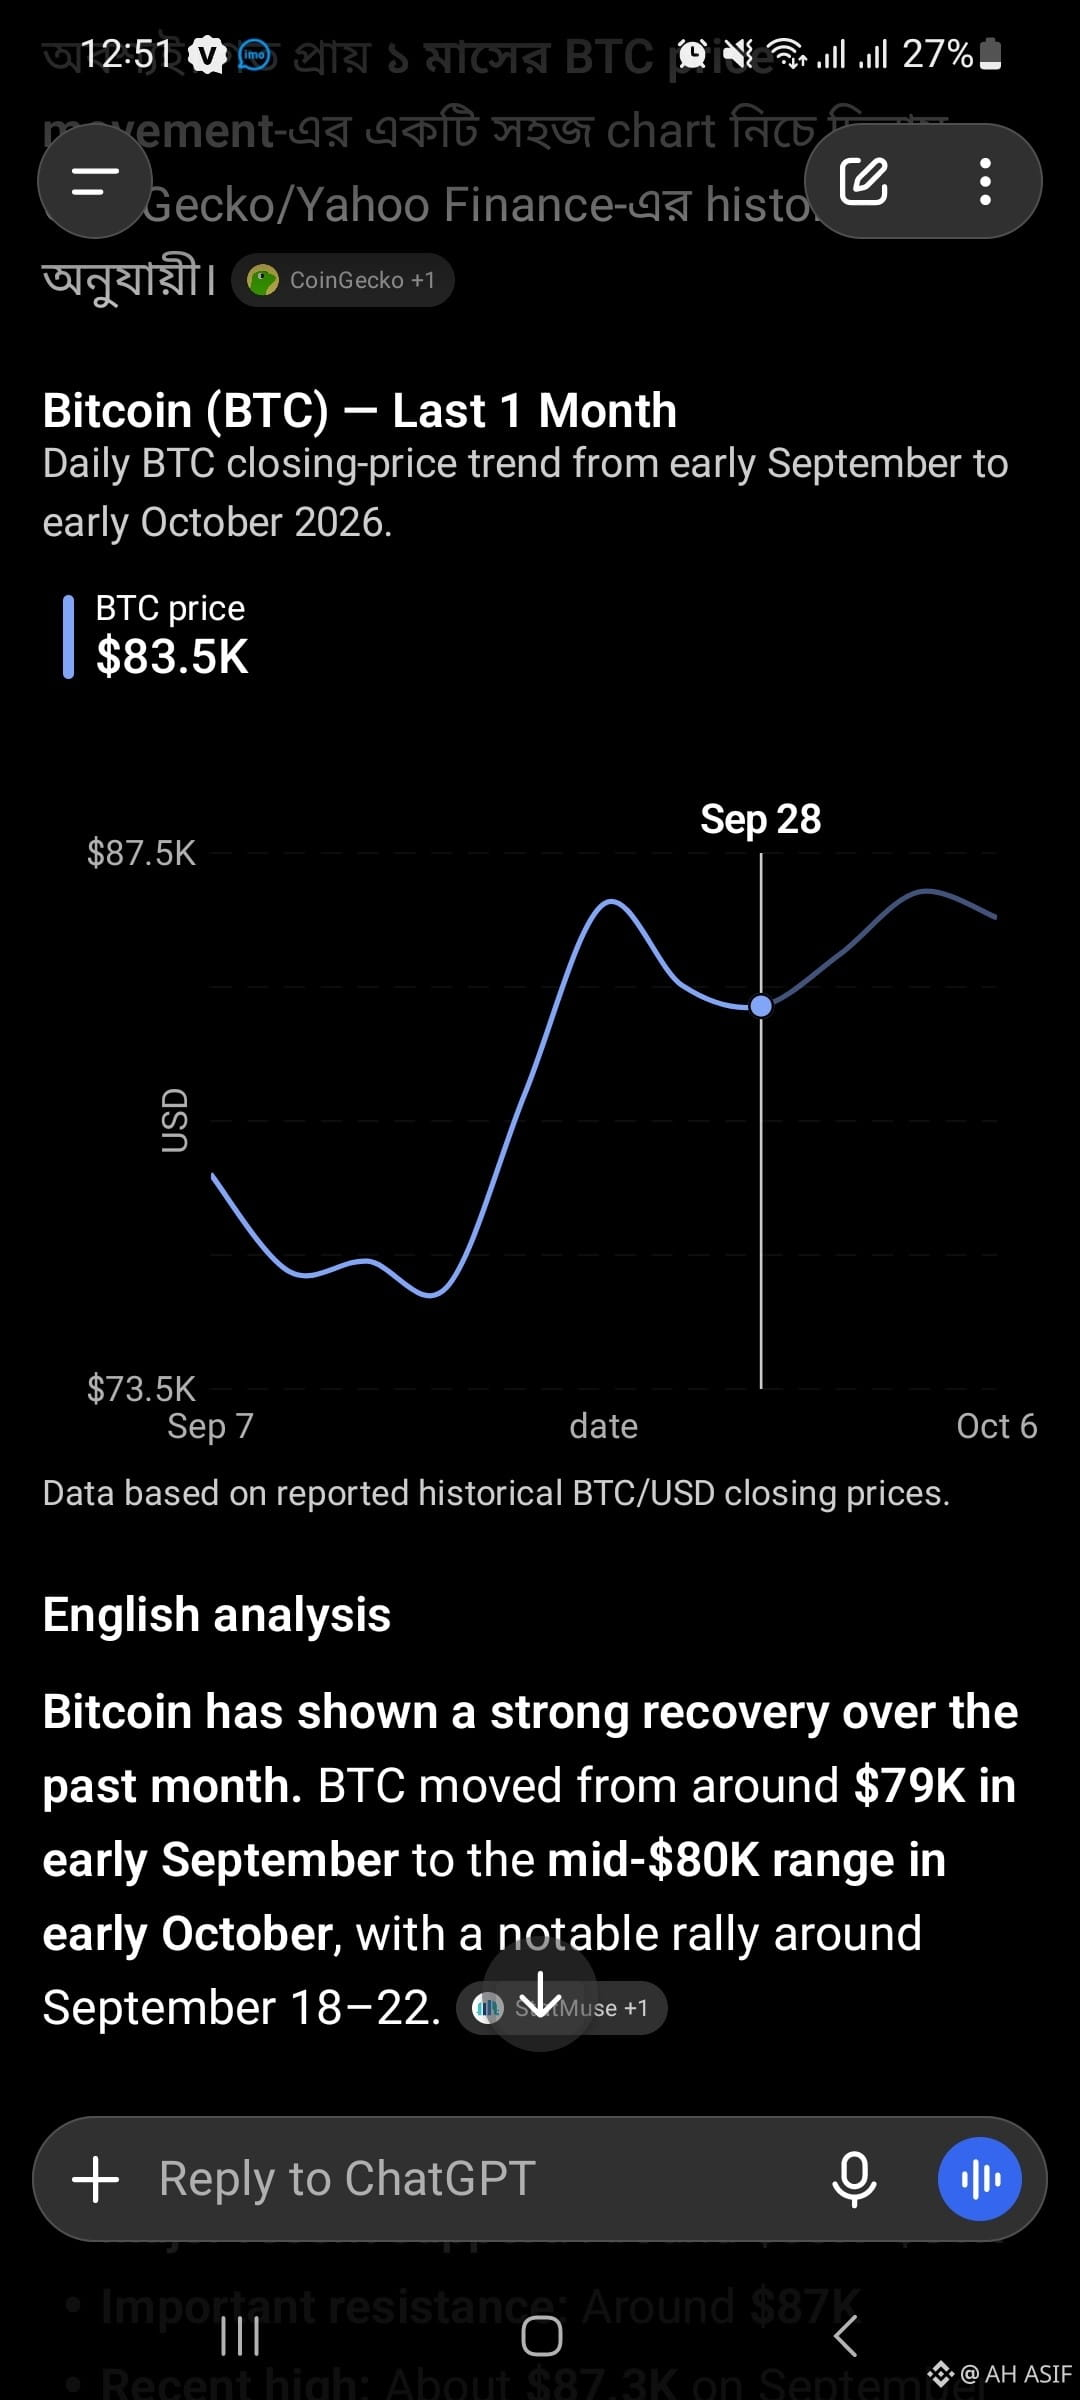
Bitcoin has shown a strong recovery over the past month. BTC moved from around $79K in early September to the mid-$80K range in early October, with a notable rally around September 18–22. �
StatMuse +1
Monthly direction: Generally bullish 📈
Major recent support: Around $80K–$81K
Important resistance: Around $87K
Recent high: About $87.3K on September 21–23
Current zone: Mid-$80K
Key point: BTC needs to break and hold above roughly $87K–$87.5K to strengthen the bullish setup; $81K is an important support level. �
blockchain-council.org
In simple English:
“Bitcoin has recovered strongly during the last month. The price is now testing an important resistance area near $87K. If BTC breaks above this level with strong buying pressure, the next move could be higher. If it fails, the $81K area becomes an important support zone.”
#BinanceLaunchesBinanceIntelligence
Bitcoin has shown a strong recovery over the past month. BTC moved from around $79K in early September to the mid-$80K range in early October, with a notable rally around September 18–22. �
StatMuse +1
Monthly direction: Generally bullish 📈
Major recent support: Around $80K–$81K
Important resistance: Around $87K
Recent high: About $87.3K on September 21–23
Current zone: Mid-$80K
Key point: BTC needs to break and hold above roughly $87K–$87.5K to strengthen the bullish setup; $81K is an important support level. �
blockchain-council.org
In simple English:
“Bitcoin has recovered strongly during the last month. The price is now testing an important resistance area near $87K. If BTC breaks above this level with strong buying pressure, the next move could be higher. If it fails, the $81K area becomes an important support zone.”
Bitcoin has shown a strong recovery over the past month. BTC moved from around $79K in early September to the mid-$80K range in early October, with a notable rally around September 18–22. �
StatMuse +1
Monthly direction: Generally bullish 📈
Major recent support: Around $80K–$81K
Important resistance: Around $87K
Recent high: About $87.3K on September 21–23
Current zone: Mid-$80K
Key point: BTC needs to break and hold above roughly $87K–$87.5K to strengthen the bullish setup; $81K is an important support level. �
blockchain-council.org
In simple English:
“Bitcoin has recovered strongly during the last month. The price is now testing an important resistance area near $87K. If BTC breaks above this level with strong buying pressure, the next move could be higher. If it fails, the $81K area becomes an important support zone.”
51
·
--
翻訳参照
#BinanceLaunchesBinanceIntelligence
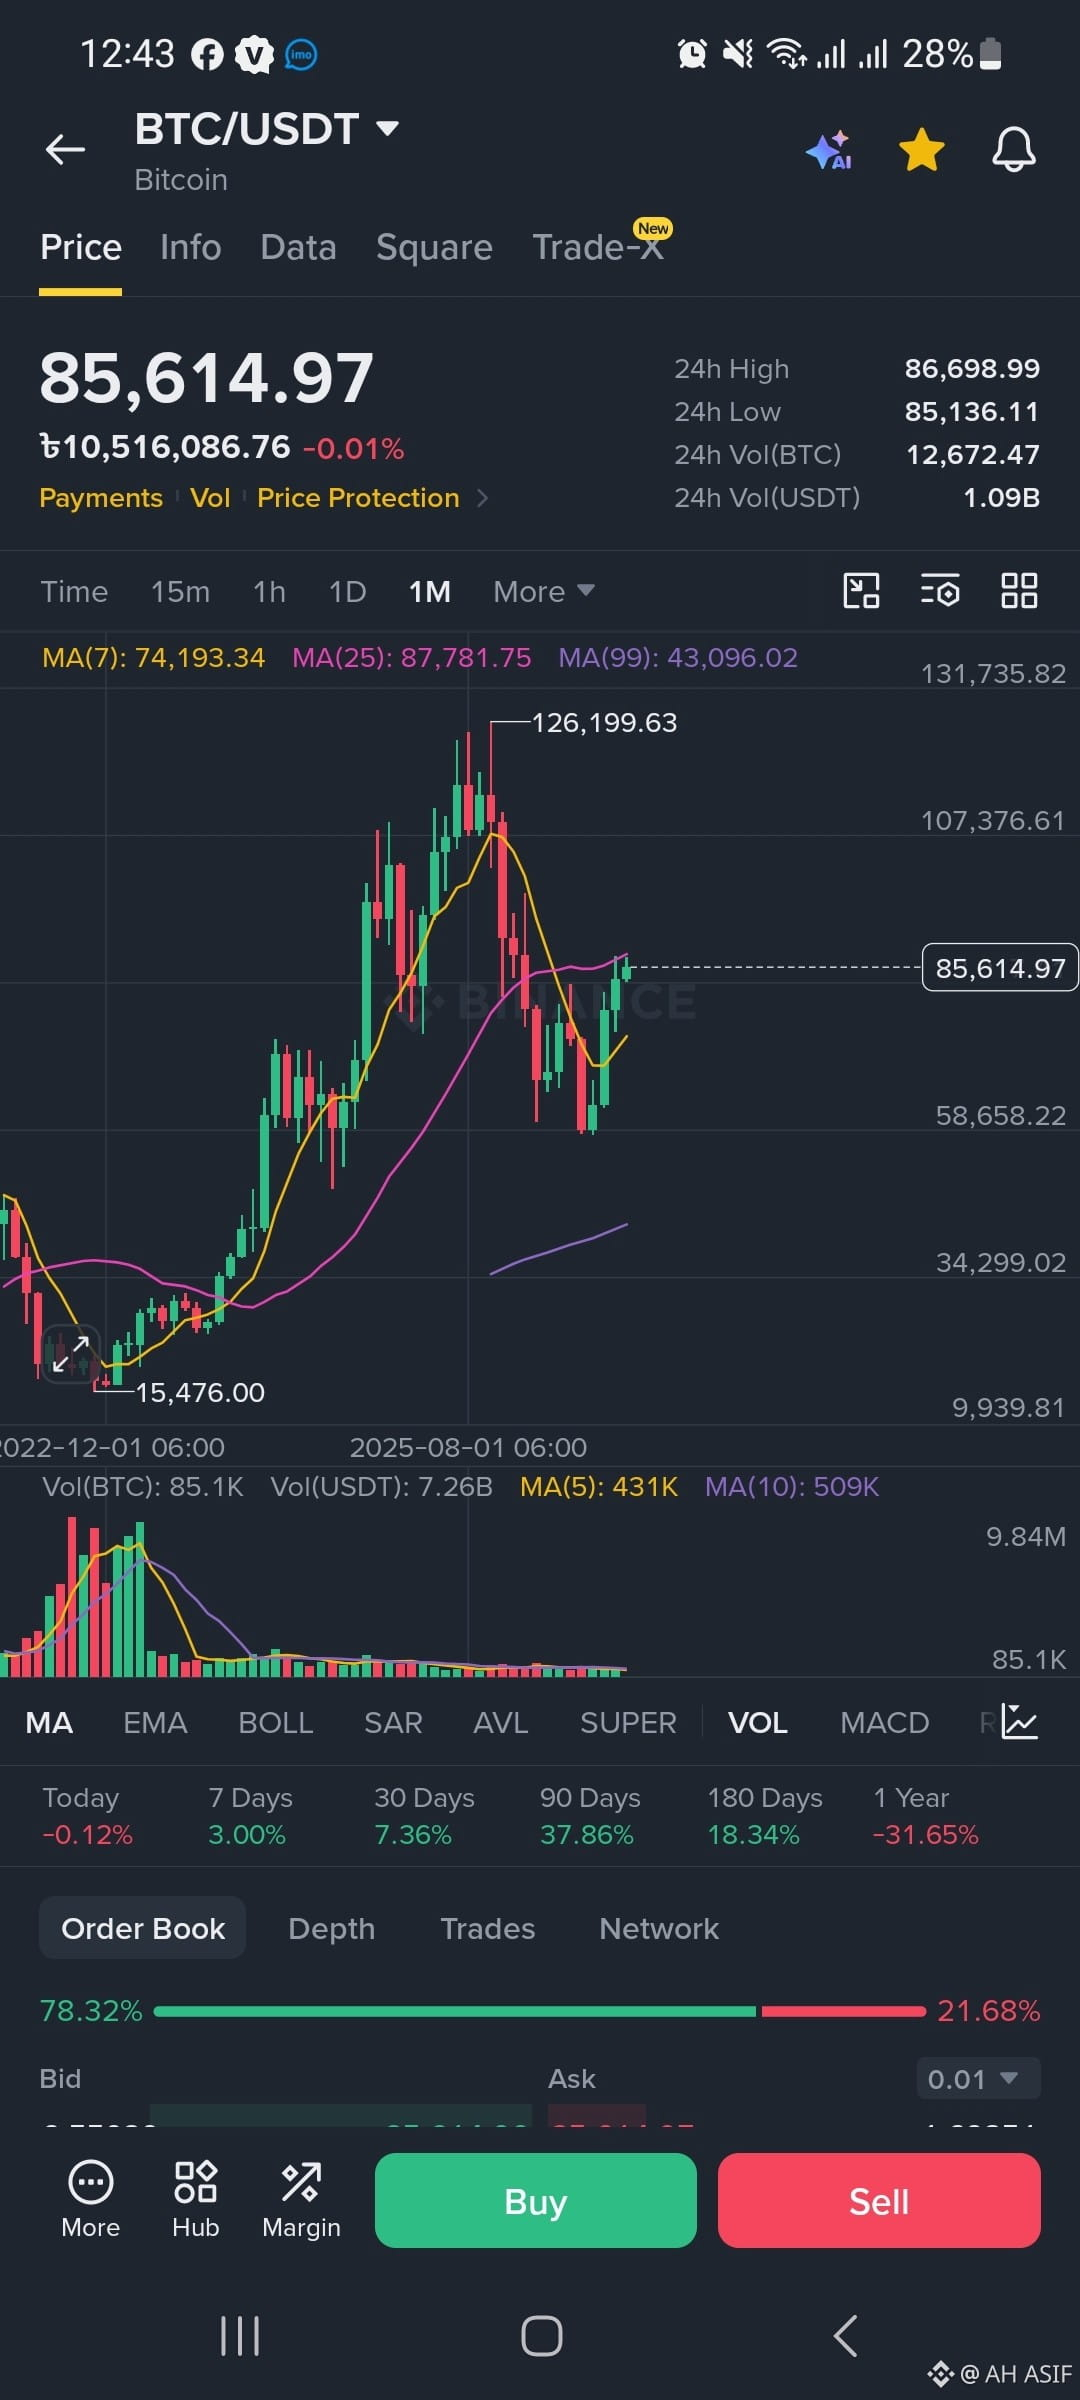
Important Resistance Areas
The main levels visible are:
$86.7K: Current 24-hour high
$87.8K: MA(25)
$100K+: Psychological/technical resistance area
$107K: Major chart level
$126.2K: Previous major high shown on the chart
A sustained move above $87K–$88K would make the chart look stronger. A move toward the previous high would require BTC to overcome several resistance areas along the way.
📊 Volume
The volume shown at the bottom has become much smaller compared with the huge volume during the earlier major price movements.
That means the current recovery should be watched together with volume confirmation. A strong price breakout accompanied by increasing volume is generally more convincing than a breakout with weak volume.
#BinanceLaunchesBinanceIntelligence
Important Resistance Areas
The main levels visible are:
$86.7K: Current 24-hour high
$87.8K: MA(25)
$100K+: Psychological/technical resistance area
$107K: Major chart level
$126.2K: Previous major high shown on the chart
A sustained move above $87K–$88K would make the chart look stronger. A move toward the previous high would require BTC to overcome several resistance areas along the way.
📊 Volume
The volume shown at the bottom has become much smaller compared with the huge volume during the earlier major price movements.
That means the current recovery should be watched together with volume confirmation. A strong price breakout accompanied by increasing volume is generally more convincing than a breakout with weak volume.
Important Resistance Areas
The main levels visible are:
$86.7K: Current 24-hour high
$87.8K: MA(25)
$100K+: Psychological/technical resistance area
$107K: Major chart level
$126.2K: Previous major high shown on the chart
A sustained move above $87K–$88K would make the chart look stronger. A move toward the previous high would require BTC to overcome several resistance areas along the way.
📊 Volume
The volume shown at the bottom has become much smaller compared with the huge volume during the earlier major price movements.
That means the current recovery should be watched together with volume confirmation. A strong price breakout accompanied by increasing volume is generally more convincing than a breakout with weak volume.
74
·
--
翻訳参照
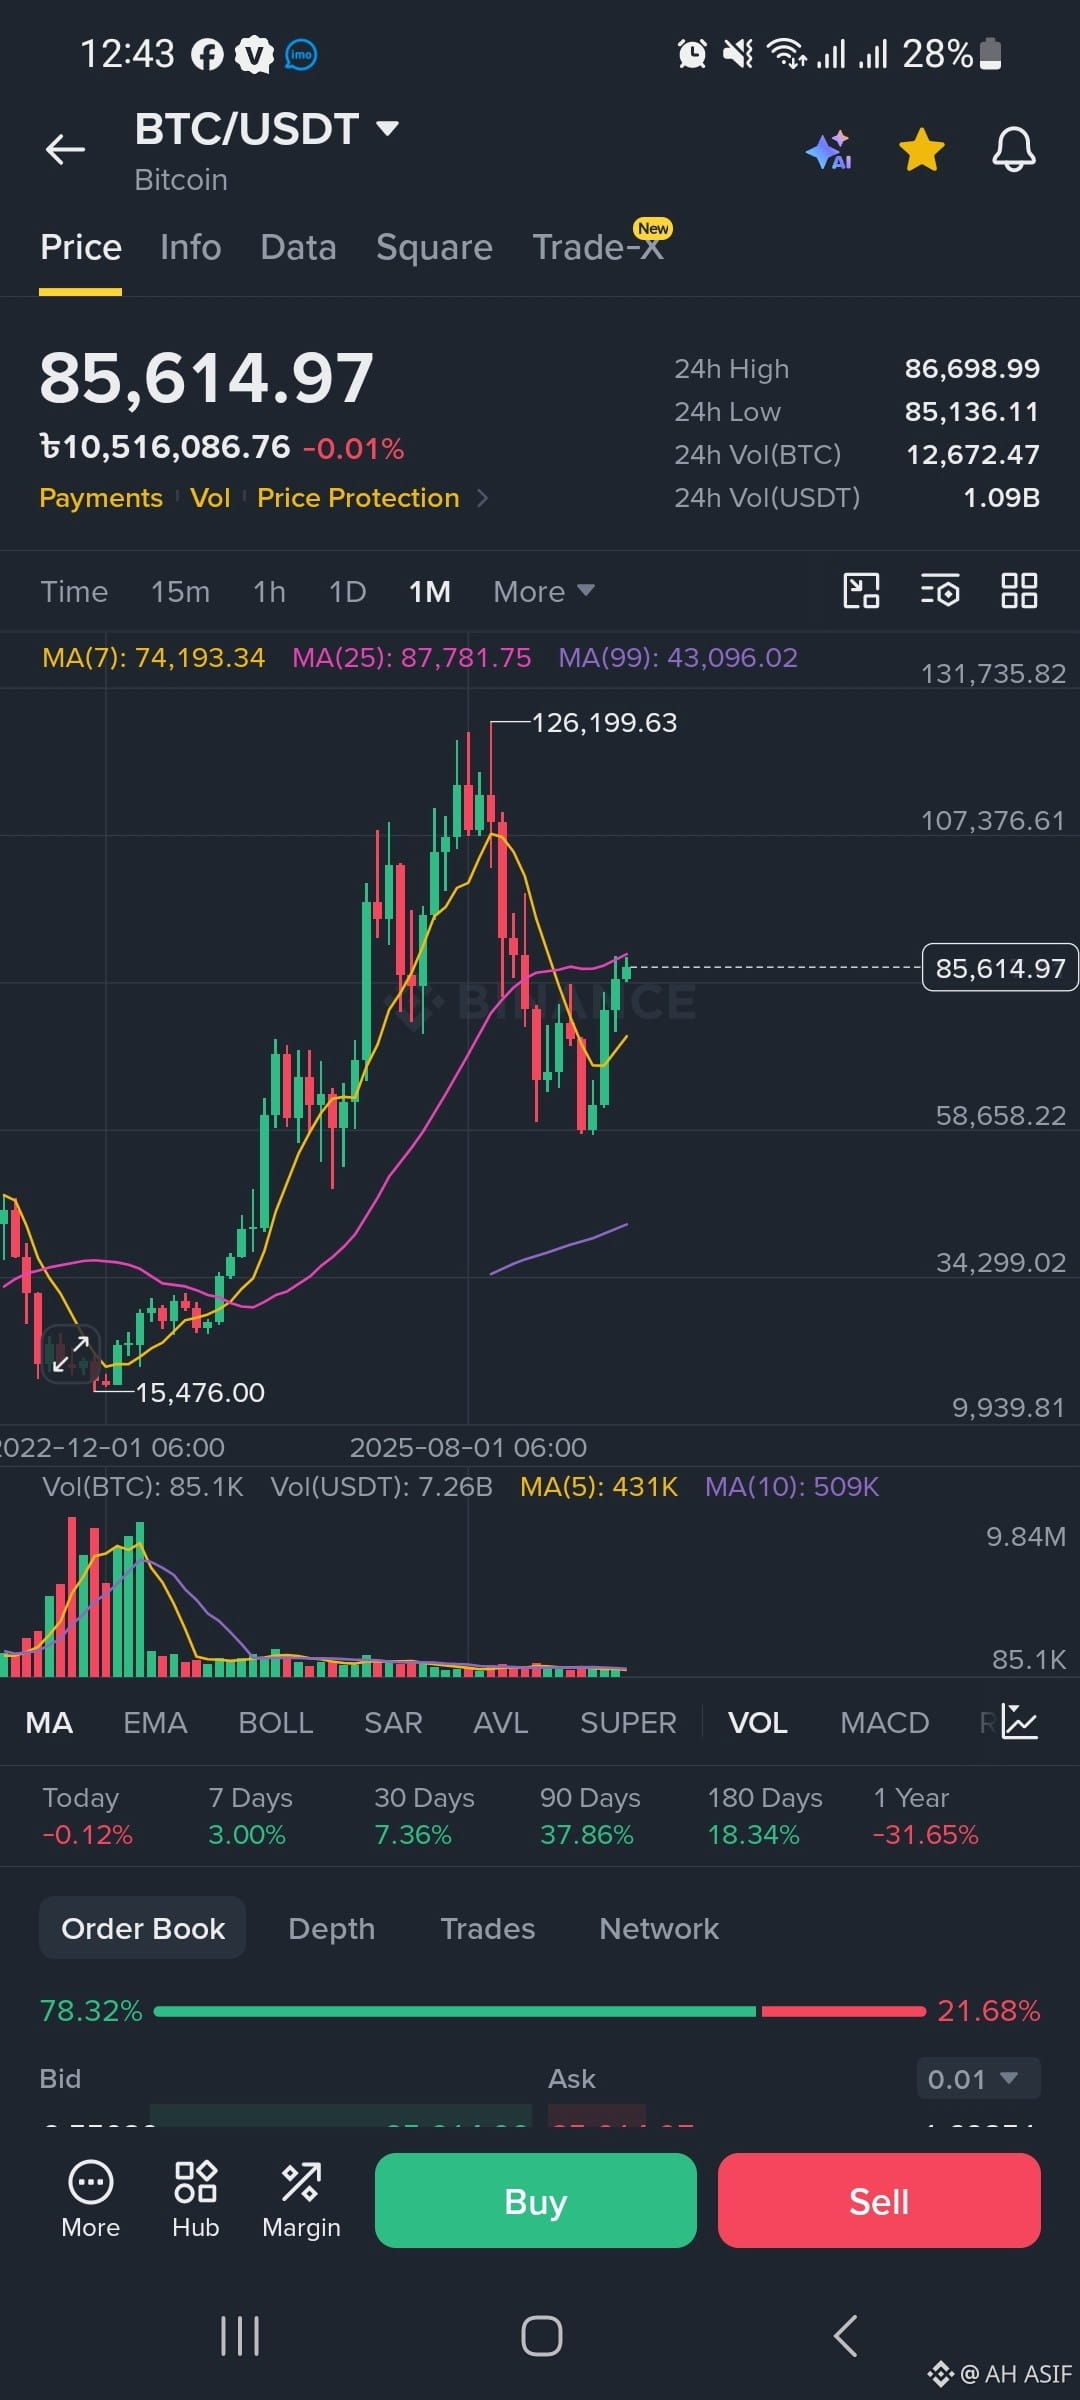
Sure. Here is a detailed English analysis of the BTC/USDT chart in your screenshot:
📊 Bitcoin (BTC/USDT) — Chart Analysis
The screenshot shows Bitcoin trading around $85,614.97 against USDT.
Current price: $85,614.97
24H High: $86,698.99
24H Low: $85,136.11
24H Volume: ~12,672 BTC / $1.09B USDT
🕯️ Timeframe: 1 Month (1M)
This is a monthly candlestick chart, so each candle represents approximately one month. That means the chart is useful for understanding the long-term trend, rather than short-term entries.
Bitcoin previously reached a major high of approximately $126,199.63 on this chart. After that peak, BTC experienced a significant correction and dropped toward the $58,000 area.
More recently, BTC has recovered strongly from that region and is now around $85.6K.
📈 Moving Averages
The screenshot shows:
MA(7): $74,193
MA(25): $87,781
MA(99): $43,096
The current price is above the MA(7), which is generally a positive sign for the shorter part of this monthly trend.
However, BTC is currently slightly below the MA(25) at ~$87,782. That makes the $87K–$88K area important resistance.
The MA(99) is much lower, around $43K, indicating that the longer-term structure shown on this chart remains considerably higher than that average.
🟢 Important Support Areas
Based on the visible chart, some important areas to watch are:
$85K: Current area
$80K–$82K: Potential near-term support
$74K: MA(7) support area
$58K–$60K: Major previous support zone
If BTC continues falling, the $58K–$60K region would be much more significant than the smaller short-term levels.
Sure. Here is a detailed English analysis of the BTC/USDT chart in your screenshot:
📊 Bitcoin (BTC/USDT) — Chart Analysis
The screenshot shows Bitcoin trading around $85,614.97 against USDT.
Current price: $85,614.97
24H High: $86,698.99
24H Low: $85,136.11
24H Volume: ~12,672 BTC / $1.09B USDT
🕯️ Timeframe: 1 Month (1M)
This is a monthly candlestick chart, so each candle represents approximately one month. That means the chart is useful for understanding the long-term trend, rather than short-term entries.
Bitcoin previously reached a major high of approximately $126,199.63 on this chart. After that peak, BTC experienced a significant correction and dropped toward the $58,000 area.
More recently, BTC has recovered strongly from that region and is now around $85.6K.
📈 Moving Averages
The screenshot shows:
MA(7): $74,193
MA(25): $87,781
MA(99): $43,096
The current price is above the MA(7), which is generally a positive sign for the shorter part of this monthly trend.
However, BTC is currently slightly below the MA(25) at ~$87,782. That makes the $87K–$88K area important resistance.
The MA(99) is much lower, around $43K, indicating that the longer-term structure shown on this chart remains considerably higher than that average.
🟢 Important Support Areas
Based on the visible chart, some important areas to watch are:
$85K: Current area
$80K–$82K: Potential near-term support
$74K: MA(7) support area
$58K–$60K: Major previous support zone
If BTC continues falling, the $58K–$60K region would be much more significant than the smaller short-term levels.
📊 Bitcoin (BTC/USDT) — Chart Analysis
The screenshot shows Bitcoin trading around $85,614.97 against USDT.
Current price: $85,614.97
24H High: $86,698.99
24H Low: $85,136.11
24H Volume: ~12,672 BTC / $1.09B USDT
🕯️ Timeframe: 1 Month (1M)
This is a monthly candlestick chart, so each candle represents approximately one month. That means the chart is useful for understanding the long-term trend, rather than short-term entries.
Bitcoin previously reached a major high of approximately $126,199.63 on this chart. After that peak, BTC experienced a significant correction and dropped toward the $58,000 area.
More recently, BTC has recovered strongly from that region and is now around $85.6K.
📈 Moving Averages
The screenshot shows:
MA(7): $74,193
MA(25): $87,781
MA(99): $43,096
The current price is above the MA(7), which is generally a positive sign for the shorter part of this monthly trend.
However, BTC is currently slightly below the MA(25) at ~$87,782. That makes the $87K–$88K area important resistance.
The MA(99) is much lower, around $43K, indicating that the longer-term structure shown on this chart remains considerably higher than that average.
🟢 Important Support Areas
Based on the visible chart, some important areas to watch are:
$85K: Current area
$80K–$82K: Potential near-term support
$74K: MA(7) support area
$58K–$60K: Major previous support zone
If BTC continues falling, the $58K–$60K region would be much more significant than the smaller short-term levels.
104
ログインして、さらにコンテンツを読む
厳選トピックで世界の暗号資産トレーダーの仲間入り
⚡️ 暗号資産に関する最新かつ有益な情報が見つかります。
💬 世界最大の暗号資産取引所から信頼されています。
👍 認証を受けたクリエイターから、有益なインサイトを得られます。
メール / 電話番号
トレンドトピック
FedMinutesFocusOnOctoberPause
閲覧回数 17,692
385人が討論中
#fedminutesfocusonoctoberpause
🚨 10月のFRB利上げ確率が21.6%に急落… $BTC は反応する? 👀
FRBは市場に、もう一つ重要な手がかりを与えようとしています。
投資家は本日のFOMC議事要旨を待っています。最大の疑問は、10月に再び利上げがあるのか、それとも一時停止となるのかです。
現時点で、10月に25ベーシスポイントの利上げが行われる確率は、わずか21.6%まで低下しました。
これは予想の大きな変化です。
しかし、興味深いのはここからです… 👀
FRBは9月に金利を3.75%~4.00%に引き上げましたが、雇用統計の最近の弱さとインフレの鈍化により、すぐに再利上げが行われる可能性は低くなっています。
そして、暗号資産にとってこれは重要です。
FRBが利上げを一時停止すれば、金融環境への圧力が和らぎ、リスク選好が改善する可能性があります。
それはBTCにとって追い風になるかもしれません。
ただし、注意点もあります…
ドルと米国債利回りが上昇するなか、ビットコインはすでに圧力を受けています。
そのため、今夜の議事要旨が相場変動の引き金になる可能性があります。
ハト派のFRB → 流動性への期待 → 強気のBTCシナリオ?
タカ派のFRB → 高金利への懸念 → リスク資産へのさらなる圧力?
本当の疑問はこうです。
10月はビットコイン強気派が待ち望んでいた利上げ一時停止となるのでしょうか…それともFRBが再び市場を驚かせるのでしょうか? 👀
BTC、FRBの政策見通し、米国債利回りを注意深く見守りましょう。
#FederalReserve #Fed #Crypto #InterestRates
$ETH
$SOL
Shae Cassler Sw9r
·いいね:14件
·閲覧回数 30.6k
BinanceLaunchesBinanceIntelligence
閲覧回数 930,515
5,673人が討論中
RobinhoodAdds$25MInBitcoinToBalanceSheet
閲覧回数 854
31人が討論中