
Rao Farhan
161 投稿

Rao Farhan
報告
ユーザーをブロック
335 フォロー
54 フォロワー
10 いいね
投稿
すべて
引用
動画
ライブ
·
--
翻訳参照
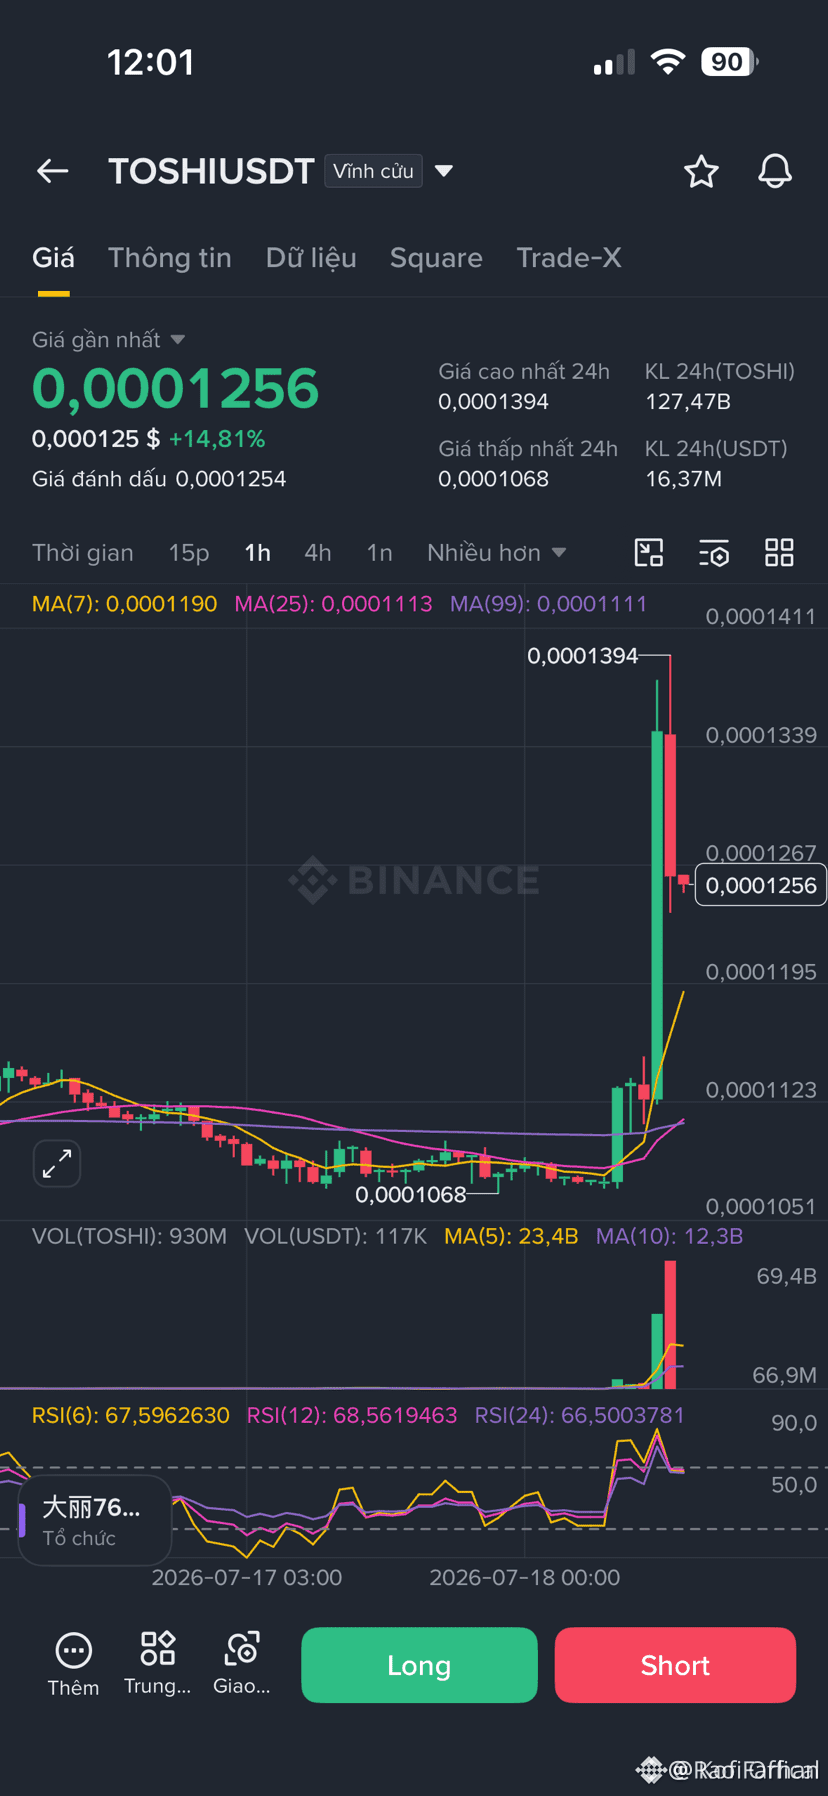
$TOSHI TOSHI/USDT
Long (mua) – strong priority
Entry price: 0.0001230 – 0.0001260 USD
Take Profit (TP):
TP1: 0.0001350 USD
TP2: 0.0001500 – 0.0001600 USD
Stop Loss (SL): 0.0001150 USD
Brief reasons:
TOSHI up +14.81% to 0.0001256 with good supporting volume, maintaining the meme uptrend. Binance AI estimates a 68.5% chance of price increase, with strong support at 0.0001300–0.0001350; whales are accumulating and new capital is flowing in. RSI(6) ~67 still has room to rise. Bullish price structure, suitable for an altcoin pump wave. Trade with a small position size, manage capital tightly.
{alpha}(560x6a2608dabe09bc1128eec7275b92dfb939d5db3f)
$TOSHI TOSHI/USDT
Long (mua) – strong priority
Entry price: 0.0001230 – 0.0001260 USD
Take Profit (TP): TP1: 0.0001350 USD TP2: 0.0001500 – 0.0001600 USD
Stop Loss (SL): 0.0001150 USD
Brief reasons:
TOSHI up +14.81% to 0.0001256 with good supporting volume, maintaining the meme uptrend. Binance AI estimates a 68.5% chance of price increase, with strong support at 0.0001300–0.0001350; whales are accumulating and new capital is flowing in. RSI(6) ~67 still has room to rise. Bullish price structure, suitable for an altcoin pump wave. Trade with a small position size, manage capital tightly.
Long (mua) – strong priority
Entry price: 0.0001230 – 0.0001260 USD
Take Profit (TP): TP1: 0.0001350 USD TP2: 0.0001500 – 0.0001600 USD
Stop Loss (SL): 0.0001150 USD
Brief reasons:
TOSHI up +14.81% to 0.0001256 with good supporting volume, maintaining the meme uptrend. Binance AI estimates a 68.5% chance of price increase, with strong support at 0.0001300–0.0001350; whales are accumulating and new capital is flowing in. RSI(6) ~67 still has room to rise. Bullish price structure, suitable for an altcoin pump wave. Trade with a small position size, manage capital tightly.
55
·
--
ブリッシュ
翻訳参照
$TOSHI TOSHI/USDT
Long (mua) – strong priority
Entry price: 0.0001230 – 0.0001260 USD
Take Profit (TP):
TP1: 0.0001350 USD
TP2: 0.0001500 – 0.0001600 USD
Stop Loss (SL): 0.0001150 USD
Brief reasons:
TOSHI up +14.81% to 0.0001256 with good supporting volume, maintaining the meme uptrend. Binance AI estimates a 68.5% chance of price increase, with strong support at 0.0001300–0.0001350; whales are accumulating and new capital is flowing in. RSI(6) ~67 still has room to rise. Bullish price structure, suitable for an altcoin pump wave. Trade with a small position size, manage capital tightly.
{alpha}(560x6a2608dabe09bc1128eec7275b92dfb939d5db3f)
$TOSHI TOSHI/USDT
Long (mua) – strong priority
Entry price: 0.0001230 – 0.0001260 USD
Take Profit (TP): TP1: 0.0001350 USD TP2: 0.0001500 – 0.0001600 USD
Stop Loss (SL): 0.0001150 USD
Brief reasons:
TOSHI up +14.81% to 0.0001256 with good supporting volume, maintaining the meme uptrend. Binance AI estimates a 68.5% chance of price increase, with strong support at 0.0001300–0.0001350; whales are accumulating and new capital is flowing in. RSI(6) ~67 still has room to rise. Bullish price structure, suitable for an altcoin pump wave. Trade with a small position size, manage capital tightly.
Long (mua) – strong priority
Entry price: 0.0001230 – 0.0001260 USD
Take Profit (TP): TP1: 0.0001350 USD TP2: 0.0001500 – 0.0001600 USD
Stop Loss (SL): 0.0001150 USD
Brief reasons:
TOSHI up +14.81% to 0.0001256 with good supporting volume, maintaining the meme uptrend. Binance AI estimates a 68.5% chance of price increase, with strong support at 0.0001300–0.0001350; whales are accumulating and new capital is flowing in. RSI(6) ~67 still has room to rise. Bullish price structure, suitable for an altcoin pump wave. Trade with a small position size, manage capital tightly.
113
·
--
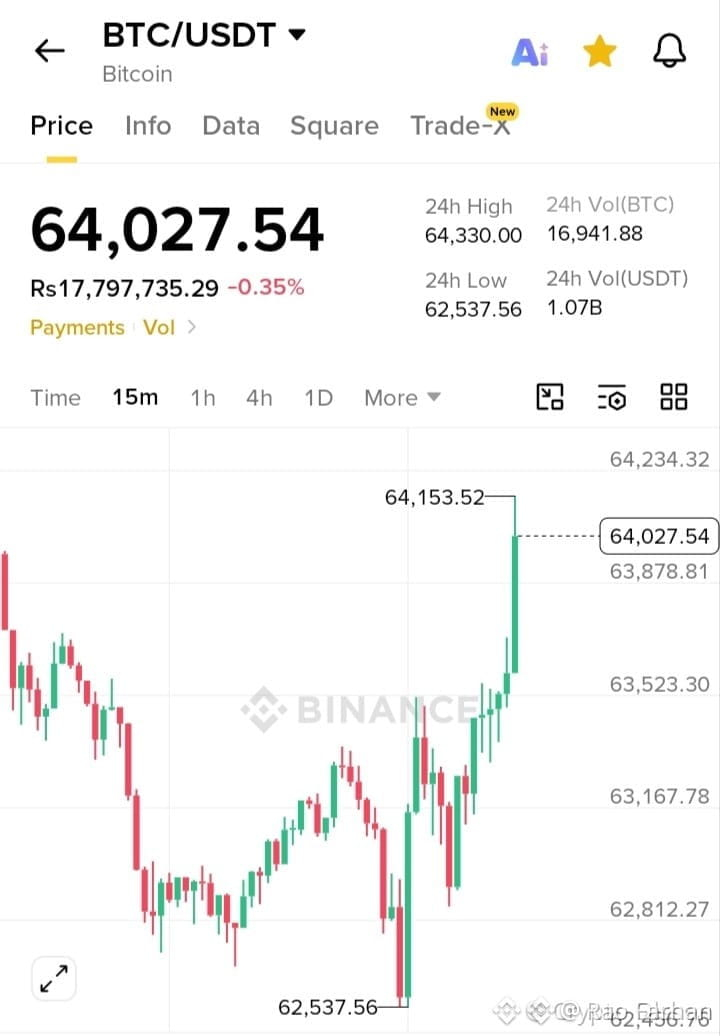
$BTC /USDT 強気セットアップ 🚀
🟢 エントリーゾーン: 63,700 – 64,050
🎯 TP1: 64,500
🎯 TP2: 65,200
🎯 TP3: 66,000
🔴 ストップロス: 62,900
ビットコインは主要なサポートゾーンの上で取引を継続しており、買い手が直近の上昇を防衛しています。近くのレジスタンスを上回る持続的な動きがあれば、さらなる上昇への道が開ける可能性があります。エントリーする前に必ず確認を行い、常に適切なリスク管理を徹底してください。
#BTC #Bitcoin #Crypto #Trading
$BTC
{spot}(BTCUSDT)
$BTC /USDT 強気セットアップ 🚀
🟢 エントリーゾーン: 63,700 – 64,050
🎯 TP1: 64,500
🎯 TP2: 65,200
🎯 TP3: 66,000
🔴 ストップロス: 62,900
ビットコインは主要なサポートゾーンの上で取引を継続しており、買い手が直近の上昇を防衛しています。近くのレジスタンスを上回る持続的な動きがあれば、さらなる上昇への道が開ける可能性があります。エントリーする前に必ず確認を行い、常に適切なリスク管理を徹底してください。
#BTC #Bitcoin #Crypto #Trading
$BTC
🟢 エントリーゾーン: 63,700 – 64,050
🎯 TP1: 64,500
🎯 TP2: 65,200
🎯 TP3: 66,000
🔴 ストップロス: 62,900
ビットコインは主要なサポートゾーンの上で取引を継続しており、買い手が直近の上昇を防衛しています。近くのレジスタンスを上回る持続的な動きがあれば、さらなる上昇への道が開ける可能性があります。エントリーする前に必ず確認を行い、常に適切なリスク管理を徹底してください。
#BTC #Bitcoin #Crypto #Trading
$BTC
31
·
--
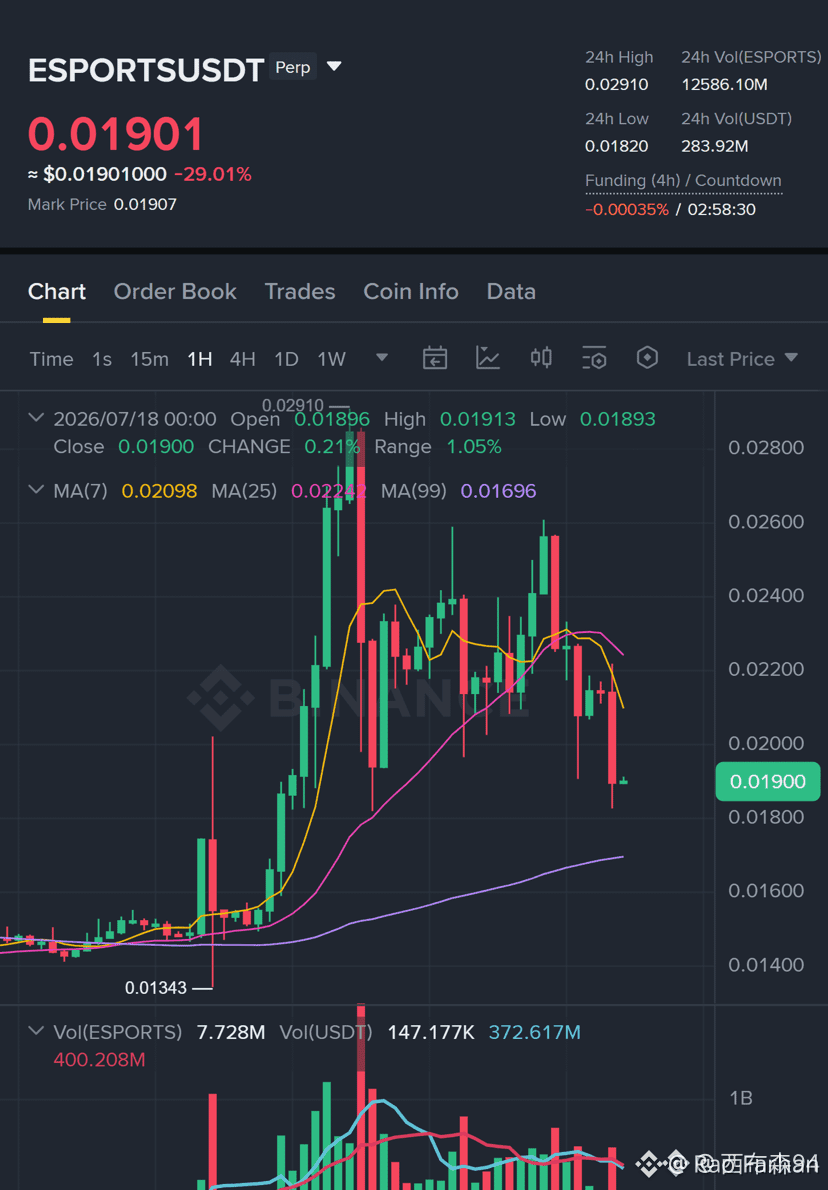
$ESPORTS - ショート
エントリー: 0.01871 – 0.01920
SL: 0.02695
TP1: 0.01296
TP2: 0.00896
TP3: 0.00296
なぜこの設定?
• 1Dのトレンドは弱気で、データでは83%の確信度でショート(SHORT)シグナルを示しています。
• 15mのRSIは31.36 — すでに売られすぎ圏ですが、下落の勢いはまだ優勢です。
• 0.01896でエントリーし、TP1を0.01296に設定:反発が来る前に31%の下落を狙います。
• 4時間足では、ショートに有利さが最も強く出ており、ATRが0.002221で、変動の大きい下方向への動きを後押しします。
ここをクリックして取引👇🏼
$ESPORTS
{future}(ESPORTSUSDT)
$ESPORTS - ショート
エントリー: 0.01871 – 0.01920
SL: 0.02695
TP1: 0.01296
TP2: 0.00896
TP3: 0.00296
なぜこの設定?
• 1Dのトレンドは弱気で、データでは83%の確信度でショート(SHORT)シグナルを示しています。
• 15mのRSIは31.36 — すでに売られすぎ圏ですが、下落の勢いはまだ優勢です。
• 0.01896でエントリーし、TP1を0.01296に設定:反発が来る前に31%の下落を狙います。
• 4時間足では、ショートに有利さが最も強く出ており、ATRが0.002221で、変動の大きい下方向への動きを後押しします。
ここをクリックして取引👇🏼
$ESPORTS
エントリー: 0.01871 – 0.01920
SL: 0.02695
TP1: 0.01296
TP2: 0.00896
TP3: 0.00296
なぜこの設定?
• 1Dのトレンドは弱気で、データでは83%の確信度でショート(SHORT)シグナルを示しています。
• 15mのRSIは31.36 — すでに売られすぎ圏ですが、下落の勢いはまだ優勢です。
• 0.01896でエントリーし、TP1を0.01296に設定:反発が来る前に31%の下落を狙います。
• 4時間足では、ショートに有利さが最も強く出ており、ATRが0.002221で、変動の大きい下方向への動きを後押しします。
ここをクリックして取引👇🏼
$ESPORTS
48
·
--
#NikkeiFalls5%WorstSinceMarch パニック・イン・アジア!🇯🇵📉 日経平均が5%急落—3月以来の最大下げ幅!
日本のNikkei 225は3月以来の最悪の1日下落を記録し、世界の市場に衝撃が走っています。不確実性、利益確定売り、そして世界経済への懸念が高まる中、投資家はリスクを減らす動きを強め、幅広い市場での売りが広がりました。
⚠️ これは何を意味するのでしょう?
$BTC
📉 リスク資産が圧迫されています。
💹 ボラティリティが本格的に再燃しています。
🌍 世界の市場が日本を注視しています。
$ETH
₿ リスクオフのセンチメントが続けば、暗号資産にも影響が及ぶ可能性があります。
歴史は、恐怖の局面がチャンスを生むことを示してきましたが、それは忍耐としっかりした戦略を持つ人に限ります。
💬 これは健全な調整なのでしょうか、それともより大きな市場下落の始まりなのでしょうか?
$SOL
👇 あなたの考えを聞かせてください!
#日経 #日本 #株式市場 #AsianMarkets
#NikkeiFalls5%WorstSinceMarch パニック・イン・アジア!🇯🇵📉 日経平均が5%急落—3月以来の最大下げ幅!
日本のNikkei 225は3月以来の最悪の1日下落を記録し、世界の市場に衝撃が走っています。不確実性、利益確定売り、そして世界経済への懸念が高まる中、投資家はリスクを減らす動きを強め、幅広い市場での売りが広がりました。
⚠️ これは何を意味するのでしょう?
$BTC
📉 リスク資産が圧迫されています。
💹 ボラティリティが本格的に再燃しています。
🌍 世界の市場が日本を注視しています。
$ETH
₿ リスクオフのセンチメントが続けば、暗号資産にも影響が及ぶ可能性があります。
歴史は、恐怖の局面がチャンスを生むことを示してきましたが、それは忍耐としっかりした戦略を持つ人に限ります。
💬 これは健全な調整なのでしょうか、それともより大きな市場下落の始まりなのでしょうか?
$SOL
👇 あなたの考えを聞かせてください!
#日経 #日本 #株式市場 #AsianMarkets
日本のNikkei 225は3月以来の最悪の1日下落を記録し、世界の市場に衝撃が走っています。不確実性、利益確定売り、そして世界経済への懸念が高まる中、投資家はリスクを減らす動きを強め、幅広い市場での売りが広がりました。
⚠️ これは何を意味するのでしょう?
$BTC
📉 リスク資産が圧迫されています。
💹 ボラティリティが本格的に再燃しています。
🌍 世界の市場が日本を注視しています。
$ETH
₿ リスクオフのセンチメントが続けば、暗号資産にも影響が及ぶ可能性があります。
歴史は、恐怖の局面がチャンスを生むことを示してきましたが、それは忍耐としっかりした戦略を持つ人に限ります。
💬 これは健全な調整なのでしょうか、それともより大きな市場下落の始まりなのでしょうか?
$SOL
👇 あなたの考えを聞かせてください!
#日経 #日本 #株式市場 #AsianMarkets
60
·
--
弱気相場
#NikkeiFalls5%WorstSinceMarch
パニック・イン・アジア! 🇯🇵📉 日経平均が5%急落 — 3月以来の最大下落!
日本の日経平均225は3月以来の最悪となる1日での下落に見舞われ、世界の市場に衝撃が走っています。不確実性、利益確定の動き、そして世界経済への懸念の高まりが、広範なマーセルオフ(全面的な売り)を引き起こしました。
⚠️ これは何を意味するのでしょうか?$BTC
📉 リスク資産に売り圧力がかかっています。
💹 ボラティリティ(変動性)が再び本格化。
🌍 世界の市場は日本の動きを注視しています。$ETH
₿ リスク回避のセンチメントが続くなら、暗号資産にも影響が及ぶ可能性があります。
歴史的に恐怖の局面は機会を生むことが示されていますが、それは忍耐としっかりした戦略を持つ人に限られます。
💬 これは健全な調整なのでしょうか?それとも、より大きな市場下落の始まりでしょうか?$SOL
👇 あなたの考えを聞かせてください!
#Nikkei #Japan #StockMarket #AsianMarkets
{spot}(SOLUSDT)
{spot}(BNBUSDT)
{spot}(BTCUSDT)
#NikkeiFalls5%WorstSinceMarch
パニック・イン・アジア! 🇯🇵📉 日経平均が5%急落 — 3月以来の最大下落!
日本の日経平均225は3月以来の最悪となる1日での下落に見舞われ、世界の市場に衝撃が走っています。不確実性、利益確定の動き、そして世界経済への懸念の高まりが、広範なマーセルオフ(全面的な売り)を引き起こしました。
⚠️ これは何を意味するのでしょうか?$BTC
📉 リスク資産に売り圧力がかかっています。
💹 ボラティリティ(変動性)が再び本格化。
🌍 世界の市場は日本の動きを注視しています。$ETH
₿ リスク回避のセンチメントが続くなら、暗号資産にも影響が及ぶ可能性があります。
歴史的に恐怖の局面は機会を生むことが示されていますが、それは忍耐としっかりした戦略を持つ人に限られます。
💬 これは健全な調整なのでしょうか?それとも、より大きな市場下落の始まりでしょうか?$SOL
👇 あなたの考えを聞かせてください!
#Nikkei #Japan #StockMarket #AsianMarkets
パニック・イン・アジア! 🇯🇵📉 日経平均が5%急落 — 3月以来の最大下落!
日本の日経平均225は3月以来の最悪となる1日での下落に見舞われ、世界の市場に衝撃が走っています。不確実性、利益確定の動き、そして世界経済への懸念の高まりが、広範なマーセルオフ(全面的な売り)を引き起こしました。
⚠️ これは何を意味するのでしょうか?$BTC
📉 リスク資産に売り圧力がかかっています。
💹 ボラティリティ(変動性)が再び本格化。
🌍 世界の市場は日本の動きを注視しています。$ETH
₿ リスク回避のセンチメントが続くなら、暗号資産にも影響が及ぶ可能性があります。
歴史的に恐怖の局面は機会を生むことが示されていますが、それは忍耐としっかりした戦略を持つ人に限られます。
💬 これは健全な調整なのでしょうか?それとも、より大きな市場下落の始まりでしょうか?$SOL
👇 あなたの考えを聞かせてください!
#Nikkei #Japan #StockMarket #AsianMarkets
74
·
--
弱気相場
1
7
·
--
翻訳参照
https://www.binance.com/activity/trading-competition/202606tradersleague3?ref=951850653
https://www.binance.com/activity/trading-competition/202606tradersleague3?ref=951850653

2
6
·
--
ブリッシュ
1
77
·
--
ブリッシュ
1
184
·
--
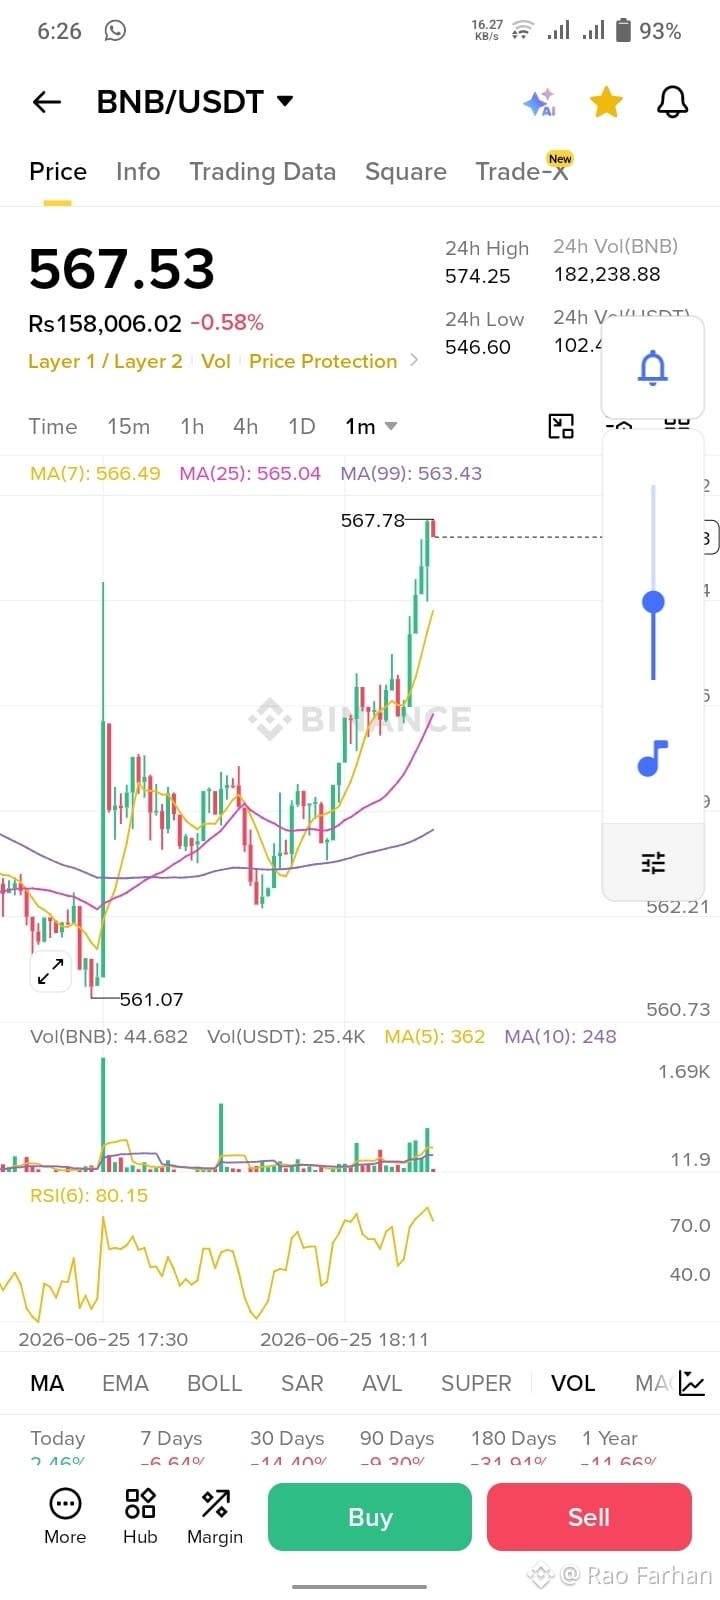
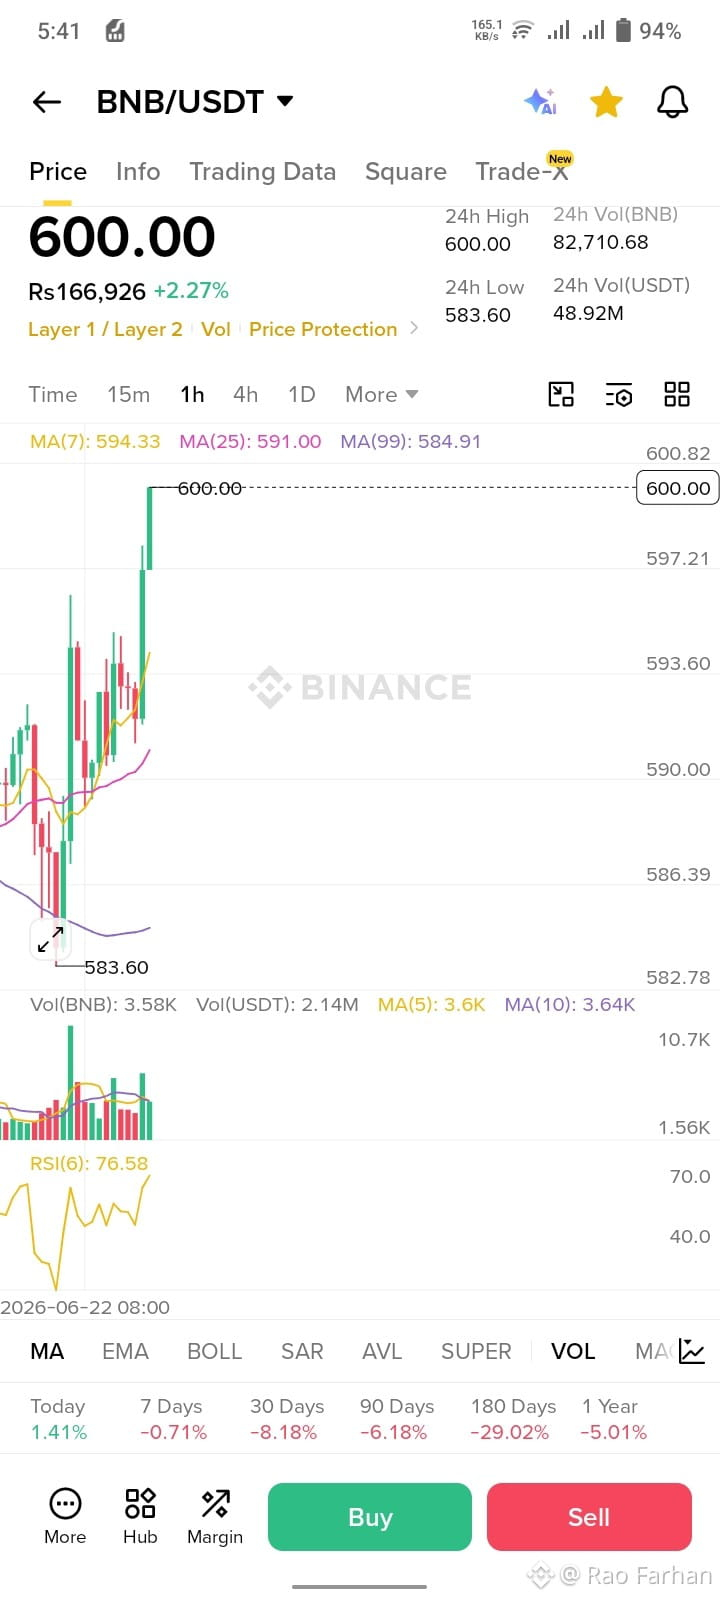
$BNB は現在$572.61で取引されており、過去24時間で約3.1%下落しています。
24時間の始値は$590.71で、最高値は$592.50、最安値は$570.82です。
{spot}(BNBUSDT)
$BTC #bnb #Binance #BTC #cryptouniverseofficial
$BNB は現在$572.61で取引されており、過去24時間で約3.1%下落しています。
24時間の始値は$590.71で、最高値は$592.50、最安値は$570.82です。
$BTC #bnb #Binance #BTC #cryptouniverseofficial
24時間の始値は$590.71で、最高値は$592.50、最安値は$570.82です。
$BTC #bnb #Binance #BTC #cryptouniverseofficial
78
·
--
翻訳参照
I bought $1,000 worth of $SIREN and plan to hold my position. The coin previously reached an all-time high of $3.8321, and I believe it has the potential to trade around $1 again in the coming days. My target is clear—I will sell at $1 and not before. Until then, I’m staying patient, ignoring short-term price fluctuations, and sticking to my plan.
#SIREN #Crypto #TradebStocks #Altcoins #Investing
{future}(SIRENUSDT)
I bought $1,000 worth of $SIREN and plan to hold my position. The coin previously reached an all-time high of $3.8321, and I believe it has the potential to trade around $1 again in the coming days. My target is clear—I will sell at $1 and not before. Until then, I’m staying patient, ignoring short-term price fluctuations, and sticking to my plan.
#SIREN #Crypto #TradebStocks #Altcoins #Investing
#SIREN #Crypto #TradebStocks #Altcoins #Investing
8
·
--
アーサー・ヘイズはETHをさらに買い増している。この男はまだ買うのをやめていない。
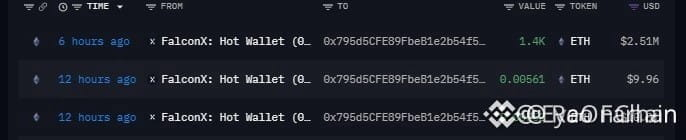
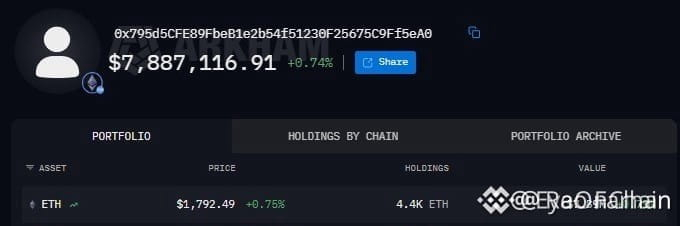
アーサー・ヘイズに関連付けられたウォレットが、約6時間前にさらに1,400ドル分の$ETHを回収した。価値は約251万ドルだ。これはその直後に同じウォレットが先ほど3,000 ETHを受け取ったことに続くもので、ヘイズ(または彼に関連するウォレット)が、最近の強さの中で利益確定するのではなく#Ethereumを継続して積み増していることを示唆している。
ここ数日間、そのウォレットは、市場が回復している間も一貫してETHを追加しており、イーサリアムの上昇余地に対する継続的な確信を示している。
明らかになってきたことが一つある。アーサー・ヘイズに紐づくウォレットはETHを買い続けていて、売っていない。
アドレス: 0x5175ffeecbe75c42aa10aa55ada4c98c9a0574d1
{spot}(ETHUSDT)
{future}(ETCUSDT)
{future}(ETHWUSDT)
#ETCUSDT
#ETH
#ETHWUSDT
#ETH🔥🔥🔥🔥🔥🔥
アーサー・ヘイズはETHをさらに買い増している。この男はまだ買うのをやめていない。
アーサー・ヘイズに関連付けられたウォレットが、約6時間前にさらに1,400ドル分の$ETHを回収した。価値は約251万ドルだ。これはその直後に同じウォレットが先ほど3,000 ETHを受け取ったことに続くもので、ヘイズ(または彼に関連するウォレット)が、最近の強さの中で利益確定するのではなく#Ethereumを継続して積み増していることを示唆している。
ここ数日間、そのウォレットは、市場が回復している間も一貫してETHを追加しており、イーサリアムの上昇余地に対する継続的な確信を示している。
明らかになってきたことが一つある。アーサー・ヘイズに紐づくウォレットはETHを買い続けていて、売っていない。
アドレス: 0x5175ffeecbe75c42aa10aa55ada4c98c9a0574d1
#ETCUSDT
#ETH
#ETHWUSDT
#ETH🔥🔥🔥🔥🔥🔥
アーサー・ヘイズに関連付けられたウォレットが、約6時間前にさらに1,400ドル分の$ETHを回収した。価値は約251万ドルだ。これはその直後に同じウォレットが先ほど3,000 ETHを受け取ったことに続くもので、ヘイズ(または彼に関連するウォレット)が、最近の強さの中で利益確定するのではなく#Ethereumを継続して積み増していることを示唆している。
ここ数日間、そのウォレットは、市場が回復している間も一貫してETHを追加しており、イーサリアムの上昇余地に対する継続的な確信を示している。
明らかになってきたことが一つある。アーサー・ヘイズに紐づくウォレットはETHを買い続けていて、売っていない。
アドレス: 0x5175ffeecbe75c42aa10aa55ada4c98c9a0574d1
#ETCUSDT
#ETH
#ETHWUSDT
#ETH🔥🔥🔥🔥🔥🔥
31
·
--

記事
ここでは、一般的なチャート読みの原則に基づいた(IOTX)のテクニカル分析を行います:
マーケット構造$IOTX
ここでは、一般的なチャート読みの原則に基づいたIoTeX(IOTX)のテクニカル分析を行います:
マーケット構造
トレンド:IOTXが高値更新と安値更新をしているか(強気)または低値更新と高値更新をしているか(弱気)を観察しましょう。
サポートゾーン:過去の価格エリアで買い手が繰り返し参入した場所は、サポートとして機能することがあります。
レジスタンスゾーン:前のピークはしばしばレジスタンスになり、売り圧力が増加する可能性があります。
テクニカル指標
移動平均線(50日と200日):
価格が両方の平均を上回る場合、一般的に強気のモメンタムを示唆します。
ここでは、一般的なチャート読みの原則に基づいた(IOTX)のテクニカル分析を行います: マーケット構造
$IOTX
ここでは、一般的なチャート読みの原則に基づいたIoTeX(IOTX)のテクニカル分析を行います:
マーケット構造
トレンド:IOTXが高値更新と安値更新をしているか(強気)または低値更新と高値更新をしているか(弱気)を観察しましょう。
サポートゾーン:過去の価格エリアで買い手が繰り返し参入した場所は、サポートとして機能することがあります。
レジスタンスゾーン:前のピークはしばしばレジスタンスになり、売り圧力が増加する可能性があります。
テクニカル指標
移動平均線(50日と200日):
価格が両方の平均を上回る場合、一般的に強気のモメンタムを示唆します。
ここでは、一般的なチャート読みの原則に基づいたIoTeX(IOTX)のテクニカル分析を行います:
マーケット構造
トレンド:IOTXが高値更新と安値更新をしているか(強気)または低値更新と高値更新をしているか(弱気)を観察しましょう。
サポートゾーン:過去の価格エリアで買い手が繰り返し参入した場所は、サポートとして機能することがあります。
レジスタンスゾーン:前のピークはしばしばレジスタンスになり、売り圧力が増加する可能性があります。
テクニカル指標
移動平均線(50日と200日):
価格が両方の平均を上回る場合、一般的に強気のモメンタムを示唆します。
222
·
--

記事
翻訳参照
BTC Technical Analysis (Current Market View)
Based on recent market data and technical commentary:$BTC BTC Technical Analysis (Current Market View)
Based on recent market data and technical commentary:
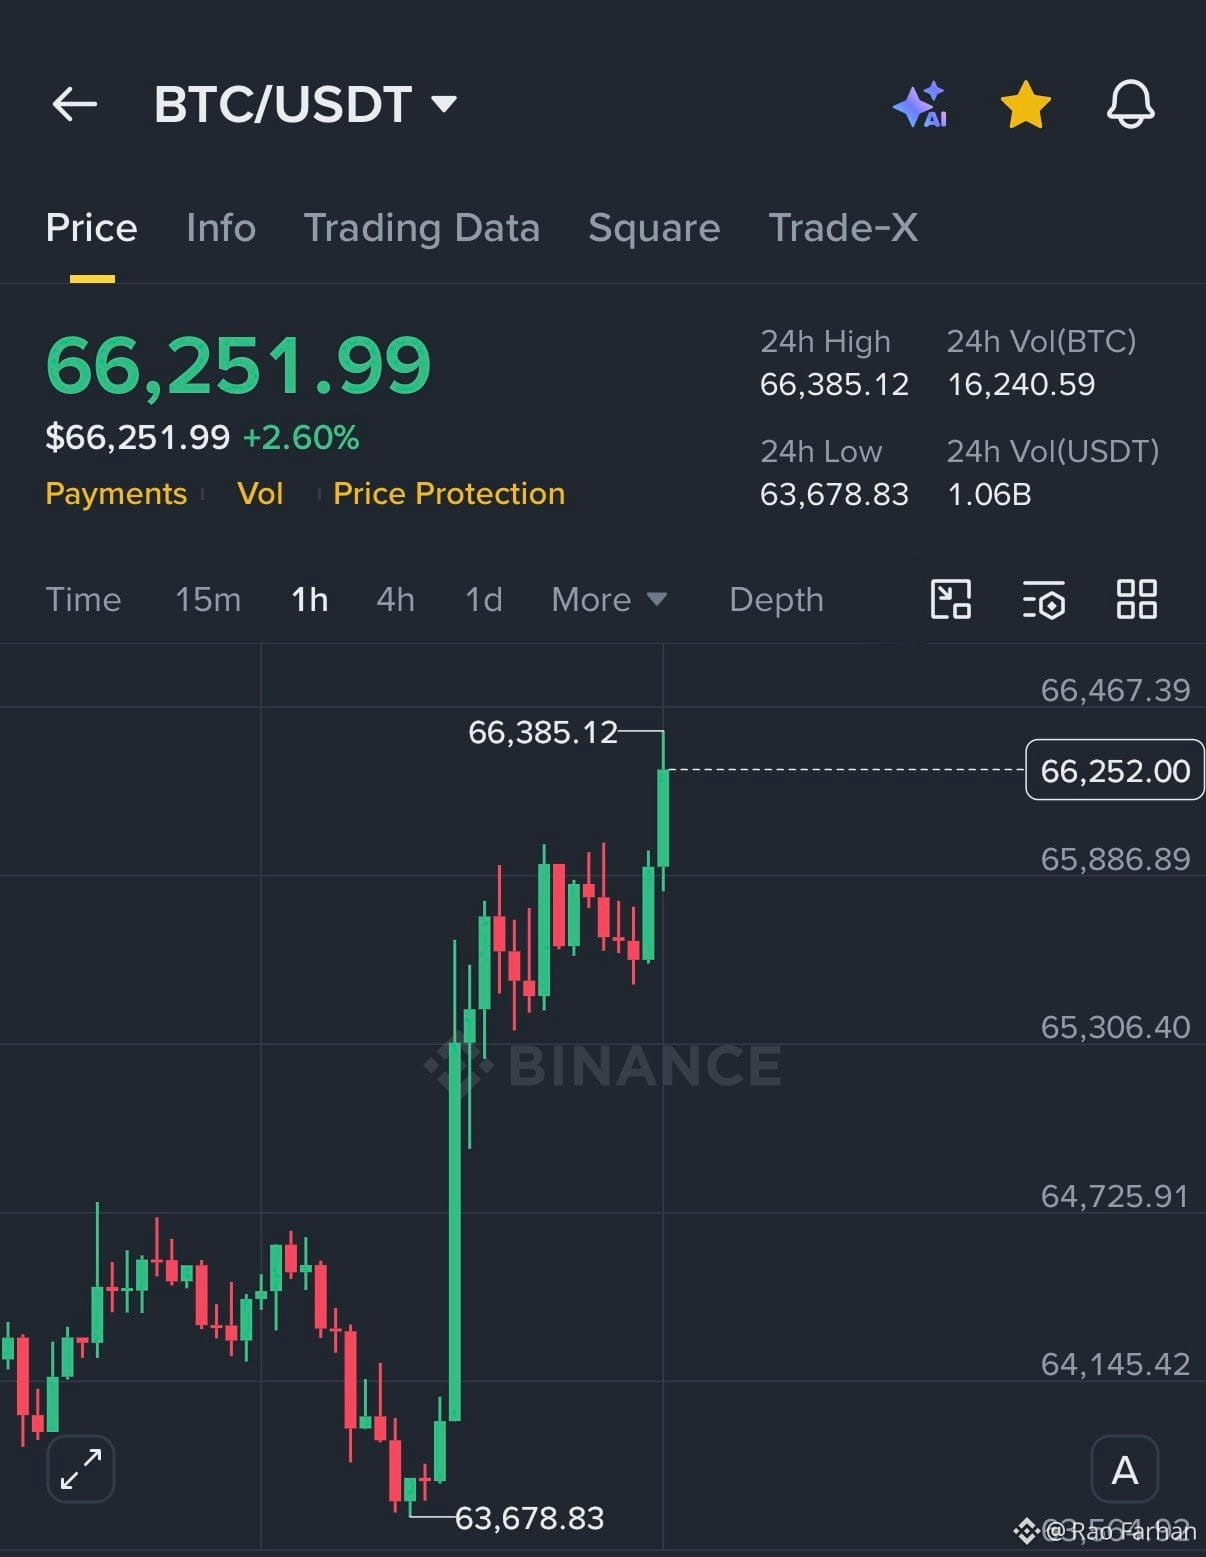
Trend: Bitcoin is trading in a consolidation phase after recent volatility, with traders closely watching whether price can hold key support levels.
Support zone: Around $63,000–$63,500. A sustained break below this area could increase downside pressure.
Resistance zone: Around $64,000–$65,000. A convincing move above this range with strong volume would improve the short-term bullish outlook.
Momentum: The market remains cautious, with institutional flows and macroeconomic factors continuing to influence price action.
Simple Trading Outlook
🟢 Bullish scenario: A breakout above resistance could signal further upside momentum.
🔴 Bearish scenario: Losing the main support zone may lead to another leg lower.
🟡 Neutral scenario: Continued movement between support and resistance would indicate ongoing consolidation.
If you want a more precise analysis, upload a 4H or 1D BTC/USDT chart screenshot (for example from TradingView or Binance), and I can mark potential entry, stop-loss, take-profit, support, and resistance levels directly on that chart.$BTC
{spot}(BTCUSDT)
$BTC
{future}(BTCDOMUSDT)
BTC Technical Analysis (Current Market View) Based on recent market data and technical commentary:
$BTC BTC Technical Analysis (Current Market View)
Based on recent market data and technical commentary:
Trend: Bitcoin is trading in a consolidation phase after recent volatility, with traders closely watching whether price can hold key support levels.
Support zone: Around $63,000–$63,500. A sustained break below this area could increase downside pressure.
Resistance zone: Around $64,000–$65,000. A convincing move above this range with strong volume would improve the short-term bullish outlook.
Momentum: The market remains cautious, with institutional flows and macroeconomic factors continuing to influence price action.
Simple Trading Outlook
🟢 Bullish scenario: A breakout above resistance could signal further upside momentum.
🔴 Bearish scenario: Losing the main support zone may lead to another leg lower.
🟡 Neutral scenario: Continued movement between support and resistance would indicate ongoing consolidation.
If you want a more precise analysis, upload a 4H or 1D BTC/USDT chart screenshot (for example from TradingView or Binance), and I can mark potential entry, stop-loss, take-profit, support, and resistance levels directly on that chart.$BTC
$BTC
Based on recent market data and technical commentary:
Trend: Bitcoin is trading in a consolidation phase after recent volatility, with traders closely watching whether price can hold key support levels.
Support zone: Around $63,000–$63,500. A sustained break below this area could increase downside pressure.
Resistance zone: Around $64,000–$65,000. A convincing move above this range with strong volume would improve the short-term bullish outlook.
Momentum: The market remains cautious, with institutional flows and macroeconomic factors continuing to influence price action.
Simple Trading Outlook
🟢 Bullish scenario: A breakout above resistance could signal further upside momentum.
🔴 Bearish scenario: Losing the main support zone may lead to another leg lower.
🟡 Neutral scenario: Continued movement between support and resistance would indicate ongoing consolidation.
If you want a more precise analysis, upload a 4H or 1D BTC/USDT chart screenshot (for example from TradingView or Binance), and I can mark potential entry, stop-loss, take-profit, support, and resistance levels directly on that chart.$BTC
$BTC
69
·
--
翻訳参照
Eran money #bstockshttps://www.binance.com/activity/trading-competition/trade-bStock-together?ref=951850653
Eran money #bstocks
https://www.binance.com/activity/trading-competition/trade-bStock-together?ref=951850653
3
·
--
翻訳参照
☺️☺️☺️
☺️☺️☺️

Tianna Foley pdh1
·
--
"Eight years of innovation and growth! 🎉 binance has come a long way, offering a wide range of crypto services and products. From trading to staking, Binance has made crypto accessible to millions. Here's to many more years of leadership and excellence! 💥 What's your Binance story? Share with us! #BinanceTurns8 $BNB
1
1
ログインして、さらにコンテンツを読む
厳選トピックで世界の暗号資産トレーダーの仲間入り
⚡️ 暗号資産に関する最新かつ有益な情報が見つかります。
💬 世界最大の暗号資産取引所から信頼されています。
👍 認証を受けたクリエイターから、有益なインサイトを得られます。
メール / 電話番号