
ChFarooq11
10 投稿

ChFarooq11
報告
ユーザーをブロック
2 フォロー
15 フォロワー
13 いいね
投稿
·
--
翻訳参照
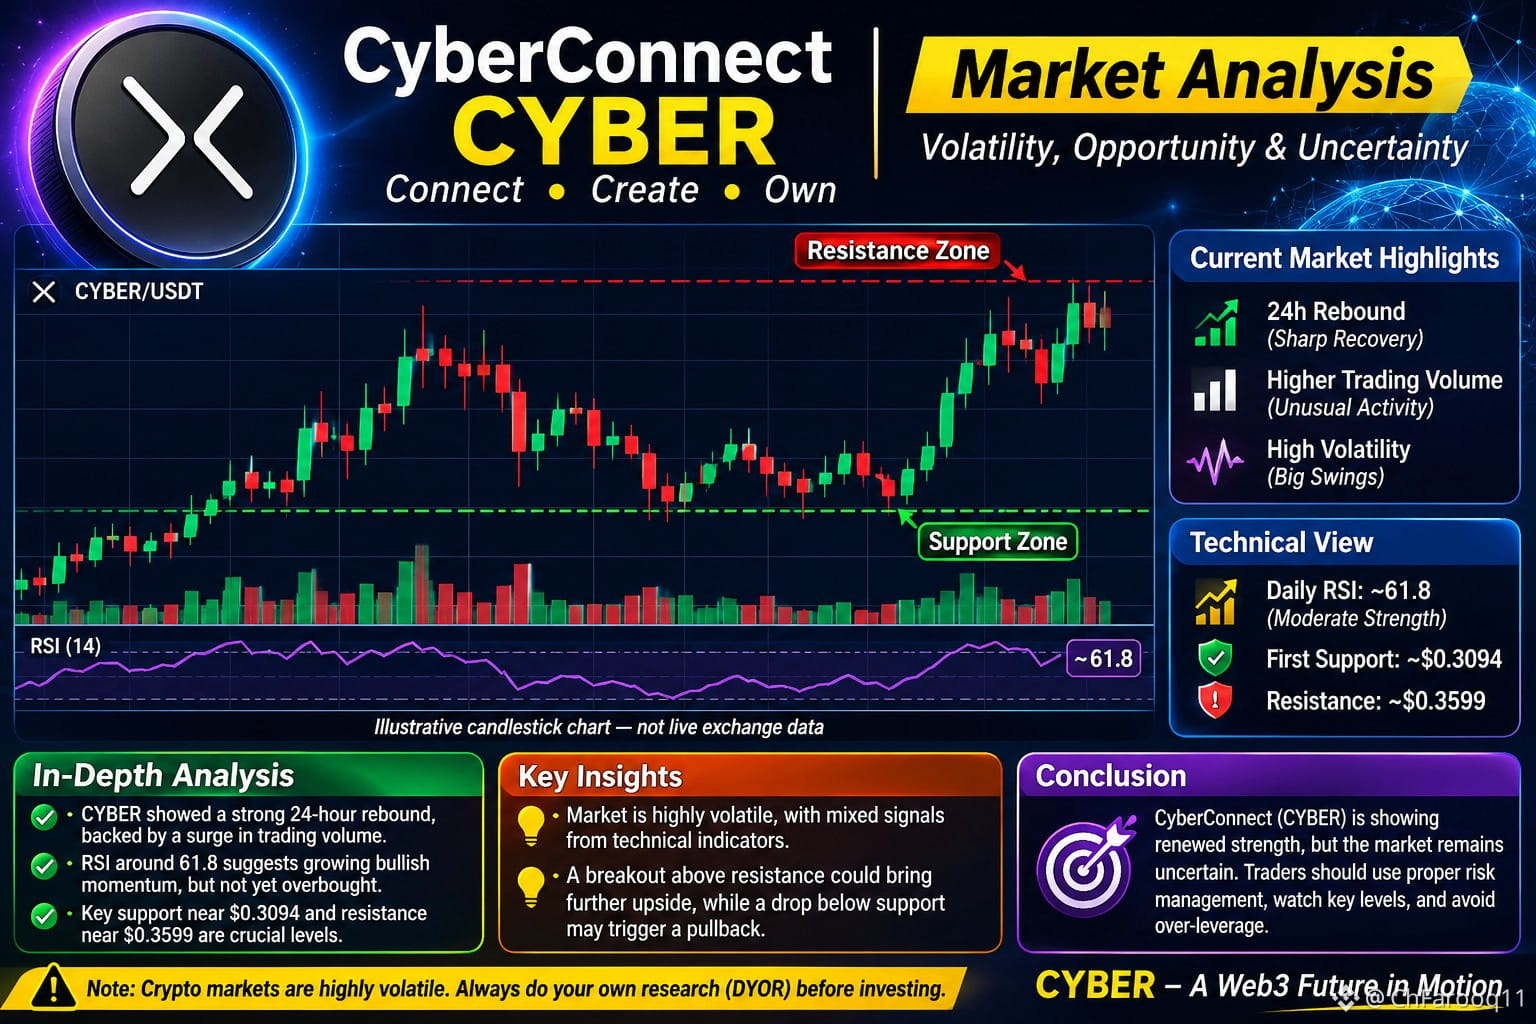
$CYBER CyberConnect (CYBER) Coin – Detailed Market Analysis
CyberConnect (CYBER) is a cryptocurrency associated with a decentralized social networking ecosystem. Its technology focuses on digital identity, social connections, Web3 applications and user-owned data.
The CYBER token is connected to the ecosystem's governance and network activities.
2. Current market overview
According to market data available on 6 November 2026:
Indicator Reported value
CYBER price Around $0.34–$0.36
24-hour change Strongly positive
24-hour volume Elevated
Daily RSI 61.8
First support $0.3094
First resistance $0.3599
Long lower wick: Buyers stepped in after prices moved lower.
High volume: Indicates increased market activity.
The generated CYBER infographic above is illustrative, not a live exchange chart.
4. Technical analysis
A. Support levels
$0.3094 – First important support.
$0.2991 – Secondary support.
$0.2795 – Additional support.
B. Resistance levels
$0.3599 – First resistance.
$0.3804 – Second resistance.
$0.4097 – Third resistance.
These levels are reported technical reference points, not guaranteed price targets.
C. RSI analysis
Technical indicators from different sources are not completely aligned. Short-term momentum appears stronger than the longer-term trend.
6. Fundamental factors
Important factors affecting CYBER's longer-term outlook include:
Adoption of CyberConnect technology.
Growth of Web3 social applications.
Developer activity and ecosystem expansion.
Token supply and future unlocks.
Overall cryptocurrency market conditions.
CoinGecko reports a scheduled token unlock of approximately 511,120 CYBER on November 13, 2026.
{spot}(CYBERUSDT)
#cyber #BinanceReopensWithdrawalsForMoreAssets #AnthropicIPOValuationDoubts #SouthKoreaDelaysCryptoTaxationUntil2029
$CYBER CyberConnect (CYBER) Coin – Detailed Market Analysis
CyberConnect (CYBER) is a cryptocurrency associated with a decentralized social networking ecosystem. Its technology focuses on digital identity, social connections, Web3 applications and user-owned data.
The CYBER token is connected to the ecosystem's governance and network activities.
2. Current market overview
According to market data available on 6 November 2026:
Indicator Reported value
CYBER price Around $0.34–$0.36
24-hour change Strongly positive
24-hour volume Elevated
Daily RSI 61.8
First support $0.3094
First resistance $0.3599
Long lower wick: Buyers stepped in after prices moved lower.
High volume: Indicates increased market activity.
The generated CYBER infographic above is illustrative, not a live exchange chart.
4. Technical analysis
A. Support levels
$0.3094 – First important support.
$0.2991 – Secondary support.
$0.2795 – Additional support.
B. Resistance levels
$0.3599 – First resistance.
$0.3804 – Second resistance.
$0.4097 – Third resistance.
These levels are reported technical reference points, not guaranteed price targets.
C. RSI analysis
Technical indicators from different sources are not completely aligned. Short-term momentum appears stronger than the longer-term trend.
6. Fundamental factors
Important factors affecting CYBER's longer-term outlook include:
Adoption of CyberConnect technology.
Growth of Web3 social applications.
Developer activity and ecosystem expansion.
Token supply and future unlocks.
Overall cryptocurrency market conditions.
CoinGecko reports a scheduled token unlock of approximately 511,120 CYBER on November 13, 2026.
#cyber #BinanceReopensWithdrawalsForMoreAssets #AnthropicIPOValuationDoubts #SouthKoreaDelaysCryptoTaxationUntil2029
CyberConnect (CYBER) is a cryptocurrency associated with a decentralized social networking ecosystem. Its technology focuses on digital identity, social connections, Web3 applications and user-owned data.
The CYBER token is connected to the ecosystem's governance and network activities.
2. Current market overview
According to market data available on 6 November 2026:
Indicator Reported value
CYBER price Around $0.34–$0.36
24-hour change Strongly positive
24-hour volume Elevated
Daily RSI 61.8
First support $0.3094
First resistance $0.3599
Long lower wick: Buyers stepped in after prices moved lower.
High volume: Indicates increased market activity.
The generated CYBER infographic above is illustrative, not a live exchange chart.
4. Technical analysis
A. Support levels
$0.3094 – First important support.
$0.2991 – Secondary support.
$0.2795 – Additional support.
B. Resistance levels
$0.3599 – First resistance.
$0.3804 – Second resistance.
$0.4097 – Third resistance.
These levels are reported technical reference points, not guaranteed price targets.
C. RSI analysis
Technical indicators from different sources are not completely aligned. Short-term momentum appears stronger than the longer-term trend.
6. Fundamental factors
Important factors affecting CYBER's longer-term outlook include:
Adoption of CyberConnect technology.
Growth of Web3 social applications.
Developer activity and ecosystem expansion.
Token supply and future unlocks.
Overall cryptocurrency market conditions.
CoinGecko reports a scheduled token unlock of approximately 511,120 CYBER on November 13, 2026.
#cyber #BinanceReopensWithdrawalsForMoreAssets #AnthropicIPOValuationDoubts #SouthKoreaDelaysCryptoTaxationUntil2029
86
·
--
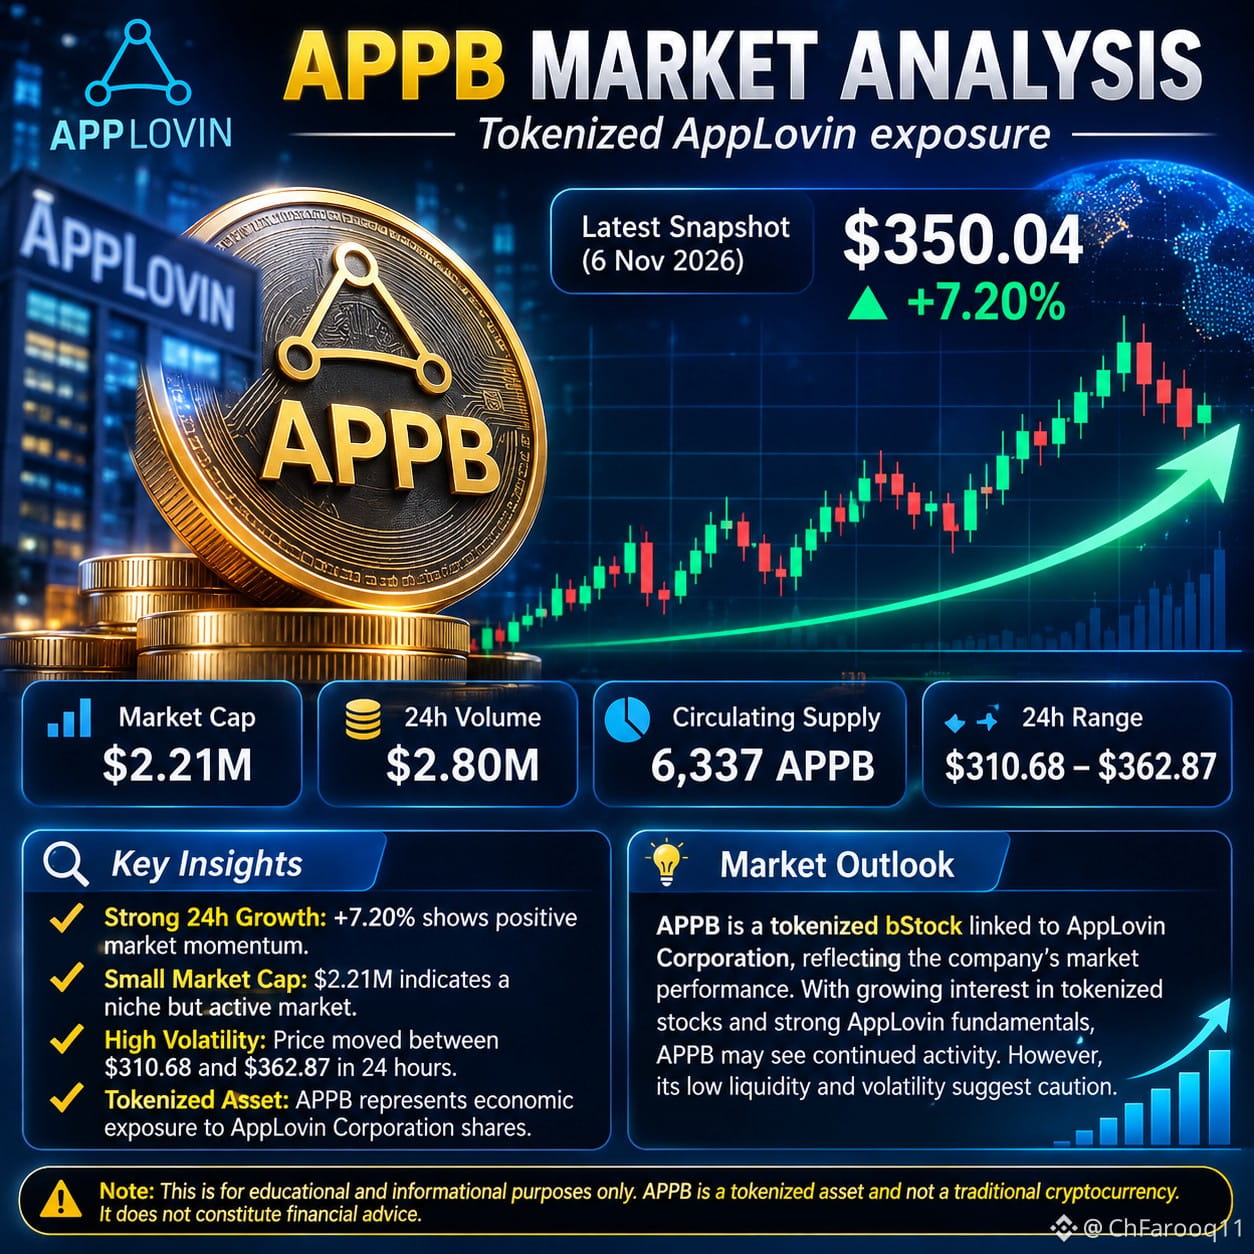
$APPB (AppLovin Corp Tokenized bStocks)は、AppLovin Corporationの株式への経済的エクスポージャーを提供することを目的としたトークン化資産です。価値が原資産となる株式に連動しているため、従来の暗号資産とは異なります。
市場概要
入手可能な最新のCoinMarketCapのスナップショットによると:
指標 値
APPB価格 $350.04
24時間変動率 +7.20%
時価総額 $2.21 million
24時間取引高 $2.8 million
流通供給量 6,337 APPB
24時間の価格範囲 $310.68–$362.8
上昇モメンタム:報告されている24時間の上昇率は、直近の買い需要が強いことを示しています。
ボラティリティ:日中の取引範囲が広く、価格が大きく変動していることを示しています。
レジスタンス:直近高値の$362.87は注目すべき重要な水準です。
サポート:$310.68付近は直近の安値であり、サポート水準として確認されたものではありません。
市場見通し
APPBのパフォーマンスは、AppLovinの原資産株価、市場心理、トークン化株式への需要に左右されます。時価総額と取引流動性が比較的小さいため、価格変動が大きくなる可能性があります。
結論:APPBは短期的に上昇モメンタムを示していますが、価格変動は依然として不安定です。入手可能なスナップショットだけでは、上昇傾向が持続しているとは判断できません。
注:これは市場に関する教育目的の情報であり、金融アドバイスではありません。価格は急速に変動する可能性があります。
{spot}(APPBUSDT)
#USStocksSlipandCryptoMarketUnderBroadPressure #USStocksSufferSteepestRoutSince2020 #StrategySTRCResumesIssuanceAfterOver170Days #Nasdaq100Tumbles6% #GreekParliamentPasses10%CryptoCapitalGainsTaxBill
$APPB (AppLovin Corp Tokenized bStocks)は、AppLovin Corporationの株式への経済的エクスポージャーを提供することを目的としたトークン化資産です。価値が原資産となる株式に連動しているため、従来の暗号資産とは異なります。
市場概要
入手可能な最新のCoinMarketCapのスナップショットによると:
指標 値
APPB価格 $350.04
24時間変動率 +7.20%
時価総額 $2.21 million
24時間取引高 $2.8 million
流通供給量 6,337 APPB
24時間の価格範囲 $310.68–$362.8
上昇モメンタム:報告されている24時間の上昇率は、直近の買い需要が強いことを示しています。
ボラティリティ:日中の取引範囲が広く、価格が大きく変動していることを示しています。
レジスタンス:直近高値の$362.87は注目すべき重要な水準です。
サポート:$310.68付近は直近の安値であり、サポート水準として確認されたものではありません。
市場見通し
APPBのパフォーマンスは、AppLovinの原資産株価、市場心理、トークン化株式への需要に左右されます。時価総額と取引流動性が比較的小さいため、価格変動が大きくなる可能性があります。
結論:APPBは短期的に上昇モメンタムを示していますが、価格変動は依然として不安定です。入手可能なスナップショットだけでは、上昇傾向が持続しているとは判断できません。
注:これは市場に関する教育目的の情報であり、金融アドバイスではありません。価格は急速に変動する可能性があります。
#USStocksSlipandCryptoMarketUnderBroadPressure #USStocksSufferSteepestRoutSince2020 #StrategySTRCResumesIssuanceAfterOver170Days #Nasdaq100Tumbles6% #GreekParliamentPasses10%CryptoCapitalGainsTaxBill
市場概要
入手可能な最新のCoinMarketCapのスナップショットによると:
指標 値
APPB価格 $350.04
24時間変動率 +7.20%
時価総額 $2.21 million
24時間取引高 $2.8 million
流通供給量 6,337 APPB
24時間の価格範囲 $310.68–$362.8
上昇モメンタム:報告されている24時間の上昇率は、直近の買い需要が強いことを示しています。
ボラティリティ:日中の取引範囲が広く、価格が大きく変動していることを示しています。
レジスタンス:直近高値の$362.87は注目すべき重要な水準です。
サポート:$310.68付近は直近の安値であり、サポート水準として確認されたものではありません。
市場見通し
APPBのパフォーマンスは、AppLovinの原資産株価、市場心理、トークン化株式への需要に左右されます。時価総額と取引流動性が比較的小さいため、価格変動が大きくなる可能性があります。
結論:APPBは短期的に上昇モメンタムを示していますが、価格変動は依然として不安定です。入手可能なスナップショットだけでは、上昇傾向が持続しているとは判断できません。
注:これは市場に関する教育目的の情報であり、金融アドバイスではありません。価格は急速に変動する可能性があります。
#USStocksSlipandCryptoMarketUnderBroadPressure #USStocksSufferSteepestRoutSince2020 #StrategySTRCResumesIssuanceAfterOver170Days #Nasdaq100Tumbles6% #GreekParliamentPasses10%CryptoCapitalGainsTaxBill
56
·
--
$ETH
は、世界をリードする暗号資産の一つです。スマートコントラクト、分散型アプリケーション(DApps)、デジタル金融を支える分散型ブロックチェーンプラットフォームです。
現在の市場概況
2026年11月6日現在、イーサリアムは約2,236~2,240ドルで取引されており、過去24時間で約7.8%下落しています。
テクニカル分析
市場トレンド:短期的には弱気。
サポート水準:約2,200~2,220ドル。
レジスタンス水準:約2,279~2,330ドル。
モメンタム:売り圧力は依然として高い水準にあります。
市場見通し:回復の兆しを示すには、イーサリアムが重要なレジスタンス水準を再び上回る必要があります。
結論
イーサリアムは、ブロックチェーンエコシステム、スマートコントラクト、DeFiアプリケーションを有することから、長期的に大きな技術的重要性を持っています。しかし、現在の市場環境は弱含みで、ボラティリティも高い状況です。今後のパフォーマンスは、市場の需要、投資家心理、ネットワークの発展、世界経済の状況に左右されます。
重要:これは教育目的の市場分析であり、投資助言ではありません。暗号資産の価格は急速に変動する可能性があります。
{spot}(ETHUSDT)
#AnthropicIPOValuationDoubts #USStocksSlipandCryptoMarketUnderBroadPressure #BinanceReopensWithdrawalsForMoreAssets #USStocksSufferSteepestRoutSince2020 #StrategySTRCResumesIssuanceAfterOver170Days
$ETH
は、世界をリードする暗号資産の一つです。スマートコントラクト、分散型アプリケーション(DApps)、デジタル金融を支える分散型ブロックチェーンプラットフォームです。
現在の市場概況
2026年11月6日現在、イーサリアムは約2,236~2,240ドルで取引されており、過去24時間で約7.8%下落しています。
テクニカル分析
市場トレンド:短期的には弱気。
サポート水準:約2,200~2,220ドル。
レジスタンス水準:約2,279~2,330ドル。
モメンタム:売り圧力は依然として高い水準にあります。
市場見通し:回復の兆しを示すには、イーサリアムが重要なレジスタンス水準を再び上回る必要があります。
結論
イーサリアムは、ブロックチェーンエコシステム、スマートコントラクト、DeFiアプリケーションを有することから、長期的に大きな技術的重要性を持っています。しかし、現在の市場環境は弱含みで、ボラティリティも高い状況です。今後のパフォーマンスは、市場の需要、投資家心理、ネットワークの発展、世界経済の状況に左右されます。
重要:これは教育目的の市場分析であり、投資助言ではありません。暗号資産の価格は急速に変動する可能性があります。
#AnthropicIPOValuationDoubts #USStocksSlipandCryptoMarketUnderBroadPressure #BinanceReopensWithdrawalsForMoreAssets #USStocksSufferSteepestRoutSince2020 #StrategySTRCResumesIssuanceAfterOver170Days
は、世界をリードする暗号資産の一つです。スマートコントラクト、分散型アプリケーション(DApps)、デジタル金融を支える分散型ブロックチェーンプラットフォームです。
現在の市場概況
2026年11月6日現在、イーサリアムは約2,236~2,240ドルで取引されており、過去24時間で約7.8%下落しています。
テクニカル分析
市場トレンド:短期的には弱気。
サポート水準:約2,200~2,220ドル。
レジスタンス水準:約2,279~2,330ドル。
モメンタム:売り圧力は依然として高い水準にあります。
市場見通し:回復の兆しを示すには、イーサリアムが重要なレジスタンス水準を再び上回る必要があります。
結論
イーサリアムは、ブロックチェーンエコシステム、スマートコントラクト、DeFiアプリケーションを有することから、長期的に大きな技術的重要性を持っています。しかし、現在の市場環境は弱含みで、ボラティリティも高い状況です。今後のパフォーマンスは、市場の需要、投資家心理、ネットワークの発展、世界経済の状況に左右されます。
重要:これは教育目的の市場分析であり、投資助言ではありません。暗号資産の価格は急速に変動する可能性があります。
#AnthropicIPOValuationDoubts #USStocksSlipandCryptoMarketUnderBroadPressure #BinanceReopensWithdrawalsForMoreAssets #USStocksSufferSteepestRoutSince2020 #StrategySTRCResumesIssuanceAfterOver170Days

81
·
--
翻訳参照
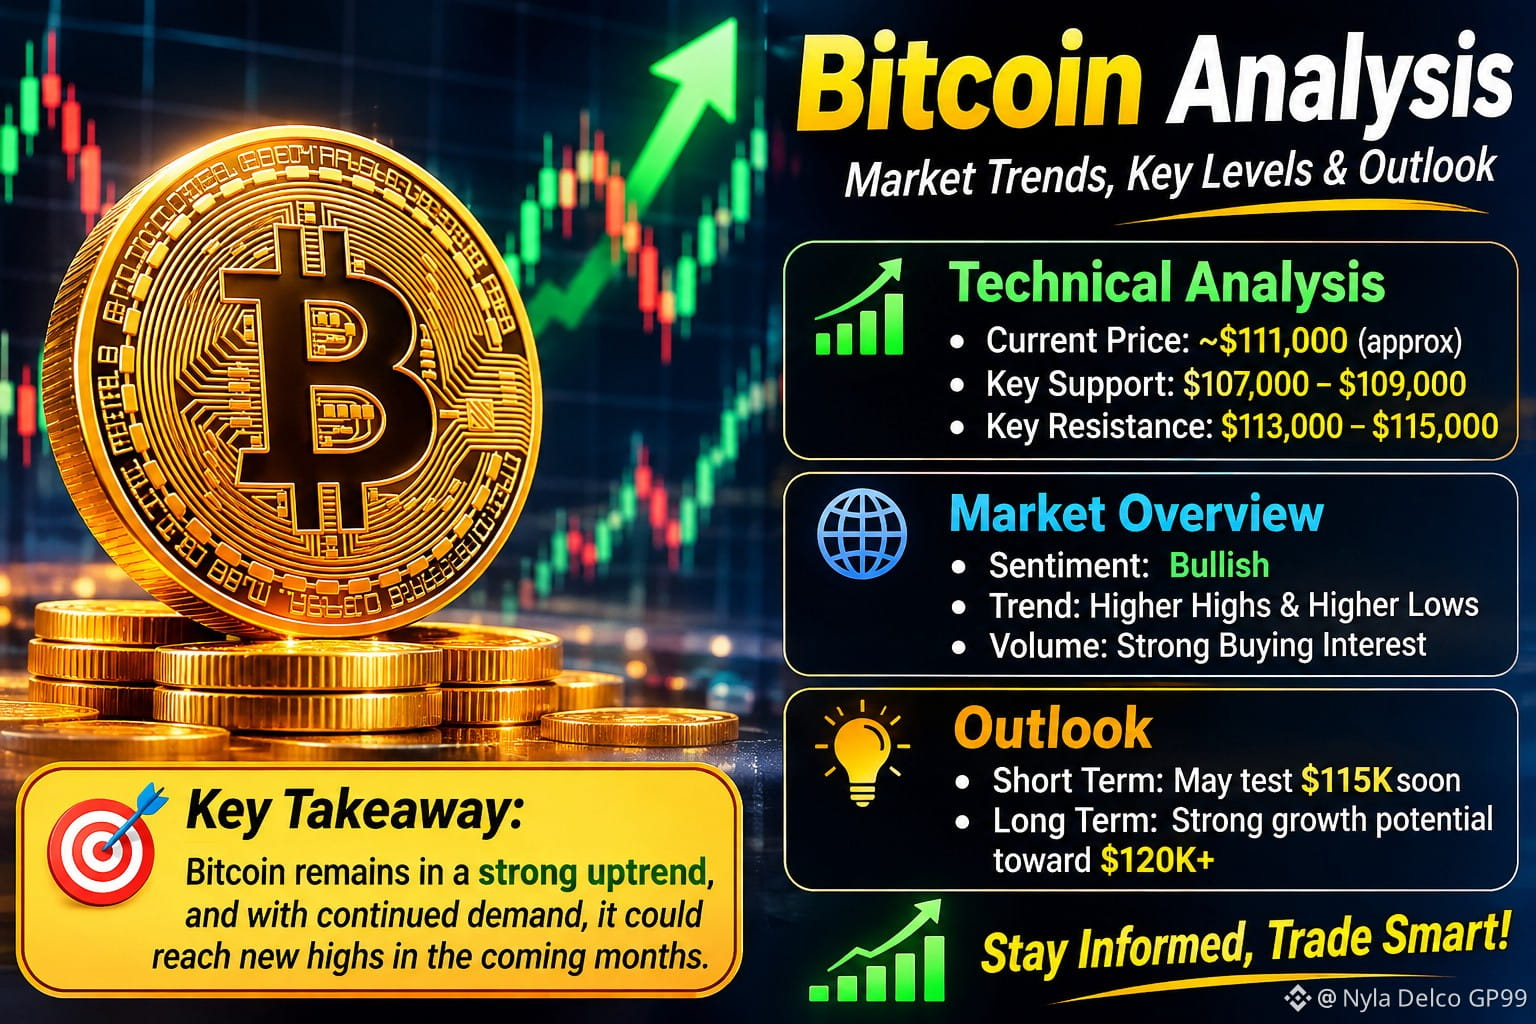
$BTC is the world's leading cryptocurrency. Its price is influenced by market demand, investor sentiment, global economic conditions, and trading activity.
Key points of Bitcoin analysis:
Market Trend: Bitcoin prices can move upward or downward depending on market conditions.
Technical Analysis: Traders study support, resistance, charts, and trading volume.
Market Volatility: Bitcoin is highly volatile, so prices can change quickly.
Future Outlook: Bitcoin has long-term growth potential, but future prices are uncertain.
Conclusion: Bitcoin is an important digital asset with opportunities and risks. Always research carefully before making financial decisions.
{spot}(BTCUSDT)
#BinanceReopensWithdrawalsForMoreAssets #AnthropicIPOValuationDoubts #USStocksSlipandCryptoMarketUnderBroadPressure #USStocksSufferSteepestRoutSince2020 #USStocksSufferSteepestRoutSince2020
$BTC is the world's leading cryptocurrency. Its price is influenced by market demand, investor sentiment, global economic conditions, and trading activity.
Key points of Bitcoin analysis:
Market Trend: Bitcoin prices can move upward or downward depending on market conditions.
Technical Analysis: Traders study support, resistance, charts, and trading volume.
Market Volatility: Bitcoin is highly volatile, so prices can change quickly.
Future Outlook: Bitcoin has long-term growth potential, but future prices are uncertain.
Conclusion: Bitcoin is an important digital asset with opportunities and risks. Always research carefully before making financial decisions.
#BinanceReopensWithdrawalsForMoreAssets #AnthropicIPOValuationDoubts #USStocksSlipandCryptoMarketUnderBroadPressure #USStocksSufferSteepestRoutSince2020 #USStocksSufferSteepestRoutSince2020
Key points of Bitcoin analysis:
Market Trend: Bitcoin prices can move upward or downward depending on market conditions.
Technical Analysis: Traders study support, resistance, charts, and trading volume.
Market Volatility: Bitcoin is highly volatile, so prices can change quickly.
Future Outlook: Bitcoin has long-term growth potential, but future prices are uncertain.
Conclusion: Bitcoin is an important digital asset with opportunities and risks. Always research carefully before making financial decisions.
#BinanceReopensWithdrawalsForMoreAssets #AnthropicIPOValuationDoubts #USStocksSlipandCryptoMarketUnderBroadPressure #USStocksSufferSteepestRoutSince2020 #USStocksSufferSteepestRoutSince2020
95
·
--
翻訳参照
BlackRock’s iShares bitcoin fund sees record exodus as crypto heads for worst month since 2022
Key Points
The iShares Bitcoin Trust ETF has recorded $2.2 billion in outflows this month, as of Monday, FactSet data shows.
That’s nearly eight times the $291 million in losses suffered by the investment vehicle last October, or its second-worst month on record since its debut in early 2024.
The outflows come as bitcoin is down more than 20% over the past month.
traders are now pricing in more than 80% odds that the Federal Reserve will slash rates at its December meeting, such a cut remains far from sure bet.
Amid all the uncertainty, bitcoin is bleeding. And, investors in spot bitcoin ETFs, particularly newer holders, are feeling pressure to sell their shares — a reality that could extend the asset’s downside in the near term, Frank Chaparro, head of content and special projects at crypto-focused trading firm GSR, told CNBC.
“With the macro environment becoming less certain, investors tend to de-risk across assets, which often means trimming exposure to crypto and other risk-sensitive stocks,” Chaparro said. “And for newer entrants who came in through the funds, any downturn can be unsettling – they can sell just as quickly as they bought.”
But while it’s true that spot bitcoin ETFs have brought in hoards of new retail investors who may be flighty during volatile times, the funds have also attracted a range of long-term investors such as institutions who can hold through the downturn, according to Joshua Levine, chairman at bitcoin treasury firm OranjeBTC, told CNBC.
That institutional base could “dampen some of the extreme downside, but also smooth upside, reducing bitcoin’s volatility as the asset class matures,” Levine said.
BlackRock’s iShares bitcoin fund sees record exodus as crypto heads for worst month since 2022
Key Points
The iShares Bitcoin Trust ETF has recorded $2.2 billion in outflows this month, as of Monday, FactSet data shows.
That’s nearly eight times the $291 million in losses suffered by the investment vehicle last October, or its second-worst month on record since its debut in early 2024.
The outflows come as bitcoin is down more than 20% over the past month.
traders are now pricing in more than 80% odds that the Federal Reserve will slash rates at its December meeting, such a cut remains far from sure bet.
Amid all the uncertainty, bitcoin is bleeding. And, investors in spot bitcoin ETFs, particularly newer holders, are feeling pressure to sell their shares — a reality that could extend the asset’s downside in the near term, Frank Chaparro, head of content and special projects at crypto-focused trading firm GSR, told CNBC.
“With the macro environment becoming less certain, investors tend to de-risk across assets, which often means trimming exposure to crypto and other risk-sensitive stocks,” Chaparro said. “And for newer entrants who came in through the funds, any downturn can be unsettling – they can sell just as quickly as they bought.”
But while it’s true that spot bitcoin ETFs have brought in hoards of new retail investors who may be flighty during volatile times, the funds have also attracted a range of long-term investors such as institutions who can hold through the downturn, according to Joshua Levine, chairman at bitcoin treasury firm OranjeBTC, told CNBC.
That institutional base could “dampen some of the extreme downside, but also smooth upside, reducing bitcoin’s volatility as the asset class matures,” Levine said.
The iShares Bitcoin Trust ETF has recorded $2.2 billion in outflows this month, as of Monday, FactSet data shows.
That’s nearly eight times the $291 million in losses suffered by the investment vehicle last October, or its second-worst month on record since its debut in early 2024.
The outflows come as bitcoin is down more than 20% over the past month.
traders are now pricing in more than 80% odds that the Federal Reserve will slash rates at its December meeting, such a cut remains far from sure bet.
Amid all the uncertainty, bitcoin is bleeding. And, investors in spot bitcoin ETFs, particularly newer holders, are feeling pressure to sell their shares — a reality that could extend the asset’s downside in the near term, Frank Chaparro, head of content and special projects at crypto-focused trading firm GSR, told CNBC.
“With the macro environment becoming less certain, investors tend to de-risk across assets, which often means trimming exposure to crypto and other risk-sensitive stocks,” Chaparro said. “And for newer entrants who came in through the funds, any downturn can be unsettling – they can sell just as quickly as they bought.”
But while it’s true that spot bitcoin ETFs have brought in hoards of new retail investors who may be flighty during volatile times, the funds have also attracted a range of long-term investors such as institutions who can hold through the downturn, according to Joshua Levine, chairman at bitcoin treasury firm OranjeBTC, told CNBC.
That institutional base could “dampen some of the extreme downside, but also smooth upside, reducing bitcoin’s volatility as the asset class matures,” Levine said.
1
·
--
翻訳参照
Pi Network’s Chart Resembles Ethereum’sPi Network’s Chart Resembles Ethereum’s Early Days — Is History Repeating?
In the cryptocurrency market, history doesn’t always repeat—but it often rhymes. Pi Network (PI), after six years of development, officially launched its mainnet on February 20, 2024. Since then, the project has been closely watched by the crypto community, not just for its unique mobile-first mining model, but also for its intriguing price movement.
Following its debut, PI saw a strong surge, briefly touching $3 before facing a correction that brought it back to the current trading range of around $1. While price volatility is common in early-stage listings, what’s capturing attention now is something far more interesting—a possible repetition of a historical pattern seen in Ethereum’s (ETH) early days.
PI Mirrors Ethereum’s Early Listing Phase
Our recent comparative chart analysis between Ethereum’s early listing period and Pi Network’s current listing period price behavior shows striking similarities. Both assets display a falling wedge pattern, a well-known bullish reversal formation in technical analysis.
ETH-PI Chart Comparison/Coinsprobe (Source: Tradingview)
Looking back at Ethereum in 2015–2016, the coin entered exchanges at a price close to $1 and moved into a low-volatility phase, clearly marked by a falling wedge structure. After several weeks of consolidation, ETH broke out of this wedge, and a move above its 15-day moving average (15D MA) triggered a sharp bullish rally. This breakout didn’t just signal momentum—it delivered results. ETH surged over 1,400%, climbing from around $0.85 to over $14 within a couple of months.
Fast forward to 2025, Pi Network appears to be painting a similar picture. On the right side of the chart, PI is consolidating in a falling wedge pattern, with its current price hovering around $1—the same level ETH was trading before its breakout. The 15D MA is also hovering just above the price, much like ETH’s setup before its surge.
If Pi follows the same path as Ethereum, it doesn’t take a technical analyst to imagine what could come next.
Is History Repeating?
Of course, it’s important to approach chart similarities with caution. Ethereum’s rise was powered by groundbreaking smart contract technology and early developer adoption. Pi Network, while growing rapidly in user numbers, is still in the process of defining its core utilities and building tangible use cases in the ecosystem.
However, markets often move in patterns, reflecting collective psychology more than just fundamentals. And if the current chart structure is any indication, Pi Network could be quietly preparing for a similar breakout phase.
The momentum may depend on several factors—market sentiment, utility rollout, exchange integrations, and broader crypto trends. But from a pure technical perspective, all eyes are now on whether Pi can break above the wedge and its 15D MA, just as Ethereum once did.
Disclaimer: This article is for informational purposes only and does not constitute financial advice. Always conduct your own research before making any investment decisions.
Pi Network’s Chart Resembles Ethereum’s
Pi Network’s Chart Resembles Ethereum’s Early Days — Is History Repeating?
In the cryptocurrency market, history doesn’t always repeat—but it often rhymes. Pi Network (PI), after six years of development, officially launched its mainnet on February 20, 2024. Since then, the project has been closely watched by the crypto community, not just for its unique mobile-first mining model, but also for its intriguing price movement.
Following its debut, PI saw a strong surge, briefly touching $3 before facing a correction that brought it back to the current trading range of around $1. While price volatility is common in early-stage listings, what’s capturing attention now is something far more interesting—a possible repetition of a historical pattern seen in Ethereum’s (ETH) early days.
PI Mirrors Ethereum’s Early Listing Phase
Our recent comparative chart analysis between Ethereum’s early listing period and Pi Network’s current listing period price behavior shows striking similarities. Both assets display a falling wedge pattern, a well-known bullish reversal formation in technical analysis.
ETH-PI Chart Comparison/Coinsprobe (Source: Tradingview)
Looking back at Ethereum in 2015–2016, the coin entered exchanges at a price close to $1 and moved into a low-volatility phase, clearly marked by a falling wedge structure. After several weeks of consolidation, ETH broke out of this wedge, and a move above its 15-day moving average (15D MA) triggered a sharp bullish rally. This breakout didn’t just signal momentum—it delivered results. ETH surged over 1,400%, climbing from around $0.85 to over $14 within a couple of months.
Fast forward to 2025, Pi Network appears to be painting a similar picture. On the right side of the chart, PI is consolidating in a falling wedge pattern, with its current price hovering around $1—the same level ETH was trading before its breakout. The 15D MA is also hovering just above the price, much like ETH’s setup before its surge.
If Pi follows the same path as Ethereum, it doesn’t take a technical analyst to imagine what could come next.
Is History Repeating?
Of course, it’s important to approach chart similarities with caution. Ethereum’s rise was powered by groundbreaking smart contract technology and early developer adoption. Pi Network, while growing rapidly in user numbers, is still in the process of defining its core utilities and building tangible use cases in the ecosystem.
However, markets often move in patterns, reflecting collective psychology more than just fundamentals. And if the current chart structure is any indication, Pi Network could be quietly preparing for a similar breakout phase.
The momentum may depend on several factors—market sentiment, utility rollout, exchange integrations, and broader crypto trends. But from a pure technical perspective, all eyes are now on whether Pi can break above the wedge and its 15D MA, just as Ethereum once did.
Disclaimer: This article is for informational purposes only and does not constitute financial advice. Always conduct your own research before making any investment decisions.
In the cryptocurrency market, history doesn’t always repeat—but it often rhymes. Pi Network (PI), after six years of development, officially launched its mainnet on February 20, 2024. Since then, the project has been closely watched by the crypto community, not just for its unique mobile-first mining model, but also for its intriguing price movement.
Following its debut, PI saw a strong surge, briefly touching $3 before facing a correction that brought it back to the current trading range of around $1. While price volatility is common in early-stage listings, what’s capturing attention now is something far more interesting—a possible repetition of a historical pattern seen in Ethereum’s (ETH) early days.
PI Mirrors Ethereum’s Early Listing Phase
Our recent comparative chart analysis between Ethereum’s early listing period and Pi Network’s current listing period price behavior shows striking similarities. Both assets display a falling wedge pattern, a well-known bullish reversal formation in technical analysis.
ETH-PI Chart Comparison/Coinsprobe (Source: Tradingview)
Looking back at Ethereum in 2015–2016, the coin entered exchanges at a price close to $1 and moved into a low-volatility phase, clearly marked by a falling wedge structure. After several weeks of consolidation, ETH broke out of this wedge, and a move above its 15-day moving average (15D MA) triggered a sharp bullish rally. This breakout didn’t just signal momentum—it delivered results. ETH surged over 1,400%, climbing from around $0.85 to over $14 within a couple of months.
Fast forward to 2025, Pi Network appears to be painting a similar picture. On the right side of the chart, PI is consolidating in a falling wedge pattern, with its current price hovering around $1—the same level ETH was trading before its breakout. The 15D MA is also hovering just above the price, much like ETH’s setup before its surge.
If Pi follows the same path as Ethereum, it doesn’t take a technical analyst to imagine what could come next.
Is History Repeating?
Of course, it’s important to approach chart similarities with caution. Ethereum’s rise was powered by groundbreaking smart contract technology and early developer adoption. Pi Network, while growing rapidly in user numbers, is still in the process of defining its core utilities and building tangible use cases in the ecosystem.
However, markets often move in patterns, reflecting collective psychology more than just fundamentals. And if the current chart structure is any indication, Pi Network could be quietly preparing for a similar breakout phase.
The momentum may depend on several factors—market sentiment, utility rollout, exchange integrations, and broader crypto trends. But from a pure technical perspective, all eyes are now on whether Pi can break above the wedge and its 15D MA, just as Ethereum once did.
Disclaimer: This article is for informational purposes only and does not constitute financial advice. Always conduct your own research before making any investment decisions.
61
·
--
翻訳参照
#RamadanGiveaway
The holy month of Ramadan is a time of reflection, gratitude, and generosity. To celebrate this blessed season, we’re excited to announce our #RamadanGiveaway! Share your favorite Ramadan traditions, memories, or acts of kindness for a chance to win amazing prizes. Whether it’s preparing iftar with loved ones, reading Quran, or helping those in need, let’s spread the spirit of Ramadan together. Follow us, tag friends, and use #RamadanGiveaway to enter. Winners will be announced at the end of the month. May this Ramadan bring peace, joy, and countless blessings to all. Good luck! 🌙✨ #Blessings #Community #Giveback
#RamadanGiveaway
The holy month of Ramadan is a time of reflection, gratitude, and generosity. To celebrate this blessed season, we’re excited to announce our #RamadanGiveaway! Share your favorite Ramadan traditions, memories, or acts of kindness for a chance to win amazing prizes. Whether it’s preparing iftar with loved ones, reading Quran, or helping those in need, let’s spread the spirit of Ramadan together. Follow us, tag friends, and use #RamadanGiveaway to enter. Winners will be announced at the end of the month. May this Ramadan bring peace, joy, and countless blessings to all. Good luck! 🌙✨ #Blessings #Community #Giveback
The holy month of Ramadan is a time of reflection, gratitude, and generosity. To celebrate this blessed season, we’re excited to announce our #RamadanGiveaway! Share your favorite Ramadan traditions, memories, or acts of kindness for a chance to win amazing prizes. Whether it’s preparing iftar with loved ones, reading Quran, or helping those in need, let’s spread the spirit of Ramadan together. Follow us, tag friends, and use #RamadanGiveaway to enter. Winners will be announced at the end of the month. May this Ramadan bring peace, joy, and countless blessings to all. Good luck! 🌙✨ #Blessings #Community #Giveback
59
·
--
翻訳参照
The power of the community is stronger than ever! 🚀 Binance is giving users the chance to decide which project gets listed next, and your vote can make all the difference. Supporting your favorite token means increased visibility, liquidity, and massive growth potential. A Binance listing can take a project to the next level, attracting new investors and boosting adoption. Now is the time to come together, spread the word, and rally behind the project you believe in. Don’t miss this opportunity to shape the future of crypto—every vote counts! Cast your vote today! 🔥 #VoteToListOnBinance
The power of the community is stronger than ever! 🚀 Binance is giving users the chance to decide which project gets listed next, and your vote can make all the difference. Supporting your favorite token means increased visibility, liquidity, and massive growth potential. A Binance listing can take a project to the next level, attracting new investors and boosting adoption. Now is the time to come together, spread the word, and rally behind the project you believe in. Don’t miss this opportunity to shape the future of crypto—every vote counts! Cast your vote today! 🔥 #VoteToListOnBinance
92
·
--
翻訳参照
#pi pi coin prediction 2025 & 2026
March 2025: PI Prediction
Analysts expect PI's price to rise in March, with a projected change of 112.06% compared to current rates. The asset may reach a high of $ 3.92 and a low of $ 1.163461, averaging around $ 2.34. This prediction comes after a poor market performance in the last 30 days – during which time lost -21.43% – indicating a possible reversal of the trend. The potential ROI stands at 255.72%, suggesting a profitable opportunity for long traders.
In 2026, Pi Network is forecasted to trade in a price channel between $ 1.098607 and $ 3.20. On average, PI is expected to change hands at $ 2.26 during the year. The most bullish month for PI could be January, when the currency is anticipated to trade 190.04% higher than today.
#pi pi coin prediction 2025 & 2026
March 2025: PI Prediction
Analysts expect PI's price to rise in March, with a projected change of 112.06% compared to current rates. The asset may reach a high of $ 3.92 and a low of $ 1.163461, averaging around $ 2.34. This prediction comes after a poor market performance in the last 30 days – during which time lost -21.43% – indicating a possible reversal of the trend. The potential ROI stands at 255.72%, suggesting a profitable opportunity for long traders.
In 2026, Pi Network is forecasted to trade in a price channel between $ 1.098607 and $ 3.20. On average, PI is expected to change hands at $ 2.26 during the year. The most bullish month for PI could be January, when the currency is anticipated to trade 190.04% higher than today.
March 2025: PI Prediction
Analysts expect PI's price to rise in March, with a projected change of 112.06% compared to current rates. The asset may reach a high of $ 3.92 and a low of $ 1.163461, averaging around $ 2.34. This prediction comes after a poor market performance in the last 30 days – during which time lost -21.43% – indicating a possible reversal of the trend. The potential ROI stands at 255.72%, suggesting a profitable opportunity for long traders.
In 2026, Pi Network is forecasted to trade in a price channel between $ 1.098607 and $ 3.20. On average, PI is expected to change hands at $ 2.26 during the year. The most bullish month for PI could be January, when the currency is anticipated to trade 190.04% higher than today.
13
145
ログインして、さらにコンテンツを読む
厳選トピックで世界の暗号資産トレーダーの仲間入り
⚡️ 暗号資産に関する最新かつ有益な情報が見つかります。
💬 世界最大の暗号資産取引所から信頼されています。
👍 認証を受けたクリエイターから、有益なインサイトを得られます。
メール / 電話番号