

E L I X
2.6k 投稿

E L I X
報告
ユーザーをブロック
Crypto KOL • Market Insights • X • CMC • Paid Promotions
73 フォロー
11.8K+ フォロワー
1.2K+ いいね
投稿
すべて
引用
ライブ
·
--
翻訳参照
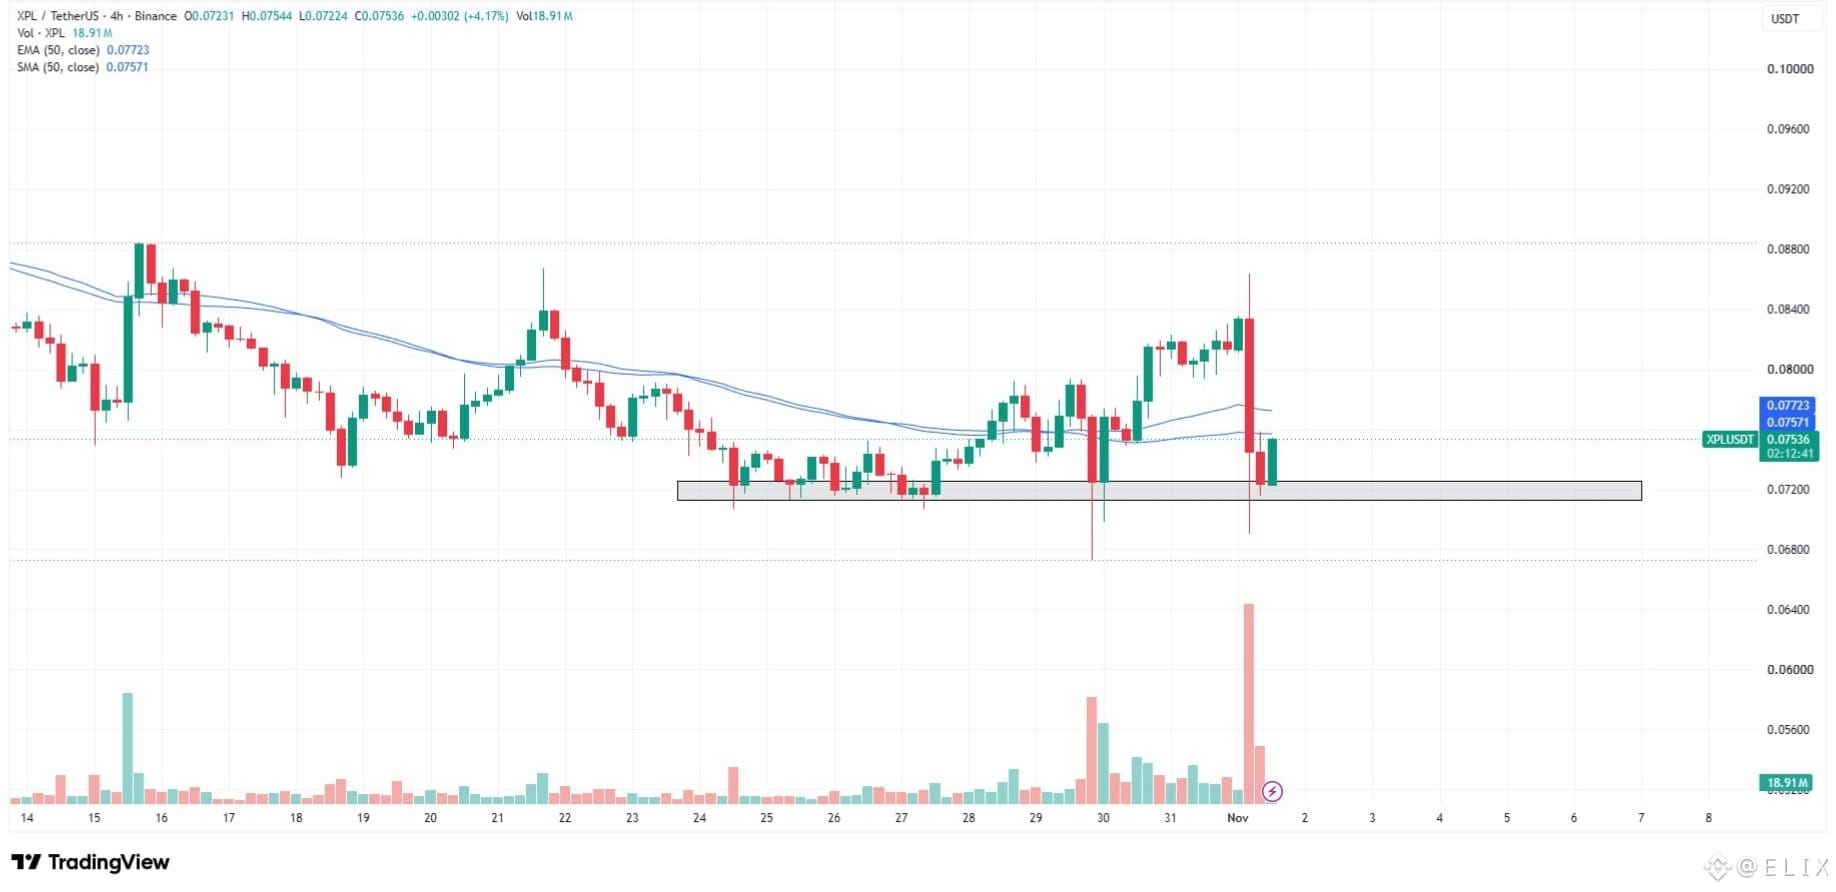
$XPL is holding its key horizontal support despite recent volatility, with buyers continuing to defend the zone.
The latest bounce is an encouraging sign. As long as this level holds, another move higher remains on the radar.
Watching $XPL closely for bullish confirmation.
{spot}(XPLUSDT)
$XPL is holding its key horizontal support despite recent volatility, with buyers continuing to defend the zone.
The latest bounce is an encouraging sign. As long as this level holds, another move higher remains on the radar.
Watching $XPL closely for bullish confirmation.
The latest bounce is an encouraging sign. As long as this level holds, another move higher remains on the radar.
Watching $XPL closely for bullish confirmation.
1
417
·
--
翻訳参照
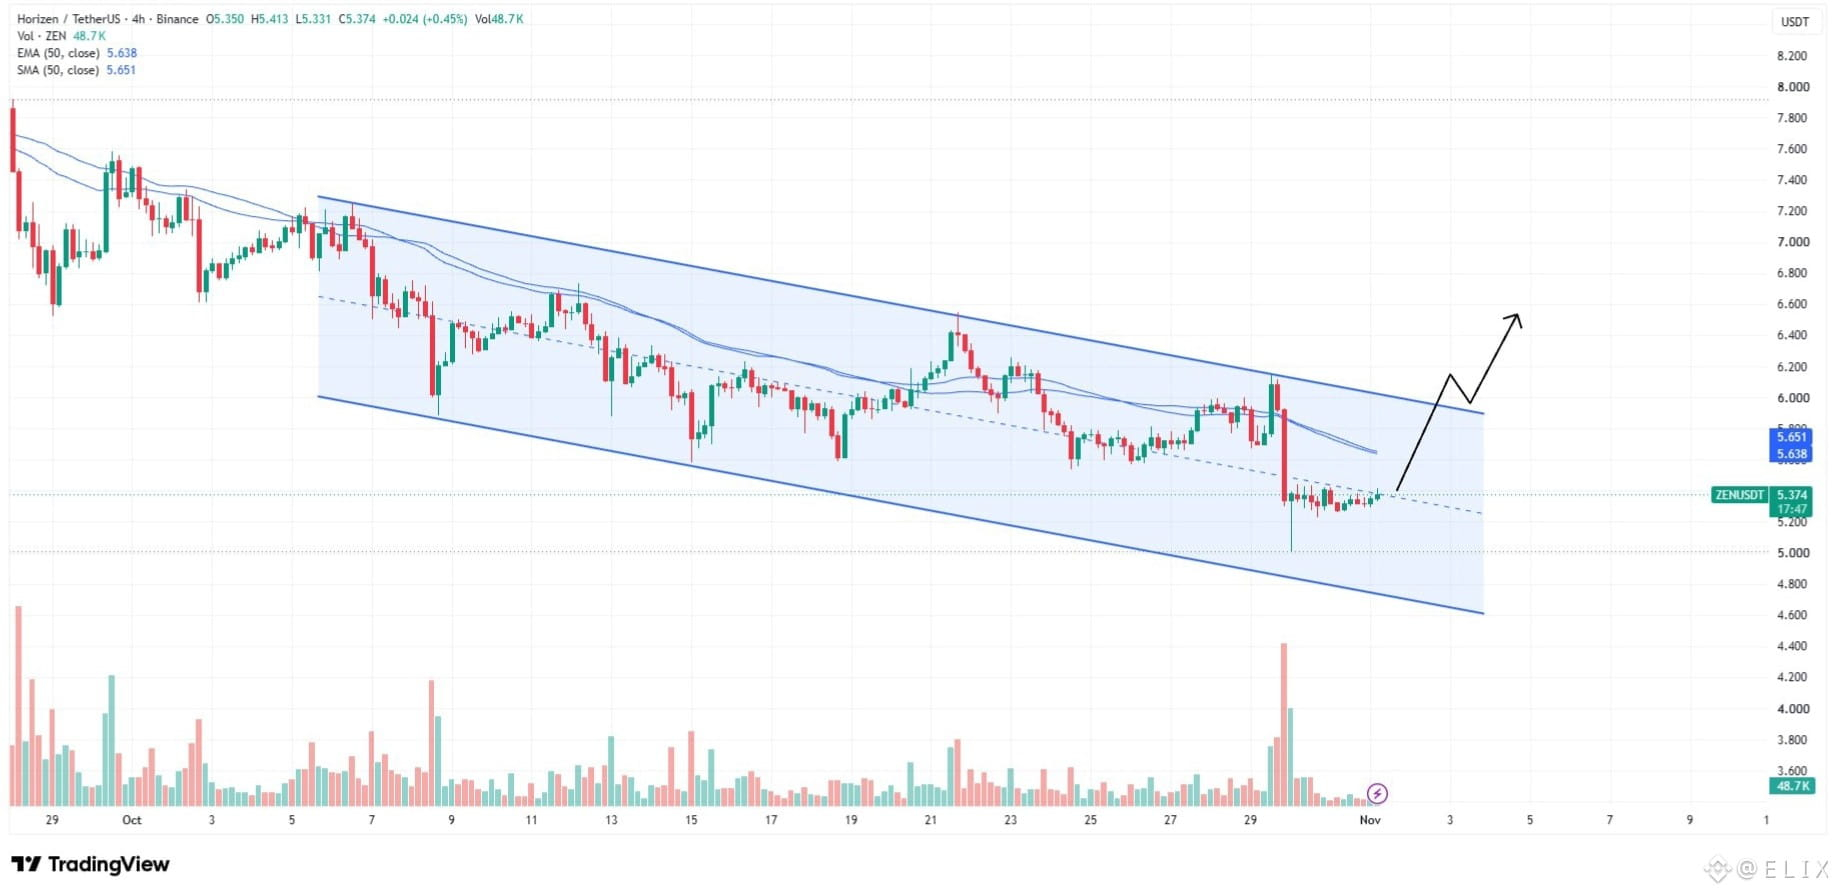
$ZEN is moving inside a descending channel and is currently testing a key mid-level support zone.
The first sign of strength would be a reclaim and sustained hold above this level, which could open the path toward the channel's upper boundary.
A breakout above the upper trendline would provide stronger bullish confirmation.
For now, patience is key. Watching how $ZEN reacts around this support before considering any long setup.
{spot}(ZENUSDT)
$ZEN is moving inside a descending channel and is currently testing a key mid-level support zone.
The first sign of strength would be a reclaim and sustained hold above this level, which could open the path toward the channel's upper boundary.
A breakout above the upper trendline would provide stronger bullish confirmation.
For now, patience is key. Watching how $ZEN reacts around this support before considering any long setup.
303
·
--
翻訳参照
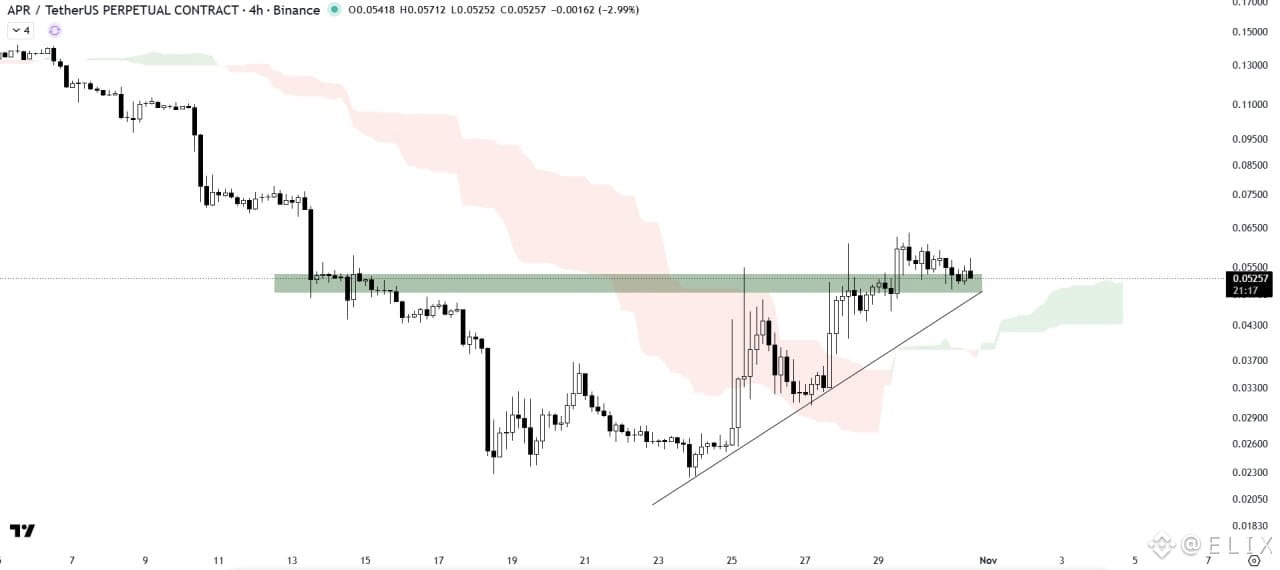
$APR is at a key decision point after breaking out of an ascending triangle with strong volume.
Price is now retesting the breakout zone, while the Ichimoku Cloud continues to provide an important layer of support.
A clean hold here could confirm the breakout and open the door for a stronger move higher.
But if the retest fails and price loses this level, the bullish setup weakens and further downside becomes possible.
The reaction around this zone will likely determine APR’s next major move. 👀
This is analysis, not financial advice.
#APR #cryptooinsigts
{future}(APRUSDT)
$APR is at a key decision point after breaking out of an ascending triangle with strong volume.
Price is now retesting the breakout zone, while the Ichimoku Cloud continues to provide an important layer of support.
A clean hold here could confirm the breakout and open the door for a stronger move higher.
But if the retest fails and price loses this level, the bullish setup weakens and further downside becomes possible.
The reaction around this zone will likely determine APR’s next major move. 👀
This is analysis, not financial advice.
#APR #cryptooinsigts
916
·
--
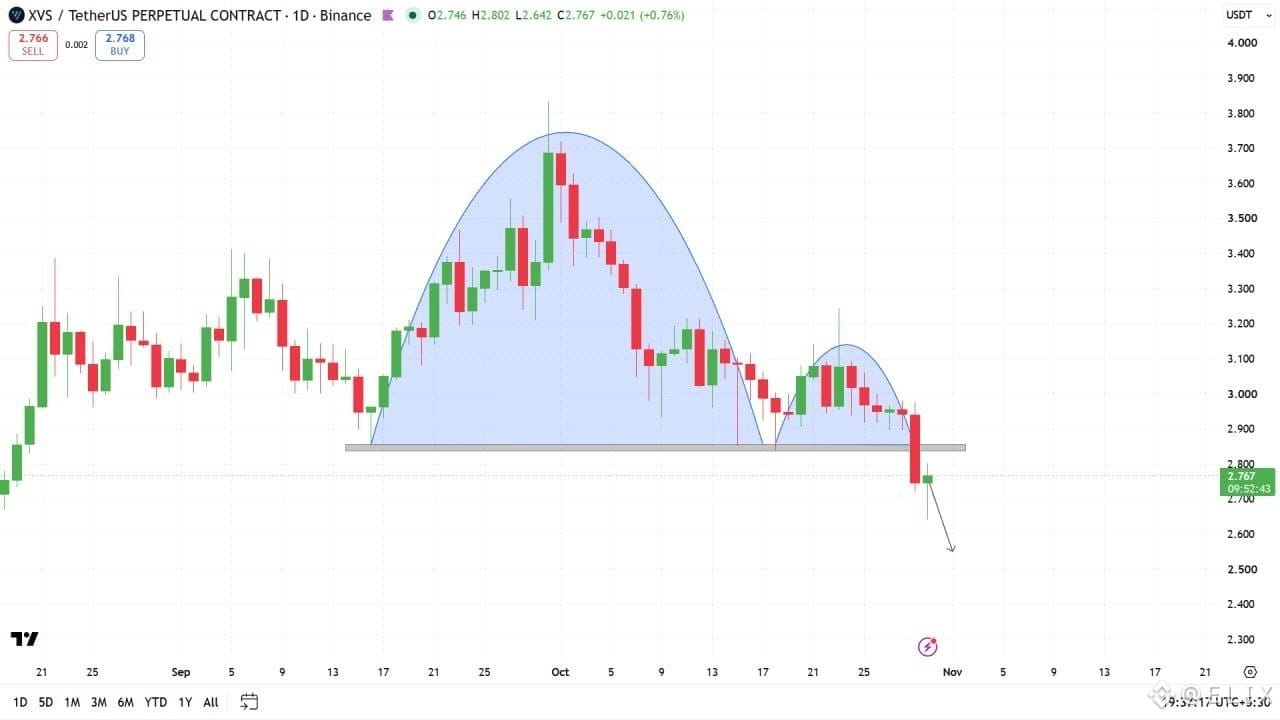
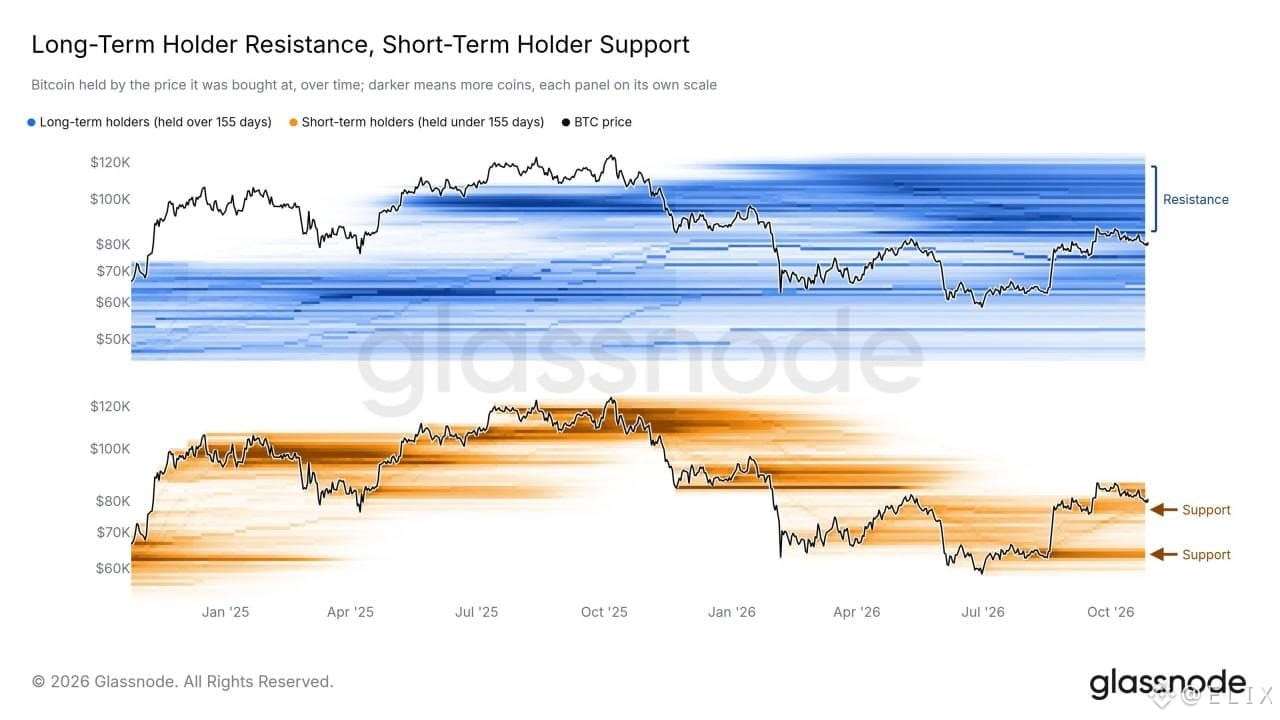
$XVS は明確な売り圧力を示しています。
価格は2.85ドル付近の重要なサポートゾーンを下抜けており、下落が続く可能性を示唆しています。
この下抜けが維持される場合、次に注目すべき水準は2.55~2.60ドル付近です。下抜けたサポートを回復すれば、弱気の見通しは弱まるでしょう。
$XVS をウォッチリストに追加しておきましょう。次の動きは、このゾーンを下回った価格の反応次第です。
#XVS
$XVS は明確な売り圧力を示しています。
価格は2.85ドル付近の重要なサポートゾーンを下抜けており、下落が続く可能性を示唆しています。
この下抜けが維持される場合、次に注目すべき水準は2.55~2.60ドル付近です。下抜けたサポートを回復すれば、弱気の見通しは弱まるでしょう。
$XVS をウォッチリストに追加しておきましょう。次の動きは、このゾーンを下回った価格の反応次第です。
#XVS
価格は2.85ドル付近の重要なサポートゾーンを下抜けており、下落が続く可能性を示唆しています。
この下抜けが維持される場合、次に注目すべき水準は2.55~2.60ドル付近です。下抜けたサポートを回復すれば、弱気の見通しは弱まるでしょう。
$XVS をウォッチリストに追加しておきましょう。次の動きは、このゾーンを下回った価格の反応次第です。
#XVS
2
169
·
--
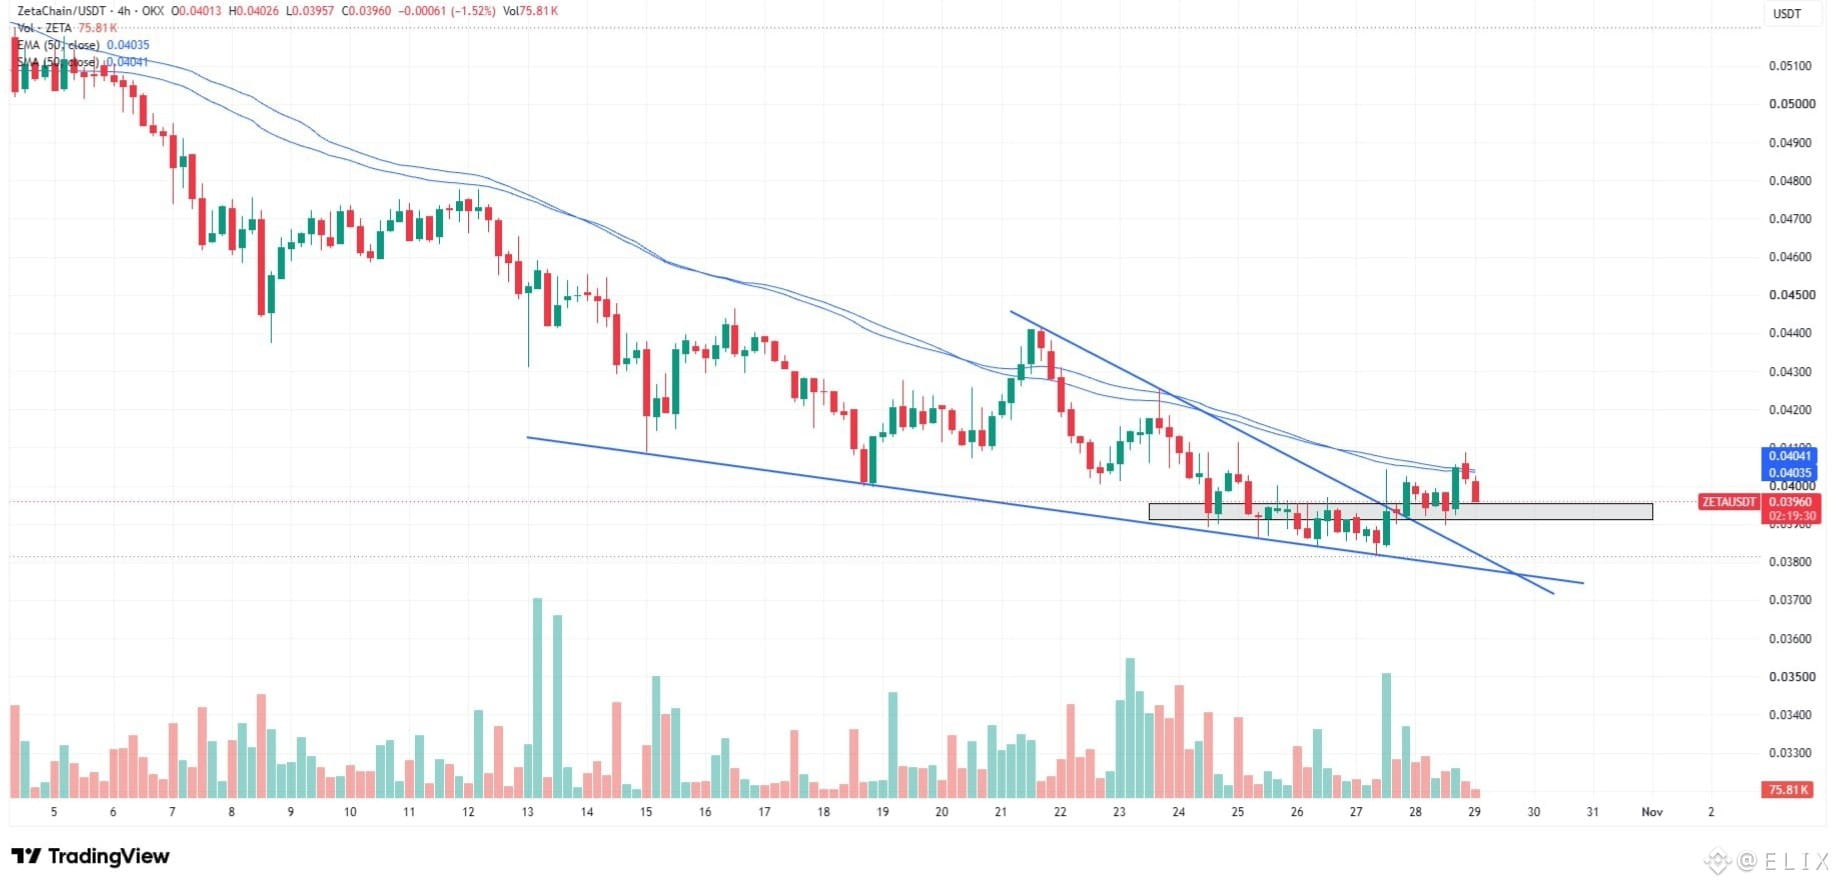
$ZETA | 重要なテストにおける強気構造
下降ウェッジを上抜けた後、$ZETA はリテストを完了し、現在は重要な水平サポートゾーンを試しているようです。
この水準を維持できれば、強気構造はさらに強まり、上昇継続への道が開かれる可能性があります。
明確に維持できるかが重要です。サポートを失えば、このセットアップは弱まり、ブレイクアウトは危険にさらされます。
#ZETA/USDT #EarningsSeason #GoogleToPreviewCryptoCustodySecuritySystem
{future}(ZETAUSDT)
$ZETA | 重要なテストにおける強気構造
下降ウェッジを上抜けた後、$ZETA はリテストを完了し、現在は重要な水平サポートゾーンを試しているようです。
この水準を維持できれば、強気構造はさらに強まり、上昇継続への道が開かれる可能性があります。
明確に維持できるかが重要です。サポートを失えば、このセットアップは弱まり、ブレイクアウトは危険にさらされます。
#ZETA/USDT #EarningsSeason #GoogleToPreviewCryptoCustodySecuritySystem
下降ウェッジを上抜けた後、$ZETA はリテストを完了し、現在は重要な水平サポートゾーンを試しているようです。
この水準を維持できれば、強気構造はさらに強まり、上昇継続への道が開かれる可能性があります。
明確に維持できるかが重要です。サポートを失えば、このセットアップは弱まり、ブレイクアウトは危険にさらされます。
#ZETA/USDT #EarningsSeason #GoogleToPreviewCryptoCustodySecuritySystem
144
·
--
翻訳参照
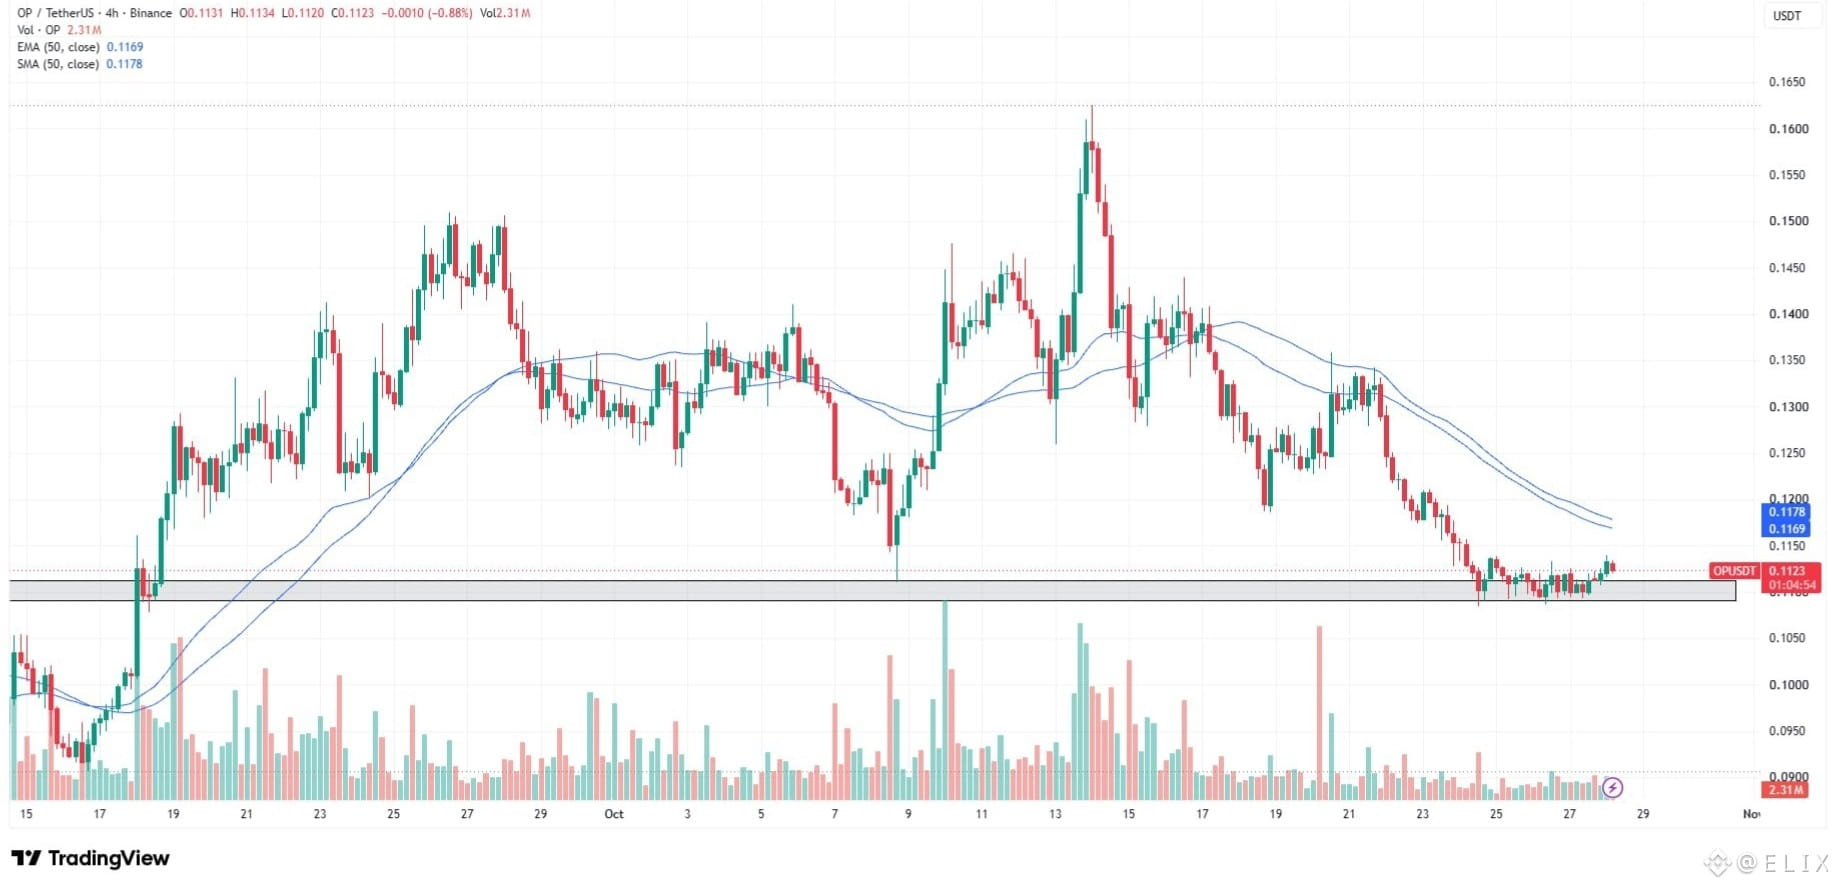
$OP is holding its lower horizontal support zone after an extended decline, with price now consolidating near a level that could attract buyers.
A potential relief bounce is worth watching, but a sustained recovery needs confirmation from buying pressure.
If support holds, $OP could attempt a rebound. However, a breakdown below this zone would weaken the bullish outlook.
For now, patience is key. Watching how price reacts at support before considering spot accumulation.
#OP #op/usdt
{spot}(OPUSDT)
$OP is holding its lower horizontal support zone after an extended decline, with price now consolidating near a level that could attract buyers.
A potential relief bounce is worth watching, but a sustained recovery needs confirmation from buying pressure.
If support holds, $OP could attempt a rebound. However, a breakdown below this zone would weaken the bullish outlook.
For now, patience is key. Watching how price reacts at support before considering spot accumulation.
#OP #op/usdt
264
·
--
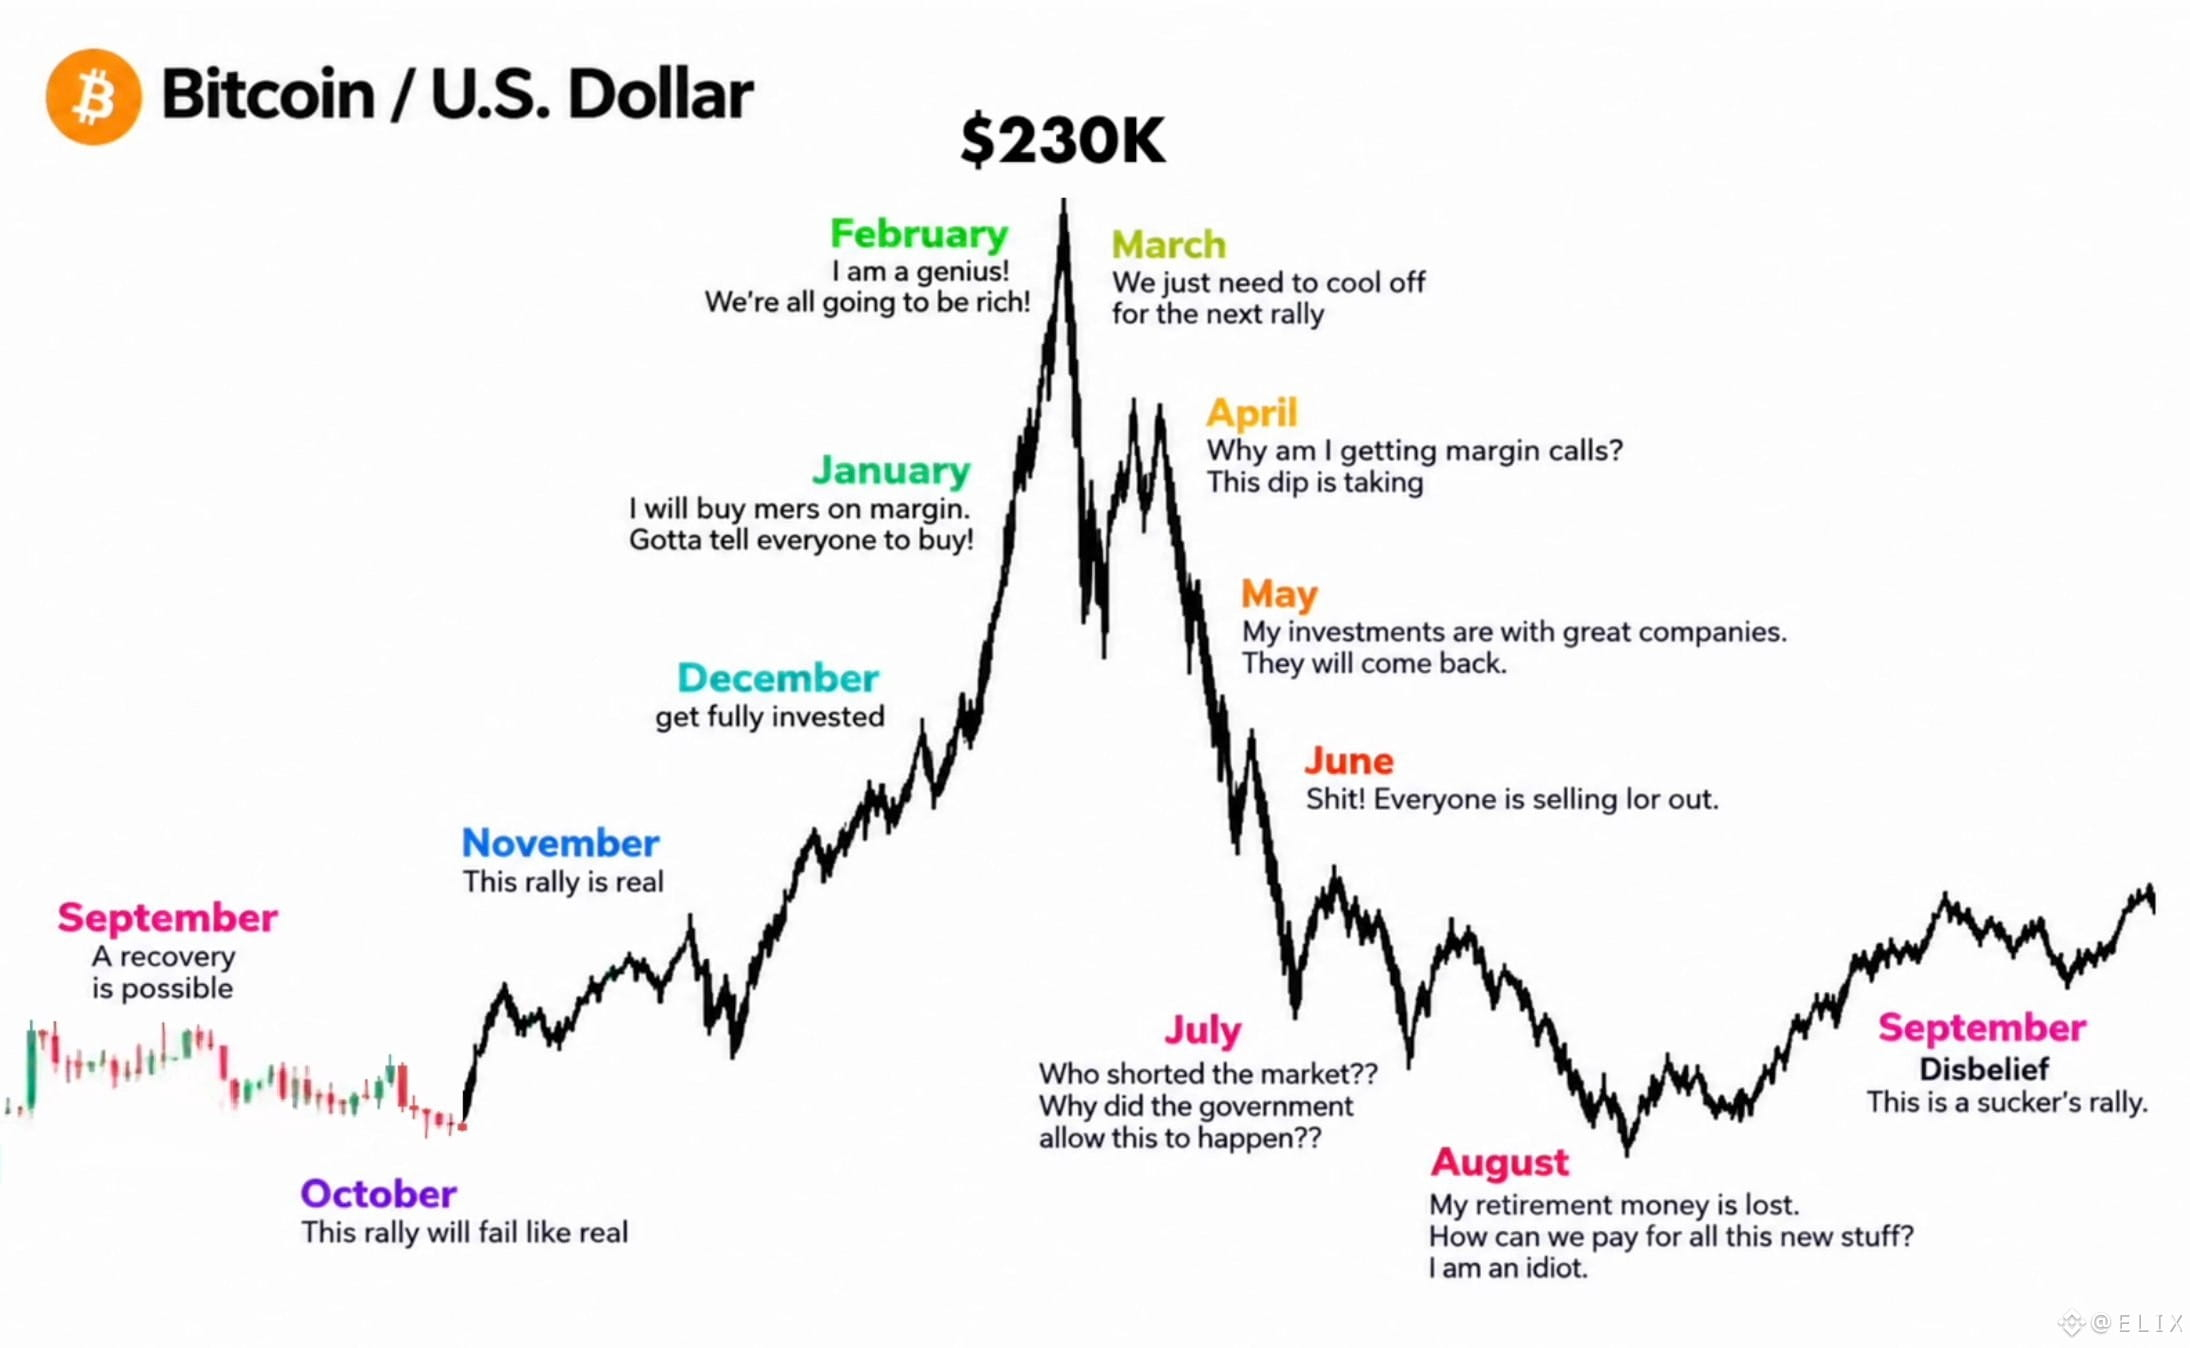
🚨 ビットコイン 2026–2027:市場心理のロードマップ
すべてのサイクルには物語がある。歴史はまた繰り返すのか?
10月 → 懐疑
11月 → 最後の振るい落とし?
12月 → 買い集め?
1月 → 回復
2月 → euphoria(陶酔感)
3月 → 新たな最高値更新の可能性
4月 → アルトシーズンの可能性
5月 → 強気相場の罠?
6月 → パニック売り?
7月 → 弱気相場?
興味深いのは、市場心理がしばしばサイクルを描くことです。
• 懐疑はためらいを生む。
• FOMOが価格を押し上げる。
• 陶酔感によってリスクが見えなくなる。
• 恐怖がパニック売りを引き起こす。
ただし、これはあくまで投機的なシナリオであり、予測でも確定したタイムラインでもありません。
市場はいつでも方向を変える可能性があります。どんなカレンダーよりも、値動き、流動性、マクロ経済の状況、そしてビットコインのトレンドが重要です。
タイムラインを頼りに取引しないでください。根拠を追い、リスクを管理しましょう。
$BTC
{spot}(BTCUSDT)
🚨 ビットコイン 2026–2027:市場心理のロードマップ
すべてのサイクルには物語がある。歴史はまた繰り返すのか?
10月 → 懐疑
11月 → 最後の振るい落とし?
12月 → 買い集め?
1月 → 回復
2月 → euphoria(陶酔感)
3月 → 新たな最高値更新の可能性
4月 → アルトシーズンの可能性
5月 → 強気相場の罠?
6月 → パニック売り?
7月 → 弱気相場?
興味深いのは、市場心理がしばしばサイクルを描くことです。
• 懐疑はためらいを生む。
• FOMOが価格を押し上げる。
• 陶酔感によってリスクが見えなくなる。
• 恐怖がパニック売りを引き起こす。
ただし、これはあくまで投機的なシナリオであり、予測でも確定したタイムラインでもありません。
市場はいつでも方向を変える可能性があります。どんなカレンダーよりも、値動き、流動性、マクロ経済の状況、そしてビットコインのトレンドが重要です。
タイムラインを頼りに取引しないでください。根拠を追い、リスクを管理しましょう。
$BTC
3
1.7k
·
--
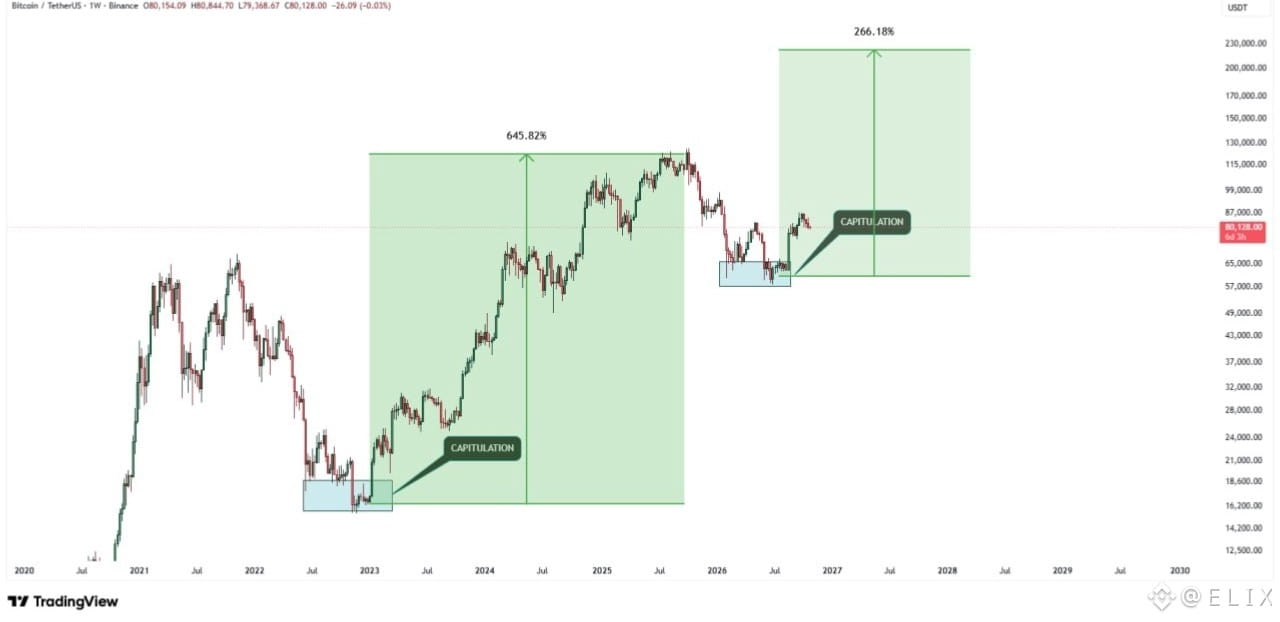
$BTC | 歴史は繰り返さないが、韻を踏むことはよくある。
2022年11月、ビットコインは厳しい投げ売り局面を経験した。その後、市場は足場を固め、大きな回復へと向かった。
今、同じようなパターンが再び展開しているように見える。
歴史から何らかの手がかりが得られるとすれば、この局面は次の大きなサイクルへの転換点となるかもしれない。
$BTC 今後数年で20万ドルを超える新たなATHへの舞台を整えているのだろうか?
判断するにはまだ早いが、類似点には注目する価値がある。
{spot}(BTCUSDT)
$BTC | 歴史は繰り返さないが、韻を踏むことはよくある。
2022年11月、ビットコインは厳しい投げ売り局面を経験した。その後、市場は足場を固め、大きな回復へと向かった。
今、同じようなパターンが再び展開しているように見える。
歴史から何らかの手がかりが得られるとすれば、この局面は次の大きなサイクルへの転換点となるかもしれない。
$BTC 今後数年で20万ドルを超える新たなATHへの舞台を整えているのだろうか?
判断するにはまだ早いが、類似点には注目する価値がある。
2022年11月、ビットコインは厳しい投げ売り局面を経験した。その後、市場は足場を固め、大きな回復へと向かった。
今、同じようなパターンが再び展開しているように見える。
歴史から何らかの手がかりが得られるとすれば、この局面は次の大きなサイクルへの転換点となるかもしれない。
$BTC 今後数年で20万ドルを超える新たなATHへの舞台を整えているのだろうか?
判断するにはまだ早いが、類似点には注目する価値がある。
3
769
·
--
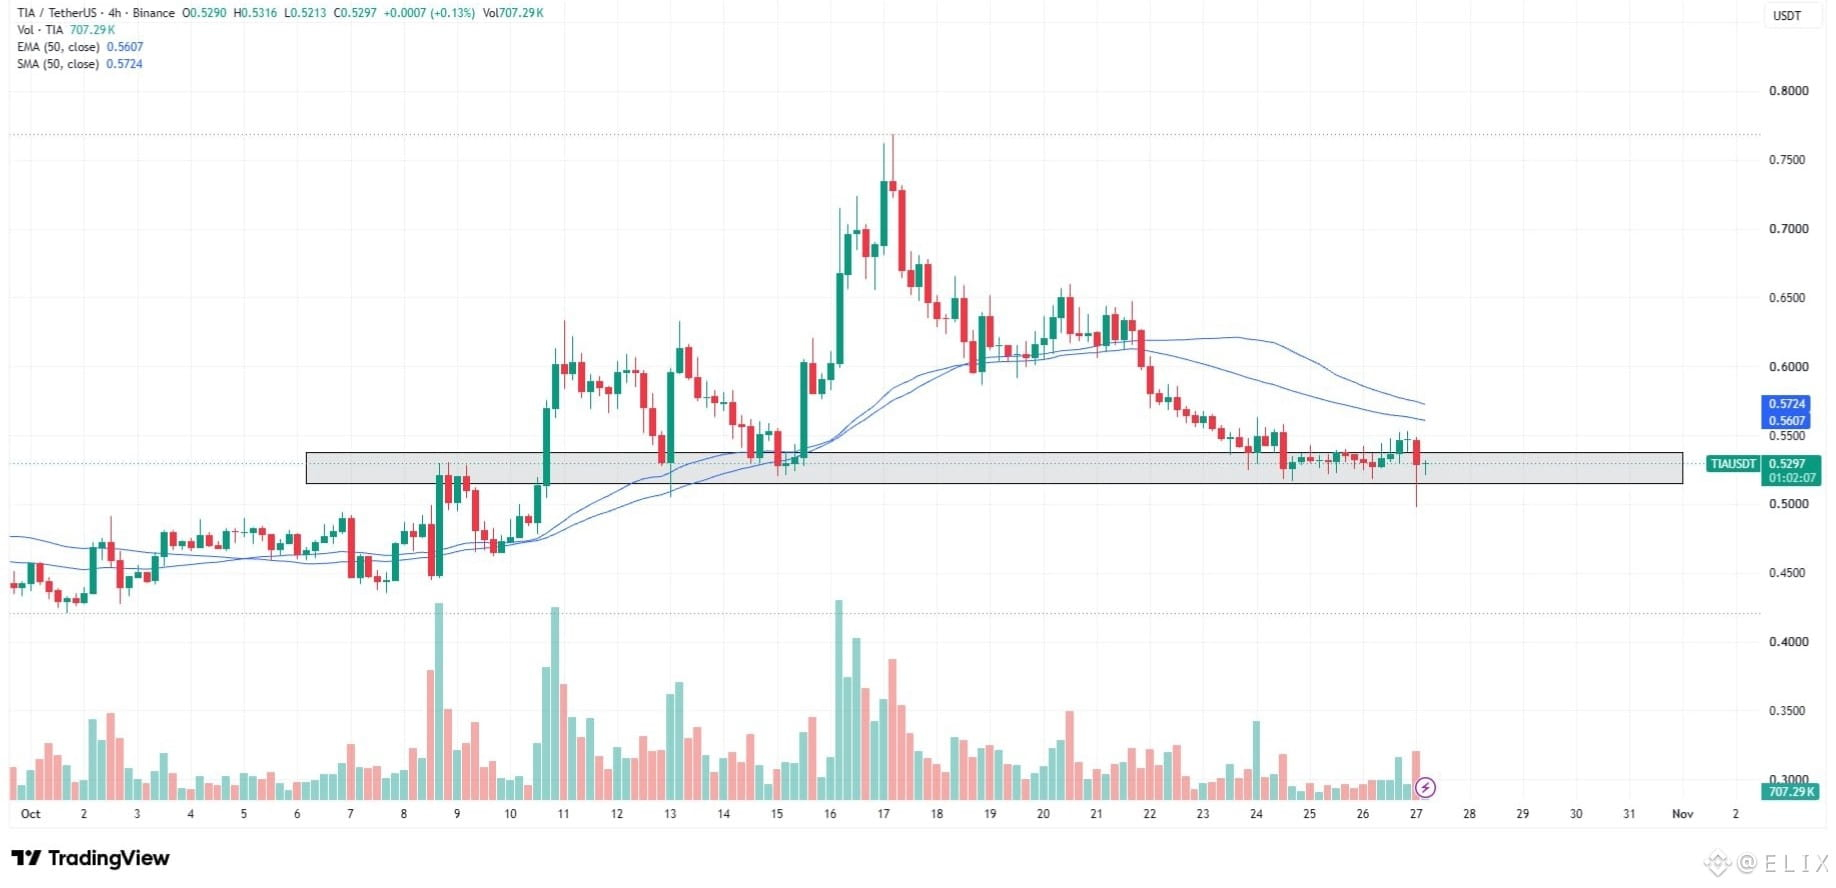
$TIA は重要な水平サポートゾーンを試していますが、最近の売りで強気の構造が弱まっています。
今の優先事項は、買い手がこの水準を守れるかどうかを見極めることです。ここを割り込めば、さらに下落する可能性があります。
焦らず様子を見ています。$BTC が82,000ドルを回復し、市場全体に明確な強さが見られるまでは、ロングの仕掛けは考えていません。
#TIA
$TIA は重要な水平サポートゾーンを試していますが、最近の売りで強気の構造が弱まっています。
今の優先事項は、買い手がこの水準を守れるかどうかを見極めることです。ここを割り込めば、さらに下落する可能性があります。
焦らず様子を見ています。$BTC が82,000ドルを回復し、市場全体に明確な強さが見られるまでは、ロングの仕掛けは考えていません。
#TIA
今の優先事項は、買い手がこの水準を守れるかどうかを見極めることです。ここを割り込めば、さらに下落する可能性があります。
焦らず様子を見ています。$BTC が82,000ドルを回復し、市場全体に明確な強さが見られるまでは、ロングの仕掛けは考えていません。
#TIA
1
293
·
--
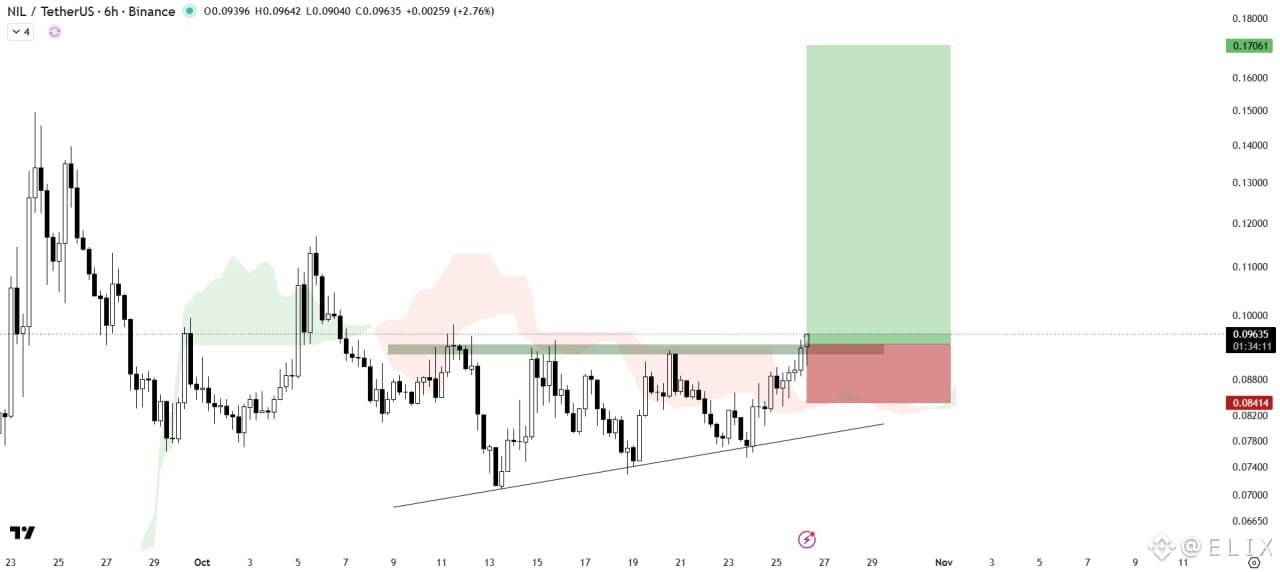
$NIL は、強い出来高を伴って上昇三角形を上抜けた後、 bullish な強さを示しており、今後の展開が期待されます。
一目均衡表の雲も、サポートゾーンとなる可能性を示す根拠をさらに加えています。
上昇の勢いを維持するには、ブレイクアウト水準を上回って推移することが重要です。上昇が続くか注目しましょう。
#nillion #EarningsSeason #BinancePick
{spot}(NILUSDT)
$NIL は、強い出来高を伴って上昇三角形を上抜けた後、 bullish な強さを示しており、今後の展開が期待されます。
一目均衡表の雲も、サポートゾーンとなる可能性を示す根拠をさらに加えています。
上昇の勢いを維持するには、ブレイクアウト水準を上回って推移することが重要です。上昇が続くか注目しましょう。
#nillion #EarningsSeason #BinancePick
一目均衡表の雲も、サポートゾーンとなる可能性を示す根拠をさらに加えています。
上昇の勢いを維持するには、ブレイクアウト水準を上回って推移することが重要です。上昇が続くか注目しましょう。
#nillion #EarningsSeason #BinancePick
1
2
316
·
--
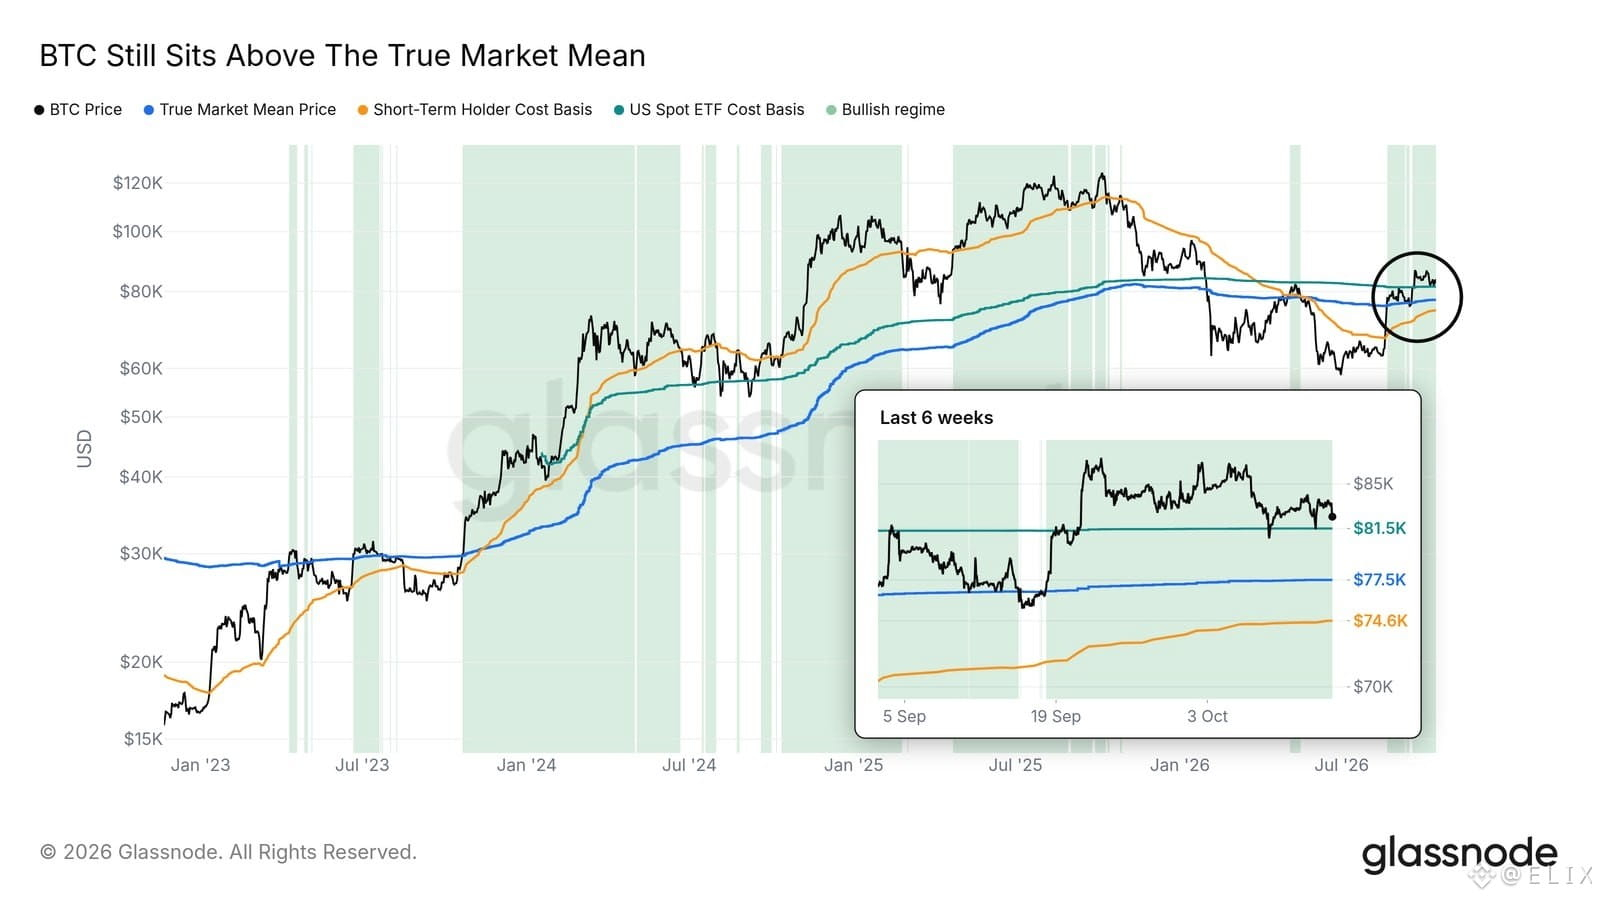
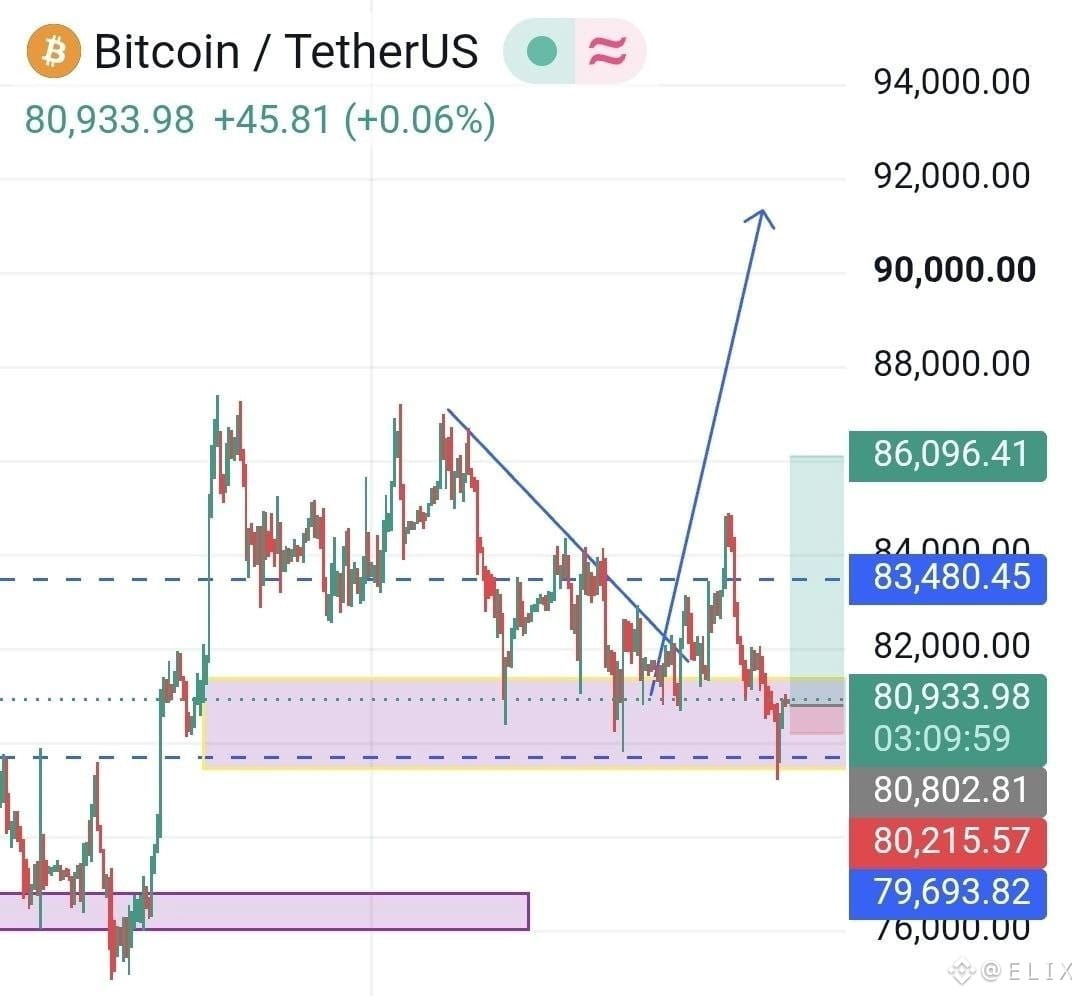
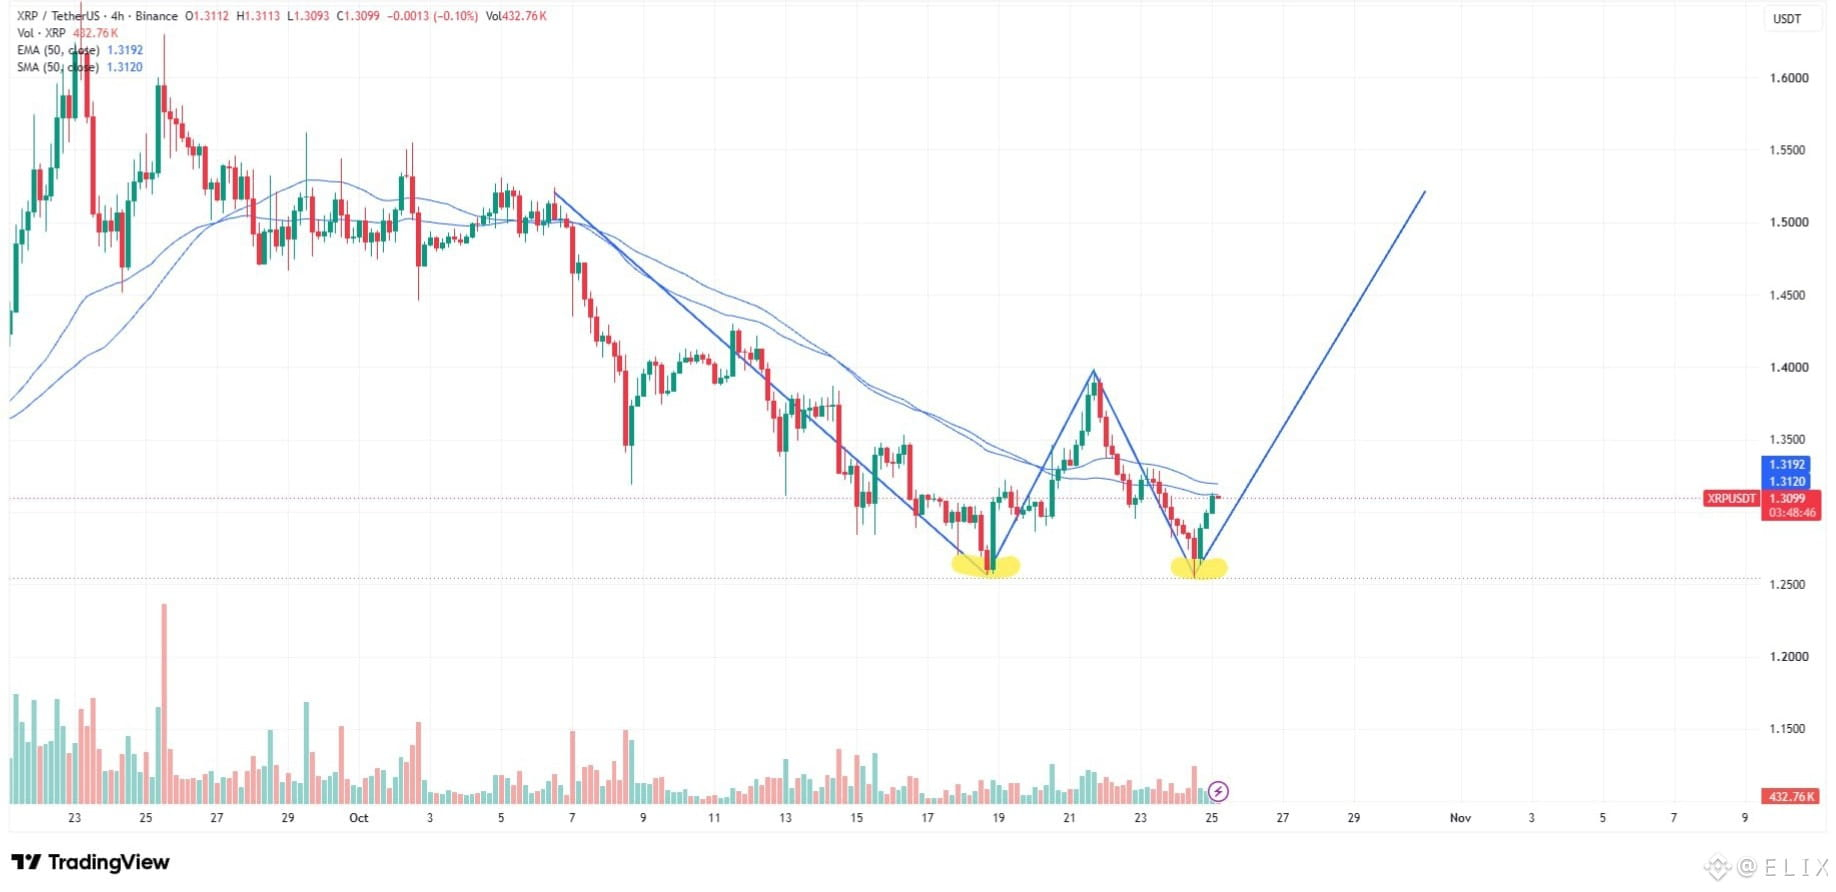
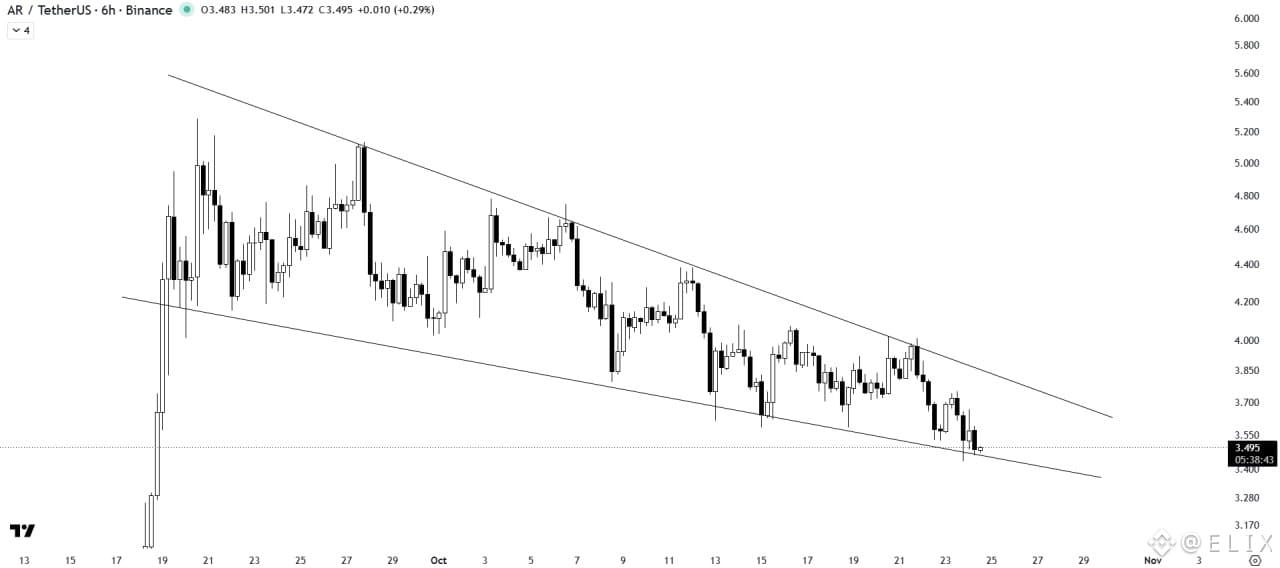
ビットコインの次の重要な試金石は81.5Kドル付近です。
$BTC は、78Kドル付近のTrue Market Mean(真の市場平均値)と短期保有者の取得原価を上回っており、全体的な構造は引き続き良好です。
ただし、注目すべき水準は米国現物ETFの取得原価です。
BTCは10月に2度この水準を下回った後、再び上回りました。
日足の終値が81.5Kドルを下回れば、米国現物ETFの平均保有者が含み損となり、直近のサポートが弱まる可能性があります。
BTCはこの水準を維持できるでしょうか。それとも下回るでしょうか?
#BTC #Bitcoin #Crypto #EarningsSeason
{spot}(BTCUSDT)
ビットコインの次の重要な試金石は81.5Kドル付近です。
$BTC は、78Kドル付近のTrue Market Mean(真の市場平均値)と短期保有者の取得原価を上回っており、全体的な構造は引き続き良好です。
ただし、注目すべき水準は米国現物ETFの取得原価です。
BTCは10月に2度この水準を下回った後、再び上回りました。
日足の終値が81.5Kドルを下回れば、米国現物ETFの平均保有者が含み損となり、直近のサポートが弱まる可能性があります。
BTCはこの水準を維持できるでしょうか。それとも下回るでしょうか?
#BTC #Bitcoin #Crypto #EarningsSeason
$BTC は、78Kドル付近のTrue Market Mean(真の市場平均値)と短期保有者の取得原価を上回っており、全体的な構造は引き続き良好です。
ただし、注目すべき水準は米国現物ETFの取得原価です。
BTCは10月に2度この水準を下回った後、再び上回りました。
日足の終値が81.5Kドルを下回れば、米国現物ETFの平均保有者が含み損となり、直近のサポートが弱まる可能性があります。
BTCはこの水準を維持できるでしょうか。それとも下回るでしょうか?
#BTC #Bitcoin #Crypto #EarningsSeason
1
98
·
--
翻訳参照
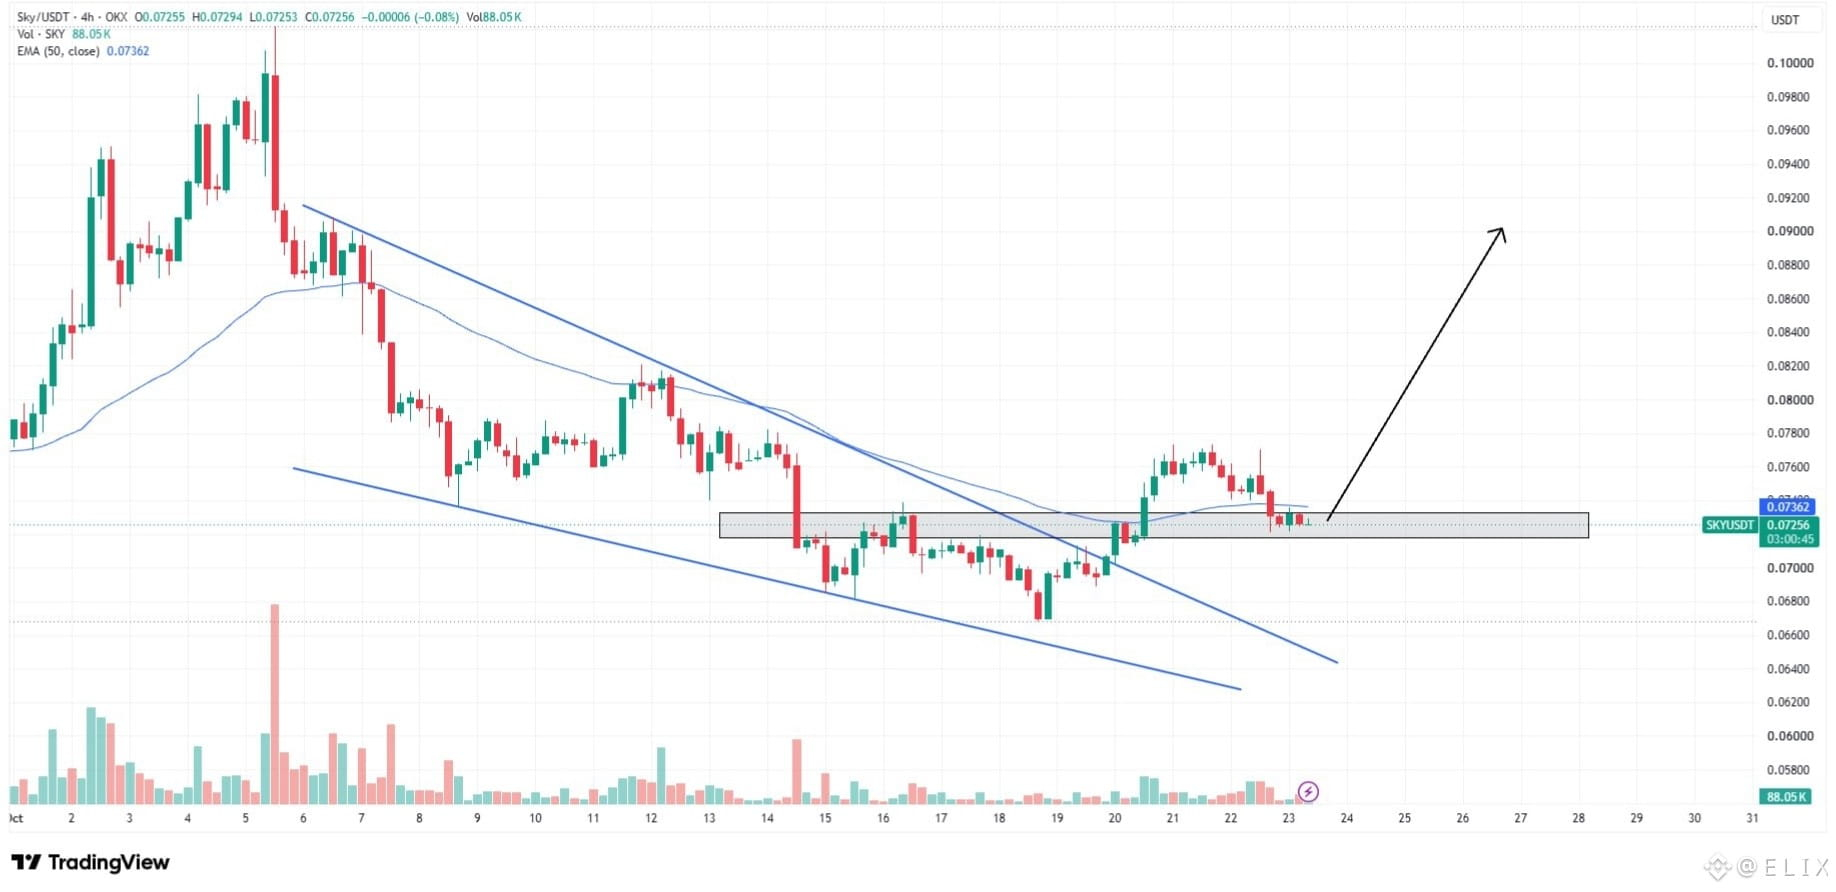
$SKY — The Breakout Is In, Now Comes the Real Test.
$SKY has broken out of its falling wedge and is now retesting the horizontal support zone.
➠ Holding this level could confirm a bullish continuation.
➠ $0.076 is the first resistance to watch.
➠ $0.080 is the next upside level.
The key is simple: support must hold for the breakout to gain strength. A successful retest could open the door for another leg higher, while losing support would weaken the setup.
Watching how $SKY reacts at this level.
{spot}(SKYUSDT)
$SKY — The Breakout Is In, Now Comes the Real Test.
$SKY has broken out of its falling wedge and is now retesting the horizontal support zone.
➠ Holding this level could confirm a bullish continuation.
➠ $0.076 is the first resistance to watch.
➠ $0.080 is the next upside level.
The key is simple: support must hold for the breakout to gain strength. A successful retest could open the door for another leg higher, while losing support would weaken the setup.
Watching how $SKY reacts at this level.
184
·
--
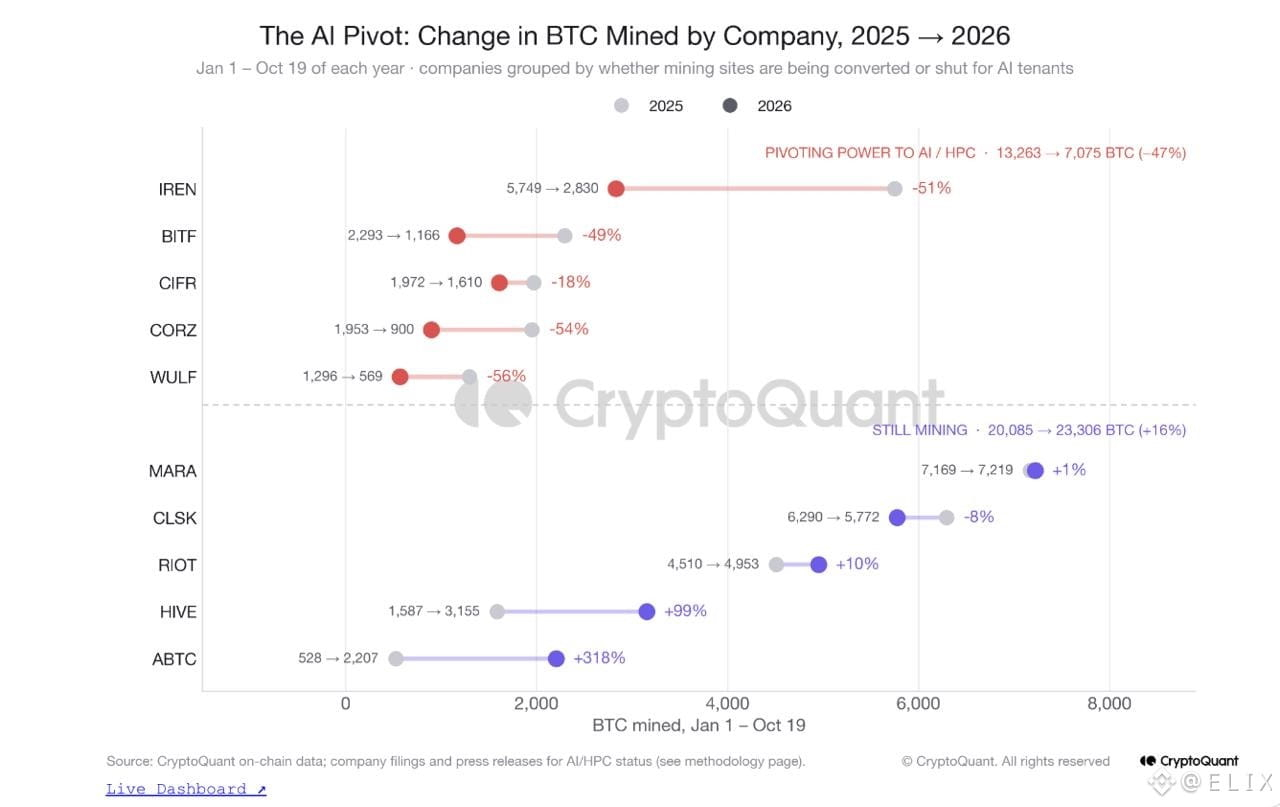
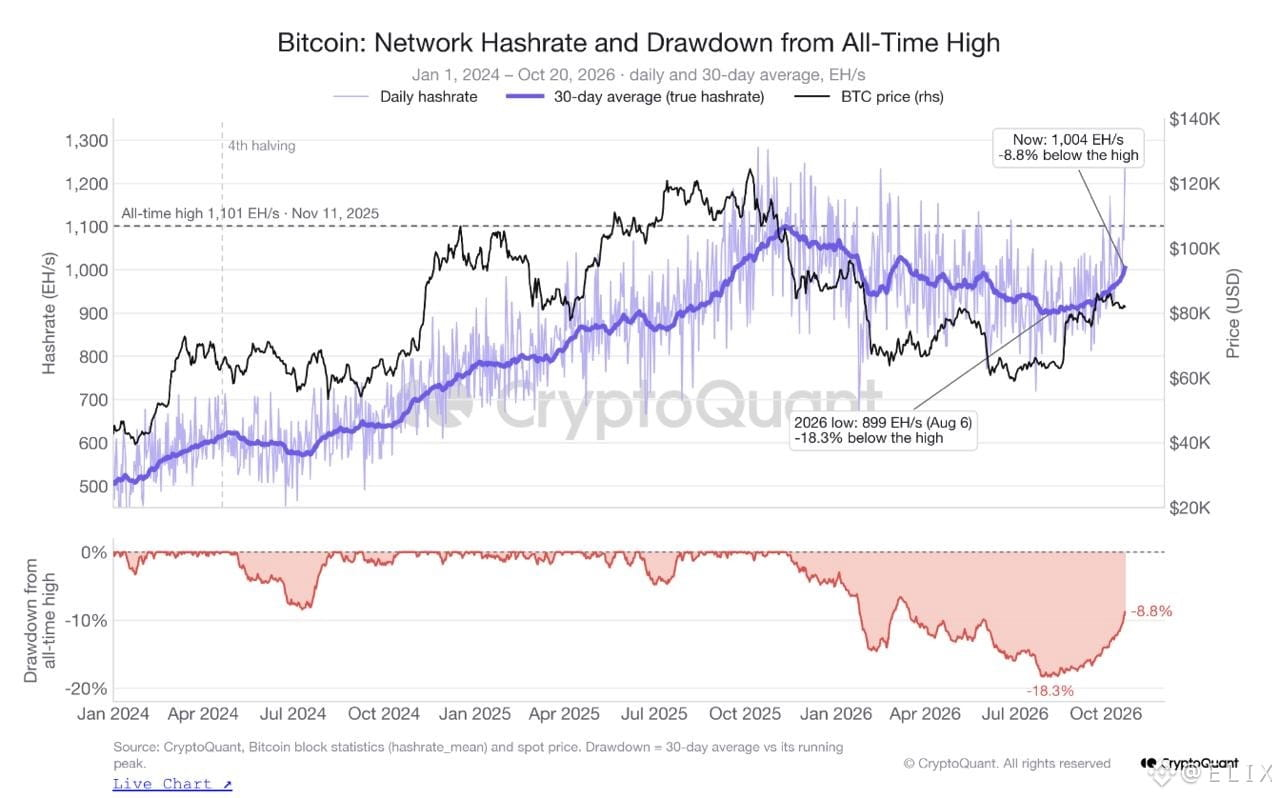
$BTC マイニングは変化している — そしてAIがその動向を大きく左右し始めています。
ビットコインのマイニングデータに、2つの重要な傾向が表れています。
📉 マイニングのハッシュレートが回復しています。
ビットコインのハッシュレートの30日平均は1,004 EH/sまで回復し、2025年11月に記録した過去最高値1,101 EH/sからの下落幅はわずか8.8%に縮小しました。2026年8月には18.3%下落していました。
🤖 一方で、マイニング業界ではAIへのシフトも進んでいます。
2026年1月1日から10月19日までに、AIや高性能コンピューティングへ事業の軸足を移している企業が採掘したBTCは、大幅に減少しました。
• IREN: -51%
• BITF: -49%
• CORZ: -54%
• WULF: -56%
その一方で、ビットコインの生産を維持、または拡大しているマイナーもいます。
• ABTC: +318%
• HIVE: +99%
• RIOT: +10%
• MARA: +1%
より大きな視点で見ると、ビットコインのマイニングは、もはやハッシュレートとブロック報酬だけの問題ではありません。企業は、ビットコインの生産とAIインフラがもたらす潜在的な収益性とのバランスを、ますます重視するようになっています。
この変化は、マイニング業界の競争や運営戦略、そして投資家によるマイニング企業の評価の仕方を変える可能性があります。
重要な問いは、AIへの多角化によってビットコインマイナーの競争力が高まるのか、それともビットコインネットワークの安全確保への取り組みが徐々に弱まるのか、ということです。
#Bitcoin #BTC #Crypto
1
108
·
--
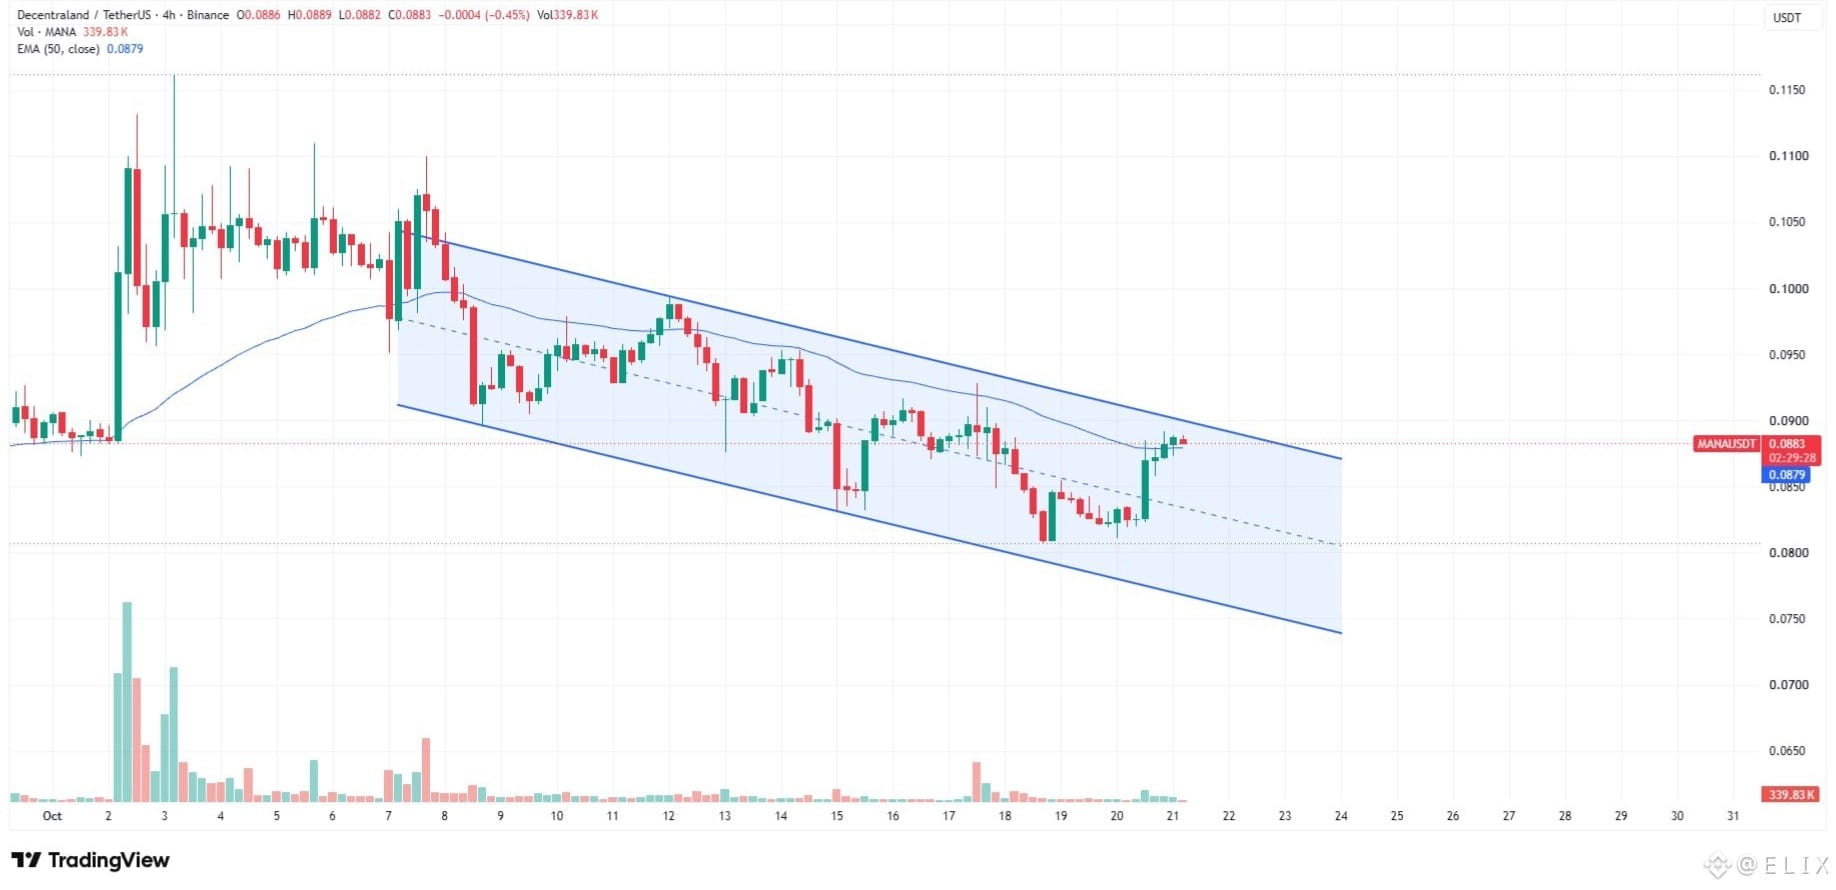
$MANA は重要な判断局面に近づいています。
価格は下降チャネルの下限から反発し、上側のトレンドラインに向けて上昇しています。近くに位置する50 EMAも、注目すべき水準です。
注目しているセットアップは2つです。
▸ チャネルの中央線付近での反応の可能性。 ▸ より強い強気転換につながる、レジスタンス上抜けの確認。
それまでは、先回りせず、辛抱強く見守ります。次の動きは価格に確認させましょう。
#MANA #Crypto #EarningsSeason
{spot}(MANAUSDT)
$MANA は重要な判断局面に近づいています。
価格は下降チャネルの下限から反発し、上側のトレンドラインに向けて上昇しています。近くに位置する50 EMAも、注目すべき水準です。
注目しているセットアップは2つです。
▸ チャネルの中央線付近での反応の可能性。 ▸ より強い強気転換につながる、レジスタンス上抜けの確認。
それまでは、先回りせず、辛抱強く見守ります。次の動きは価格に確認させましょう。
#MANA #Crypto #EarningsSeason
価格は下降チャネルの下限から反発し、上側のトレンドラインに向けて上昇しています。近くに位置する50 EMAも、注目すべき水準です。
注目しているセットアップは2つです。
▸ チャネルの中央線付近での反応の可能性。 ▸ より強い強気転換につながる、レジスタンス上抜けの確認。
それまでは、先回りせず、辛抱強く見守ります。次の動きは価格に確認させましょう。
#MANA #Crypto #EarningsSeason
1
198
·
--
翻訳参照
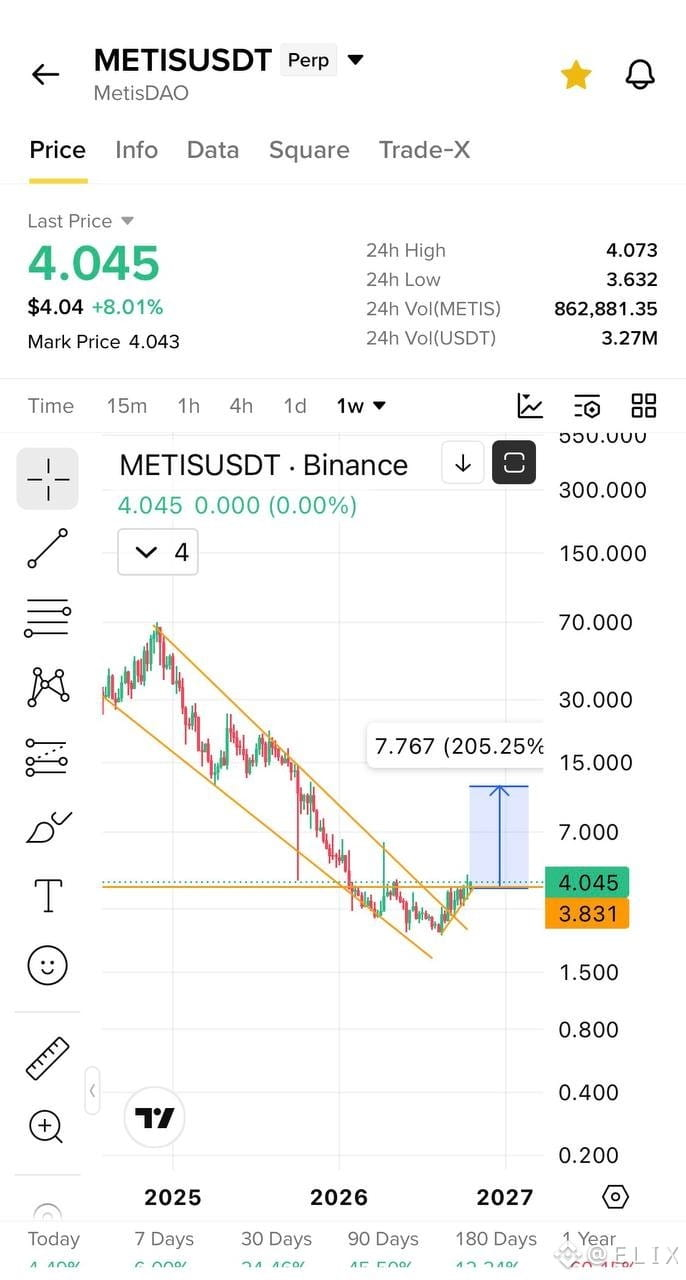
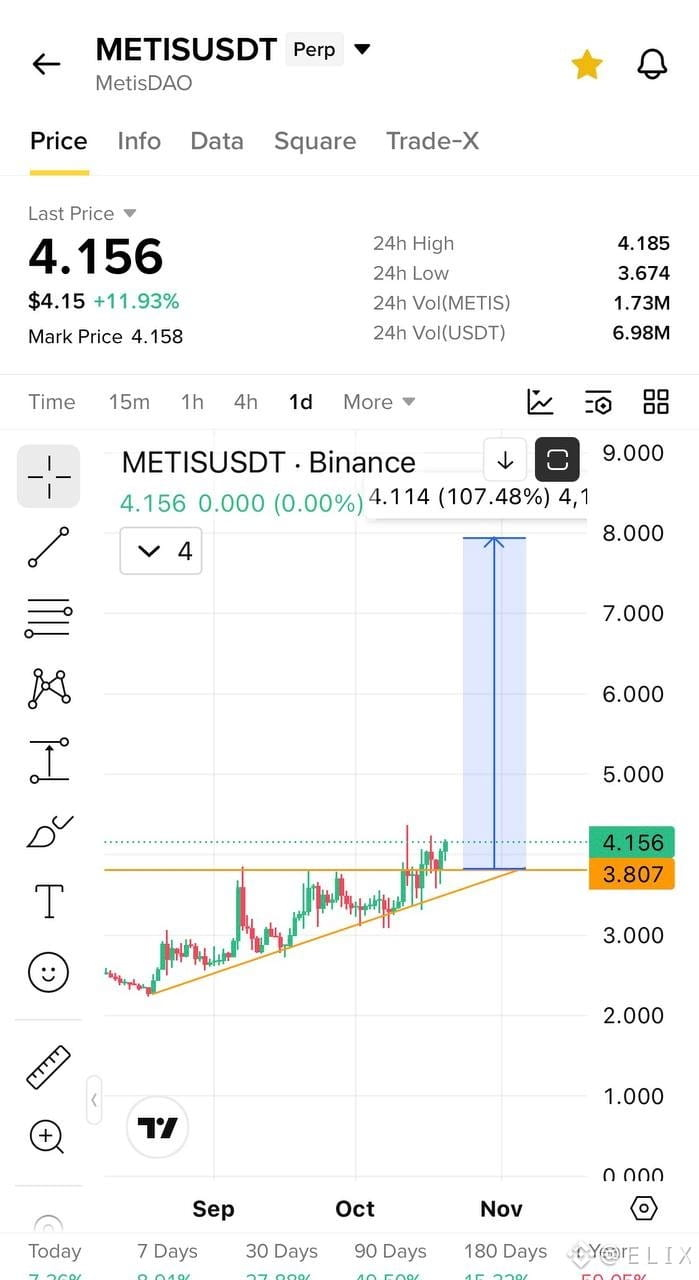
$METIS is showing a promising shift in market structure.
The weekly chart has broken above a long-term descending channel, while the daily chart is retesting the breakout zone and bouncing from support around $3.80.
If this level holds and bullish momentum continues, the next leg higher could be significant.
Weekly breakout. Daily retest. Now watching for continuation.
$METIS is one to keep firmly on the radar. DYOR.
{spot}(METISUSDT)
$METIS is showing a promising shift in market structure.
The weekly chart has broken above a long-term descending channel, while the daily chart is retesting the breakout zone and bouncing from support around $3.80.
If this level holds and bullish momentum continues, the next leg higher could be significant.
Weekly breakout. Daily retest. Now watching for continuation.
$METIS is one to keep firmly on the radar. DYOR.
1
267
ログインして、さらにコンテンツを読む
厳選トピックで世界の暗号資産トレーダーの仲間入り
⚡️ 暗号資産に関する最新かつ有益な情報が見つかります。
💬 世界最大の暗号資産取引所から信頼されています。
👍 認証を受けたクリエイターから、有益なインサイトを得られます。
メール / 電話番号