
Zentick FX
4 投稿

Zentick FX
報告
ユーザーをブロック
Simplifying the crypto market one chart at a time. ICT trader sharing high-probability ETH and BTC setups. Founder of Zentick FX & Privex FX.
低高頻度トレーダー
1.5年
2 フォロー
2 フォロワー
5 いいね
投稿
·
--
翻訳参照
🚀 BEAMX/USDT: +41% Massive Move Captured! 🎯
This trade is the perfect example of why patience and multi-timeframe analysis are crucial in trading. Let's decode the price action logic behind this setup:
📊 Slide 1: Daily Timeframe (Macro View)
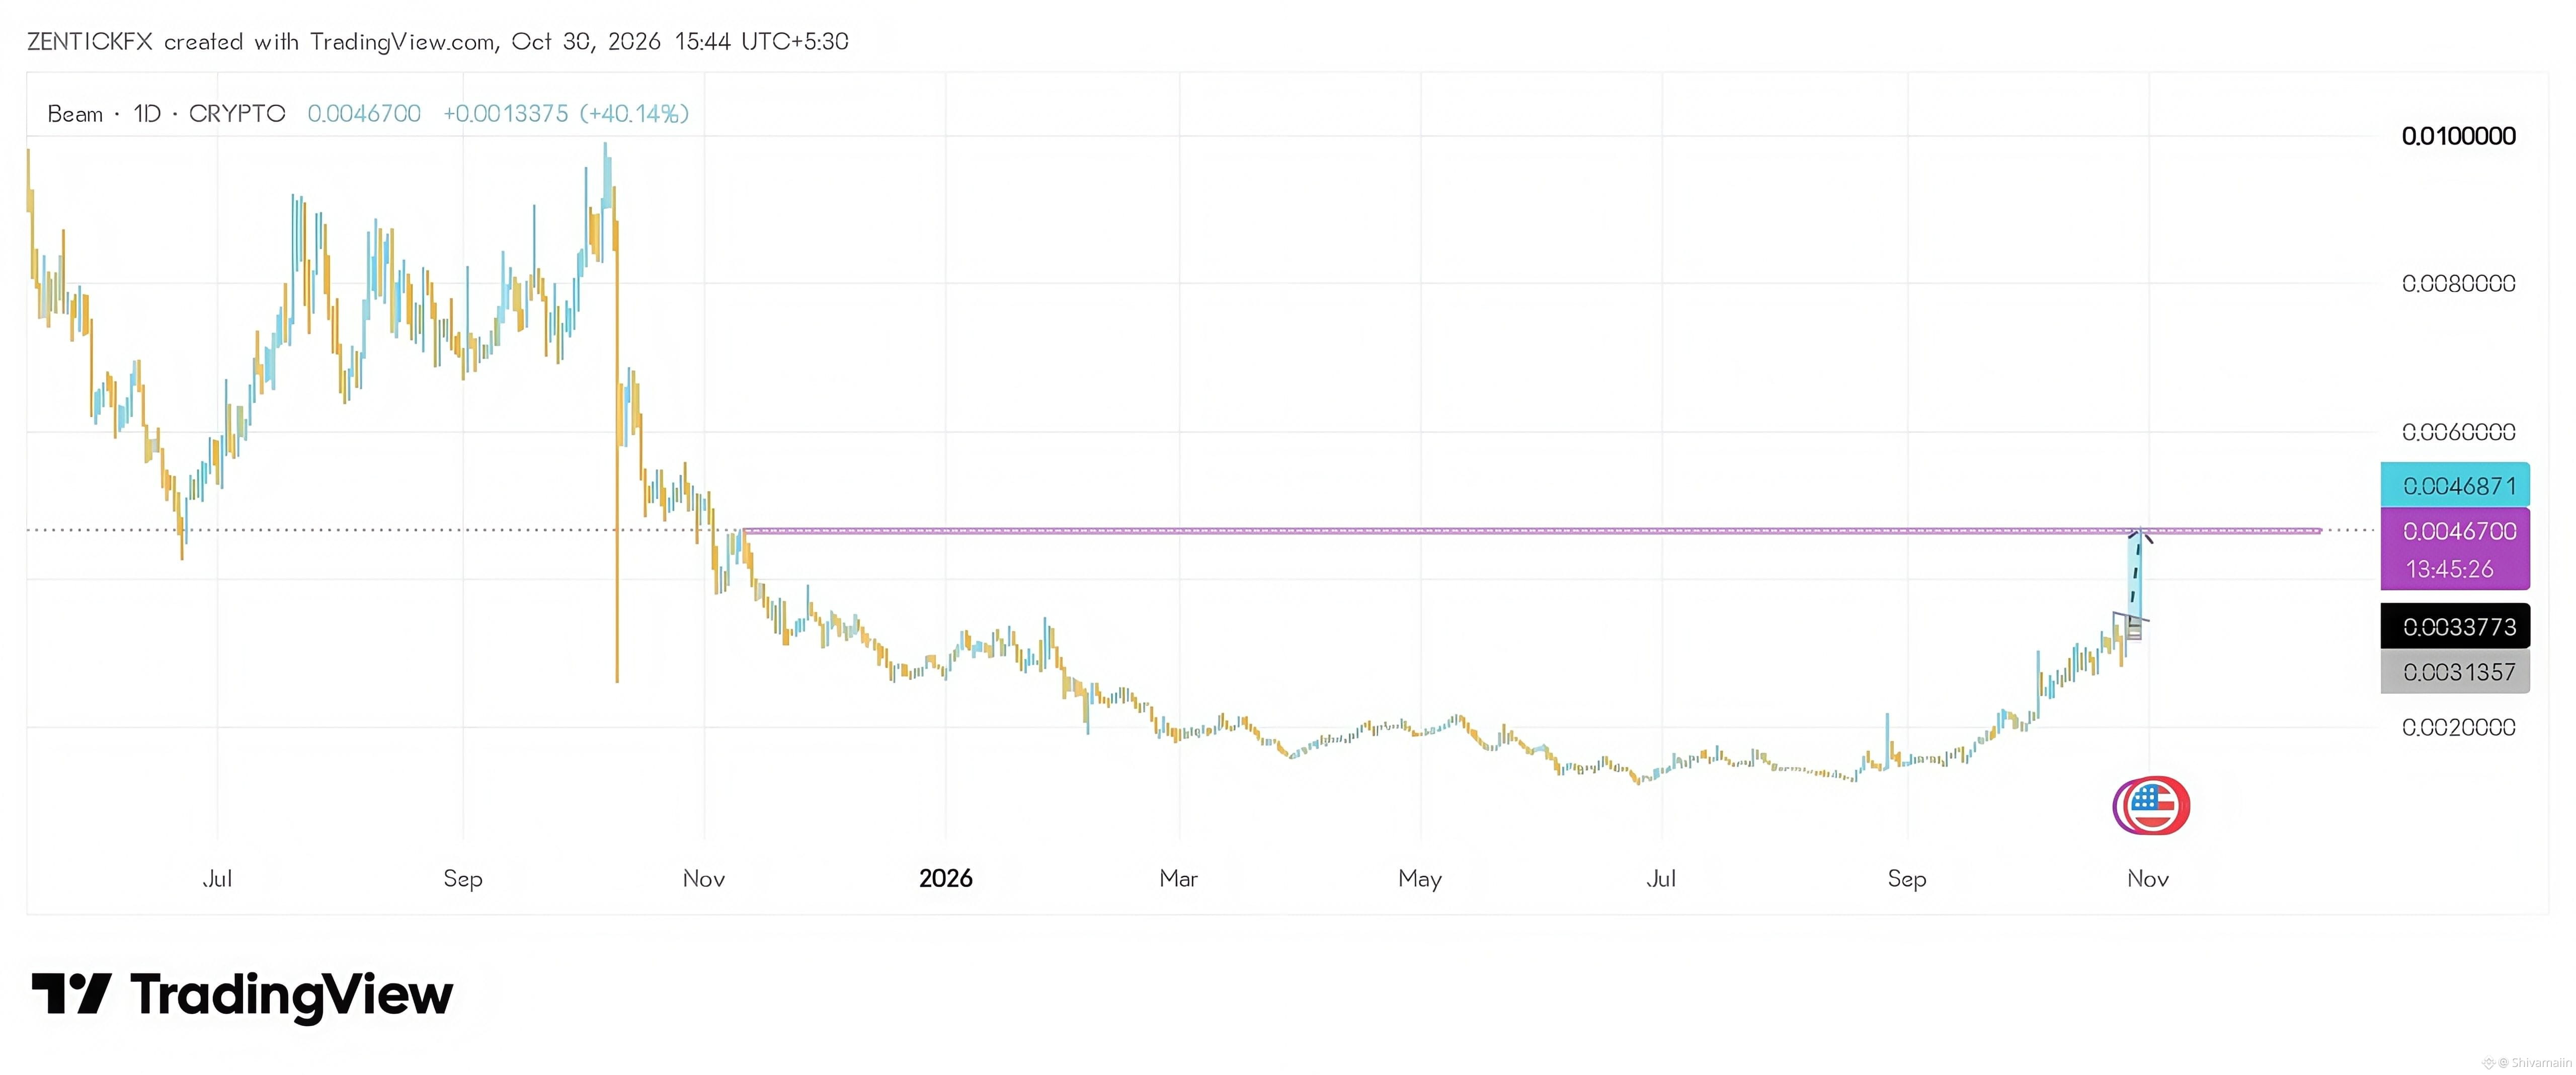
As you can see in the first chart, BEAM was in a long accumulation phase. We identified and marked a major daily resistance level at the purple line (0.0046700). Once the price broke out of this extended consolidation, the bullish direction became crystal clear.
🔍 Slide 2: 1H Timeframe (Precision Entry)
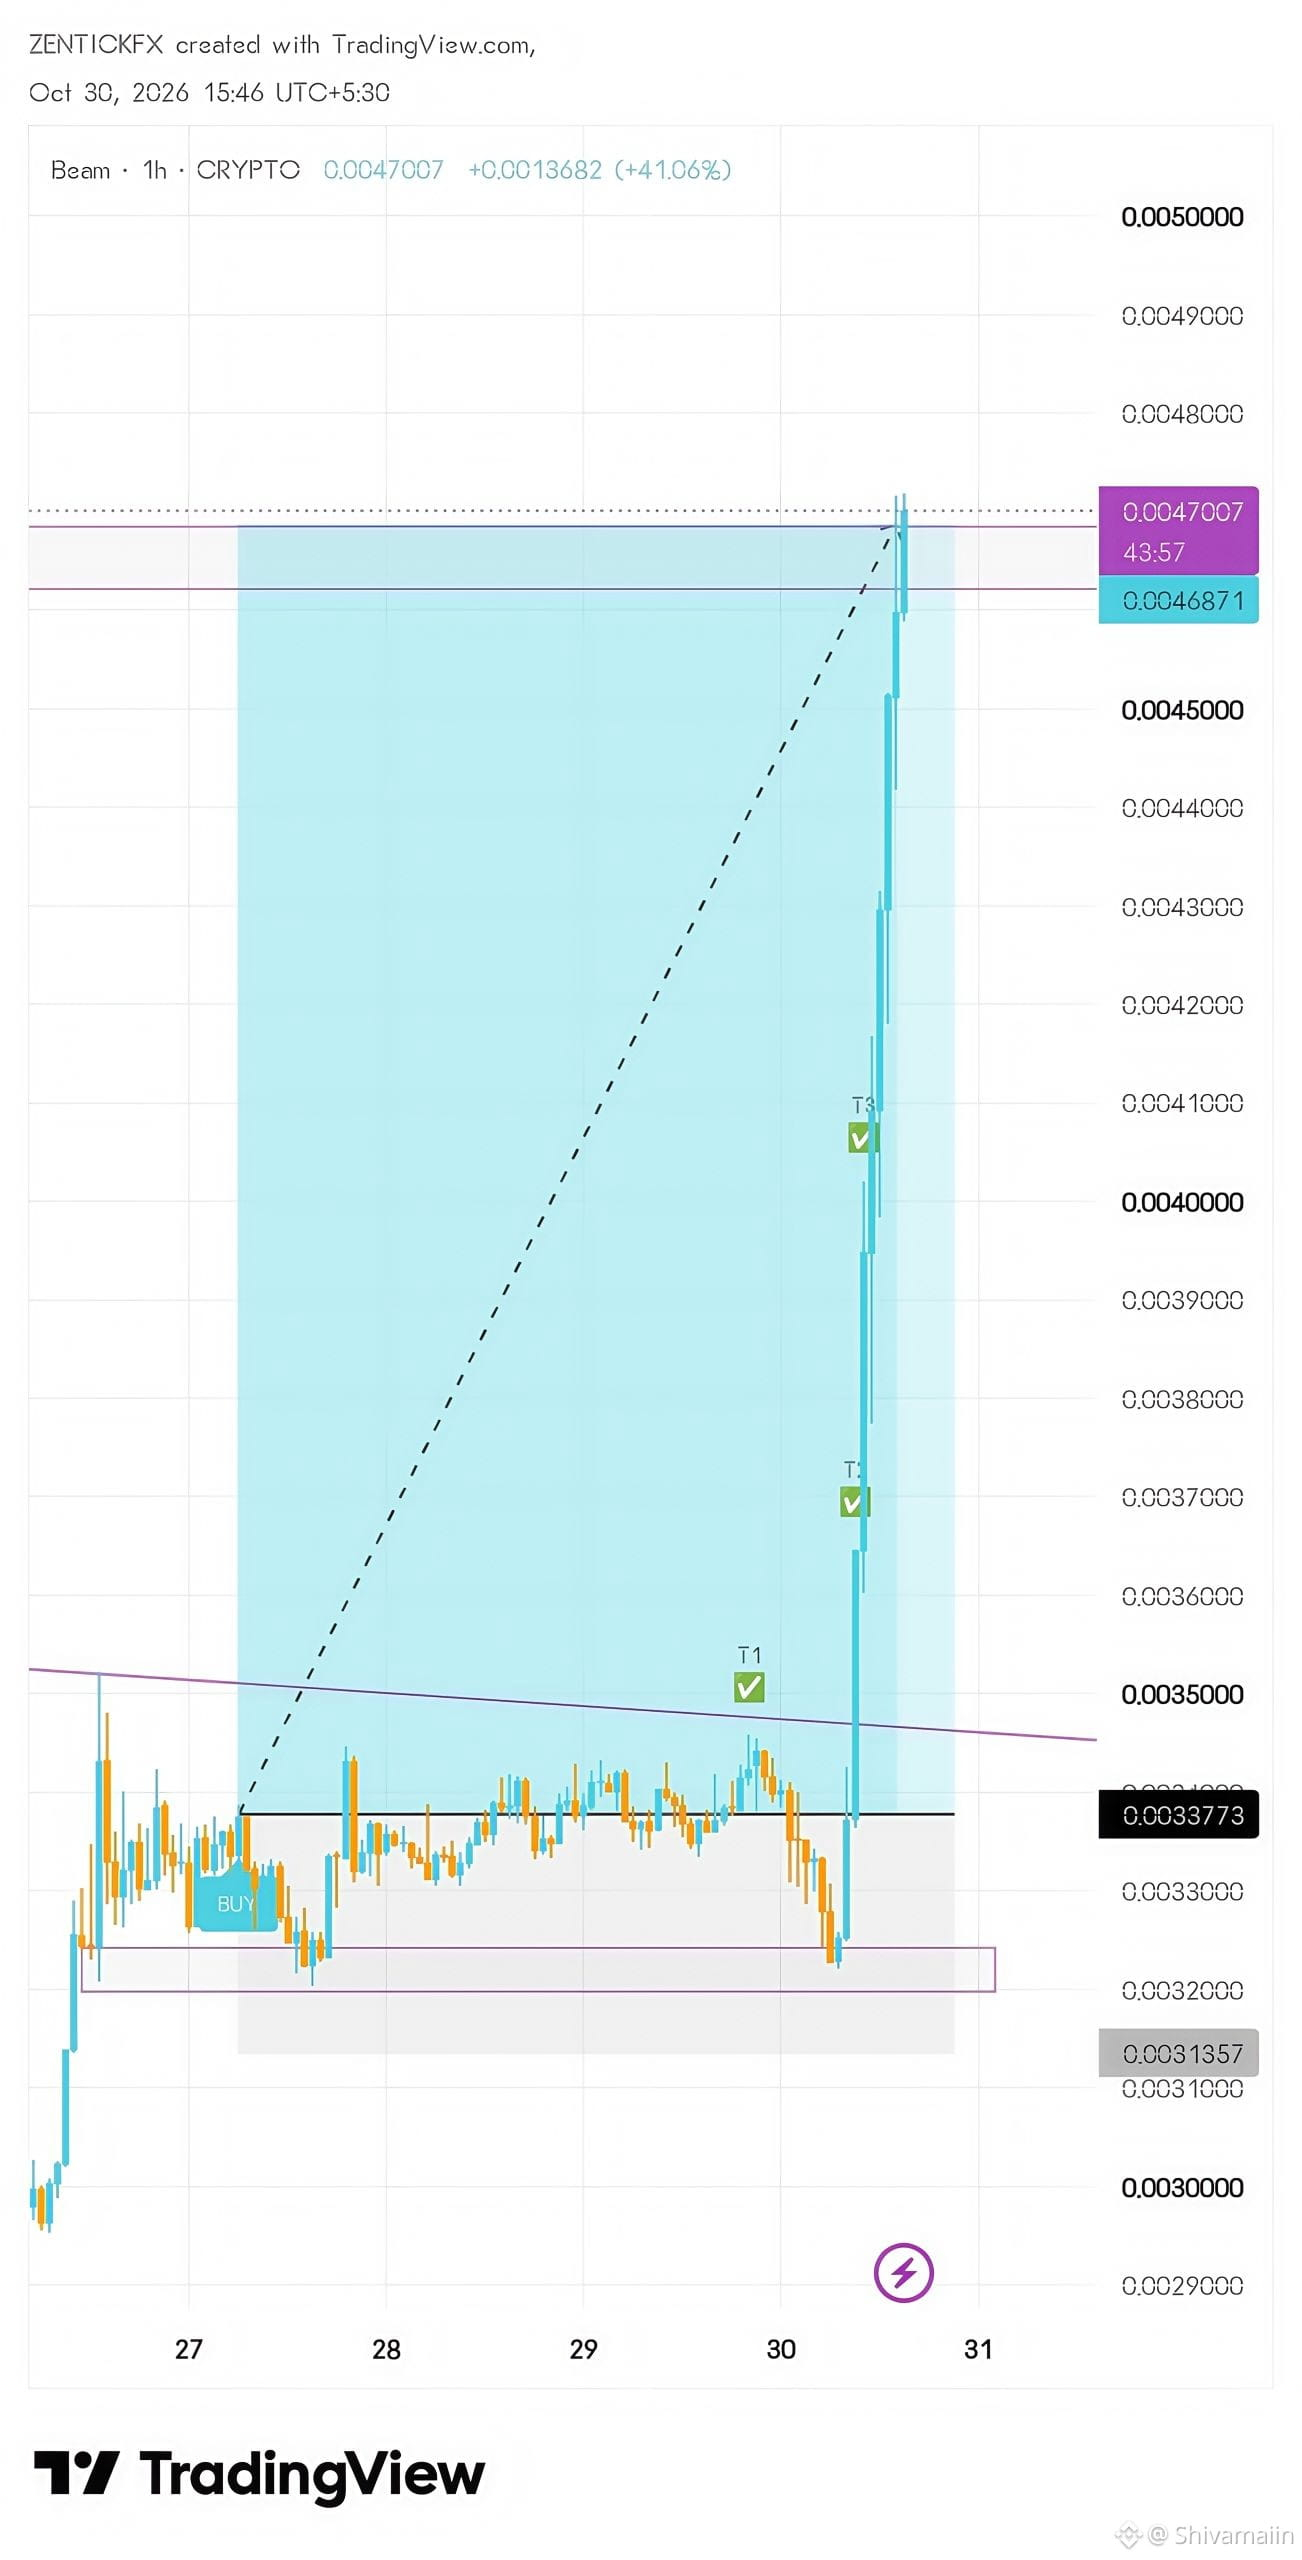
After confirming our daily bullish bias, we dropped down to the 1H chart to pinpoint our entry. The 'Buy' setup was executed following a solid bounce from the support zone and clear price action confirmation. The result? A massive, clean vertical move that smashed all our Take Profit (T1, T2, T3) targets perfectly with virtually zero drawdown! ✅
Trading with clear logic and price action will always beat taking random trades. 🧠
What are your thoughts? Will BEAM hold above this major resistance and push higher, or are we due for a correction?
$Let me know in the comments below! 👇
Follow @Shivamaiin for more high-probability setups, ICT concepts, and logical market analysis.
#BEAMX/USDT #CryptoTrading #priceaction #ZentickFX #CryptoSignals #BinanceSquare
🚀 BEAMX/USDT: +41% Massive Move Captured! 🎯
This trade is the perfect example of why patience and multi-timeframe analysis are crucial in trading. Let's decode the price action logic behind this setup:
📊 Slide 1: Daily Timeframe (Macro View)
As you can see in the first chart, BEAM was in a long accumulation phase. We identified and marked a major daily resistance level at the purple line (0.0046700). Once the price broke out of this extended consolidation, the bullish direction became crystal clear.
🔍 Slide 2: 1H Timeframe (Precision Entry)
After confirming our daily bullish bias, we dropped down to the 1H chart to pinpoint our entry. The 'Buy' setup was executed following a solid bounce from the support zone and clear price action confirmation. The result? A massive, clean vertical move that smashed all our Take Profit (T1, T2, T3) targets perfectly with virtually zero drawdown! ✅
Trading with clear logic and price action will always beat taking random trades. 🧠
What are your thoughts? Will BEAM hold above this major resistance and push higher, or are we due for a correction?
$Let me know in the comments below! 👇
Follow @Shivamaiin for more high-probability setups, ICT concepts, and logical market analysis.
#BEAMX/USDT #CryptoTrading #priceaction #ZentickFX #CryptoSignals #BinanceSquare
This trade is the perfect example of why patience and multi-timeframe analysis are crucial in trading. Let's decode the price action logic behind this setup:
📊 Slide 1: Daily Timeframe (Macro View)
As you can see in the first chart, BEAM was in a long accumulation phase. We identified and marked a major daily resistance level at the purple line (0.0046700). Once the price broke out of this extended consolidation, the bullish direction became crystal clear.
🔍 Slide 2: 1H Timeframe (Precision Entry)
After confirming our daily bullish bias, we dropped down to the 1H chart to pinpoint our entry. The 'Buy' setup was executed following a solid bounce from the support zone and clear price action confirmation. The result? A massive, clean vertical move that smashed all our Take Profit (T1, T2, T3) targets perfectly with virtually zero drawdown! ✅
Trading with clear logic and price action will always beat taking random trades. 🧠
What are your thoughts? Will BEAM hold above this major resistance and push higher, or are we due for a correction?
$Let me know in the comments below! 👇
Follow @Shivamaiin for more high-probability setups, ICT concepts, and logical market analysis.
#BEAMX/USDT #CryptoTrading #priceaction #ZentickFX #CryptoSignals #BinanceSquare
1
208
·
--
翻訳参照
$BTC 📈 Learning crypto one step at a time. Consistency beats luck. 🚀 #Bitcoin #Binance
$BTC 📈 Learning crypto one step at a time. Consistency beats luck. 🚀 #Bitcoin #Binance
1
91
ログインして、さらにコンテンツを読む
厳選トピックで世界の暗号資産トレーダーの仲間入り
⚡️ 暗号資産に関する最新かつ有益な情報が見つかります。
💬 世界最大の暗号資産取引所から信頼されています。
👍 認証を受けたクリエイターから、有益なインサイトを得られます。
メール / 電話番号