

Satoshi_Nakamoto_0078
8 投稿

Satoshi_Nakamoto_0078
報告
ユーザーをブロック
取引を発注
低高頻度トレーダー
2.7年
0 フォロー
0 フォロワー
1 いいね
投稿
ポートフォリオ
記事
翻訳参照
IOTA/USDT — The Quiet Accumulation Is No Longer Quiet. 👀⚡IOTA/USDT — The Quiet Accumulation Is No Longer Quiet. 👀⚡
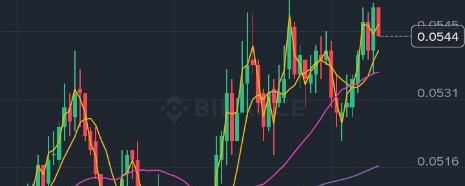
IOTA is showing a very interesting 15-minute structure: after falling to the $0.0491 area, price made a sharp recovery and pushed back toward the $0.0556 session high. At the moment shown in the chart, IOTA is around $0.0544, up 8.58% over 24 hours, with 24-hour volume of roughly 135.42M IOTA. The technical structure is notable because price is holding above MA(7) at $0.0541, MA(25) at $0.0536, and MA(99) at $0.0517 — meaning the short-, medium-, and longer-term averages shown on this timeframe are all sitting below price.
What makes the chart more interesting is the sequence: deep pullback → strong reversal → volume expansion → recovery above the moving averages → repeated tests of the upper range. The $0.0556 area is currently the clearest nearby resistance visible on the chart, while the $0.0541–$0.0536 zone becomes an important reference area if momentum starts cooling. A deeper move toward the $0.0517 region would represent a much larger loss of short-term momentum.
This move also appears consistent with broader technical momentum rather than a single obvious IOTA-specific news catalyst. A current CoinMarketCap analysis similarly attributes recent IOTA strength mainly to technical momentum, increased volume and broader altcoin rotation. �
CoinMarketCap
But here is the part many people miss: a strong green candle does not automatically mean a new trend has been confirmed. The real story is whether price can continue holding the higher structure after the initial surge. If volume fades while price repeatedly fails around the recent high, that can indicate that momentum is losing strength. On the other hand, continued higher highs and higher lows would show that buyers are maintaining control of the short-term structure.
IOTA itself has also undergone substantial technical development in 2026, including the Starfish consensus work and other protocol improvements reported by the IOTA Foundation. �
IOTA Blog
So the chart is not simply “IOTA is up 8.58%.” The more interesting observation is this: IOTA went from a $0.0491 intraday low to a $0.0556 high, while reclaiming multiple moving-average levels and maintaining elevated activity. Now the market is testing whether that recovery can develop into a sustained structure — or whether the recent surge eventually turns into a pullback.
IOTA/USDT — The Quiet Accumulation Is No Longer Quiet. 👀⚡
IOTA/USDT — The Quiet Accumulation Is No Longer Quiet. 👀⚡
IOTA is showing a very interesting 15-minute structure: after falling to the $0.0491 area, price made a sharp recovery and pushed back toward the $0.0556 session high. At the moment shown in the chart, IOTA is around $0.0544, up 8.58% over 24 hours, with 24-hour volume of roughly 135.42M IOTA. The technical structure is notable because price is holding above MA(7) at $0.0541, MA(25) at $0.0536, and MA(99) at $0.0517 — meaning the short-, medium-, and longer-term averages shown on this timeframe are all sitting below price.
What makes the chart more interesting is the sequence: deep pullback → strong reversal → volume expansion → recovery above the moving averages → repeated tests of the upper range. The $0.0556 area is currently the clearest nearby resistance visible on the chart, while the $0.0541–$0.0536 zone becomes an important reference area if momentum starts cooling. A deeper move toward the $0.0517 region would represent a much larger loss of short-term momentum.
This move also appears consistent with broader technical momentum rather than a single obvious IOTA-specific news catalyst. A current CoinMarketCap analysis similarly attributes recent IOTA strength mainly to technical momentum, increased volume and broader altcoin rotation. �
CoinMarketCap
But here is the part many people miss: a strong green candle does not automatically mean a new trend has been confirmed. The real story is whether price can continue holding the higher structure after the initial surge. If volume fades while price repeatedly fails around the recent high, that can indicate that momentum is losing strength. On the other hand, continued higher highs and higher lows would show that buyers are maintaining control of the short-term structure.
IOTA itself has also undergone substantial technical development in 2026, including the Starfish consensus work and other protocol improvements reported by the IOTA Foundation. �
IOTA Blog
So the chart is not simply “IOTA is up 8.58%.” The more interesting observation is this: IOTA went from a $0.0491 intraday low to a $0.0556 high, while reclaiming multiple moving-average levels and maintaining elevated activity. Now the market is testing whether that recovery can develop into a sustained structure — or whether the recent surge eventually turns into a pullback.
IOTA is showing a very interesting 15-minute structure: after falling to the $0.0491 area, price made a sharp recovery and pushed back toward the $0.0556 session high. At the moment shown in the chart, IOTA is around $0.0544, up 8.58% over 24 hours, with 24-hour volume of roughly 135.42M IOTA. The technical structure is notable because price is holding above MA(7) at $0.0541, MA(25) at $0.0536, and MA(99) at $0.0517 — meaning the short-, medium-, and longer-term averages shown on this timeframe are all sitting below price.
What makes the chart more interesting is the sequence: deep pullback → strong reversal → volume expansion → recovery above the moving averages → repeated tests of the upper range. The $0.0556 area is currently the clearest nearby resistance visible on the chart, while the $0.0541–$0.0536 zone becomes an important reference area if momentum starts cooling. A deeper move toward the $0.0517 region would represent a much larger loss of short-term momentum.
This move also appears consistent with broader technical momentum rather than a single obvious IOTA-specific news catalyst. A current CoinMarketCap analysis similarly attributes recent IOTA strength mainly to technical momentum, increased volume and broader altcoin rotation. �
CoinMarketCap
But here is the part many people miss: a strong green candle does not automatically mean a new trend has been confirmed. The real story is whether price can continue holding the higher structure after the initial surge. If volume fades while price repeatedly fails around the recent high, that can indicate that momentum is losing strength. On the other hand, continued higher highs and higher lows would show that buyers are maintaining control of the short-term structure.
IOTA itself has also undergone substantial technical development in 2026, including the Starfish consensus work and other protocol improvements reported by the IOTA Foundation. �
IOTA Blog
So the chart is not simply “IOTA is up 8.58%.” The more interesting observation is this: IOTA went from a $0.0491 intraday low to a $0.0556 high, while reclaiming multiple moving-average levels and maintaining elevated activity. Now the market is testing whether that recovery can develop into a sustained structure — or whether the recent surge eventually turns into a pullback.
88
·
--
ブリッシュ
ALGO/USDT — 突然のブレイクアウト。しかし、これが始まりなのか?👀⚡
アルゴランド(Algorand)が、突然注目を集めるコインの1つになりました。ALGOは15分足チャートで約0.1369ドル付近で取引されており、24時間で16%以上の強い値動きを見せています。注目すべきは単なる上昇率ではなく、ALGOが0.115〜0.120ドル付近の落ち着いたレンジから、0.1376ドルへ向けた鋭いブレイクアウトまで、いかに素早く移行したかです。
チャートでは、価格と取引活動の双方における明確な拡大が確認できます。ALGOはさらに、MA(7)が0.1337ドル、MA(25)が0.1318ドル、MA(99)が0.1221ドルを上回る水準で取引されており、強い短期モメンタムを示しています。最近の市場分析でも、この動きは、はっきりと特定できるALGO固有の発表によるものというより、主にテクニカルなモメンタムと、再燃した市場の関心によって押し上げられたものだと説明されています。 �
CoinMarketCap
ただ、ここで気になる疑問があります。このような動きは今後も続くのでしょうか?それとも価格が突然後退する可能性もあるのでしょうか?
急上昇の後は、調整が起きるのは常にあり得ます。0.1376ドルのあたりは現在のチャート上の高値であり、0.1337ドルおよび0.1318ドルのあたりは、モメンタムが弱まった場合の重要なテクニカル指標となります。単なる押し目だからといって、それが自動的にプロジェクトの詐欺を意味するわけではありませんし、このチャートだけからALGOが不正だと証明できるものもありません。「ポンプ&ダンプ」と呼ぶには、突発的な価格上昇以上の強い根拠が必要です。
いまALGOが興味深いのは、チャートが明確に変化している点です。長いレンジ(低迷)→ブレイクアウト→出来高の拡大→直近高値のテスト。
次の局面が、物語をより面白くします。市場はその勢いを維持するのか、それともトレーダーが利確を始めて、価格を以前のレンジに押し戻すのか。
確かなことが1つあります。ALGOは、比較的落ち着いていた状態から、かなり注意深く見守るべきコインへと変わったのです。👀 #ALGO #ALGO_USDT #ALGO/USDT #Binance
ALGO/USDT — 突然のブレイクアウト。しかし、これが始まりなのか?👀⚡
アルゴランド(Algorand)が、突然注目を集めるコインの1つになりました。ALGOは15分足チャートで約0.1369ドル付近で取引されており、24時間で16%以上の強い値動きを見せています。注目すべきは単なる上昇率ではなく、ALGOが0.115〜0.120ドル付近の落ち着いたレンジから、0.1376ドルへ向けた鋭いブレイクアウトまで、いかに素早く移行したかです。
チャートでは、価格と取引活動の双方における明確な拡大が確認できます。ALGOはさらに、MA(7)が0.1337ドル、MA(25)が0.1318ドル、MA(99)が0.1221ドルを上回る水準で取引されており、強い短期モメンタムを示しています。最近の市場分析でも、この動きは、はっきりと特定できるALGO固有の発表によるものというより、主にテクニカルなモメンタムと、再燃した市場の関心によって押し上げられたものだと説明されています。 �
CoinMarketCap
ただ、ここで気になる疑問があります。このような動きは今後も続くのでしょうか?それとも価格が突然後退する可能性もあるのでしょうか?
急上昇の後は、調整が起きるのは常にあり得ます。0.1376ドルのあたりは現在のチャート上の高値であり、0.1337ドルおよび0.1318ドルのあたりは、モメンタムが弱まった場合の重要なテクニカル指標となります。単なる押し目だからといって、それが自動的にプロジェクトの詐欺を意味するわけではありませんし、このチャートだけからALGOが不正だと証明できるものもありません。「ポンプ&ダンプ」と呼ぶには、突発的な価格上昇以上の強い根拠が必要です。
いまALGOが興味深いのは、チャートが明確に変化している点です。長いレンジ(低迷)→ブレイクアウト→出来高の拡大→直近高値のテスト。
次の局面が、物語をより面白くします。市場はその勢いを維持するのか、それともトレーダーが利確を始めて、価格を以前のレンジに押し戻すのか。
確かなことが1つあります。ALGOは、比較的落ち着いていた状態から、かなり注意深く見守るべきコインへと変わったのです。👀 #ALGO #ALGO_USDT #ALGO/USDT #Binance
アルゴランド(Algorand)が、突然注目を集めるコインの1つになりました。ALGOは15分足チャートで約0.1369ドル付近で取引されており、24時間で16%以上の強い値動きを見せています。注目すべきは単なる上昇率ではなく、ALGOが0.115〜0.120ドル付近の落ち着いたレンジから、0.1376ドルへ向けた鋭いブレイクアウトまで、いかに素早く移行したかです。
チャートでは、価格と取引活動の双方における明確な拡大が確認できます。ALGOはさらに、MA(7)が0.1337ドル、MA(25)が0.1318ドル、MA(99)が0.1221ドルを上回る水準で取引されており、強い短期モメンタムを示しています。最近の市場分析でも、この動きは、はっきりと特定できるALGO固有の発表によるものというより、主にテクニカルなモメンタムと、再燃した市場の関心によって押し上げられたものだと説明されています。 �
CoinMarketCap
ただ、ここで気になる疑問があります。このような動きは今後も続くのでしょうか?それとも価格が突然後退する可能性もあるのでしょうか?
急上昇の後は、調整が起きるのは常にあり得ます。0.1376ドルのあたりは現在のチャート上の高値であり、0.1337ドルおよび0.1318ドルのあたりは、モメンタムが弱まった場合の重要なテクニカル指標となります。単なる押し目だからといって、それが自動的にプロジェクトの詐欺を意味するわけではありませんし、このチャートだけからALGOが不正だと証明できるものもありません。「ポンプ&ダンプ」と呼ぶには、突発的な価格上昇以上の強い根拠が必要です。
いまALGOが興味深いのは、チャートが明確に変化している点です。長いレンジ(低迷)→ブレイクアウト→出来高の拡大→直近高値のテスト。
次の局面が、物語をより面白くします。市場はその勢いを維持するのか、それともトレーダーが利確を始めて、価格を以前のレンジに押し戻すのか。
確かなことが1つあります。ALGOは、比較的落ち着いていた状態から、かなり注意深く見守るべきコインへと変わったのです。👀 #ALGO #ALGO_USDT #ALGO/USDT #Binance
69
·
--
ブリッシュ
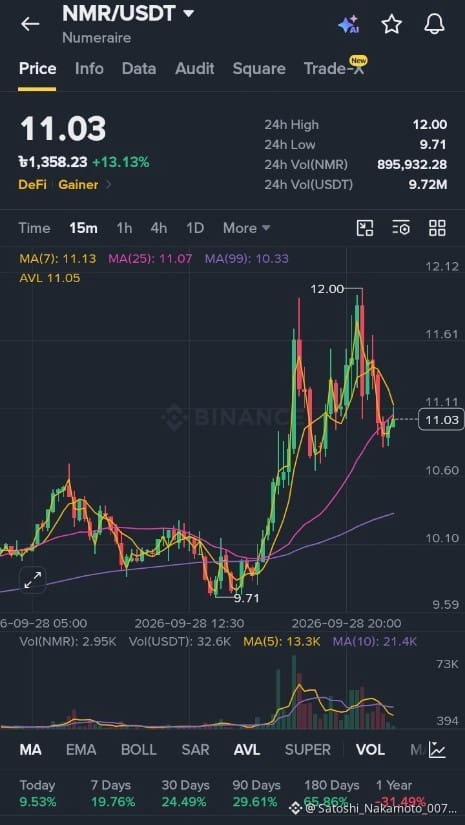
NMRは15分足チャートで驚くほど強い復活を見せています。現在の価格は約11.03ドルで、過去24時間で約13.13%上昇しています。24時間安値の9.71ドルから高値12.00ドルまで動いた後です。
この動きで特に興味深いのは、回復の速さです。9.71ドル近辺からNMRは鋭く上昇し、10〜11ドルのレンジを上抜け、心理的節目である12ドルに到達したのち、いったん押し戻されました。さらに、値動きの間にも取引活動が大幅に拡大しており、この上昇が市場参加の目立った増加を伴っていたことがうかがえます。
テクニカル構造も注目に値します。MA(99)は約10.33ドル、MA(25)は約11.07ドル、MA(7)は約11.13ドルです。つまり、大きな上昇の後に現在の価格は短期移動平均の近くに位置していることになります。12.00ドルの水準は直近の高値として際立っており、勢いが冷めてくる場合には、11.00〜10.60ドルのゾーンが重要な監視ポイントになります。
いちばん驚く点は?NMRは序盤の多くの時間、10ドル付近で取引されていたのに、突然12ドルへ向けて加速したことです。静かなレンジ相場から、爆発的なボラティリティへ移行する――そのような変化こそが、このチャートを見逃せないものにしています。
NMRは確実に再び注目の的です。今の重要な問いは、単にどこまで上がれるかだけではありません。この動きの背後にある勢いと出来高を、市場が維持できるかどうかです。#NMRBullish #NMR #NMR/USDT #Binance
NMRは15分足チャートで驚くほど強い復活を見せています。現在の価格は約11.03ドルで、過去24時間で約13.13%上昇しています。24時間安値の9.71ドルから高値12.00ドルまで動いた後です。
この動きで特に興味深いのは、回復の速さです。9.71ドル近辺からNMRは鋭く上昇し、10〜11ドルのレンジを上抜け、心理的節目である12ドルに到達したのち、いったん押し戻されました。さらに、値動きの間にも取引活動が大幅に拡大しており、この上昇が市場参加の目立った増加を伴っていたことがうかがえます。
テクニカル構造も注目に値します。MA(99)は約10.33ドル、MA(25)は約11.07ドル、MA(7)は約11.13ドルです。つまり、大きな上昇の後に現在の価格は短期移動平均の近くに位置していることになります。12.00ドルの水準は直近の高値として際立っており、勢いが冷めてくる場合には、11.00〜10.60ドルのゾーンが重要な監視ポイントになります。
いちばん驚く点は?NMRは序盤の多くの時間、10ドル付近で取引されていたのに、突然12ドルへ向けて加速したことです。静かなレンジ相場から、爆発的なボラティリティへ移行する――そのような変化こそが、このチャートを見逃せないものにしています。
NMRは確実に再び注目の的です。今の重要な問いは、単にどこまで上がれるかだけではありません。この動きの背後にある勢いと出来高を、市場が維持できるかどうかです。#NMRBullish #NMR #NMR/USDT #Binance
この動きで特に興味深いのは、回復の速さです。9.71ドル近辺からNMRは鋭く上昇し、10〜11ドルのレンジを上抜け、心理的節目である12ドルに到達したのち、いったん押し戻されました。さらに、値動きの間にも取引活動が大幅に拡大しており、この上昇が市場参加の目立った増加を伴っていたことがうかがえます。
テクニカル構造も注目に値します。MA(99)は約10.33ドル、MA(25)は約11.07ドル、MA(7)は約11.13ドルです。つまり、大きな上昇の後に現在の価格は短期移動平均の近くに位置していることになります。12.00ドルの水準は直近の高値として際立っており、勢いが冷めてくる場合には、11.00〜10.60ドルのゾーンが重要な監視ポイントになります。
いちばん驚く点は?NMRは序盤の多くの時間、10ドル付近で取引されていたのに、突然12ドルへ向けて加速したことです。静かなレンジ相場から、爆発的なボラティリティへ移行する――そのような変化こそが、このチャートを見逃せないものにしています。
NMRは確実に再び注目の的です。今の重要な問いは、単にどこまで上がれるかだけではありません。この動きの背後にある勢いと出来高を、市場が維持できるかどうかです。#NMRBullish #NMR #NMR/USDT #Binance
145
翻訳参照
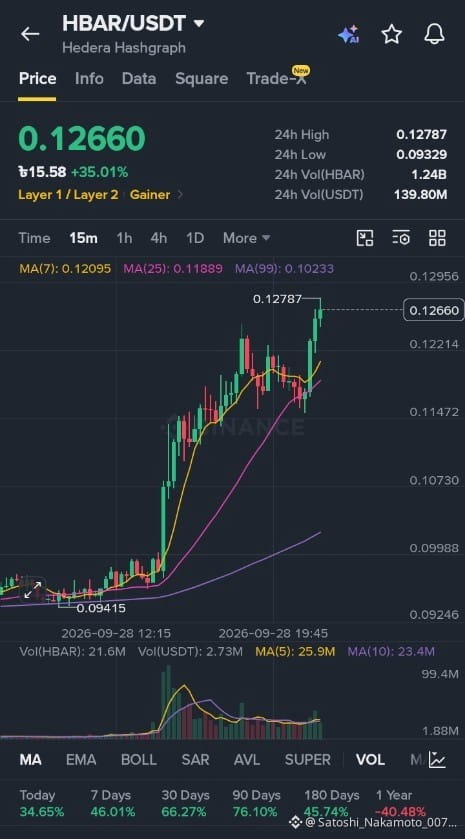
HBAR/USDT has entered a powerful momentum phase. On the 15-minute chart, HBAR is trading around 0.12660 USDT, up approximately 35.01% in 24 hours, while the market has pushed toward a fresh intraday high of 0.12787. The structure is clearly showing strong upward momentum, with price holding well above the MA(7) at 0.12095, MA(25) at 0.11889, and MA(99) at 0.10233. This strong alignment highlights the intensity of the current move. What makes this setup stand out is the combination of a major breakout, sustained price strength, and elevated trading volume. The 0.12787–0.12956 zone is now an important area to watch, while the 0.12214 and 0.11889 regions provide key chart references if momentum cools down. After such a rapid move, volatility can increase sharply, so the next candles and volume confirmation will be critical. This is no longer a quiet chart — HBAR has clearly awakened, and the market is now watching to see whether this momentum can sustain itself.#hbar #HBARUSD #HBARUSDT #HBAR/BTC #Binance
HBAR/USDT has entered a powerful momentum phase. On the 15-minute chart, HBAR is trading around 0.12660 USDT, up approximately 35.01% in 24 hours, while the market has pushed toward a fresh intraday high of 0.12787. The structure is clearly showing strong upward momentum, with price holding well above the MA(7) at 0.12095, MA(25) at 0.11889, and MA(99) at 0.10233. This strong alignment highlights the intensity of the current move. What makes this setup stand out is the combination of a major breakout, sustained price strength, and elevated trading volume. The 0.12787–0.12956 zone is now an important area to watch, while the 0.12214 and 0.11889 regions provide key chart references if momentum cools down. After such a rapid move, volatility can increase sharply, so the next candles and volume confirmation will be critical. This is no longer a quiet chart — HBAR has clearly awakened, and the market is now watching to see whether this momentum can sustain itself.#hbar #HBARUSD #HBARUSDT #HBAR/BTC #Binance
51
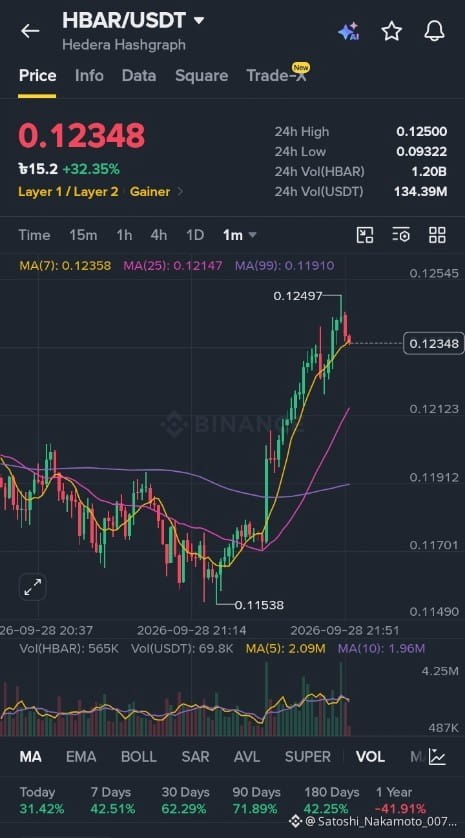
HBAR/USDTは1分足チャートで短期的に強い上昇(ブル)ムーブを見せています。現在の価格は約0.12348 USDTで、24時間での上昇率は32.35%と、強い買い圧力が確認できます。価格は最近約0.12497の高値に到達しましたが、その後わずかに押し戻されており、0.12500付近のレジスタンス付近で売り圧があることを示唆しています。移動平均もポジティブな位置にあります。MA(7)は0.12358、MA(25)は0.12147、MA(99)は0.11910です。現在の価格がこれら3つの移動平均すべてを上回っているため、短期トレンドは依然として強気です。ただし、これは1分足であり、価格がすでに急上昇しているため、ボラティリティの上昇や急な押し戻しが起こり得ます。0.121〜0.122のエリアは近いサポートとして注目でき、0.12500は重要なレジスタンスエリアです。全体としてチャートは強い上昇モメンタムを示していますが、取引判断を行う前に上位足での確認や出来高(ボリューム)があるとより有用です。#HBARUSD #HBARPrice #HBARUSDT #hbar #Binance
HBAR/USDTは1分足チャートで短期的に強い上昇(ブル)ムーブを見せています。現在の価格は約0.12348 USDTで、24時間での上昇率は32.35%と、強い買い圧力が確認できます。価格は最近約0.12497の高値に到達しましたが、その後わずかに押し戻されており、0.12500付近のレジスタンス付近で売り圧があることを示唆しています。移動平均もポジティブな位置にあります。MA(7)は0.12358、MA(25)は0.12147、MA(99)は0.11910です。現在の価格がこれら3つの移動平均すべてを上回っているため、短期トレンドは依然として強気です。ただし、これは1分足であり、価格がすでに急上昇しているため、ボラティリティの上昇や急な押し戻しが起こり得ます。0.121〜0.122のエリアは近いサポートとして注目でき、0.12500は重要なレジスタンスエリアです。全体としてチャートは強い上昇モメンタムを示していますが、取引判断を行う前に上位足での確認や出来高(ボリューム)があるとより有用です。#HBARUSD #HBARPrice #HBARUSDT #hbar #Binance
65
翻訳参照
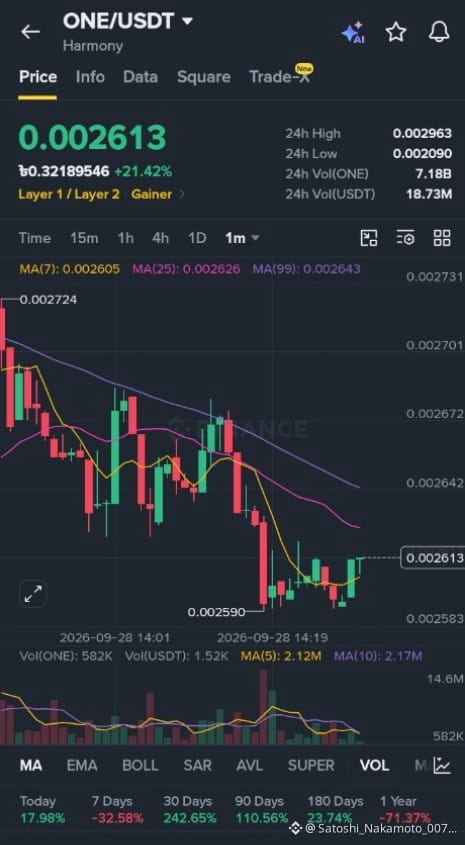
ONE has shown strong short-term recovery, with the price currently around 0.002613 USDT.
The coin is up about 21.42% over the last 24 hours, showing strong recent buying activity.
The price bounced from around 0.002590, which indicates some buying support at the recent low.
The latest candles show a small upward move, suggesting that buyers are trying to regain short-term momentum.The overall short-term trend still looks weak because the price is below the MA(25) at 0.002626 and MA(99) at 0.002643.
The moving averages are generally pointing downward, which indicates that the broader short-term trend remains bearish.
ONE is down around 32.58% over 7 days and about 71.37% over 1 year, showing significant previous weakness.
The current bounce is still relatively small compared with the previous decline, so a reversal has not yet been confirmed.
The price may face resistance around 0.002626–0.002643, followed by the 0.002672 area.#Binance #ONE/USDT #BTC走势分析
ONE has shown strong short-term recovery, with the price currently around 0.002613 USDT.
The coin is up about 21.42% over the last 24 hours, showing strong recent buying activity.
The price bounced from around 0.002590, which indicates some buying support at the recent low.
The latest candles show a small upward move, suggesting that buyers are trying to regain short-term momentum.The overall short-term trend still looks weak because the price is below the MA(25) at 0.002626 and MA(99) at 0.002643.
The moving averages are generally pointing downward, which indicates that the broader short-term trend remains bearish.
ONE is down around 32.58% over 7 days and about 71.37% over 1 year, showing significant previous weakness.
The current bounce is still relatively small compared with the previous decline, so a reversal has not yet been confirmed.
The price may face resistance around 0.002626–0.002643, followed by the 0.002672 area.#Binance #ONE/USDT #BTC走势分析
The coin is up about 21.42% over the last 24 hours, showing strong recent buying activity.
The price bounced from around 0.002590, which indicates some buying support at the recent low.
The latest candles show a small upward move, suggesting that buyers are trying to regain short-term momentum.The overall short-term trend still looks weak because the price is below the MA(25) at 0.002626 and MA(99) at 0.002643.
The moving averages are generally pointing downward, which indicates that the broader short-term trend remains bearish.
ONE is down around 32.58% over 7 days and about 71.37% over 1 year, showing significant previous weakness.
The current bounce is still relatively small compared with the previous decline, so a reversal has not yet been confirmed.
The price may face resistance around 0.002626–0.002643, followed by the 0.002672 area.#Binance #ONE/USDT #BTC走势分析
257
翻訳参照
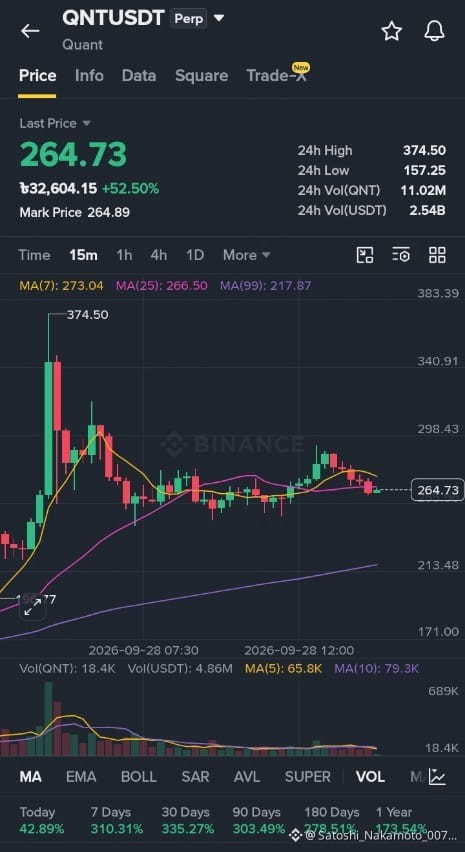
“The QNT/USDT chart shows a strong upward movement in price over the last 24 hours. The current price is around 264.73 USDT, while the 24-hour high is 374.50 USDT and the low is 157.25 USDT. The chart indicates that QNT experienced significant volatility, with a sharp rise followed by a period of consolidation. The 7-period moving average is around 273.04, while the 25-period moving average is around 266.50. Trading volume increased significantly during the major price movement and then gradually decreased. Overall, the chart shows strong recent momentum but also high volatility.”#TrendingTopic #UNI📈
“The QNT/USDT chart shows a strong upward movement in price over the last 24 hours. The current price is around 264.73 USDT, while the 24-hour high is 374.50 USDT and the low is 157.25 USDT. The chart indicates that QNT experienced significant volatility, with a sharp rise followed by a period of consolidation. The 7-period moving average is around 273.04, while the 25-period moving average is around 266.50. Trading volume increased significantly during the major price movement and then gradually decreased. Overall, the chart shows strong recent momentum but also high volatility.”#TrendingTopic #UNI📈
75
ログインして、さらにコンテンツを読む
厳選トピックで世界の暗号資産トレーダーの仲間入り
⚡️ 暗号資産に関する最新かつ有益な情報が見つかります。
💬 世界最大の暗号資産取引所から信頼されています。
👍 認証を受けたクリエイターから、有益なインサイトを得られます。
メール / 電話番号
トレンドトピック
UKFCAWinsCourtOrderToRecover851400Pounds
閲覧回数 23,756
689人が討論中
🚨 暗号資産の規制が新たな段階に突入:彼らはルールを書くだけじゃない――お金を取り戻している。
英国のFCA(金融行為監督機構)は、裁判所の裏付けを得た別の資産回収を確保し、不正な金融および暗号資産関連活動に対する、より広範な取締りの強化を裏付けています。
そして同時に起きていることを見ると:
🇬🇧 FCA → 執行+資産回収
🇺🇸 SEC → 機能的な暗号資産に対するより明確なルール
🇺🇸 FRB → GENIUS法の下での正式なステーブルコイン監督
この組み合わせが重要です。
規制当局はもはや、「暗号資産を金融システムの中に入れてよいのか」を議論している段階ではありません。
彼らはますます、誰がアクセスできるのか、どんなルールに従うのか、そしてそのルールが破られたときに何が起きるのかを決めています。
次の暗号資産サイクルは、「規制 vs イノベーション」ではないかもしれません。
それは、基準を満たせる人たちの“規制された暗号資産” vs、基準を満たせないすべての人――かもしれません。 👀
$COIN $CRCL $BTC
#ukfcawinscourtordertorecover851400pounds #ChainlinkLaunchesCCIP2WithEnterpriseVerification #GoldFallsTo$4144 #QNTFallsOver40%FromMorningHigh #USDTAdds845900HoldersInPast7Days
KimHotbae
·いいね:3件
·閲覧回数 4.2k
ChainlinkLaunchesCCIP2WithEnterpriseVerification
閲覧回数 38,102
882人が討論中
GoldFallsTo$4144
閲覧回数 13,486
148人が討論中