

theBTCGirl
933 投稿

theBTCGirl
報告
ユーザーをブロック
I am BTC Girl
2 フォロー
564 フォロワー
1.4K+ いいね
投稿
すべて
引用
動画
·
--
弱気相場
翻訳参照
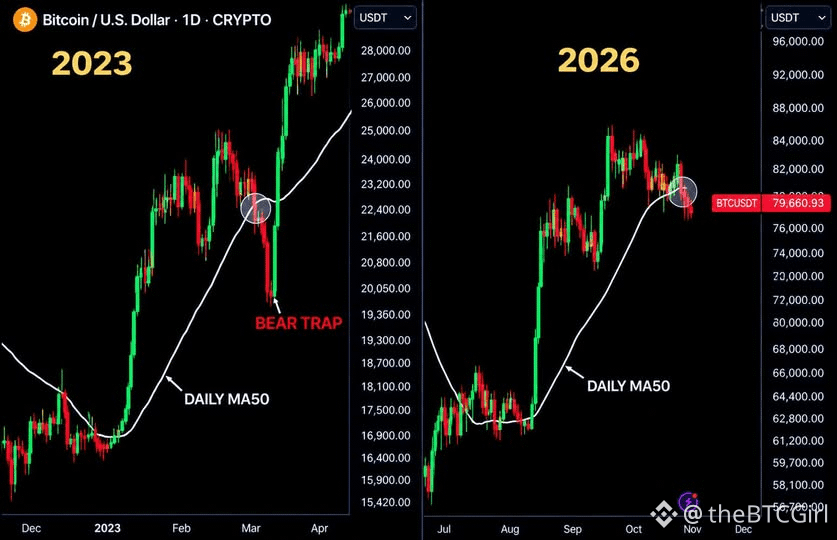
BITCOIN: IS HISTORY REPEATING ITSELF… OR ARE WE SEEING WHAT WE WANT TO SEE 72k ?
Look at the comparison between 2023 and 2026.
In the 2023 chart, Bitcoin moved around its 50-day moving average before a sharp recovery from the area marked as a potential bear trap.
Now, the 2026 chart shows price pulling back toward the daily MA50 after a strong rally.
The resemblance is interesting.
But a similar chart pattern doesn’t guarantee a similar outcome.
Here’s where the debate begins:
THE BULLISH VIEW: If the MA50 holds and buyers regain control, the current pullback could become another turning point.
THE BEARISH VIEW: If Bitcoin loses the MA50 and fails to reclaim it, the 2023 comparison could break down completely.
THE SKEPTICAL VIEW: Two similar-looking charts are not enough. Market structure, liquidity, and broader conditions matter.
So, what are we looking at here?
A) A potential repeat of the 2023 setup
B) A temporary bounce before further downside
C) A visual similarity that still needs confirmation
Don’t just choose A, B, or C.
What specific signal on this chart would prove your view right — or prove you wrong?
Let’s see the strongest arguments from both sides.
83
·
--
弱気相場
101
·
--
弱気相場
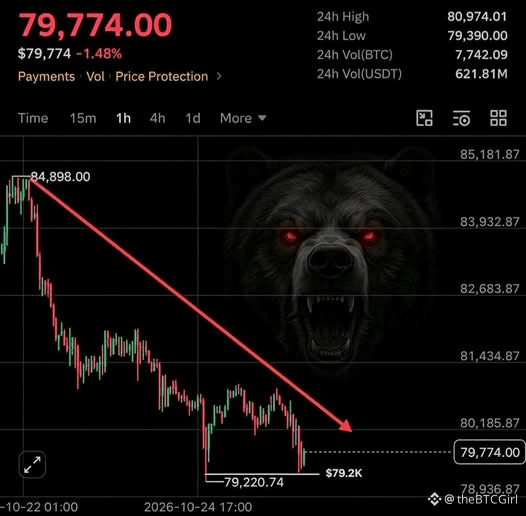
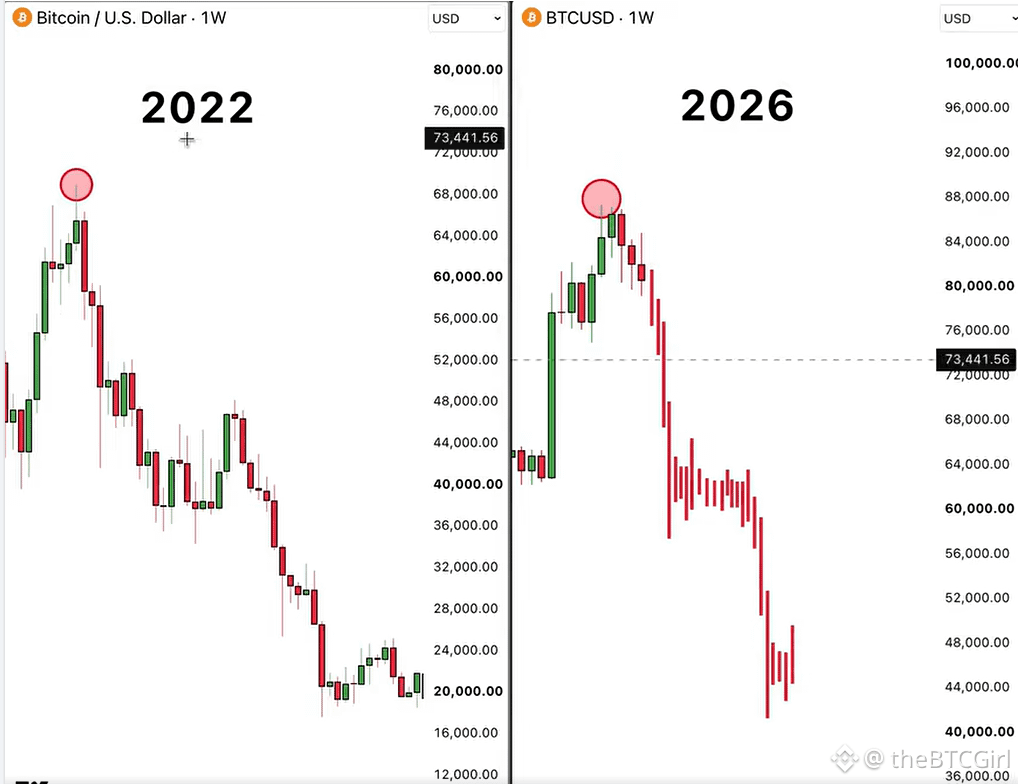
短期的にはビットコインが大きく下落すると予想しています。$BTC
これは6万5,000ドル前後になるでしょう。
そこで急なローソク足とともに下落すると予想しています。注意してください! #cryptocurrency #ethereum
短期的にはビットコインが大きく下落すると予想しています。$BTC
これは6万5,000ドル前後になるでしょう。
そこで急なローソク足とともに下落すると予想しています。注意してください! #cryptocurrency #ethereum
これは6万5,000ドル前後になるでしょう。
そこで急なローソク足とともに下落すると予想しています。注意してください! #cryptocurrency #ethereum
2
1.4k
·
--
弱気相場
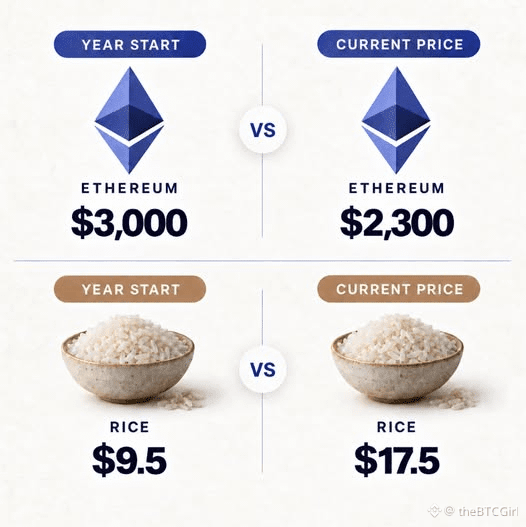
$ETH は米に負けている。教訓:暗号資産は投資ではなく、空売りの対象であり、利益を得る手段だ。
$ETH は米に負けている。教訓:暗号資産は投資ではなく、空売りの対象であり、利益を得る手段だ。
2
506
·
--
弱気相場
144
·
--
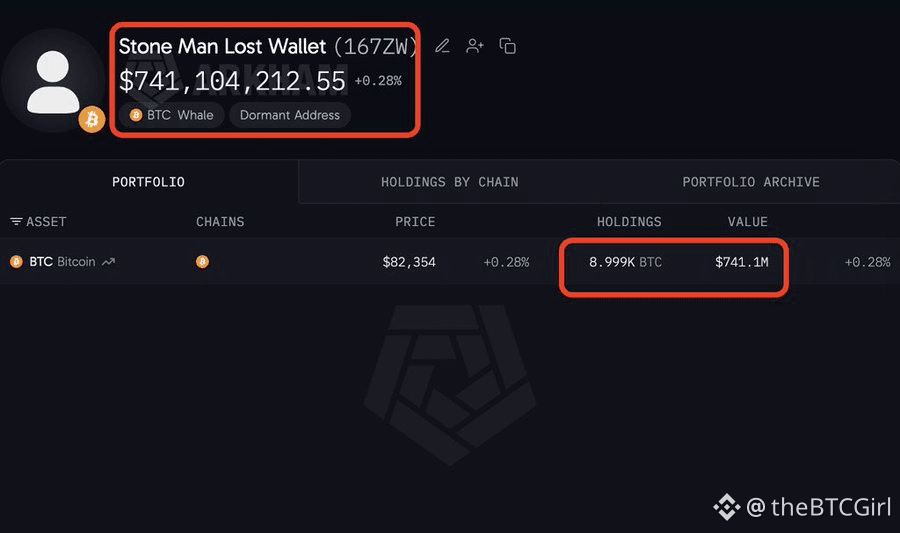
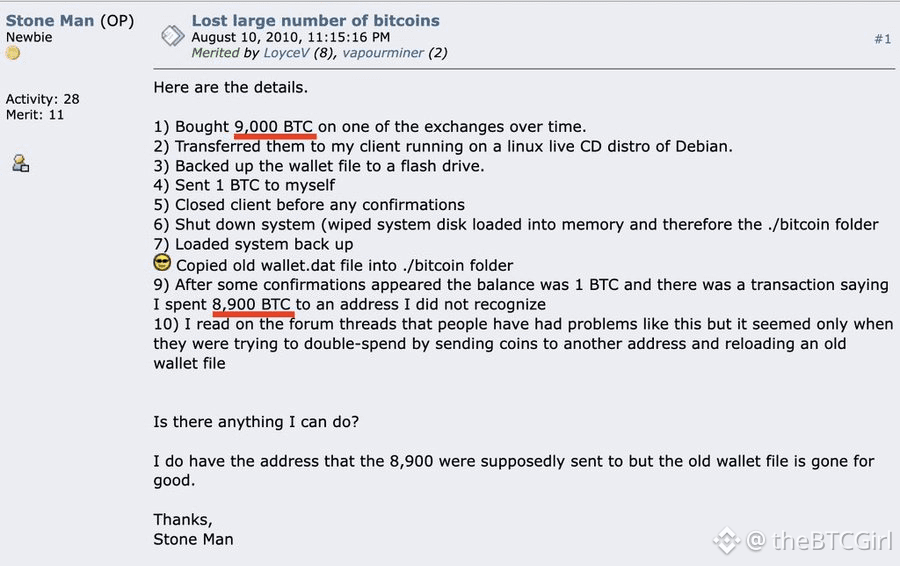
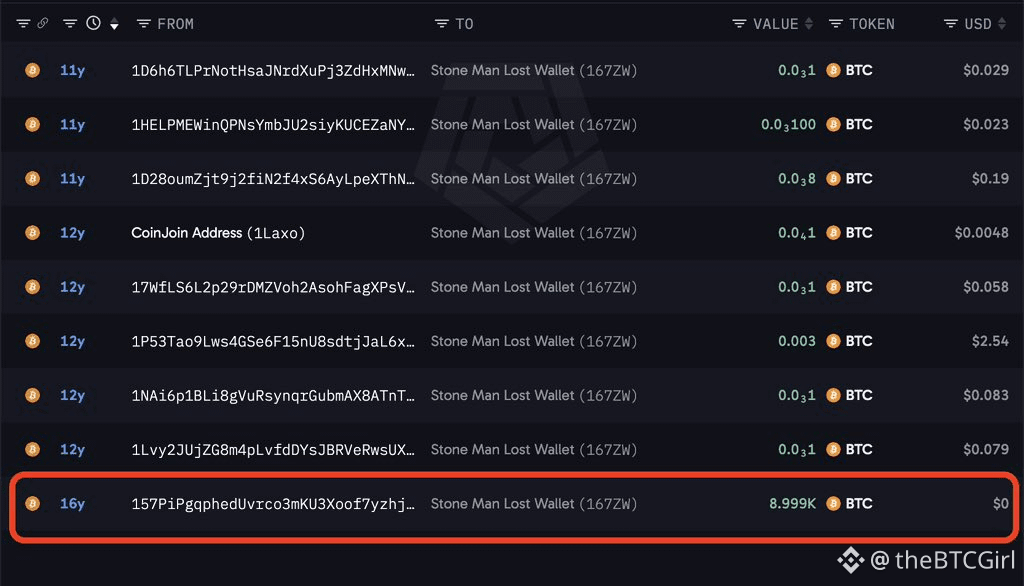
ついてない日だと思ったら、この人のことを思い出してください。
2010年、彼は自分宛てに1ビットコインを送った際、誤って別の8,999 BTCへのアクセス手段を失ってしまいました。
その8,999ビットコインは今や7億4,100万ドル相当です。
コインは今もアドレスに残っていて、誰でも見ることができますが、どうやら彼はアクセスできないようです。
こんなふうに7億4,100万ドルを失って、立ち直れますか?
ついてない日だと思ったら、この人のことを思い出してください。
2010年、彼は自分宛てに1ビットコインを送った際、誤って別の8,999 BTCへのアクセス手段を失ってしまいました。
その8,999ビットコインは今や7億4,100万ドル相当です。
コインは今もアドレスに残っていて、誰でも見ることができますが、どうやら彼はアクセスできないようです。
こんなふうに7億4,100万ドルを失って、立ち直れますか?
2010年、彼は自分宛てに1ビットコインを送った際、誤って別の8,999 BTCへのアクセス手段を失ってしまいました。
その8,999ビットコインは今や7億4,100万ドル相当です。
コインは今もアドレスに残っていて、誰でも見ることができますが、どうやら彼はアクセスできないようです。
こんなふうに7億4,100万ドルを失って、立ち直れますか?
2
3.1k
·
--
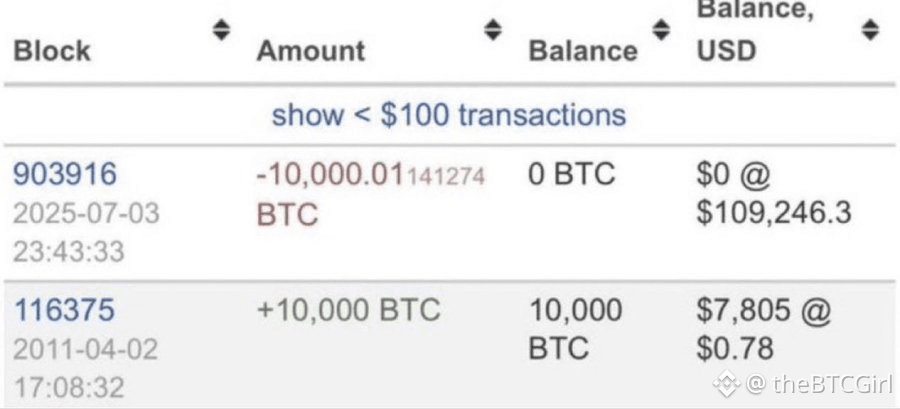
史上最高の取引?
$BTC を1万株、1株0.78ドルで購入
昨年、すべて売却して10億ドルの利益を得た
史上最高の取引?
$BTC を1万株、1株0.78ドルで購入
昨年、すべて売却して10億ドルの利益を得た
$BTC を1万株、1株0.78ドルで購入
昨年、すべて売却して10億ドルの利益を得た
1
45
·
--
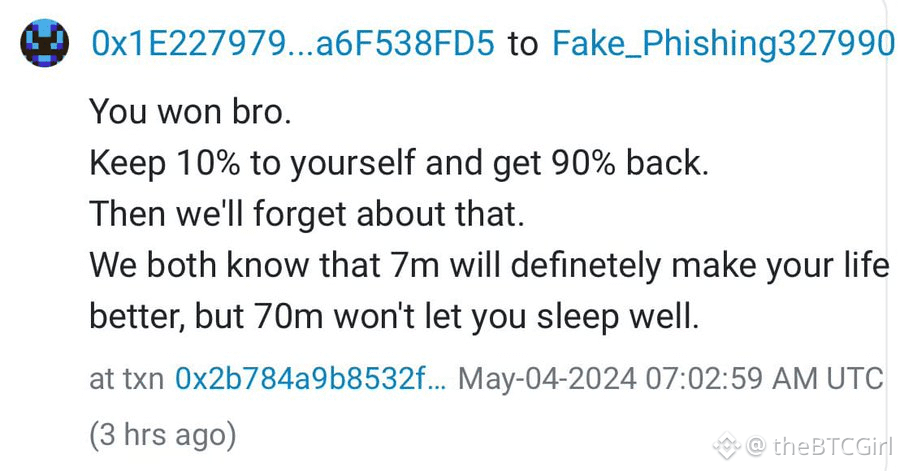
この人は、ビットコインで7,300万ドルを間違った相手に送ってしまった。
その後、ブロックチェーン上で相手にメッセージを送り、10%(730万ドル)は受け取って、残りの6,600万ドルを返してほしいと頼んだ。
あなたなら返す?
この人は、ビットコインで7,300万ドルを間違った相手に送ってしまった。
その後、ブロックチェーン上で相手にメッセージを送り、10%(730万ドル)は受け取って、残りの6,600万ドルを返してほしいと頼んだ。
あなたなら返す?
その後、ブロックチェーン上で相手にメッセージを送り、10%(730万ドル)は受け取って、残りの6,600万ドルを返してほしいと頼んだ。
あなたなら返す?
100
12
157
157.9k
·
--
弱気相場
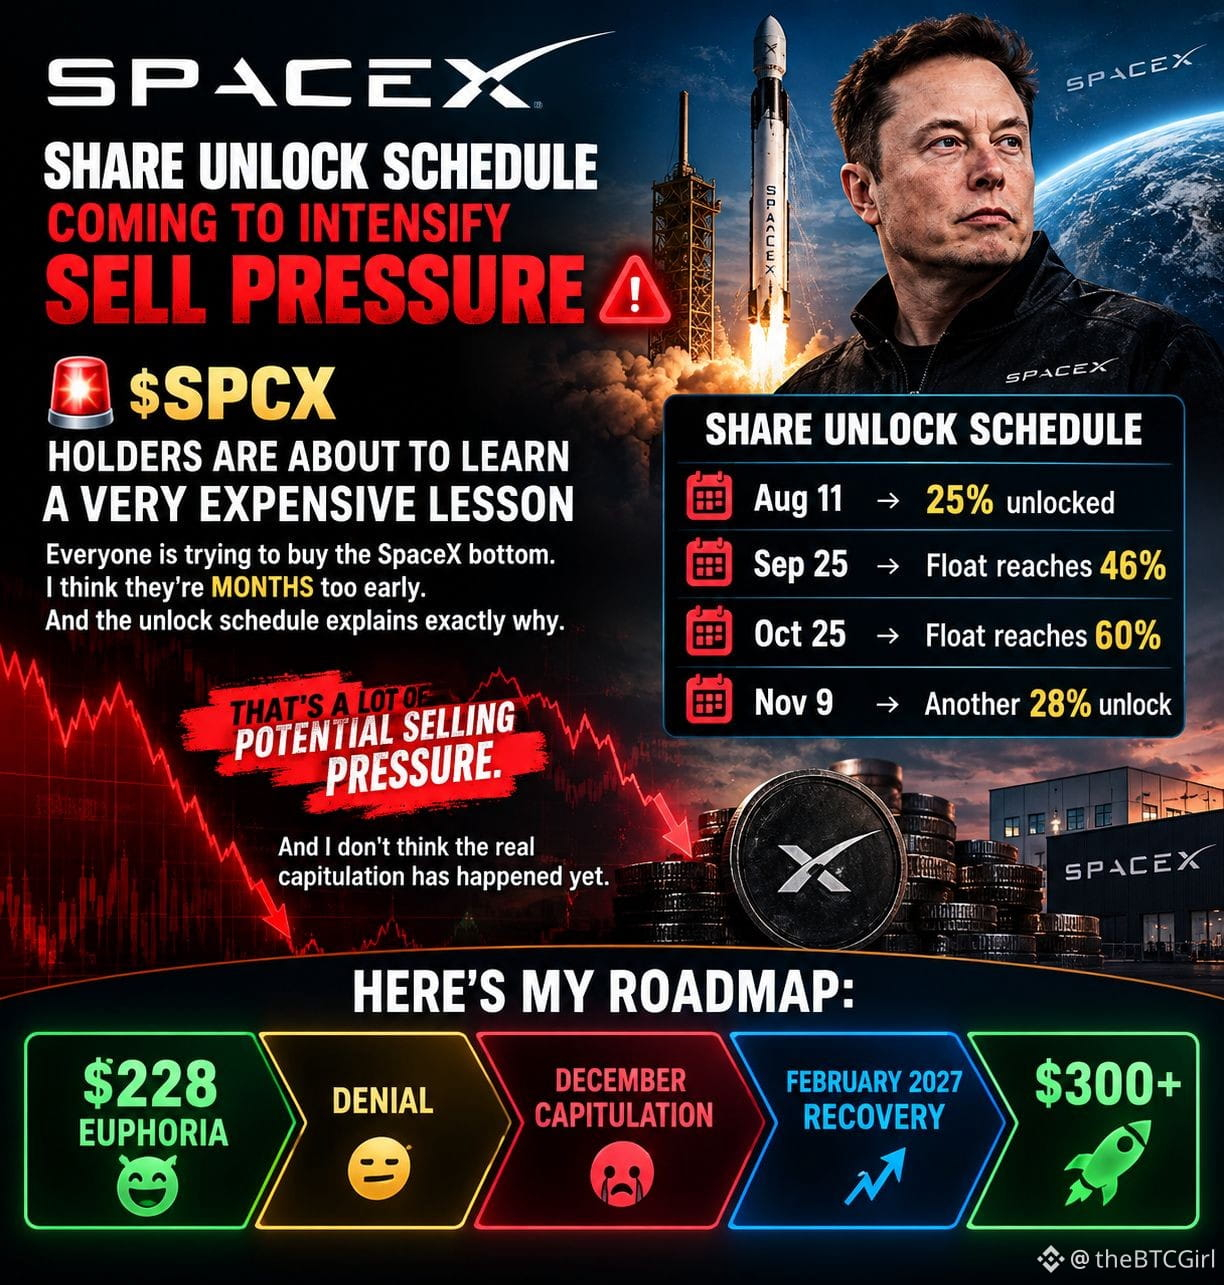
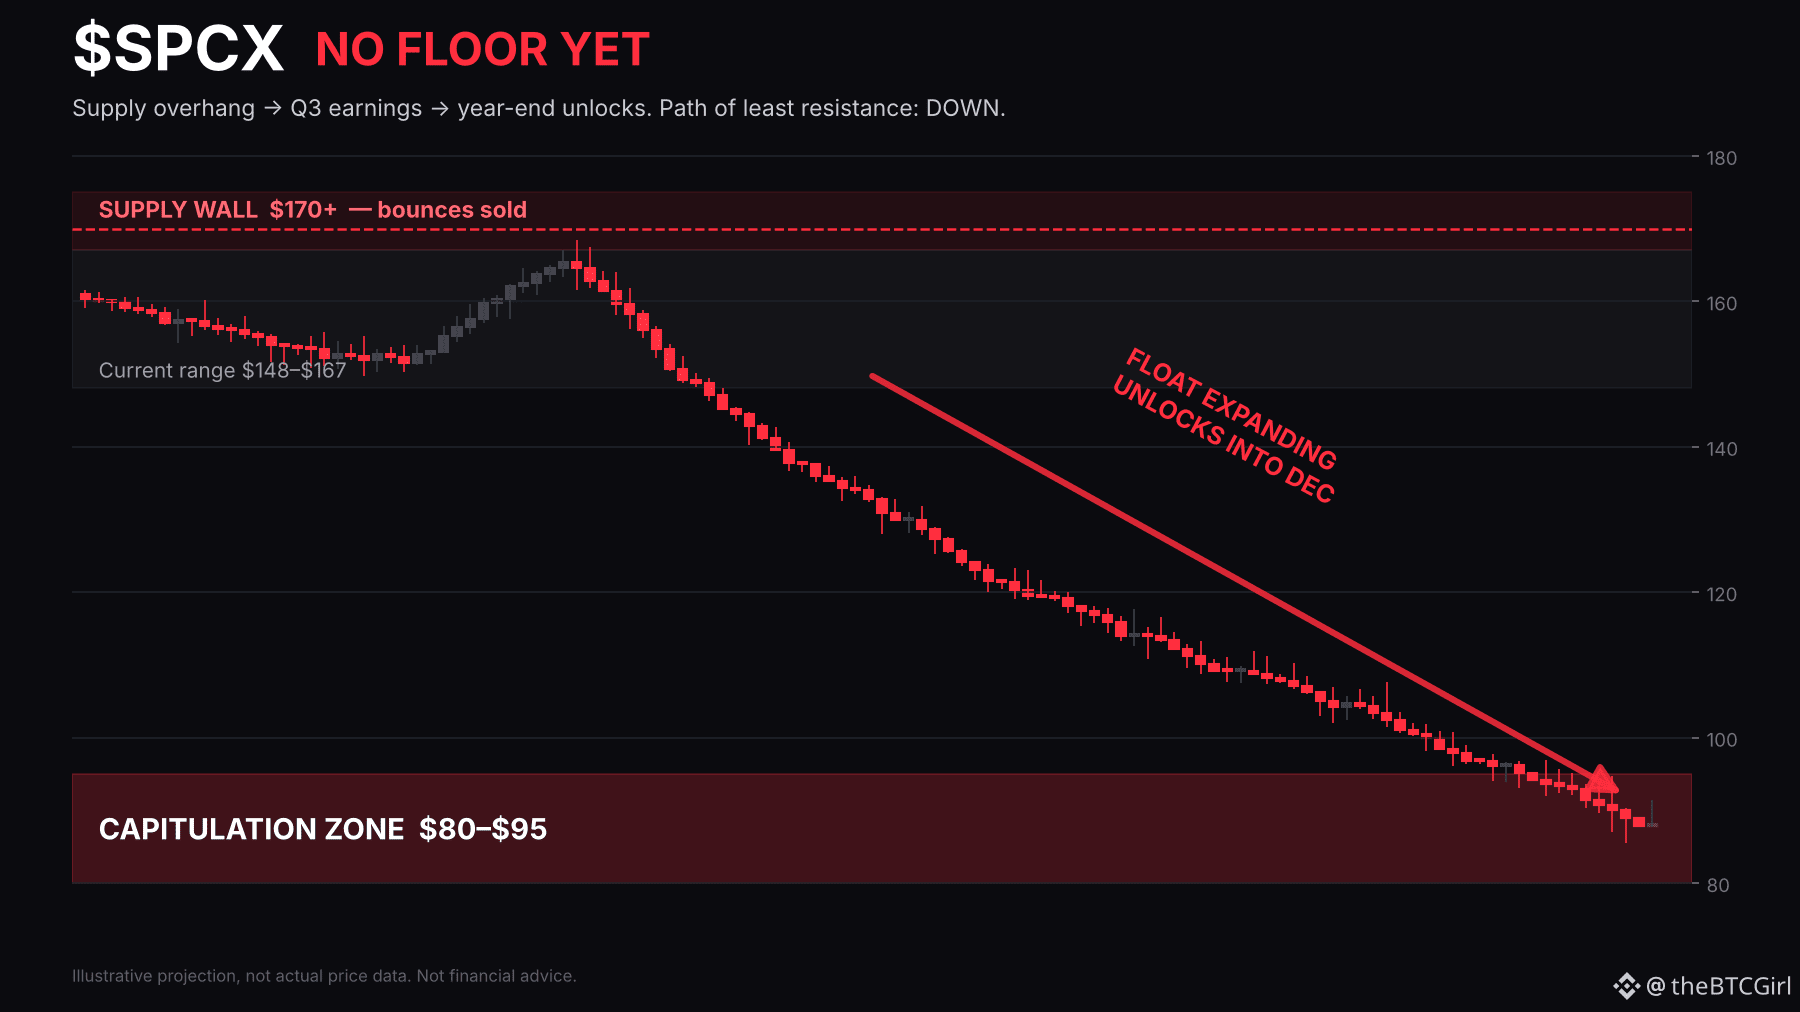
$SPCXB 保有者は、これから非常に高くつく教訓を学ぶことになる🚨📉
誰もが$SPCXの底値を当てようとしている。
でも、まだ数カ月早いと思う。その理由はロックアップ解除スケジュールを見れば分かる。
🔓 ロックアップ解除カレンダー:
8月11日 → ロックされた株式の25%が売却可能に
9月25日 → 浮動株比率が46%に
10月25日 → 浮動株比率が60%に(あと9日)
11月9日 → さらに28%が解除
この日程のどの日にも、巨額の含み益を抱えたインサイダーや初期支援者から、新たな供給が市場に加わる。彼らの多くは何年も売るのを待ってきた。あなたの買値など気にも留めないだろう。
浮動株は、需要が吸収できるペースを上回って増えている。ロックアップ解除のたびに売り手が板に補充されるため、反発するたびに新たな売りの壁にぶつかる。
多くの人が見落としているのは、本当の投げ売りはまだ起きていないということだ。これまで見られたのは否認にすぎない。押し目買い勢は最悪期は過ぎたと信じて次々に買い向かうが、実際はそうではない。最も大規模なロックアップ解除はまだこれからだ。
🗺️ 私のロードマップ:
$228 強欲 → 否認(現在地)→ 12月に投げ売り → 2027年2月に回復 → $300+
そう、長期的には強気だ。だからこそ、まだ買っていない。最高のエントリータイミングは、最後の強制的な売り手がいなくなった後であって、その前ではない。
ロックアップ解除スケジュールには逆らわないこと。供給が一巡するのを待とう。焦らずに。
ロックアップ解除日の注文フローや投げ売りアラートを受け取るには、フォローして🔔をオンに。
投資助言ではありません。ご自身で調査してください。
91
·
--
弱気相場
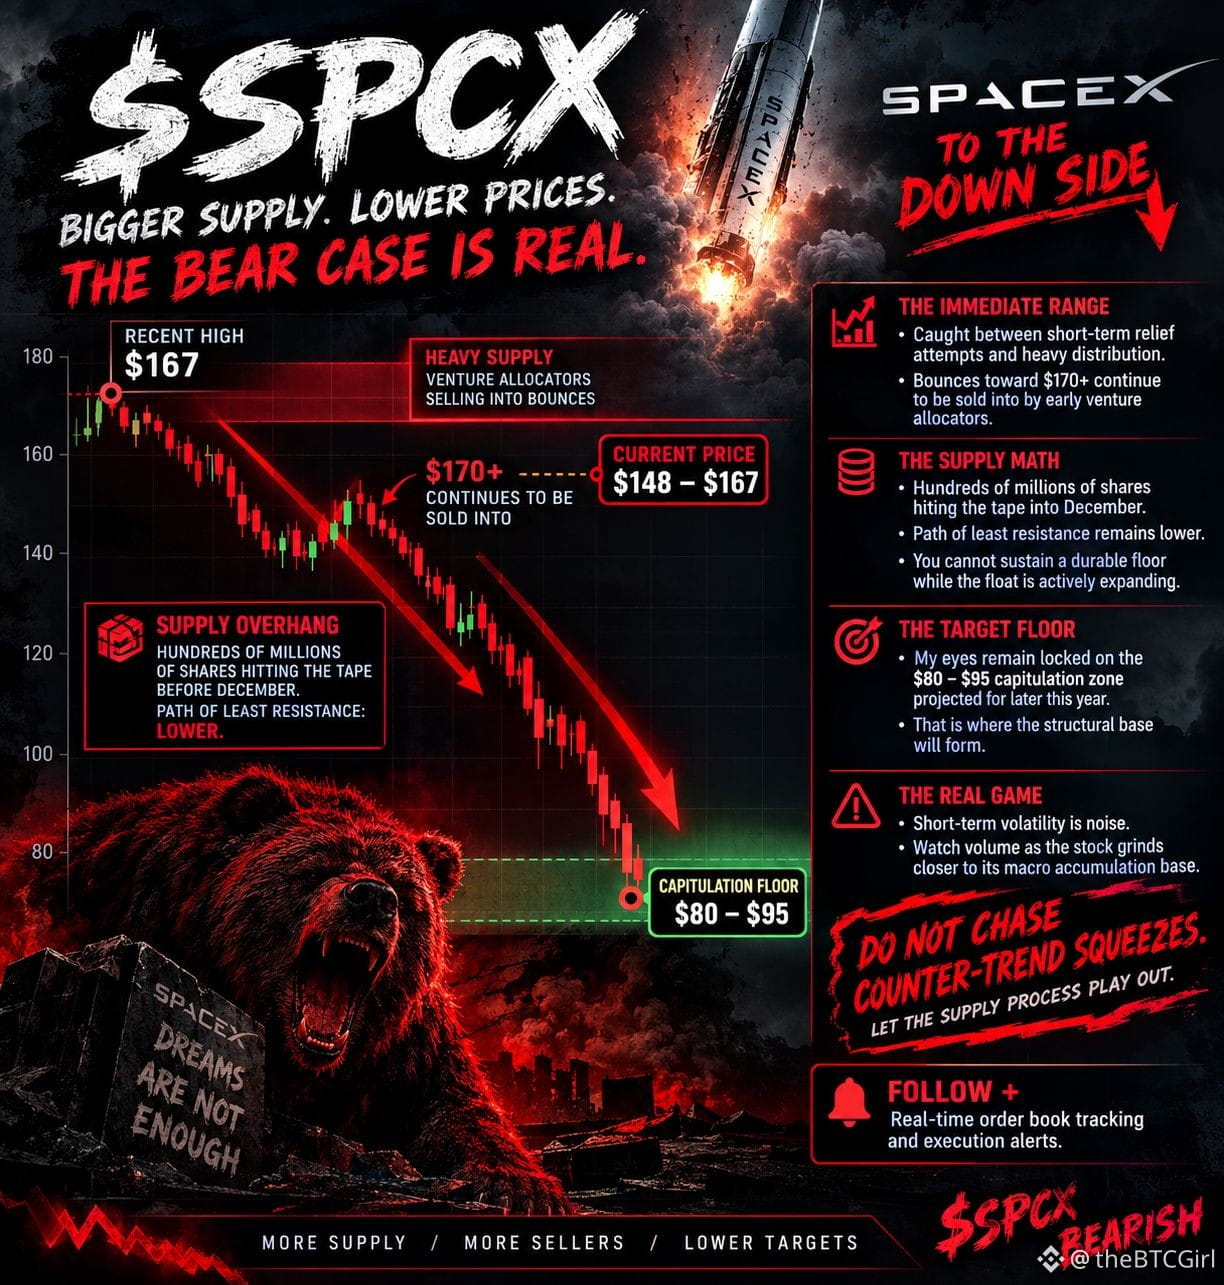
$SPCXB 今日:反発は売り抜けのための流動性です。80ドルが近づいています。📉🚨
$SPCX は148~167ドルのレンジから抜け出せずにいます。反発のたびに売りが出ています。市場は依然として、Q3決算や年末のロックアップ解除に向けて迫る大量の供給を織り込んでいません。
現状を整理すると、こうです。
反発はすべて売りのサインです。170ドルに向けた上昇は回復ではありません。初期のベンチャー投資家が、それを利用して持ち株を売り抜けています。買い集められているのではなく、強気相場で売りが出ています。
供給の計算が合いません。12月までに数億株がロックアップ解除されます。流通株式数が増え続けるなかで、底値を築くことはできません。買い手が吸収しているのは株式であって、底値を形成しているわけではありません。
まだ底値はありません。今年後半に訪れる80~95ドルの投げ売りゾーンを注視しています。現在の水準から約45%下であり、そこで初めて真の価格発見が始まります。
Q3決算で希薄化が解消されるわけではありません。強気派の多くは、いまだに単なる押し目だと見ています。ロックアップ解除で株式が市場に出回れば、その見方は厳しく試されるでしょう。
落ちてくるナイフをつかまないでください。踏み上げ相場に飛び乗らないでください。供給が一巡するのを待ちましょう。
リアルタイムの板情報トラッキングと約定アラートを受け取るには、フォロー+🔔。
投資助言ではありません。ご自身で調査してください。
97
·
--
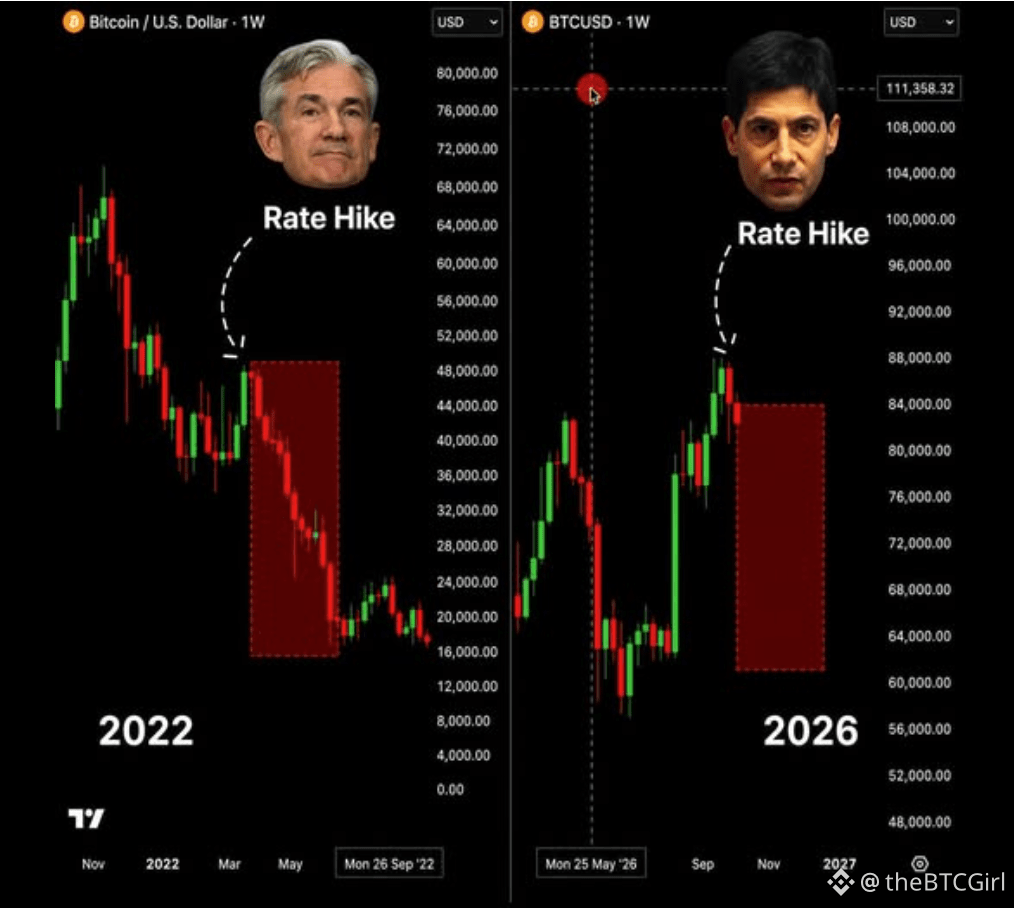
$SPCXB さらに50%下落する可能性も。まだ買わない。
誰もが、SpaceXが170ドルを上回るのを待っている。
私は80ドルを待っている。
そして、これから数か月のうちに、何千人もの投資家がこの取引で不利な側に取り残される可能性があると思う。
私の予想する展開はこちら:
167ドル → 140ドル → 115ドル → 95ドル → 80ドル
最大のリスクは、SpaceXへの期待が薄れていることではない。
今後予定されている株式のロックアップ解除による、売り圧力の可能性だ。
市場に供給が増えれば、反発するたびに、初期から保有している人たちが売り抜ける機会になりかねない。
140ドルでは、「通常の調整」と言われるだろう。
115ドルでは、積極的に買い始める人が出てくる。
100ドルを下回れば、恐怖が広がると予想している。
そして80〜95ドルあたりでは?
大きな買いのチャンスにつながるような、投げ売りが起きるかどうかを注視する。
ただし、誤解しないでほしい。
私は長期的にSpaceXに逆張りしているわけではない。
次の大きな上昇相場は、早く買いすぎた人たちが市場から振り落とされた後に始まる可能性があると考えている。
私の計画はシンプルだ。
売り圧力が落ち着くのを待つ。
パニックを待つ。
出来高で確認する。
それからエントリーを探す。
170ドルで過熱した相場を追いかけるつもりはない。
誰ももう$SPCXに手を出したがらなくなったときに訪れるかもしれないチャンスに備えている。
このチャートを保存して、12月にまた見に来てほしい。
フォローして、通知をオンに。

94
·
--
弱気相場
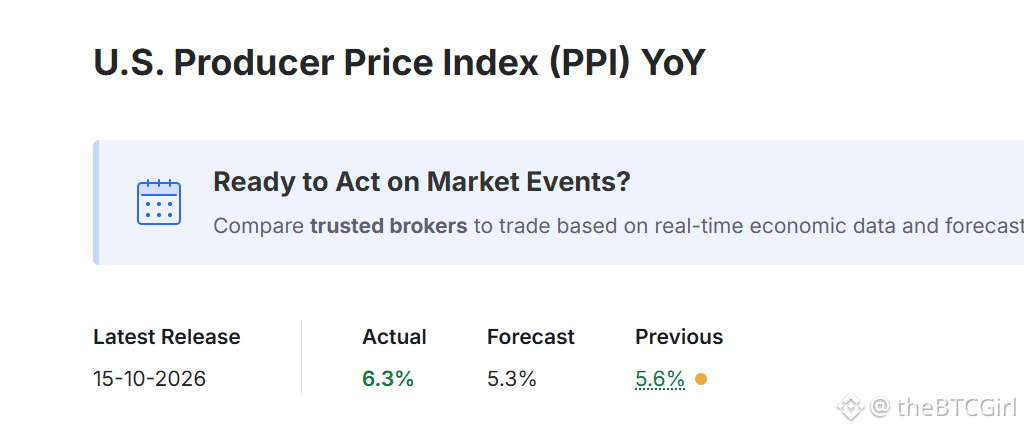
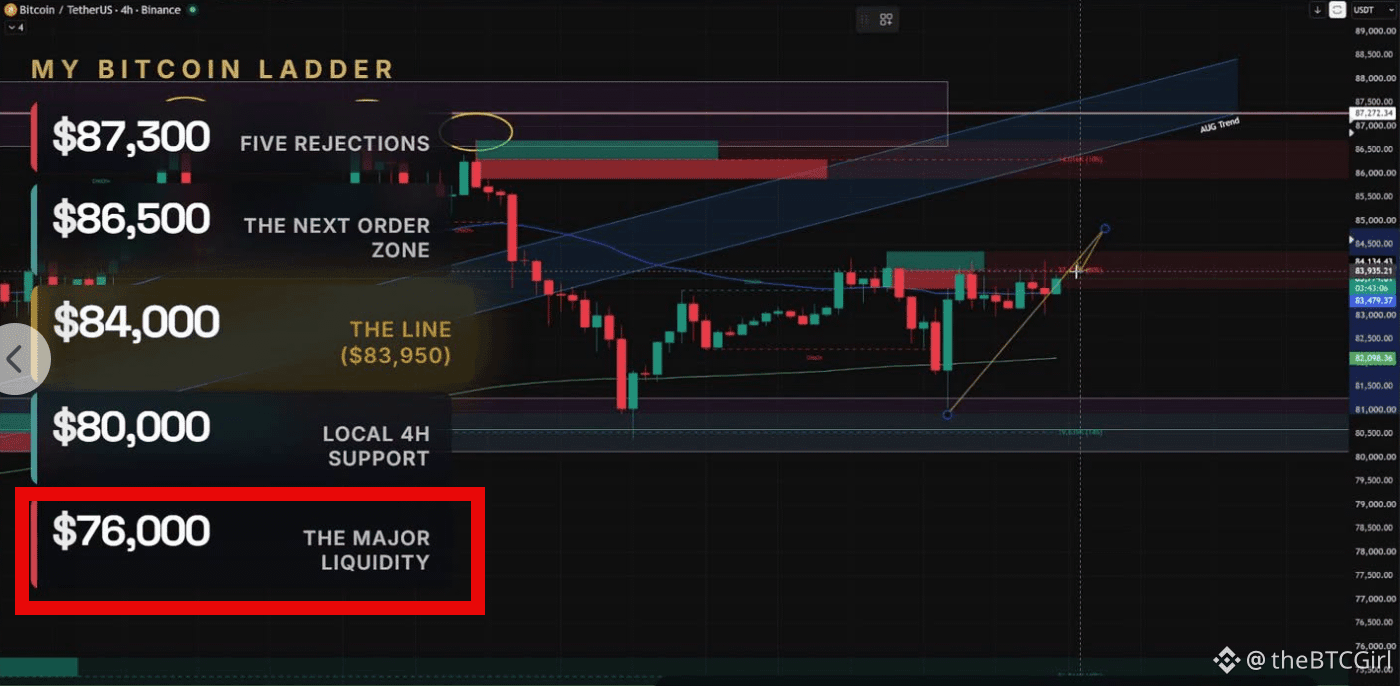
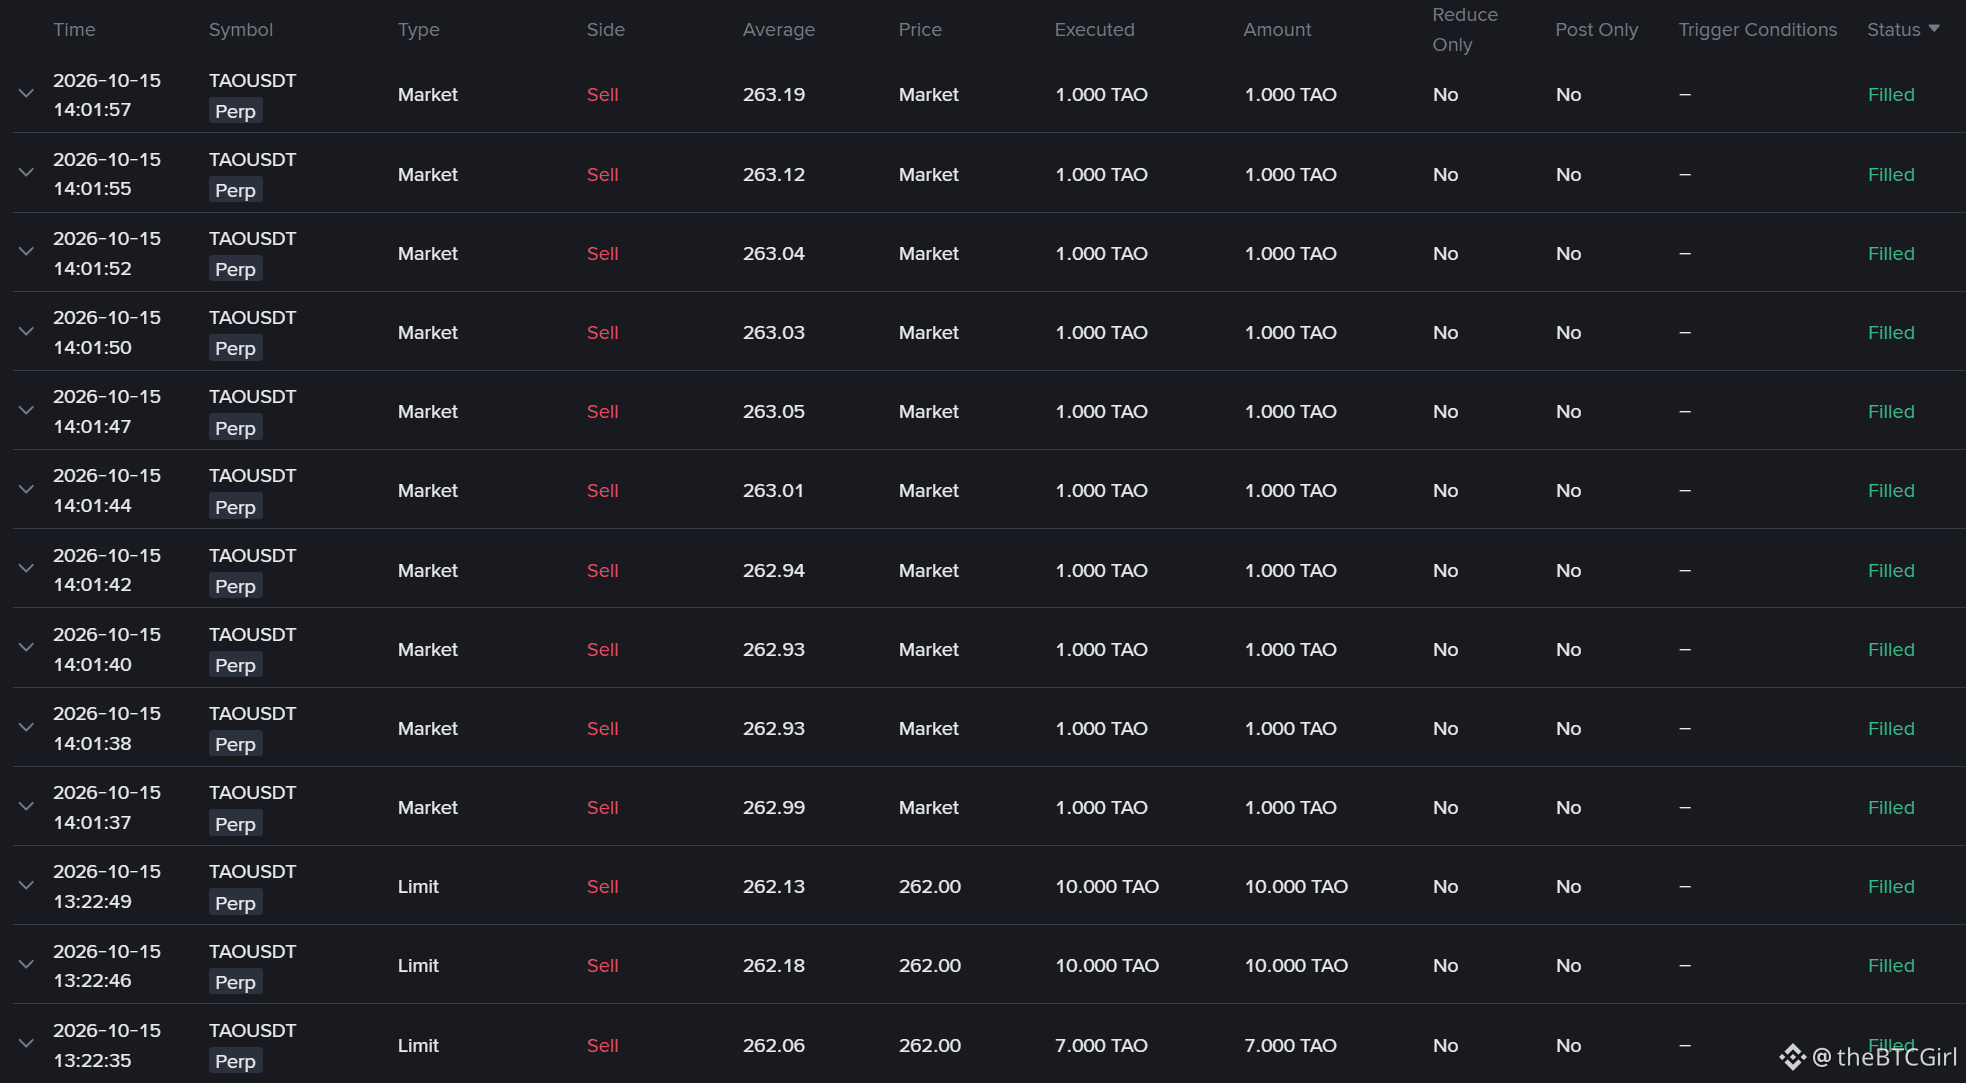
今すぐショート $BTC $BNB もっと
PPIは予想を大幅に上回る熱さ、暴落が近づいている。BTCを78kで今、手早く100倍ショートした。
今すぐショート $BTC $BNB もっと
PPIは予想を大幅に上回る熱さ、暴落が近づいている。BTCを78kで今、手早く100倍ショートした。
PPIは予想を大幅に上回る熱さ、暴落が近づいている。BTCを78kで今、手早く100倍ショートした。
62
·
--
弱気相場
速報:ブラックロックなどのETFが、2億6,140万ドル相当のビットコインと1億2,950万ドル相当のイーサリアムを売却しました。
ショート $BNB 彼らは私たちの知らない何かを知っている。
速報:ブラックロックなどのETFが、2億6,140万ドル相当のビットコインと1億2,950万ドル相当のイーサリアムを売却しました。
ショート $BNB 彼らは私たちの知らない何かを知っている。
ショート $BNB 彼らは私たちの知らない何かを知っている。
63
ログインして、さらにコンテンツを読む
厳選トピックで世界の暗号資産トレーダーの仲間入り
⚡️ 暗号資産に関する最新かつ有益な情報が見つかります。
💬 世界最大の暗号資産取引所から信頼されています。
👍 認証を受けたクリエイターから、有益なインサイトを得られます。
メール / 電話番号