

Pejmanzwin
259 投稿

Pejmanzwin
Pejman_Zwin 8y crypto trader 50K TradingView followers 1000 BTC analyses high win rate ProTrader365 lead Follow for Bitcoin insights 🚀
2 フォロー
737 フォロワー
507 いいね
投稿
すべて
引用
Pejmanzwin
·
--
弱気相場USDCHF、主要PRZを拒否——0.8256は次の目標か?
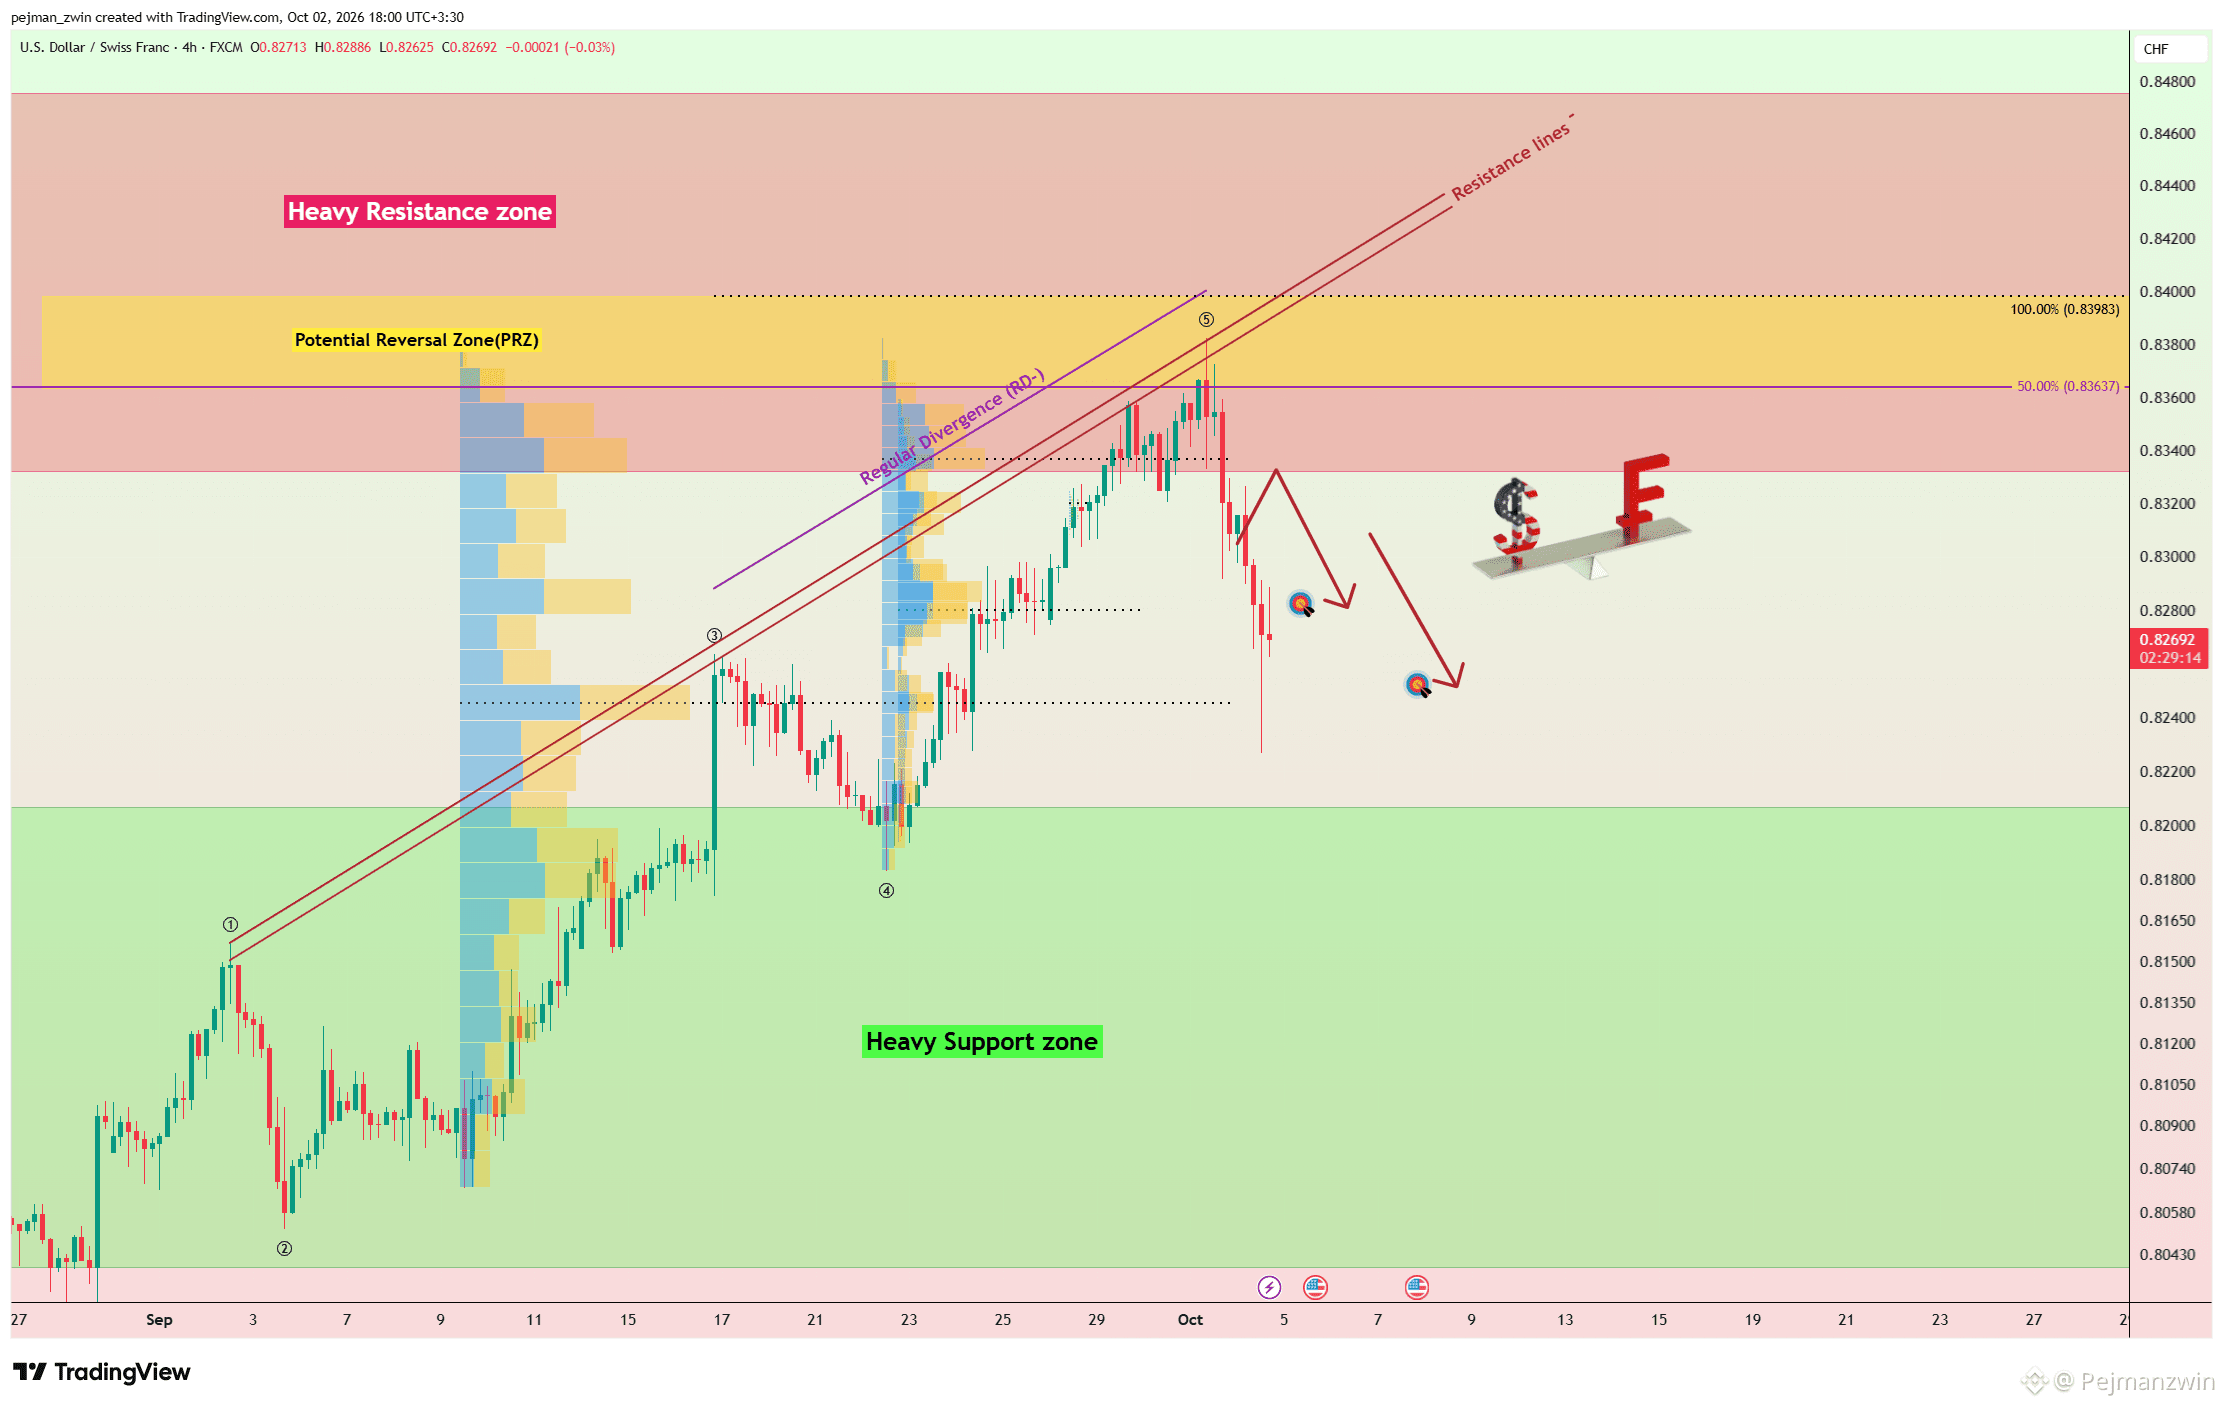
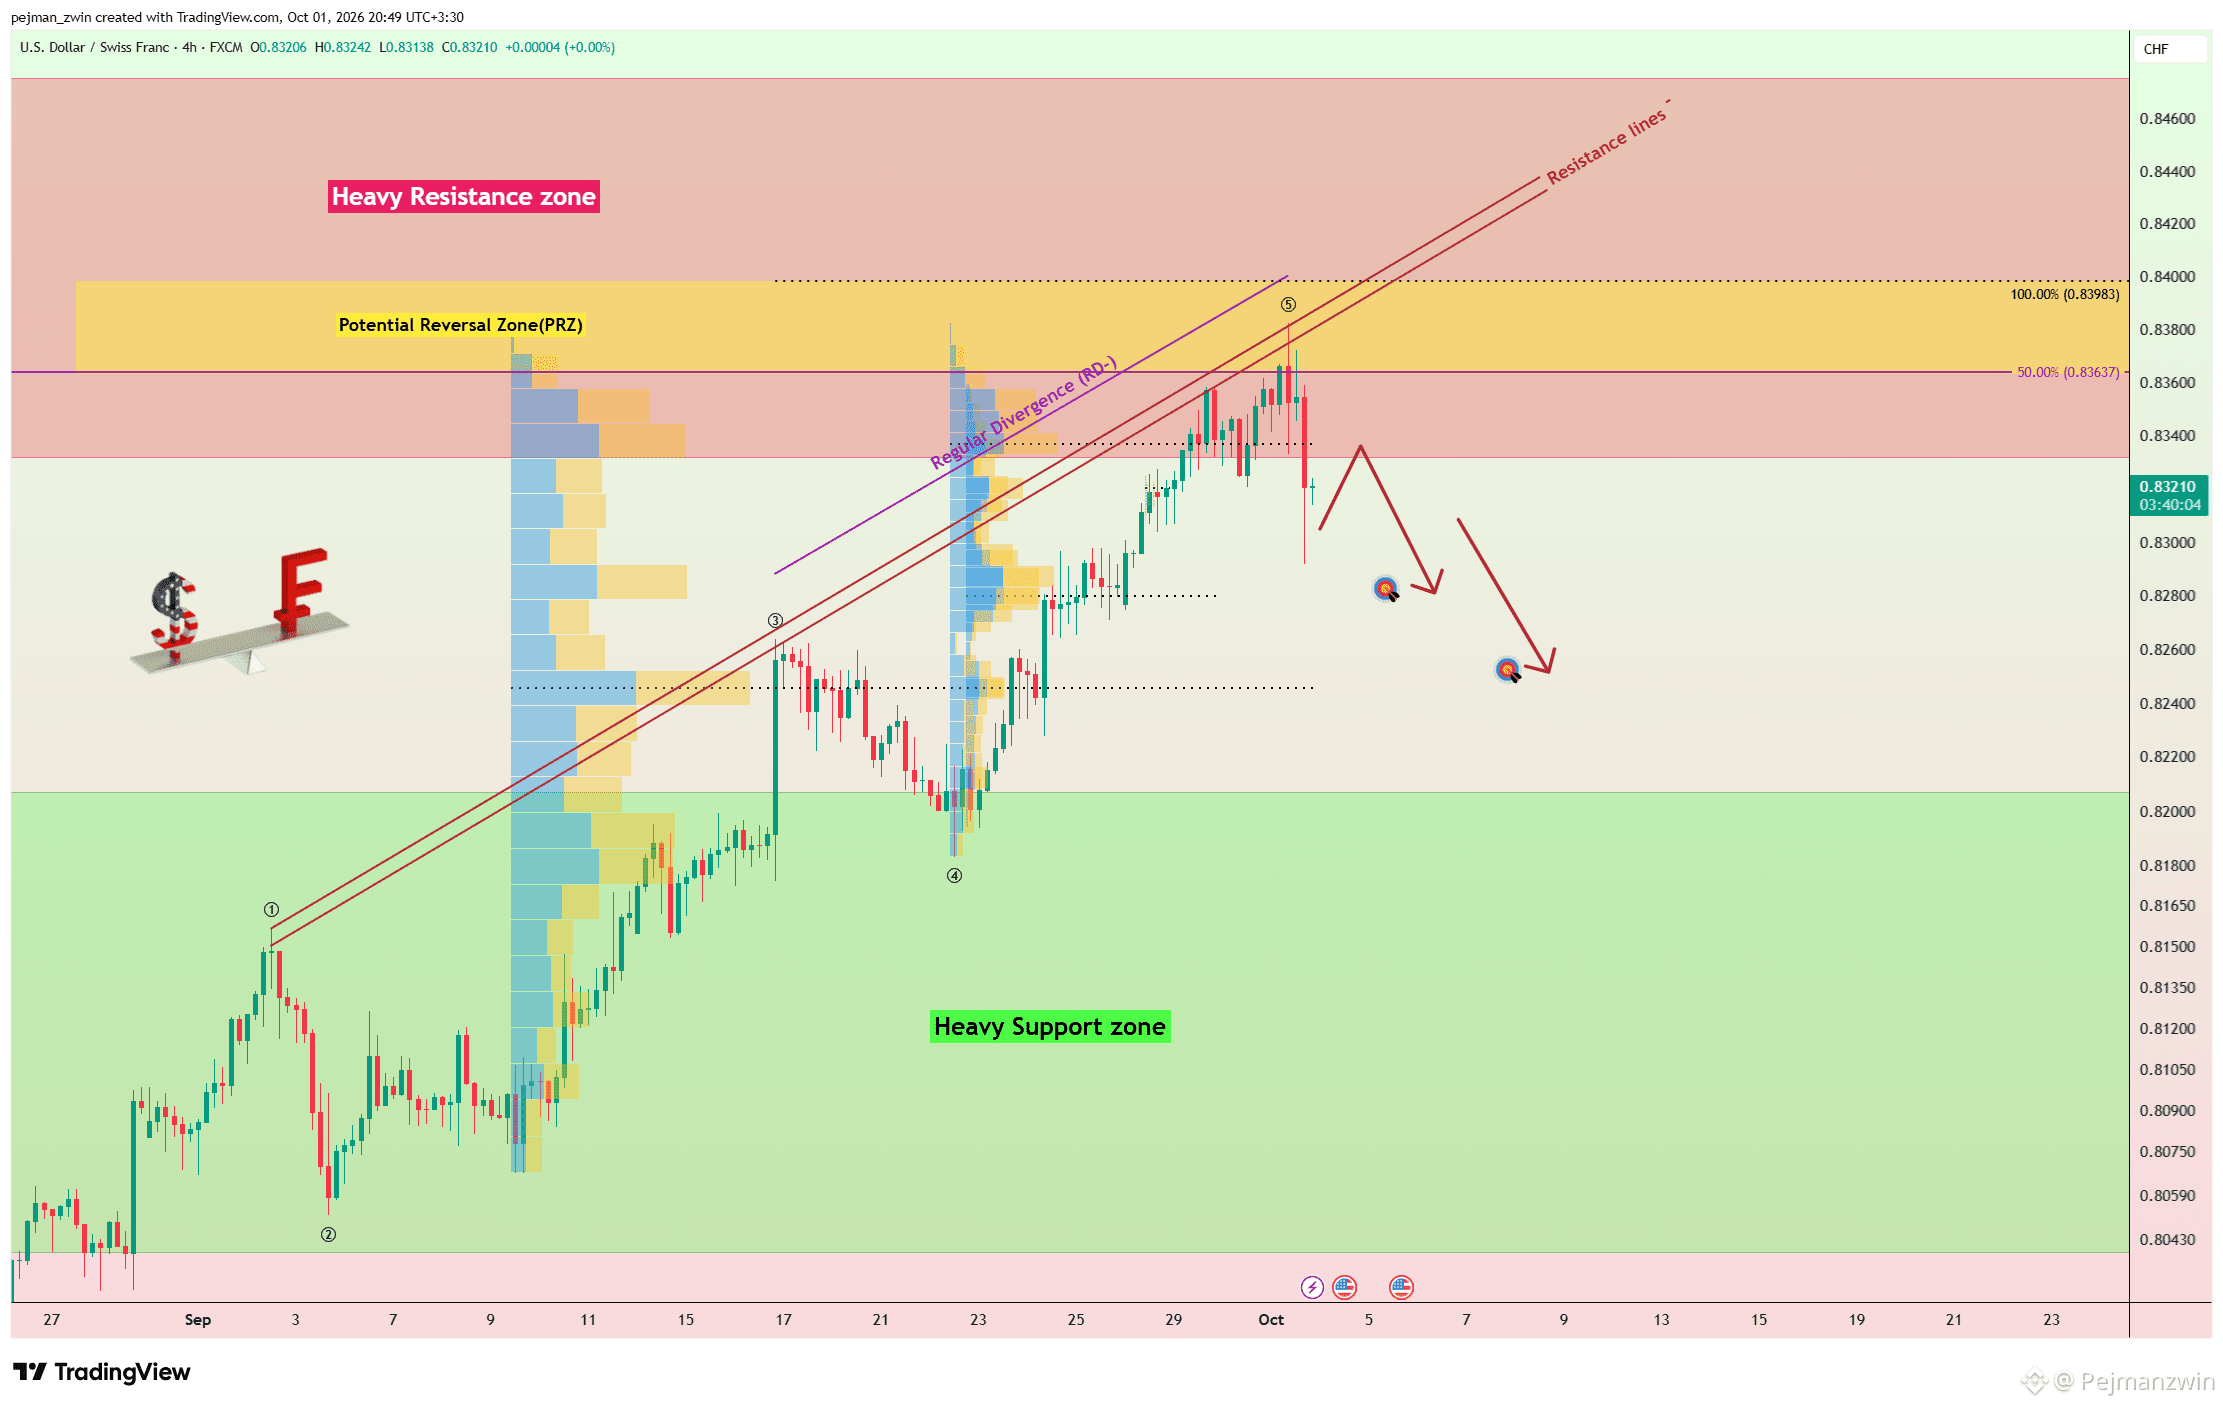
USDCHFは0.8332〜0.8476のヘビー・レジスタンス・ゾーンに入った後に下落を開始し、レジスタンス・ラインおよび0.836〜0.840の主要ポテンシャル・リバーサル・ゾーン(PRZ)に反応しました。
現在は重要な0.838 CHF水準を下回って推移しており、短期的な弱気圧力が維持されています。
エリオット波の観点では、USDCHFは主要5波(Primary Wave 5)を完了したように見え、下方向への修正(コレクティブ)な動きが今後発達する可能性があります。
連続する2つのピーク間におけるネガティブ・レギュラー・ダイバージェンス(RD-)は、強気の勢いが弱まりつつあることを示すもう一つの警告です。
USDCHFは0.8285 CHF付近までさらに下落する可能性があると見ています。
弱気の勢いが強まれば、修正は0.8256 CHFまで拡大するかもしれません。
取引セットアップ
第1TP:0.8285 CHF
第2TP:0.8256 CHF
損切り(Stop Loss):0.8375 CHF
重要水準:0.8245 | 0.8280 | 0.838 CHF
USDCHFが重要なレジスタンス構造の下に留まる限り、弱気シナリオは有効のままです。
USDCHFはどの水準に先に到達するでしょうか?
🔴 0.8256 CHF
🟢 0.8375 CHF
#usdchf
USDCHFは0.8332〜0.8476のヘビー・レジスタンス・ゾーンに入った後に下落を開始し、レジスタンス・ラインおよび0.836〜0.840の主要ポテンシャル・リバーサル・ゾーン(PRZ)に反応しました。
現在は重要な0.838 CHF水準を下回って推移しており、短期的な弱気圧力が維持されています。
エリオット波の観点では、USDCHFは主要5波(Primary Wave 5)を完了したように見え、下方向への修正(コレクティブ)な動きが今後発達する可能性があります。
連続する2つのピーク間におけるネガティブ・レギュラー・ダイバージェンス(RD-)は、強気の勢いが弱まりつつあることを示すもう一つの警告です。
USDCHFは0.8285 CHF付近までさらに下落する可能性があると見ています。
弱気の勢いが強まれば、修正は0.8256 CHFまで拡大するかもしれません。
取引セットアップ
第1TP:0.8285 CHF
第2TP:0.8256 CHF
損切り(Stop Loss):0.8375 CHF
重要水準:0.8245 | 0.8280 | 0.838 CHF
USDCHFが重要なレジスタンス構造の下に留まる限り、弱気シナリオは有効のままです。
USDCHFはどの水準に先に到達するでしょうか?
🔴 0.8256 CHF
🟢 0.8375 CHF
#usdchf
Pejmanzwin
·
--
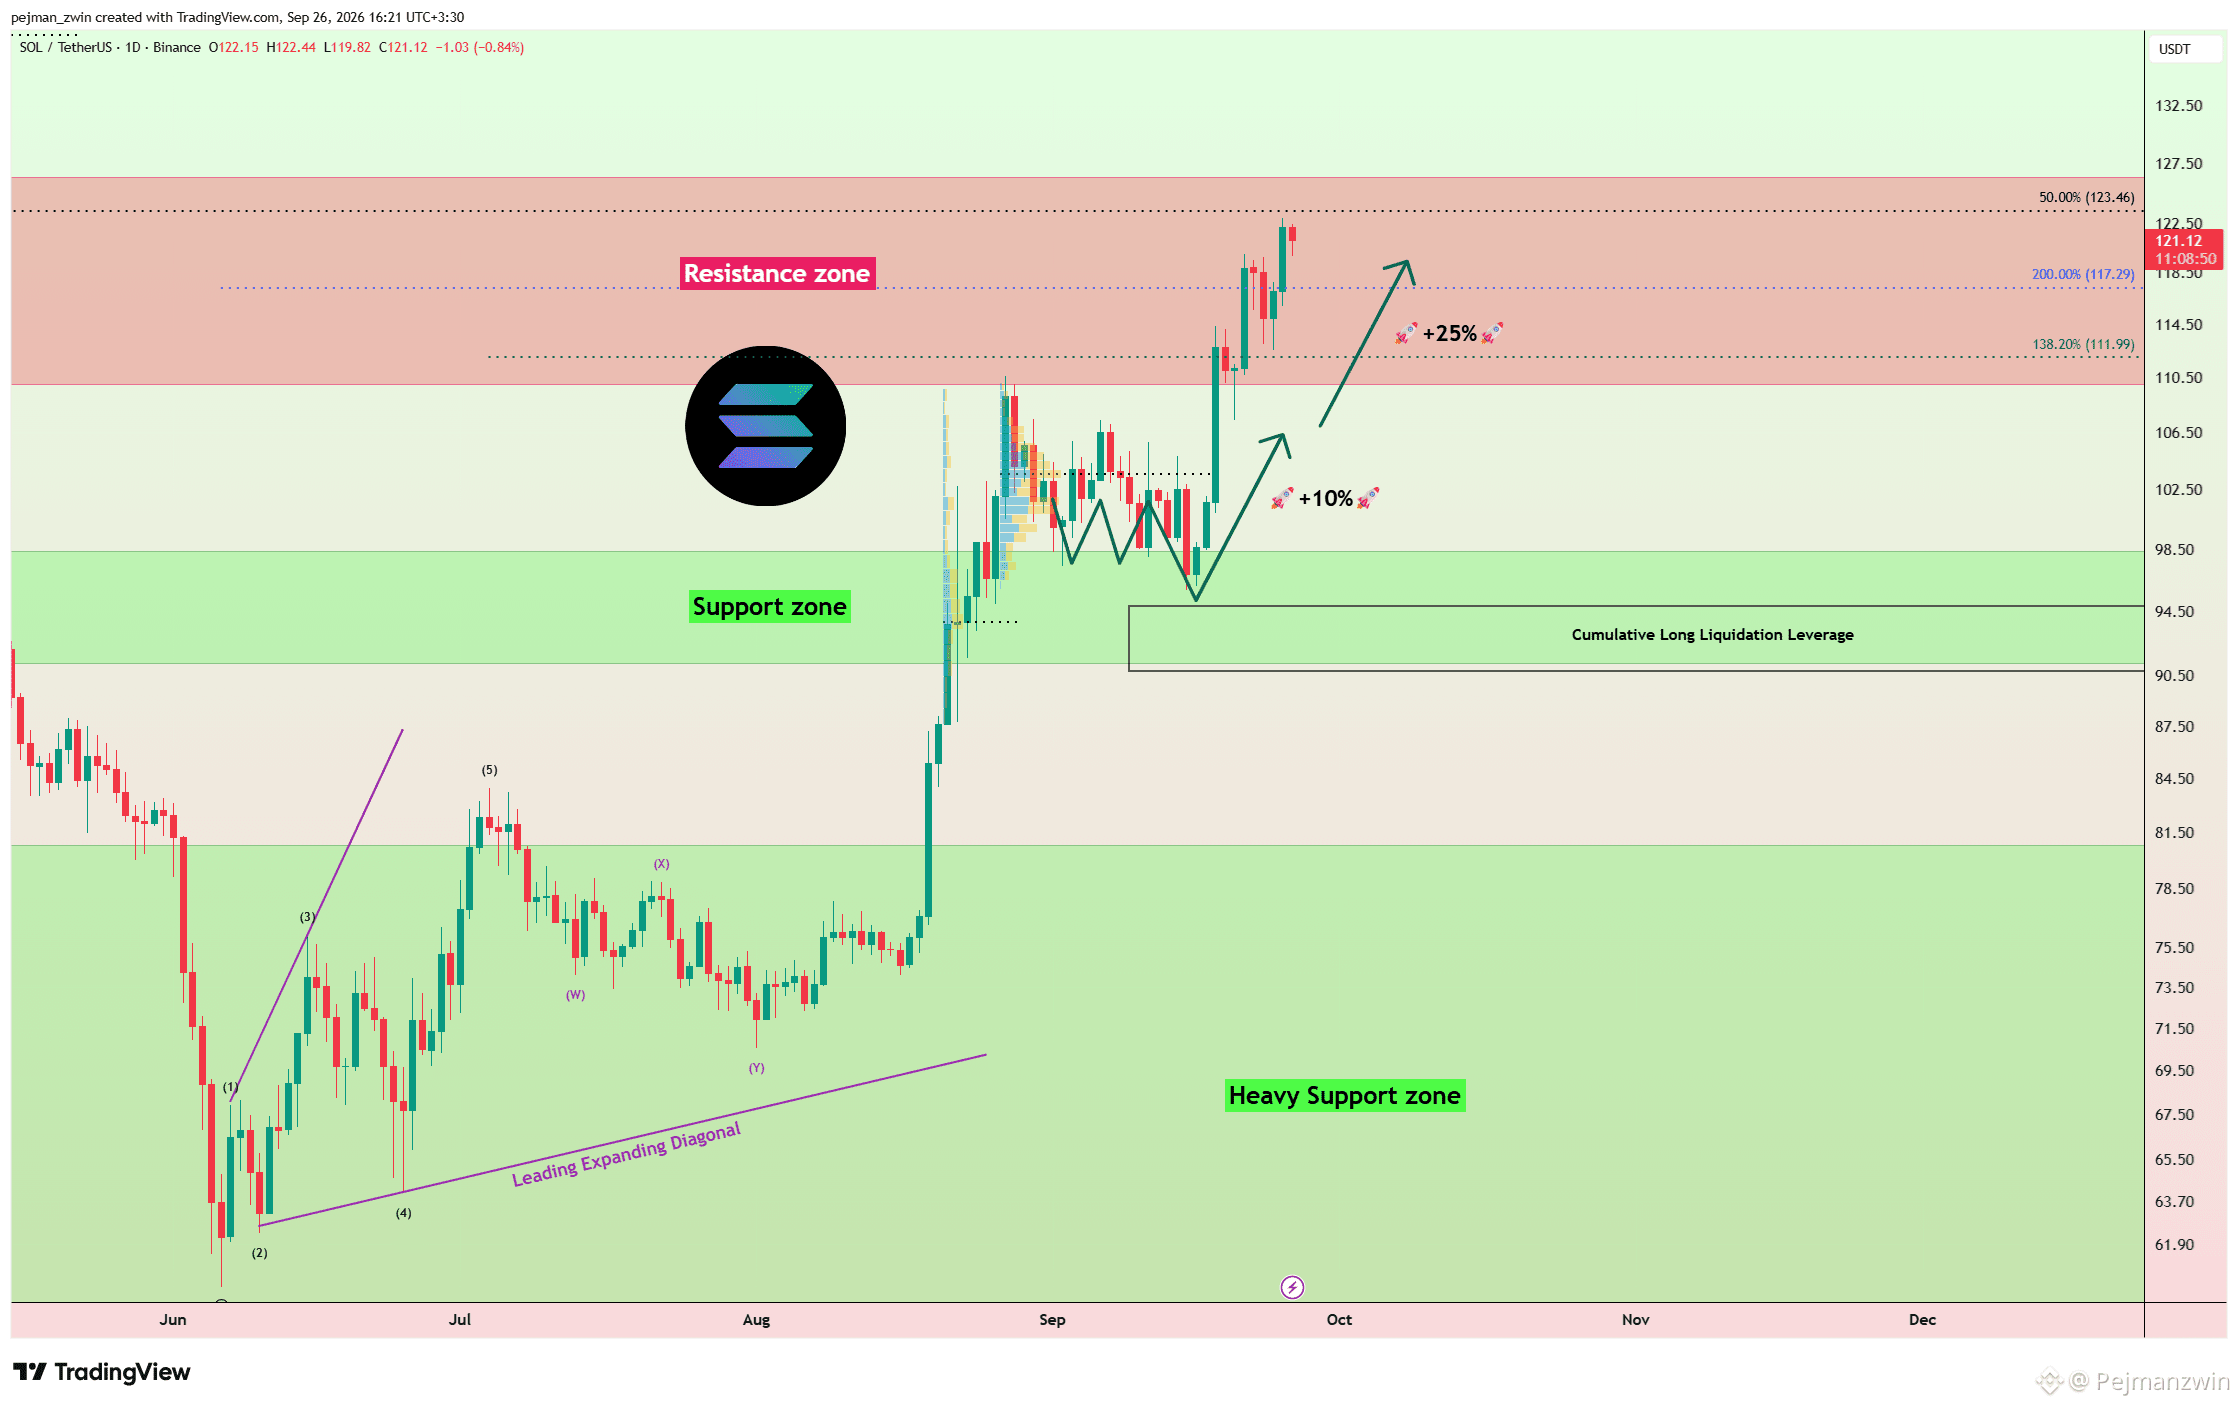
ブリッシュ$SOL ブレイクアウト確認 — 次は10%のリバウンド?
ソラナは強い出来高を伴ってレジスタンス・ゾーンを上抜けし、大きな買い圧力があることを確認しました。現在はブレイクアウトエリアへ向けて押し戻されており、次の値動きの重要ゾーンになる可能性があります。
注目すべき重要な流動性エリアは以下の2つです:
累積ロング・リキデーション・レバレッジ:$99.00–$100.20
より深い累積ロング・リキデーション・レバレッジ:$90.80–$94.80
$94の水準は、より広い上昇構造を維持するうえで特に重要です。
もしSOLがこれらのゾーン周辺で押し目を完了し、買い手がサポートをうまく防衛できるなら、少なくとも10%の強気の次の波が来て、ターゲットは累積ショート・リキデーション・レバレッジの$108.20–$109.50になると見込んでいます。
強い出来高によるブレイクアウトと、コントロールされた押し戻しの組み合わせにより、この強気の仕掛けは面白いものになっています。重要なサポート構造が維持されている限りは。
SOLは押し戻しゾーンを防衛し、次に$109.50へ向かうのでしょうか?
#solana
ソラナは強い出来高を伴ってレジスタンス・ゾーンを上抜けし、大きな買い圧力があることを確認しました。現在はブレイクアウトエリアへ向けて押し戻されており、次の値動きの重要ゾーンになる可能性があります。
注目すべき重要な流動性エリアは以下の2つです:
累積ロング・リキデーション・レバレッジ:$99.00–$100.20
より深い累積ロング・リキデーション・レバレッジ:$90.80–$94.80
$94の水準は、より広い上昇構造を維持するうえで特に重要です。
もしSOLがこれらのゾーン周辺で押し目を完了し、買い手がサポートをうまく防衛できるなら、少なくとも10%の強気の次の波が来て、ターゲットは累積ショート・リキデーション・レバレッジの$108.20–$109.50になると見込んでいます。
強い出来高によるブレイクアウトと、コントロールされた押し戻しの組み合わせにより、この強気の仕掛けは面白いものになっています。重要なサポート構造が維持されている限りは。
SOLは押し戻しゾーンを防衛し、次に$109.50へ向かうのでしょうか?
#solana
Pejmanzwin
·
--
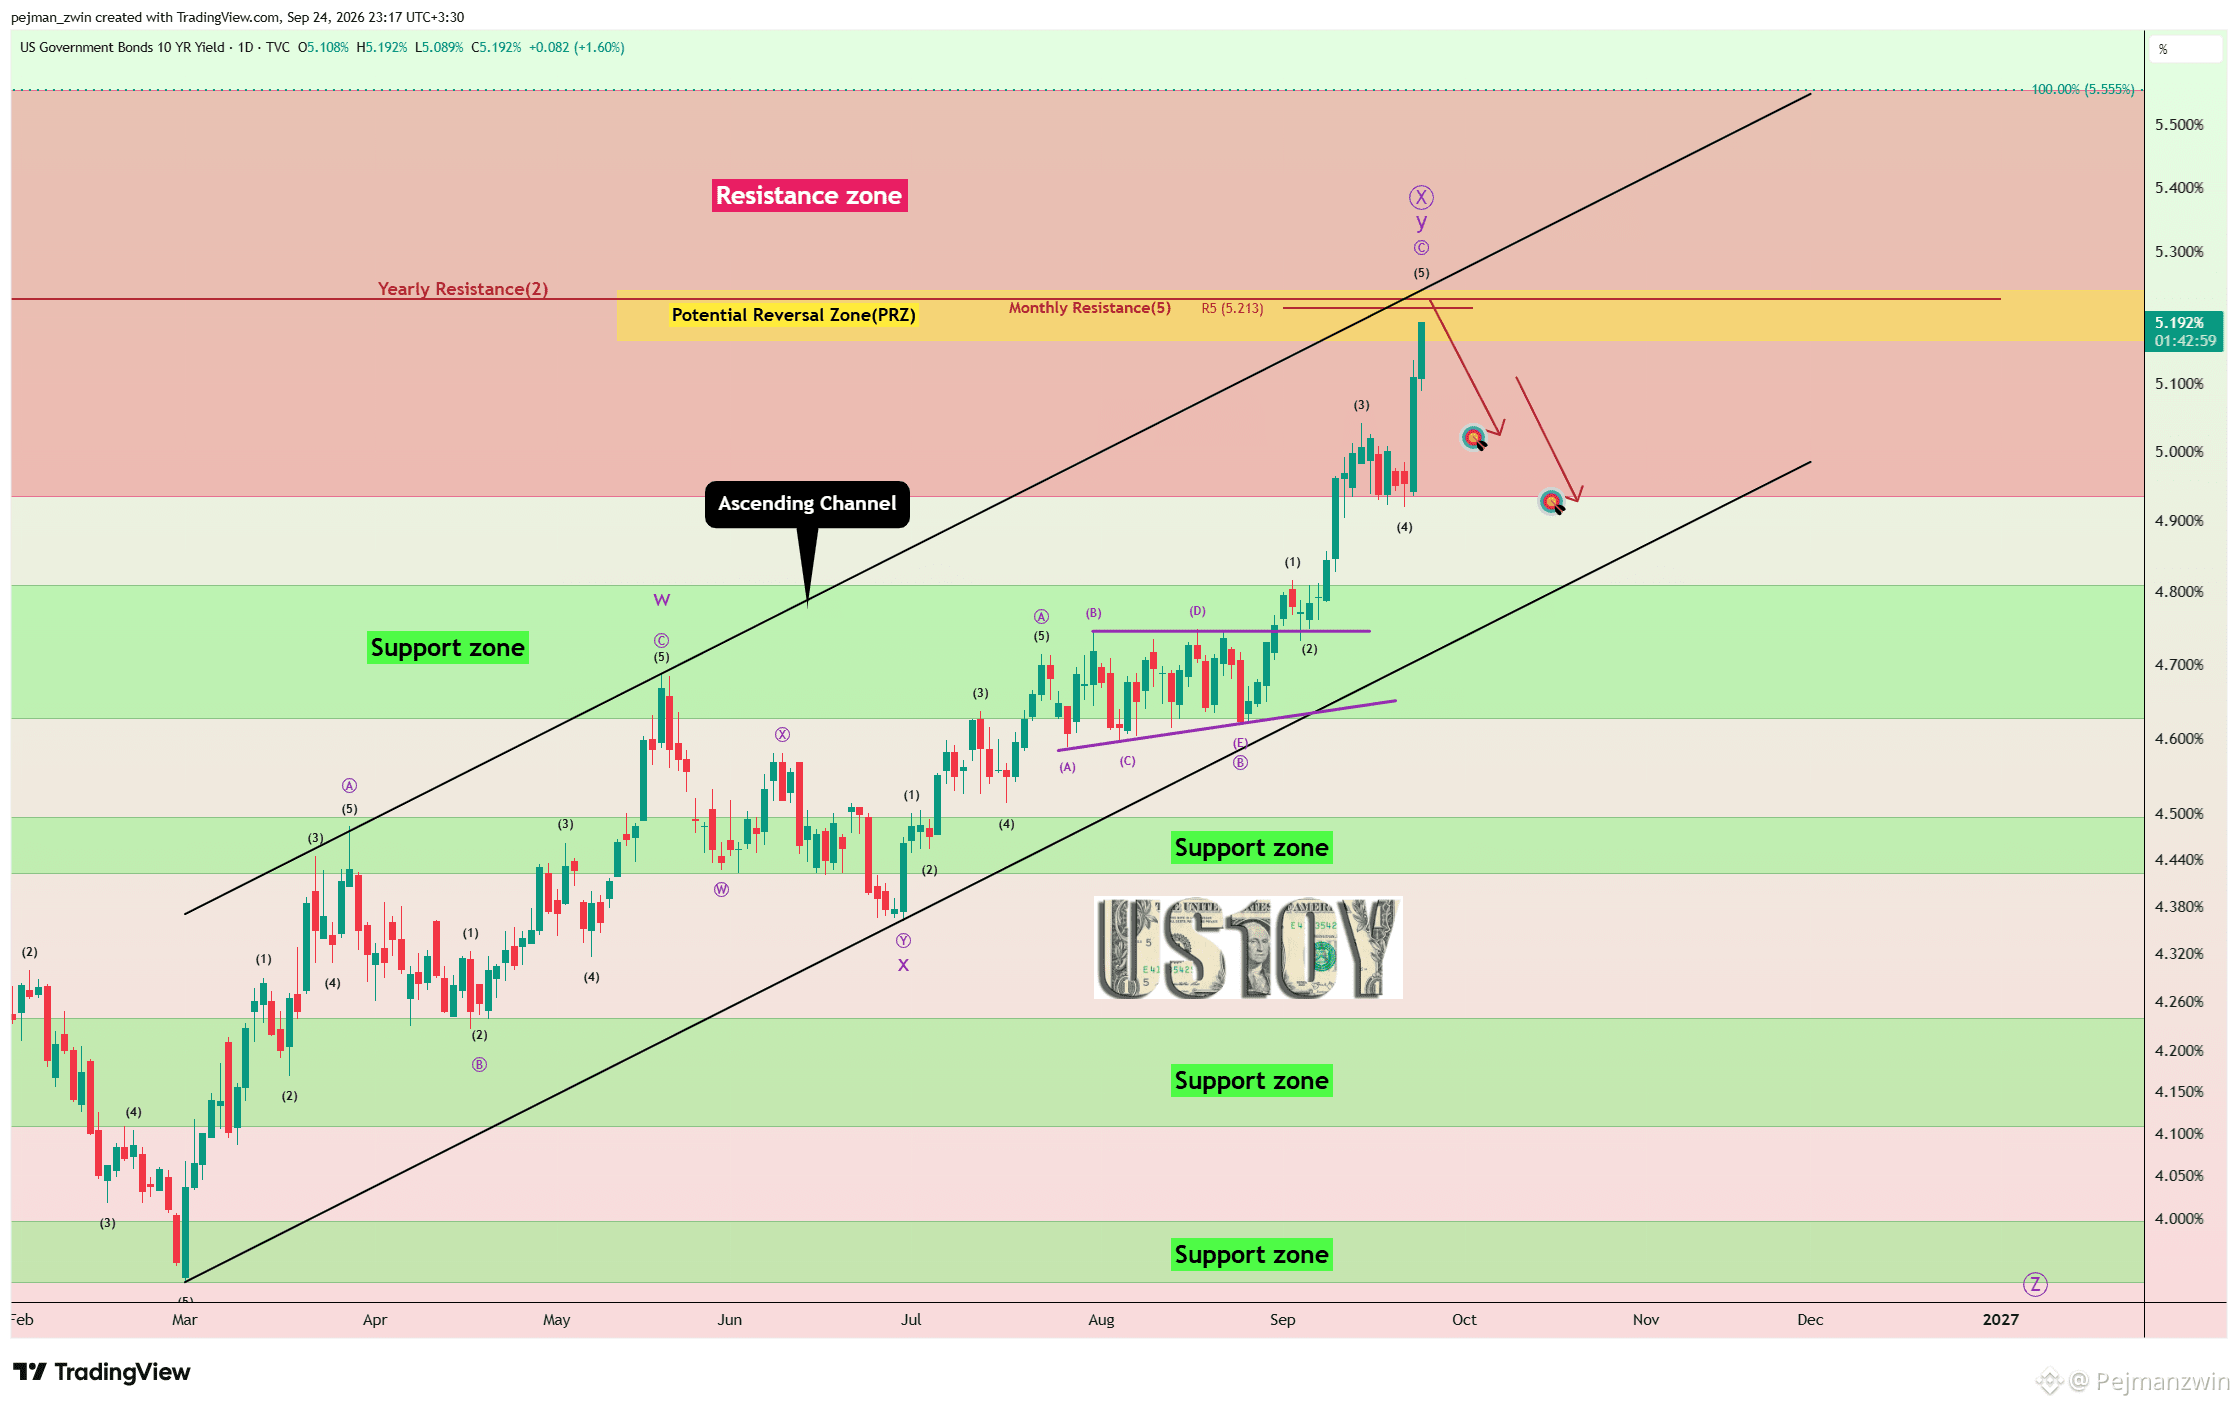
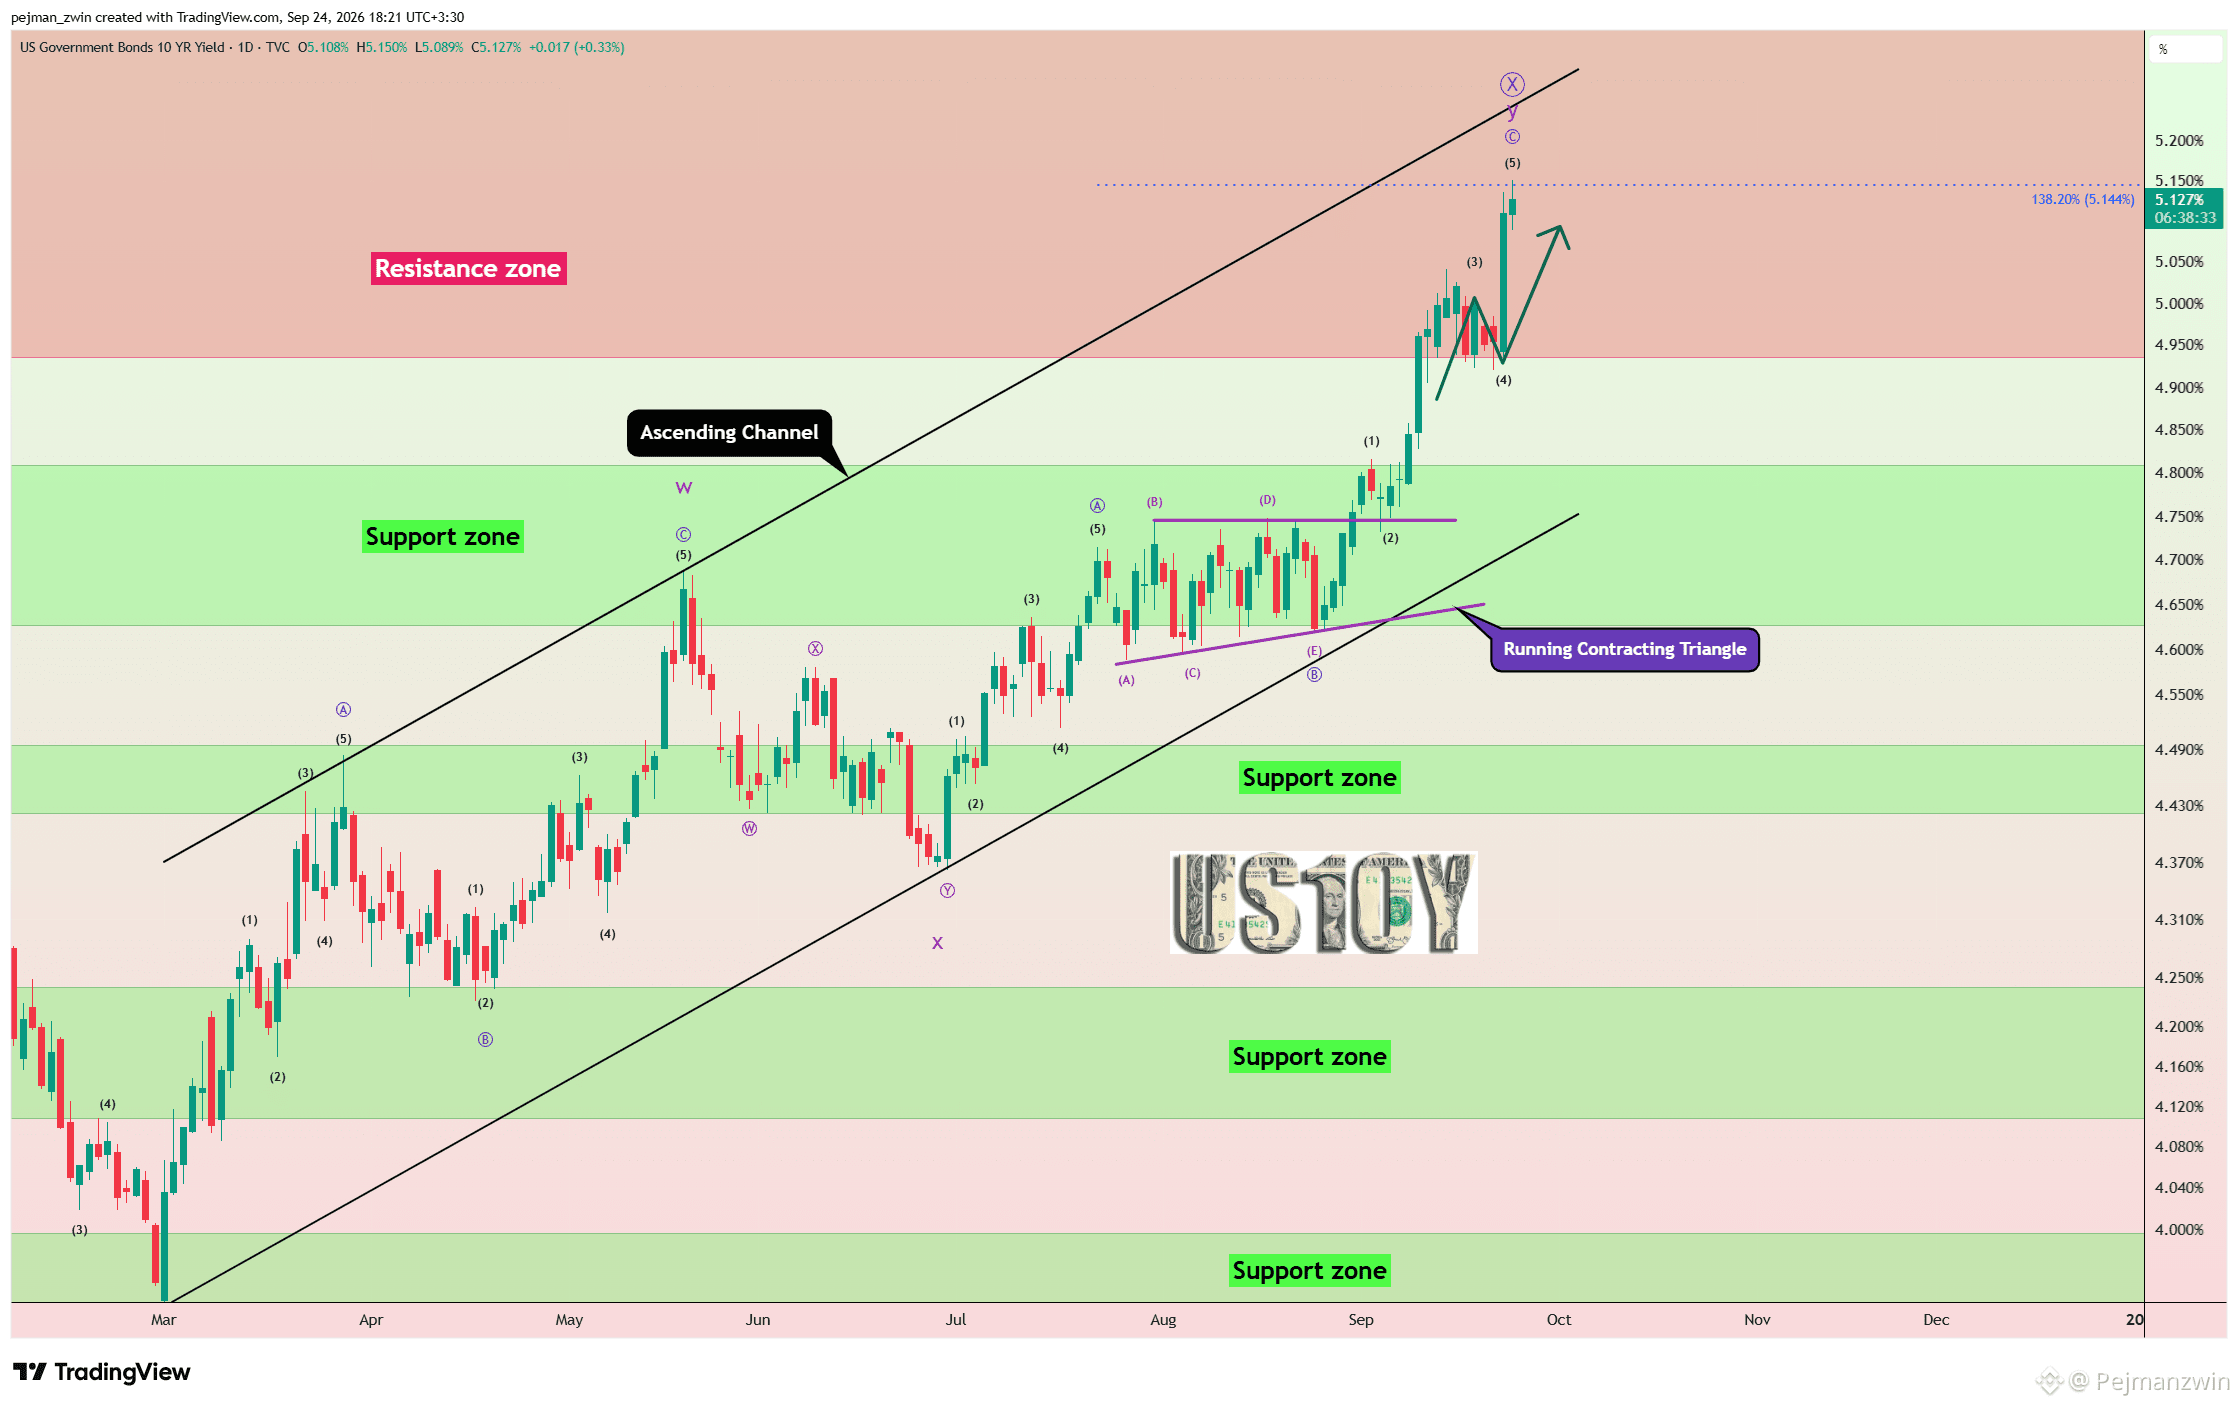
US10Yは5%に接近中——5.1%は別の市場の売りを引き起こし得るか?
米10年国債利回り(US10Y)は、世界の金利と金融環境を測る最も重要なベンチマークの1つです。
その最近の上昇は、債券市場をはるかに超えて重要です。
高い国債利回りは、金融環境を引き締め、リスクフリー資産の魅力を高めることで、米国株、ゴールド、シルバー、ビットコイン、そしてより広範な暗号資産市場に対して圧力をかけ得ます。
いま鍵となる問いは次のとおりです:
米10年債利回り(US10Y)が5.1%に向けてさらに上昇し、金融市場全体に対してもう一段の圧力の波を引き起こすのでしょうか?
その最近の上昇は、債券市場をはるかに超えて重要です。
高い国債利回りは、金融環境を引き締め、リスクフリー資産の魅力を高めることで、米国株、ゴールド、シルバー、ビットコイン、そしてより広範な暗号資産市場に対して圧力をかけ得ます。
いま鍵となる問いは次のとおりです:
米10年債利回り(US10Y)が5.1%に向けてさらに上昇し、金融市場全体に対してもう一段の圧力の波を引き起こすのでしょうか?
本人確認中
Pejmanzwin
·
--
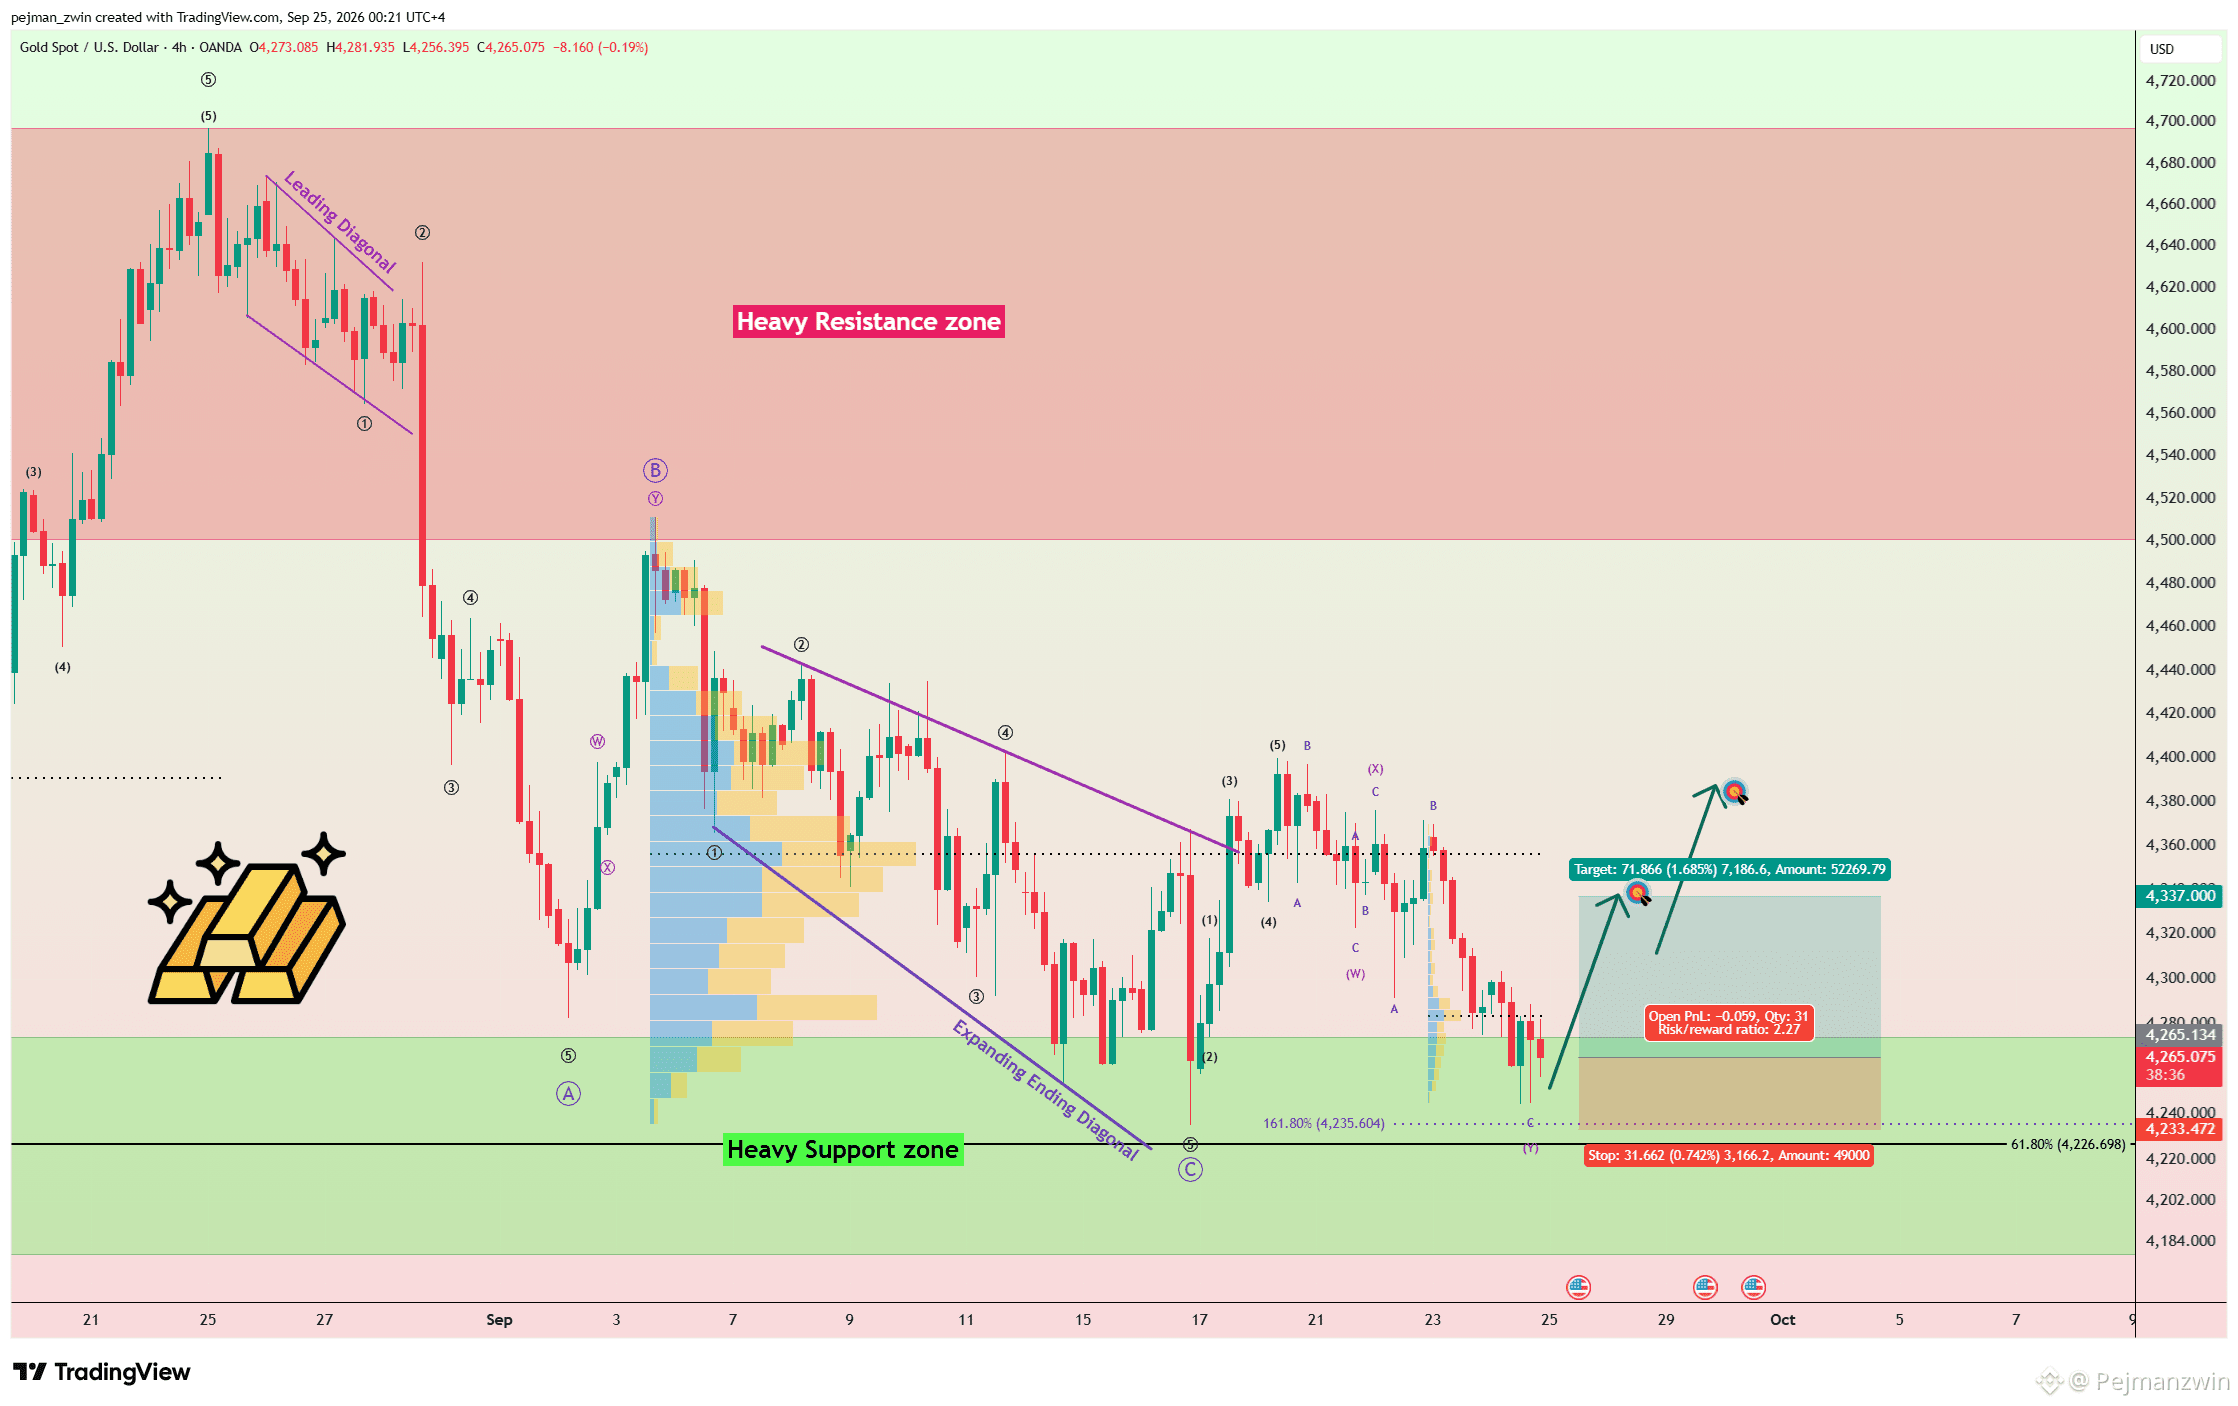
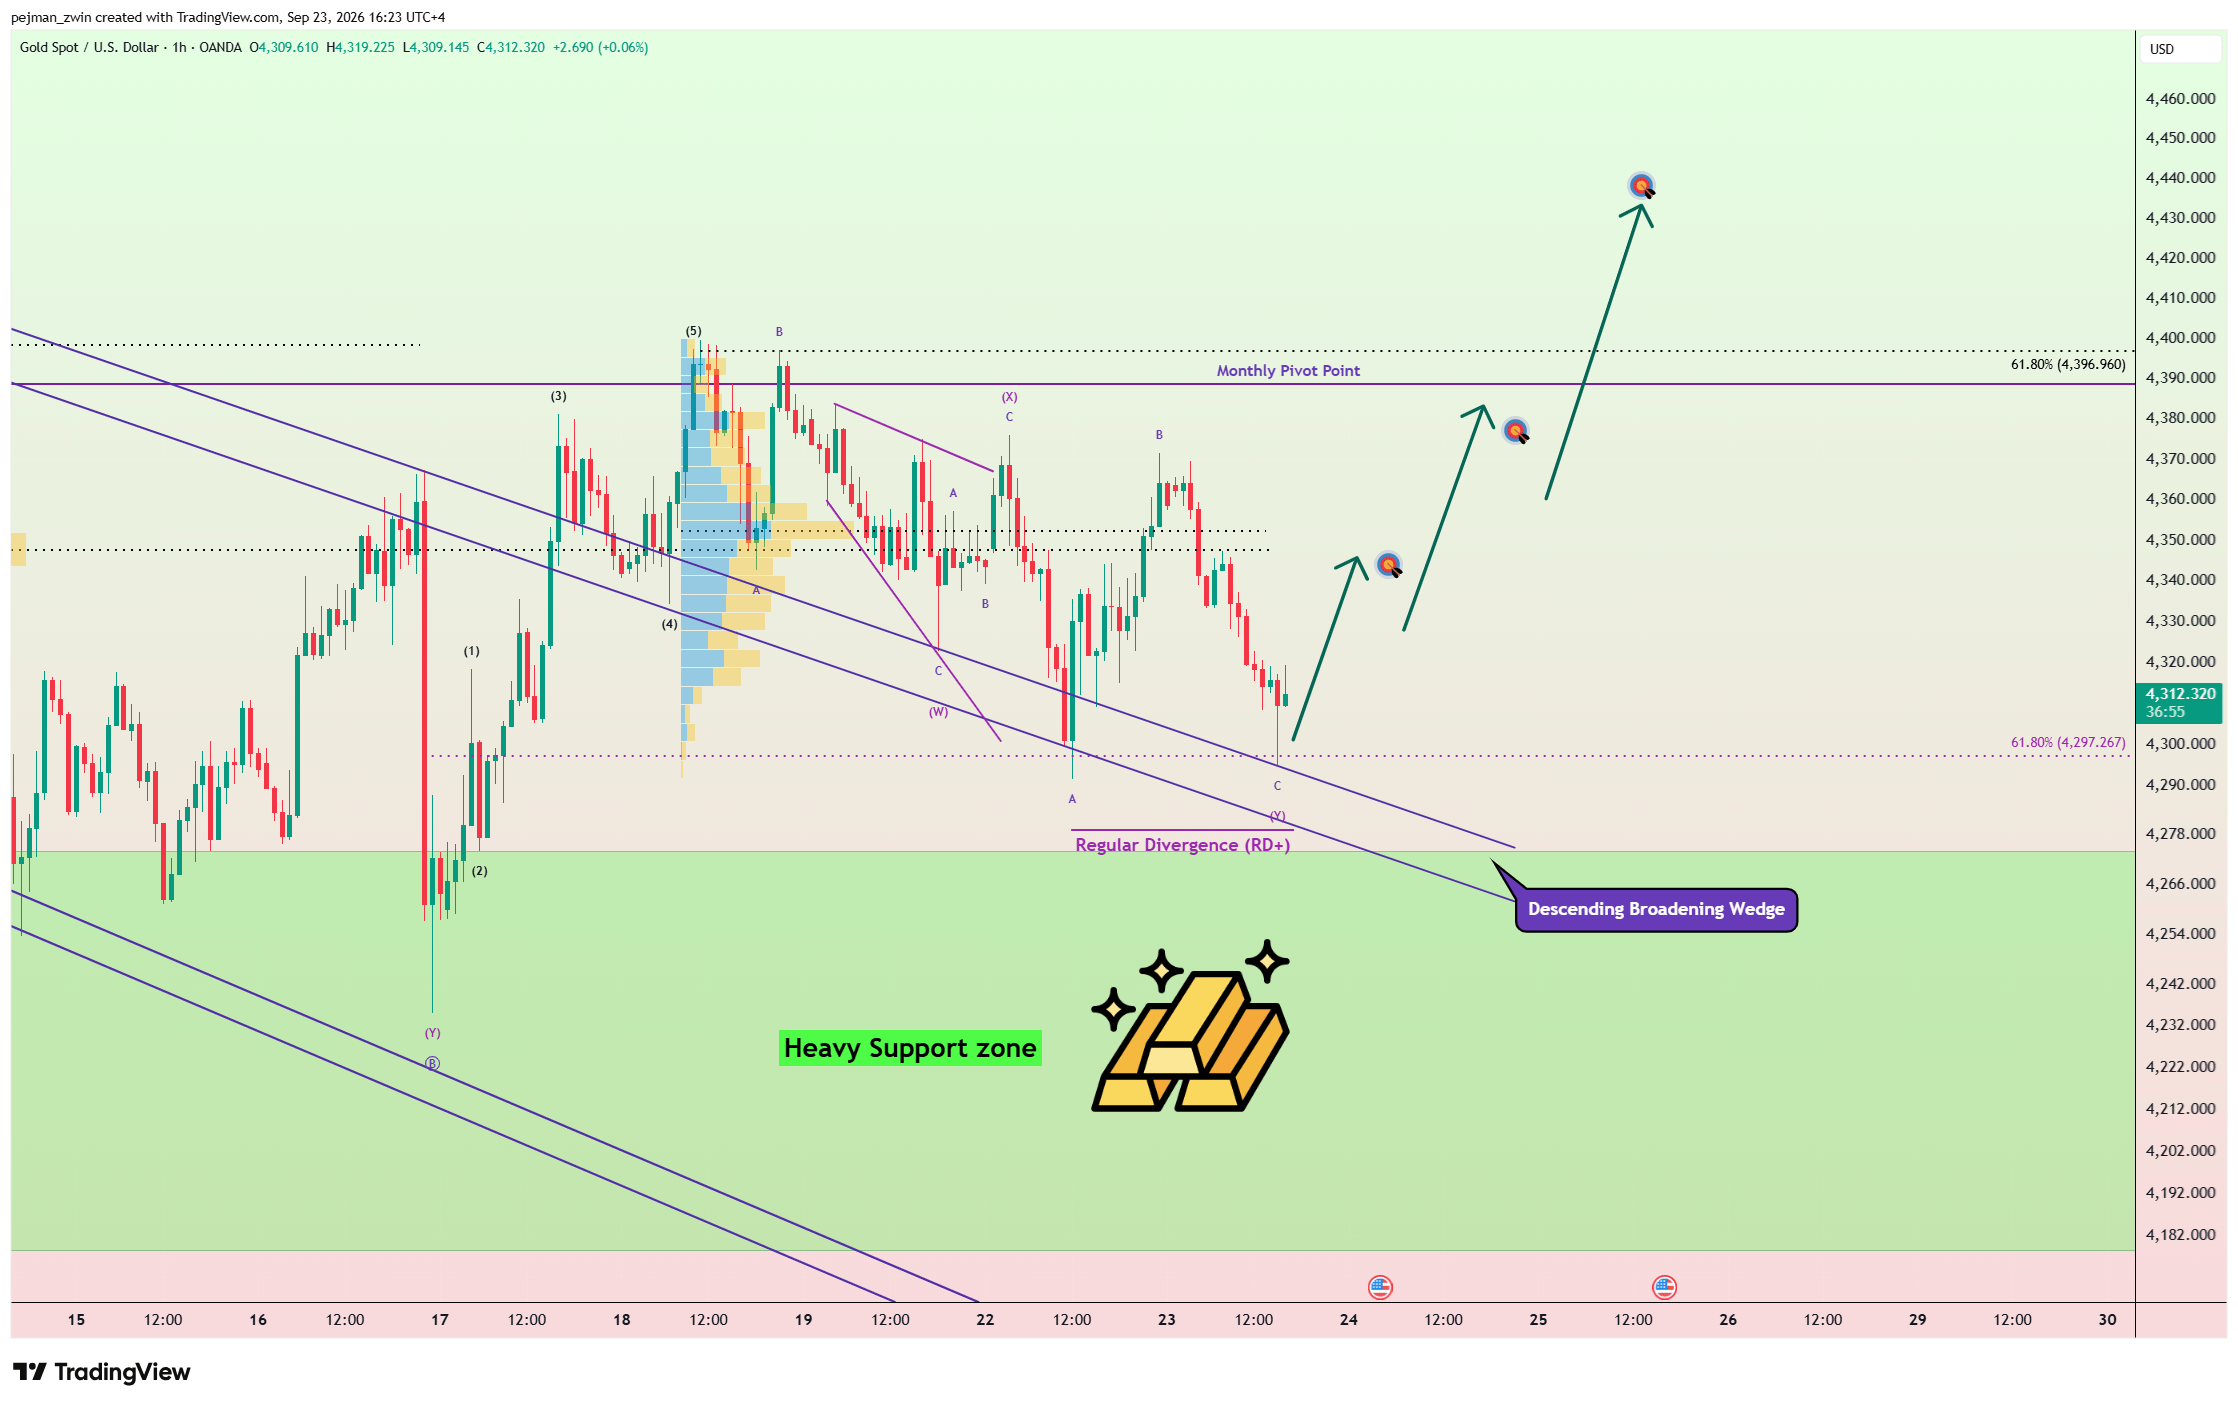
ブリッシュ広がるくさび(下降のブロードニング・ウェッジ)上でゴールドが推移:調整は終了したのか?
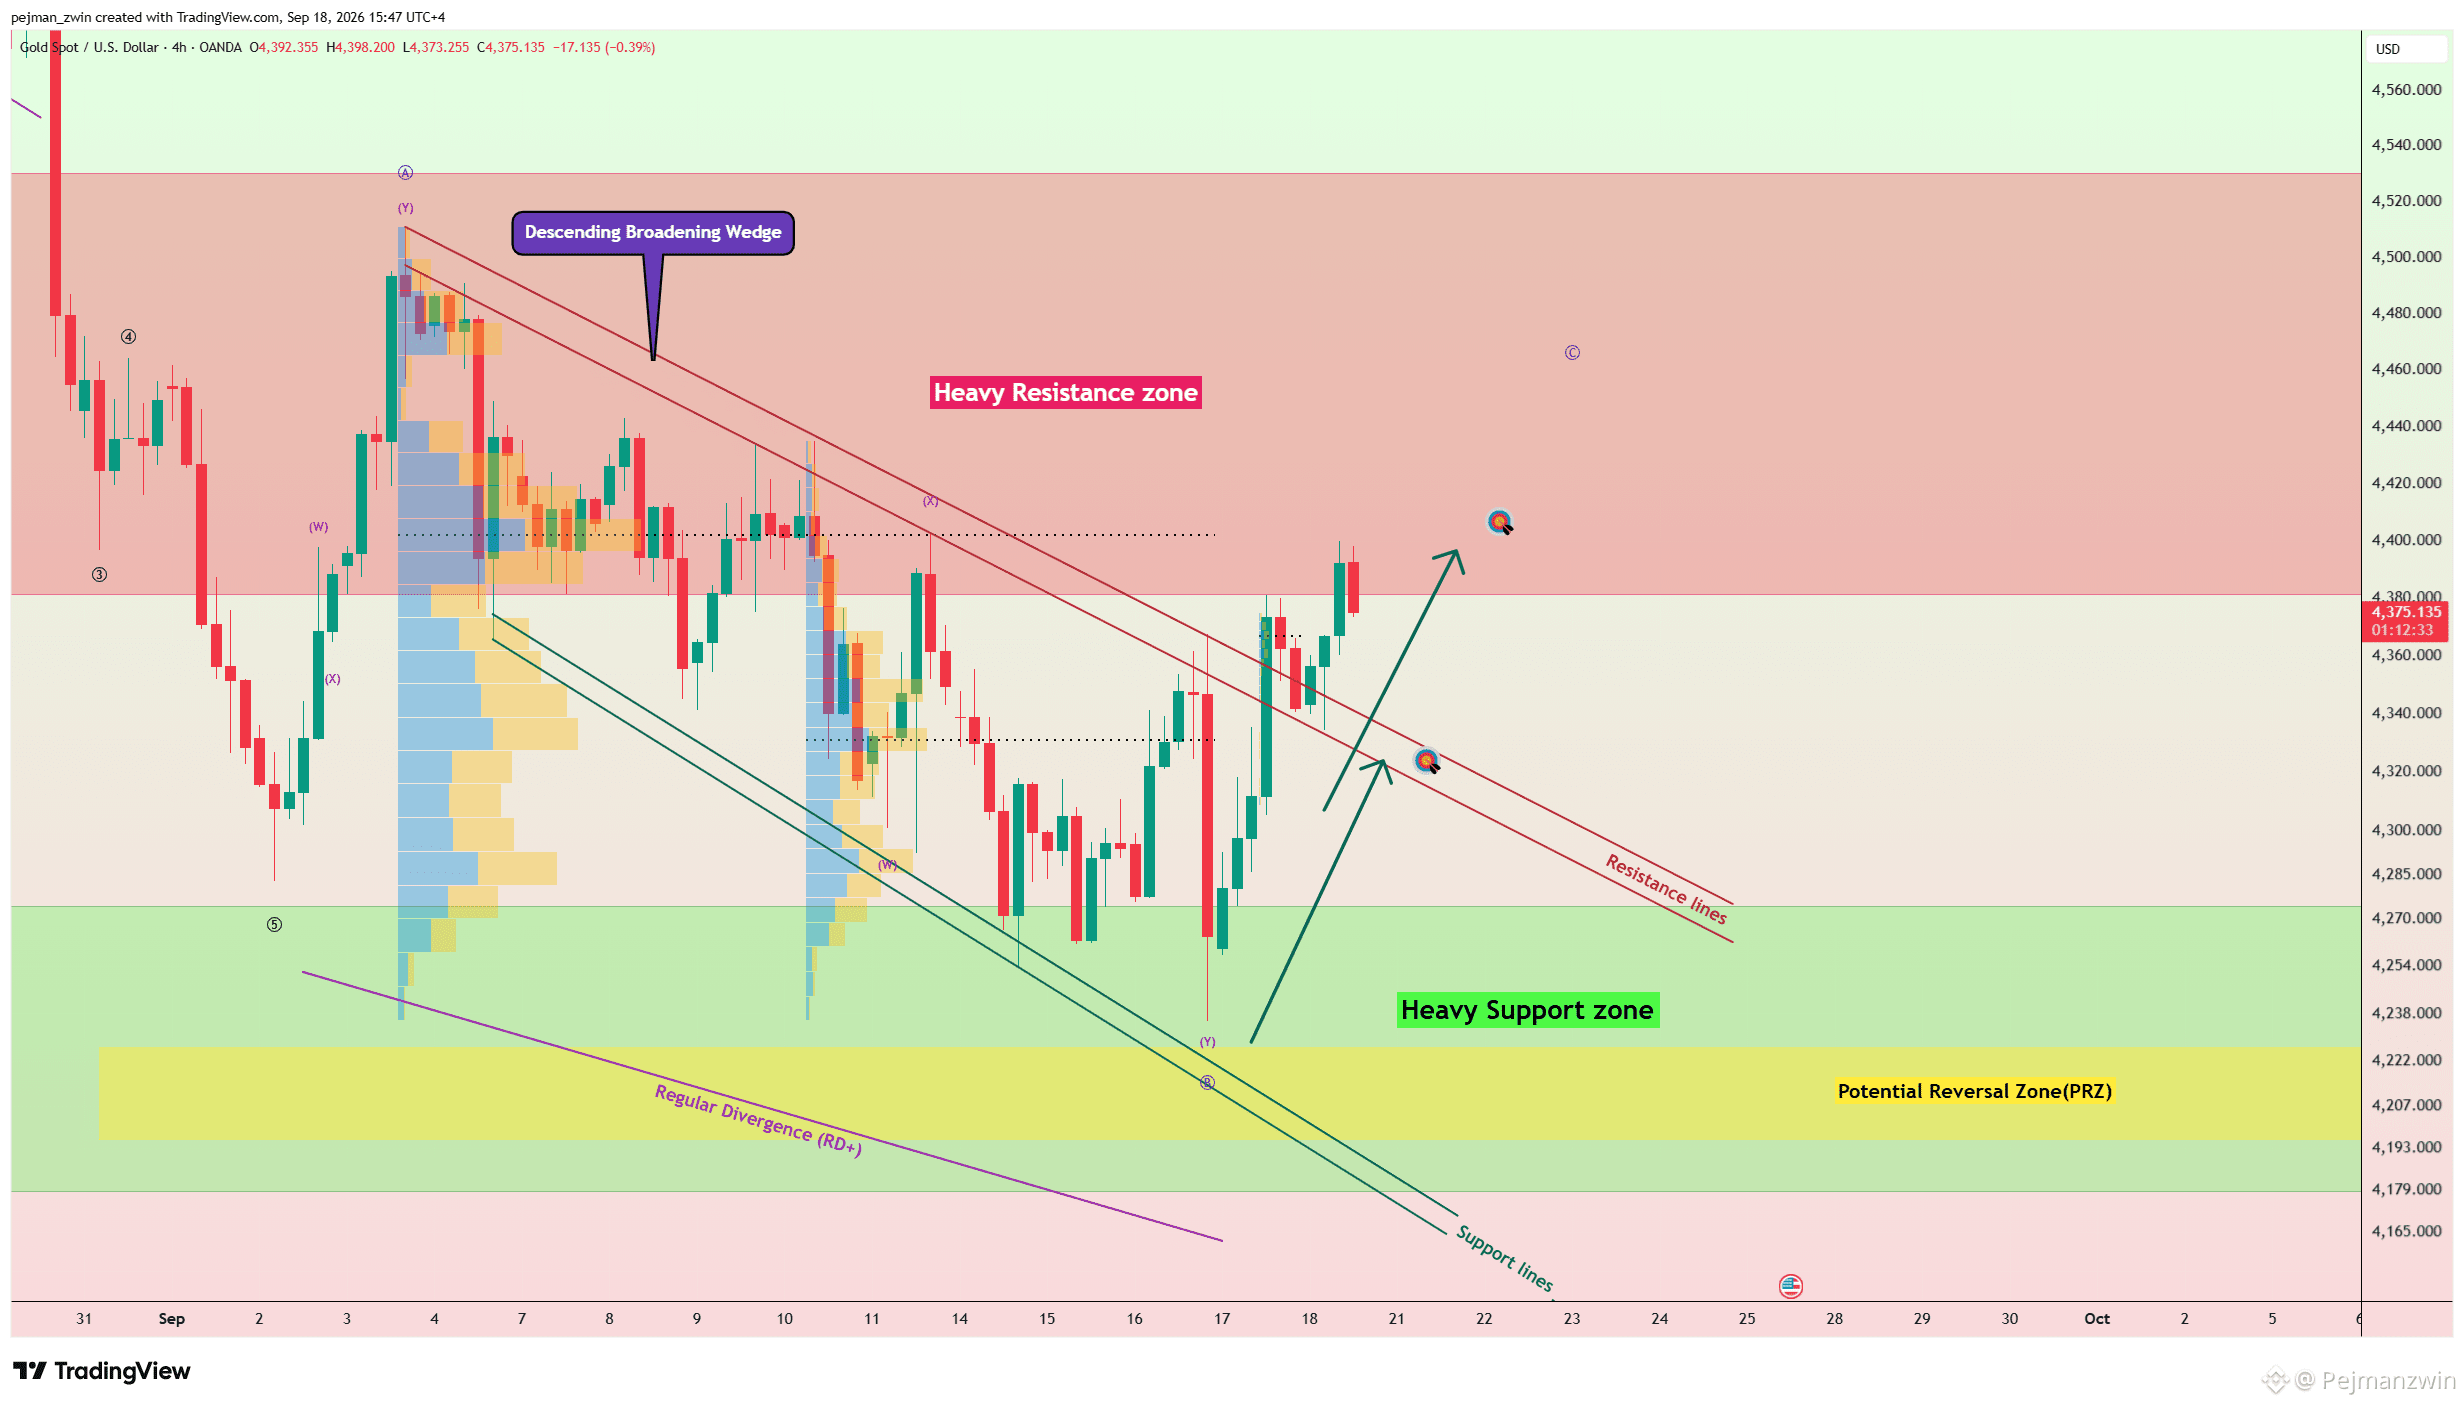
$XAU は過去4〜5日で下落してきましたが、この動きは高いボラティリティを伴い、比較的弱い弱気モメンタムで進行しています。
さらに重要なのは、価格が下降ブロードニング・ウェッジのトレンドライン上に留まっていることで、より大きな強気シナリオが継続している点です。
ゴールドは現在、強いサポートゾーン近辺で取引されており、今回の調整がそろそろ完了に近づいている可能性があります。
エリオット波の観点では、ゴールドは過去5日間でダブル・スリー・コレクション(W-X-Y)を形成したように見えます。もしこの構造が完成しているなら、次の上昇を伴うインパルス的な強気の動きは、現在の価格帯から始まるかもしれません。
私はまず、ゴールドが$4,344方向へ動く可能性があると見ています。
重要な$4,350の取引水準を上抜け(確定)できれば、$4,377へ向かう道が開けます。
強気モメンタムが強まれば、その後$4,421まで伸びる可能性があり、$4,400は取り戻すべき最重要レベルの1つとして残ります。
取引セットアップ
第1目標(TP):$4,344
第2目標(TP):$4,377
第3目標(TP):$4,421
損切り(Stop Loss):$4,284
重要レベル:$4,350 | $4,400
ゴールドはどのレベルに先に到達するでしょうか?
🟢 $4,421
🔴 $4,284
#GOLD
$XAU は過去4〜5日で下落してきましたが、この動きは高いボラティリティを伴い、比較的弱い弱気モメンタムで進行しています。
さらに重要なのは、価格が下降ブロードニング・ウェッジのトレンドライン上に留まっていることで、より大きな強気シナリオが継続している点です。
ゴールドは現在、強いサポートゾーン近辺で取引されており、今回の調整がそろそろ完了に近づいている可能性があります。
エリオット波の観点では、ゴールドは過去5日間でダブル・スリー・コレクション(W-X-Y)を形成したように見えます。もしこの構造が完成しているなら、次の上昇を伴うインパルス的な強気の動きは、現在の価格帯から始まるかもしれません。
私はまず、ゴールドが$4,344方向へ動く可能性があると見ています。
重要な$4,350の取引水準を上抜け(確定)できれば、$4,377へ向かう道が開けます。
強気モメンタムが強まれば、その後$4,421まで伸びる可能性があり、$4,400は取り戻すべき最重要レベルの1つとして残ります。
取引セットアップ
第1目標(TP):$4,344
第2目標(TP):$4,377
第3目標(TP):$4,421
損切り(Stop Loss):$4,284
重要レベル:$4,350 | $4,400
ゴールドはどのレベルに先に到達するでしょうか?
🟢 $4,421
🔴 $4,284
#GOLD
Pejmanzwin
·
--
ブリッシュ$BTC 下落を退けろ——$75Kは$80Kに向けた動きを始められるか?
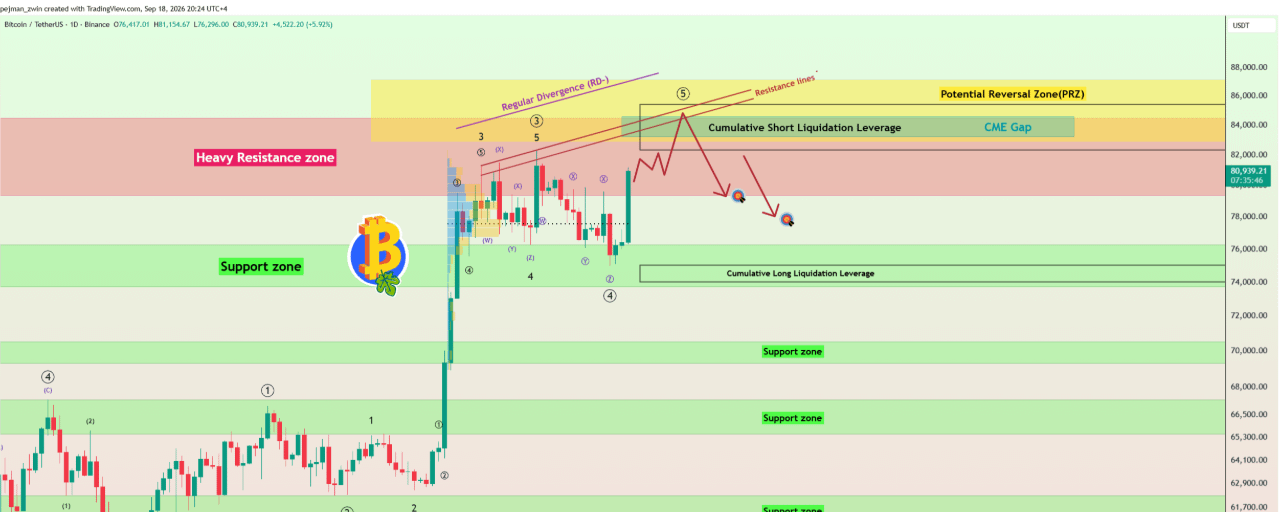
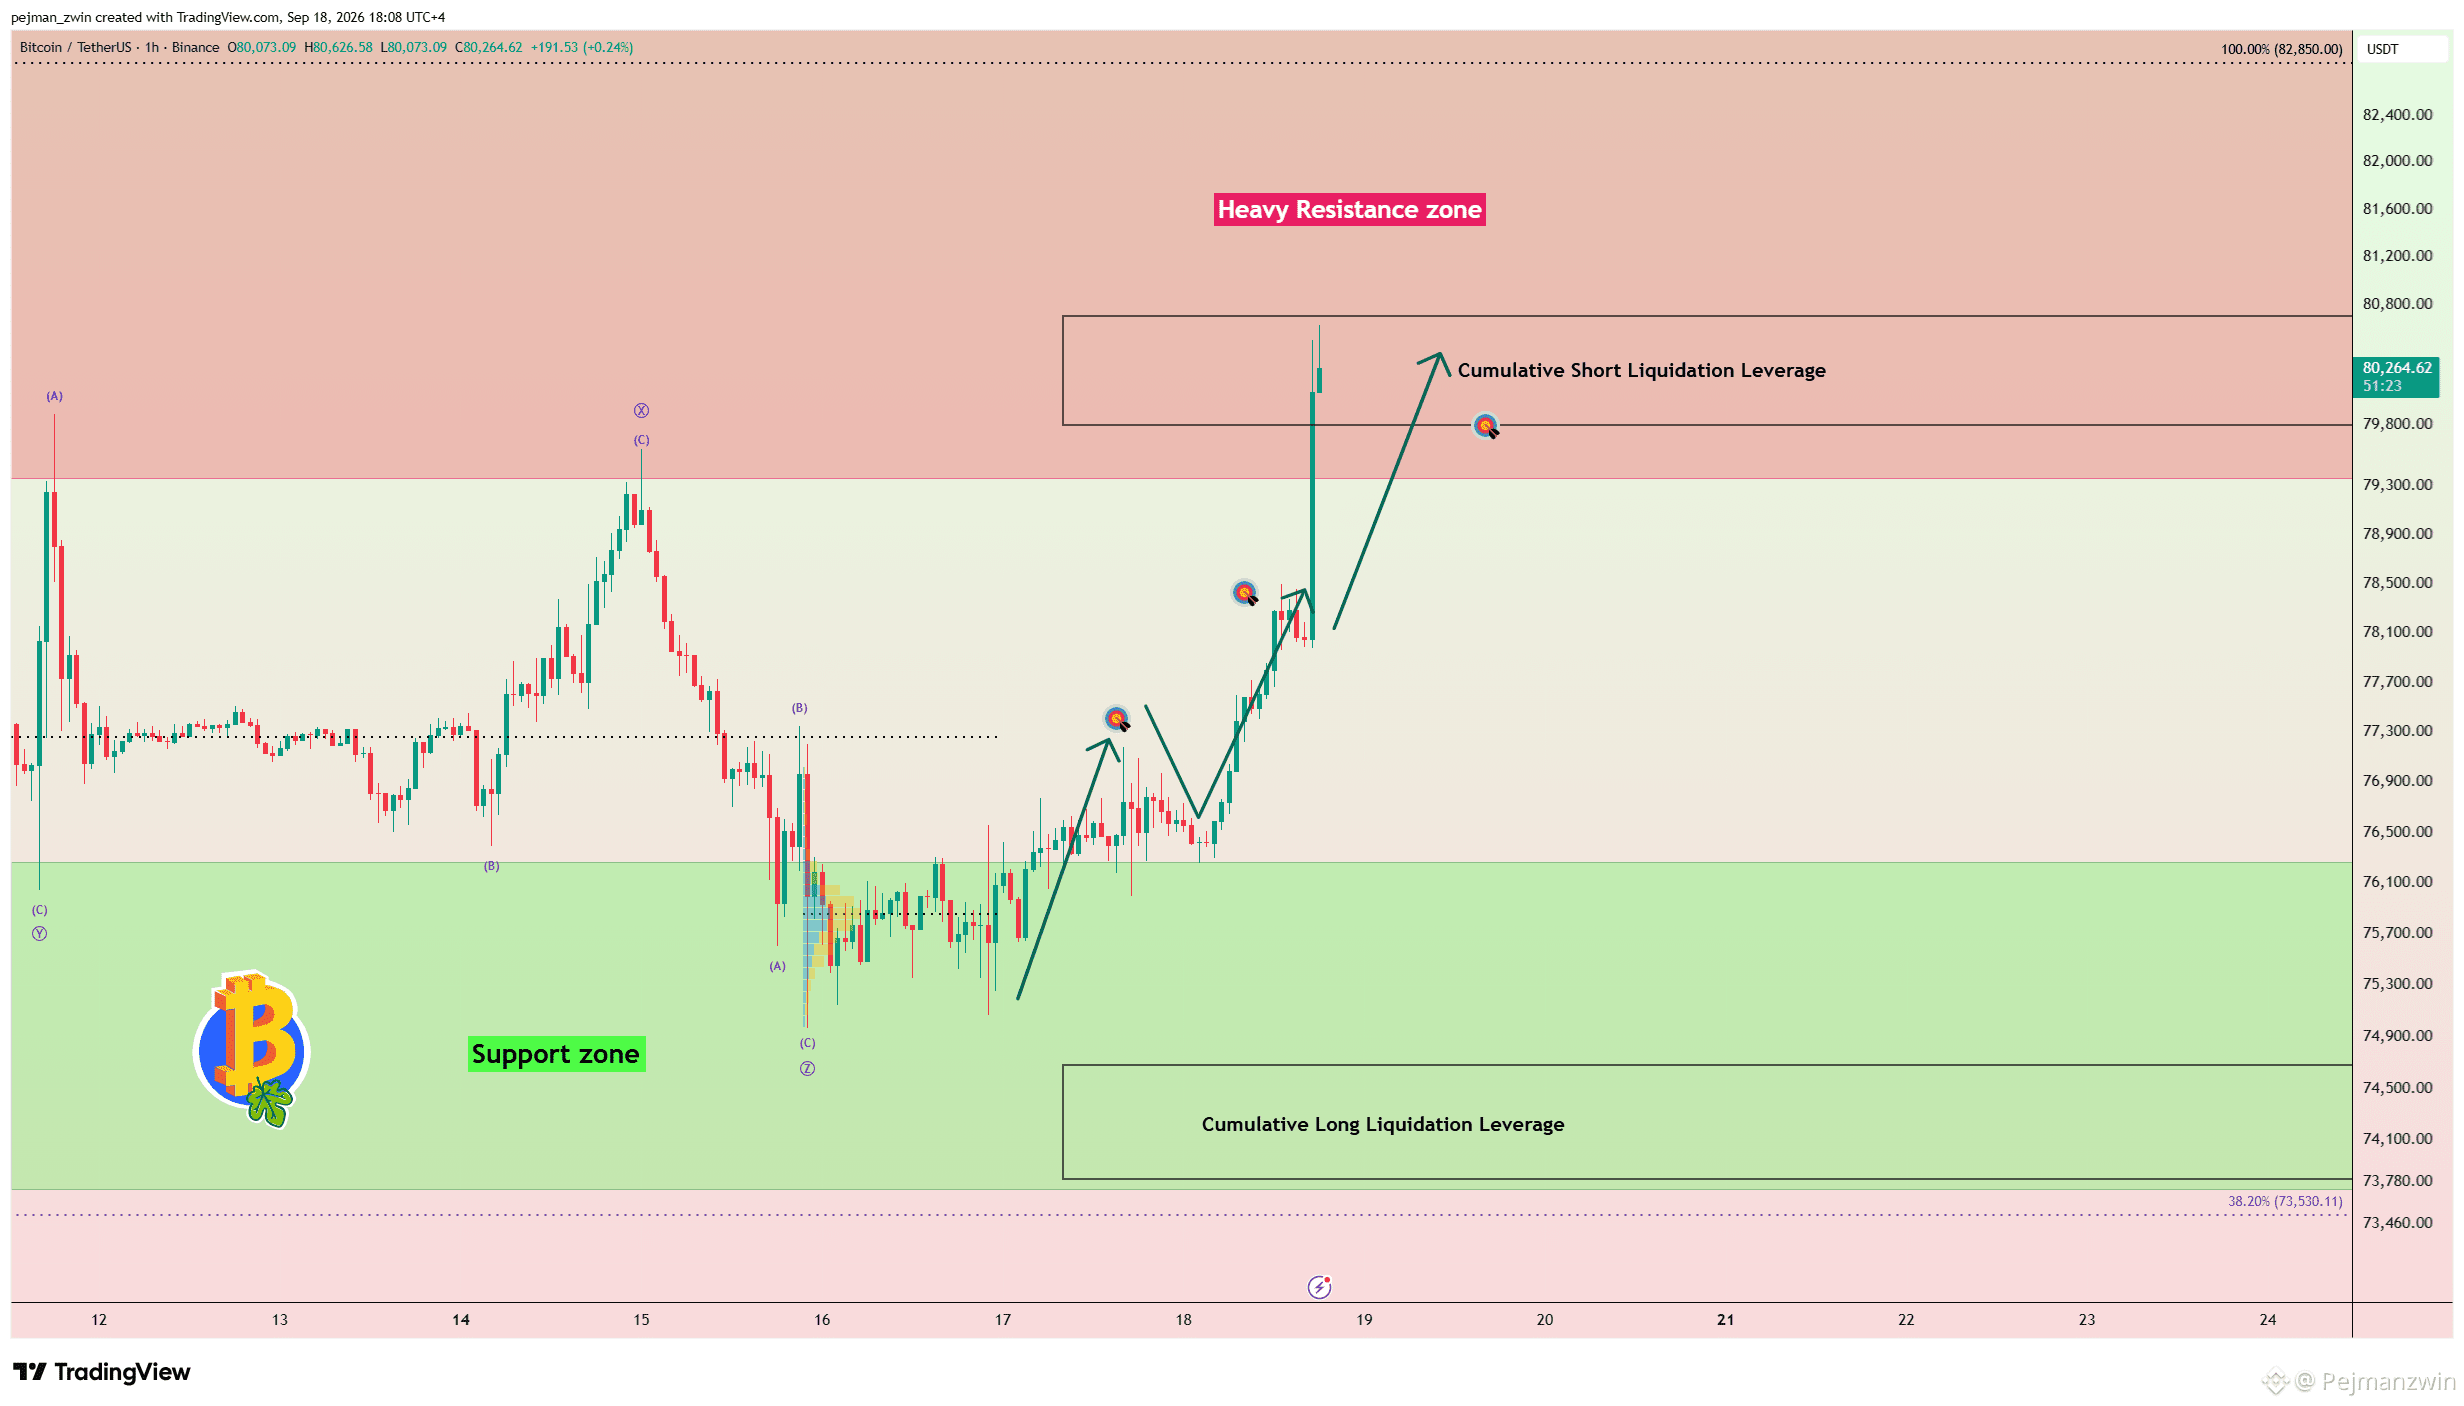
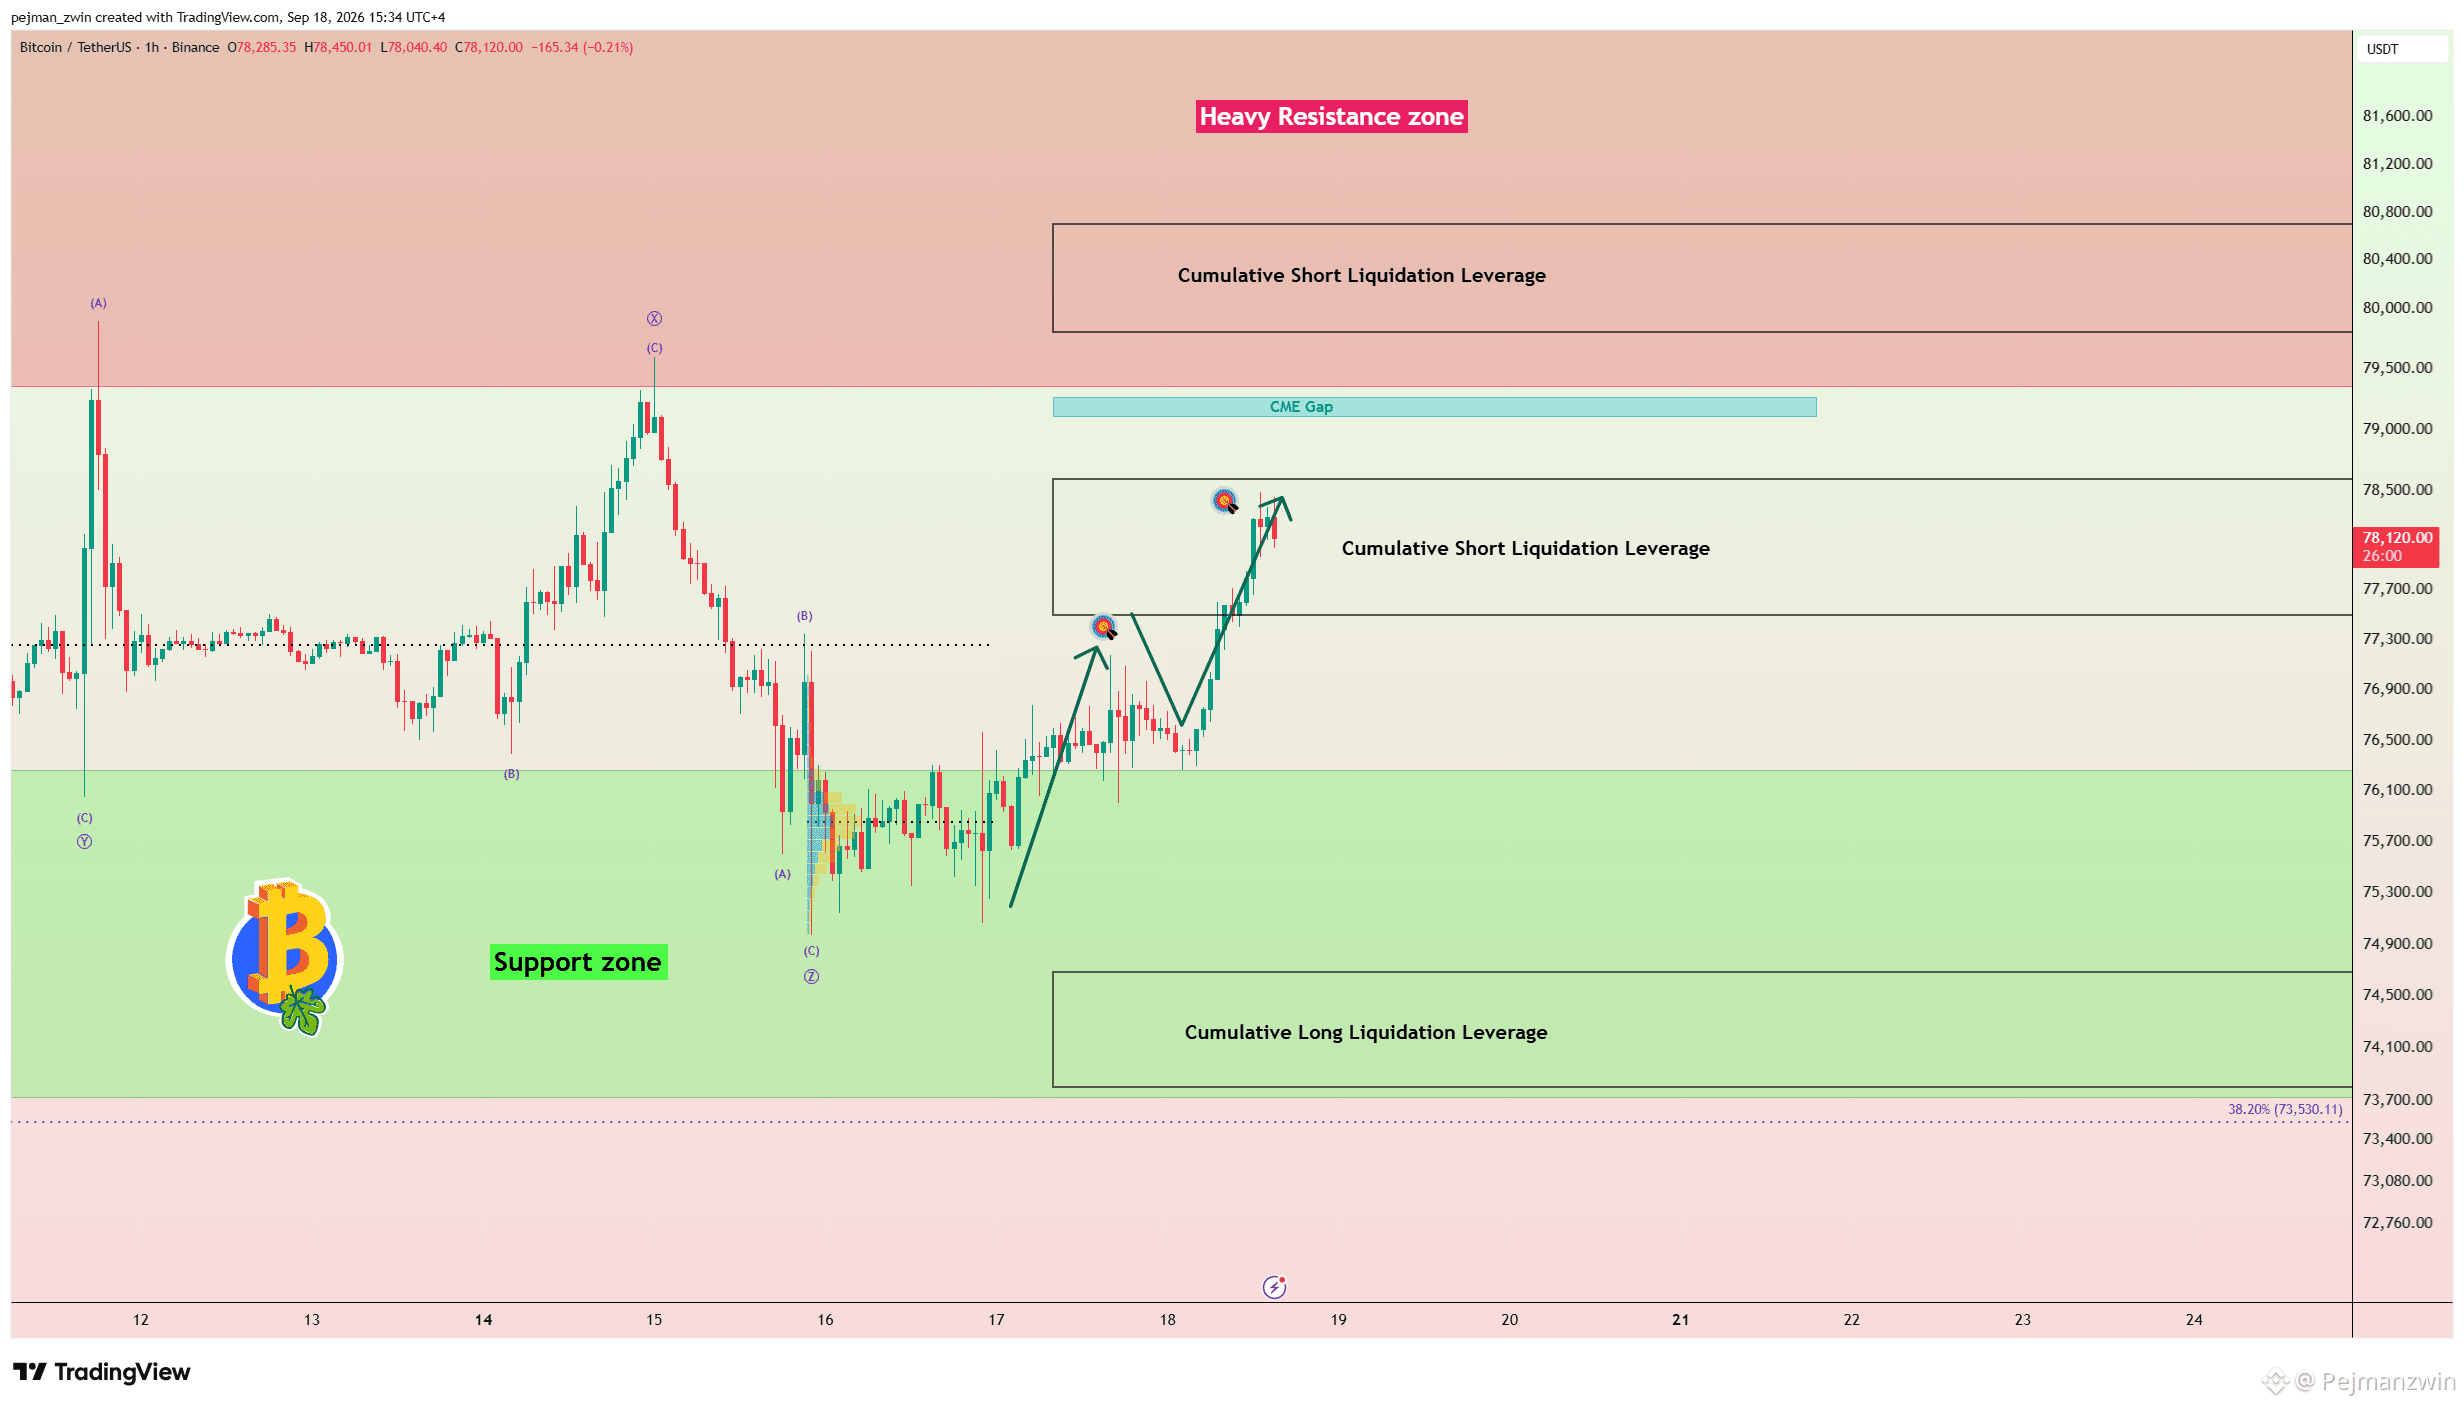
ビットコインはFRBの利上げ決定とケビン・ウォーシュの発言を受けて急激な値動きに見舞われたが、金やS&P 500とは異なり、BTCはこれまでサポート・ゾーン内に留まることに成功している。
いま、$75,000が重要な攻防の舞台だ。
約10億ドル規模のロングポジションが$74,860前後で清算される可能性がある一方、BTCはまた、累積ロング清算レバレッジが$73,800〜$74,680近辺で取引されている。
マクロ面での圧力にもかかわらず、ビットコインのテクニカル構造はなお興味深い。
50日SMA(デイリー)と200日SMA(デイリー)の間での有効なゴールデンクロスが維持されており、また過去12日間のエリオット波動構造は、強い弱気というよりは修正的に見える。
BTCが$73,500を上回っている限り、さらに強気の再挑戦があると見ている。
重要な$77,280を上抜ければ、$78,370へ向かう道が開け、その後は累積ショート清算レバレッジである$79,800〜$80,700が視野に入る。
トレード設定
最初のTP:$76,990
第2のTP:$78,370
第3のTP:$79,800〜$80,700
損切り:$73,500
重要レベル:$77,280
新たなCMEギャップ:$79,110〜$79,270
ビットコインは先にどのレベルに到達する?
🟢 $79,800
🔴 $73,500
ビットコインはFRBの利上げ決定とケビン・ウォーシュの発言を受けて急激な値動きに見舞われたが、金やS&P 500とは異なり、BTCはこれまでサポート・ゾーン内に留まることに成功している。
いま、$75,000が重要な攻防の舞台だ。
約10億ドル規模のロングポジションが$74,860前後で清算される可能性がある一方、BTCはまた、累積ロング清算レバレッジが$73,800〜$74,680近辺で取引されている。
マクロ面での圧力にもかかわらず、ビットコインのテクニカル構造はなお興味深い。
50日SMA(デイリー)と200日SMA(デイリー)の間での有効なゴールデンクロスが維持されており、また過去12日間のエリオット波動構造は、強い弱気というよりは修正的に見える。
BTCが$73,500を上回っている限り、さらに強気の再挑戦があると見ている。
重要な$77,280を上抜ければ、$78,370へ向かう道が開け、その後は累積ショート清算レバレッジである$79,800〜$80,700が視野に入る。
トレード設定
最初のTP:$76,990
第2のTP:$78,370
第3のTP:$79,800〜$80,700
損切り:$73,500
重要レベル:$77,280
新たなCMEギャップ:$79,110〜$79,270
ビットコインは先にどのレベルに到達する?
🟢 $79,800
🔴 $73,500
Pejmanzwin
·
--
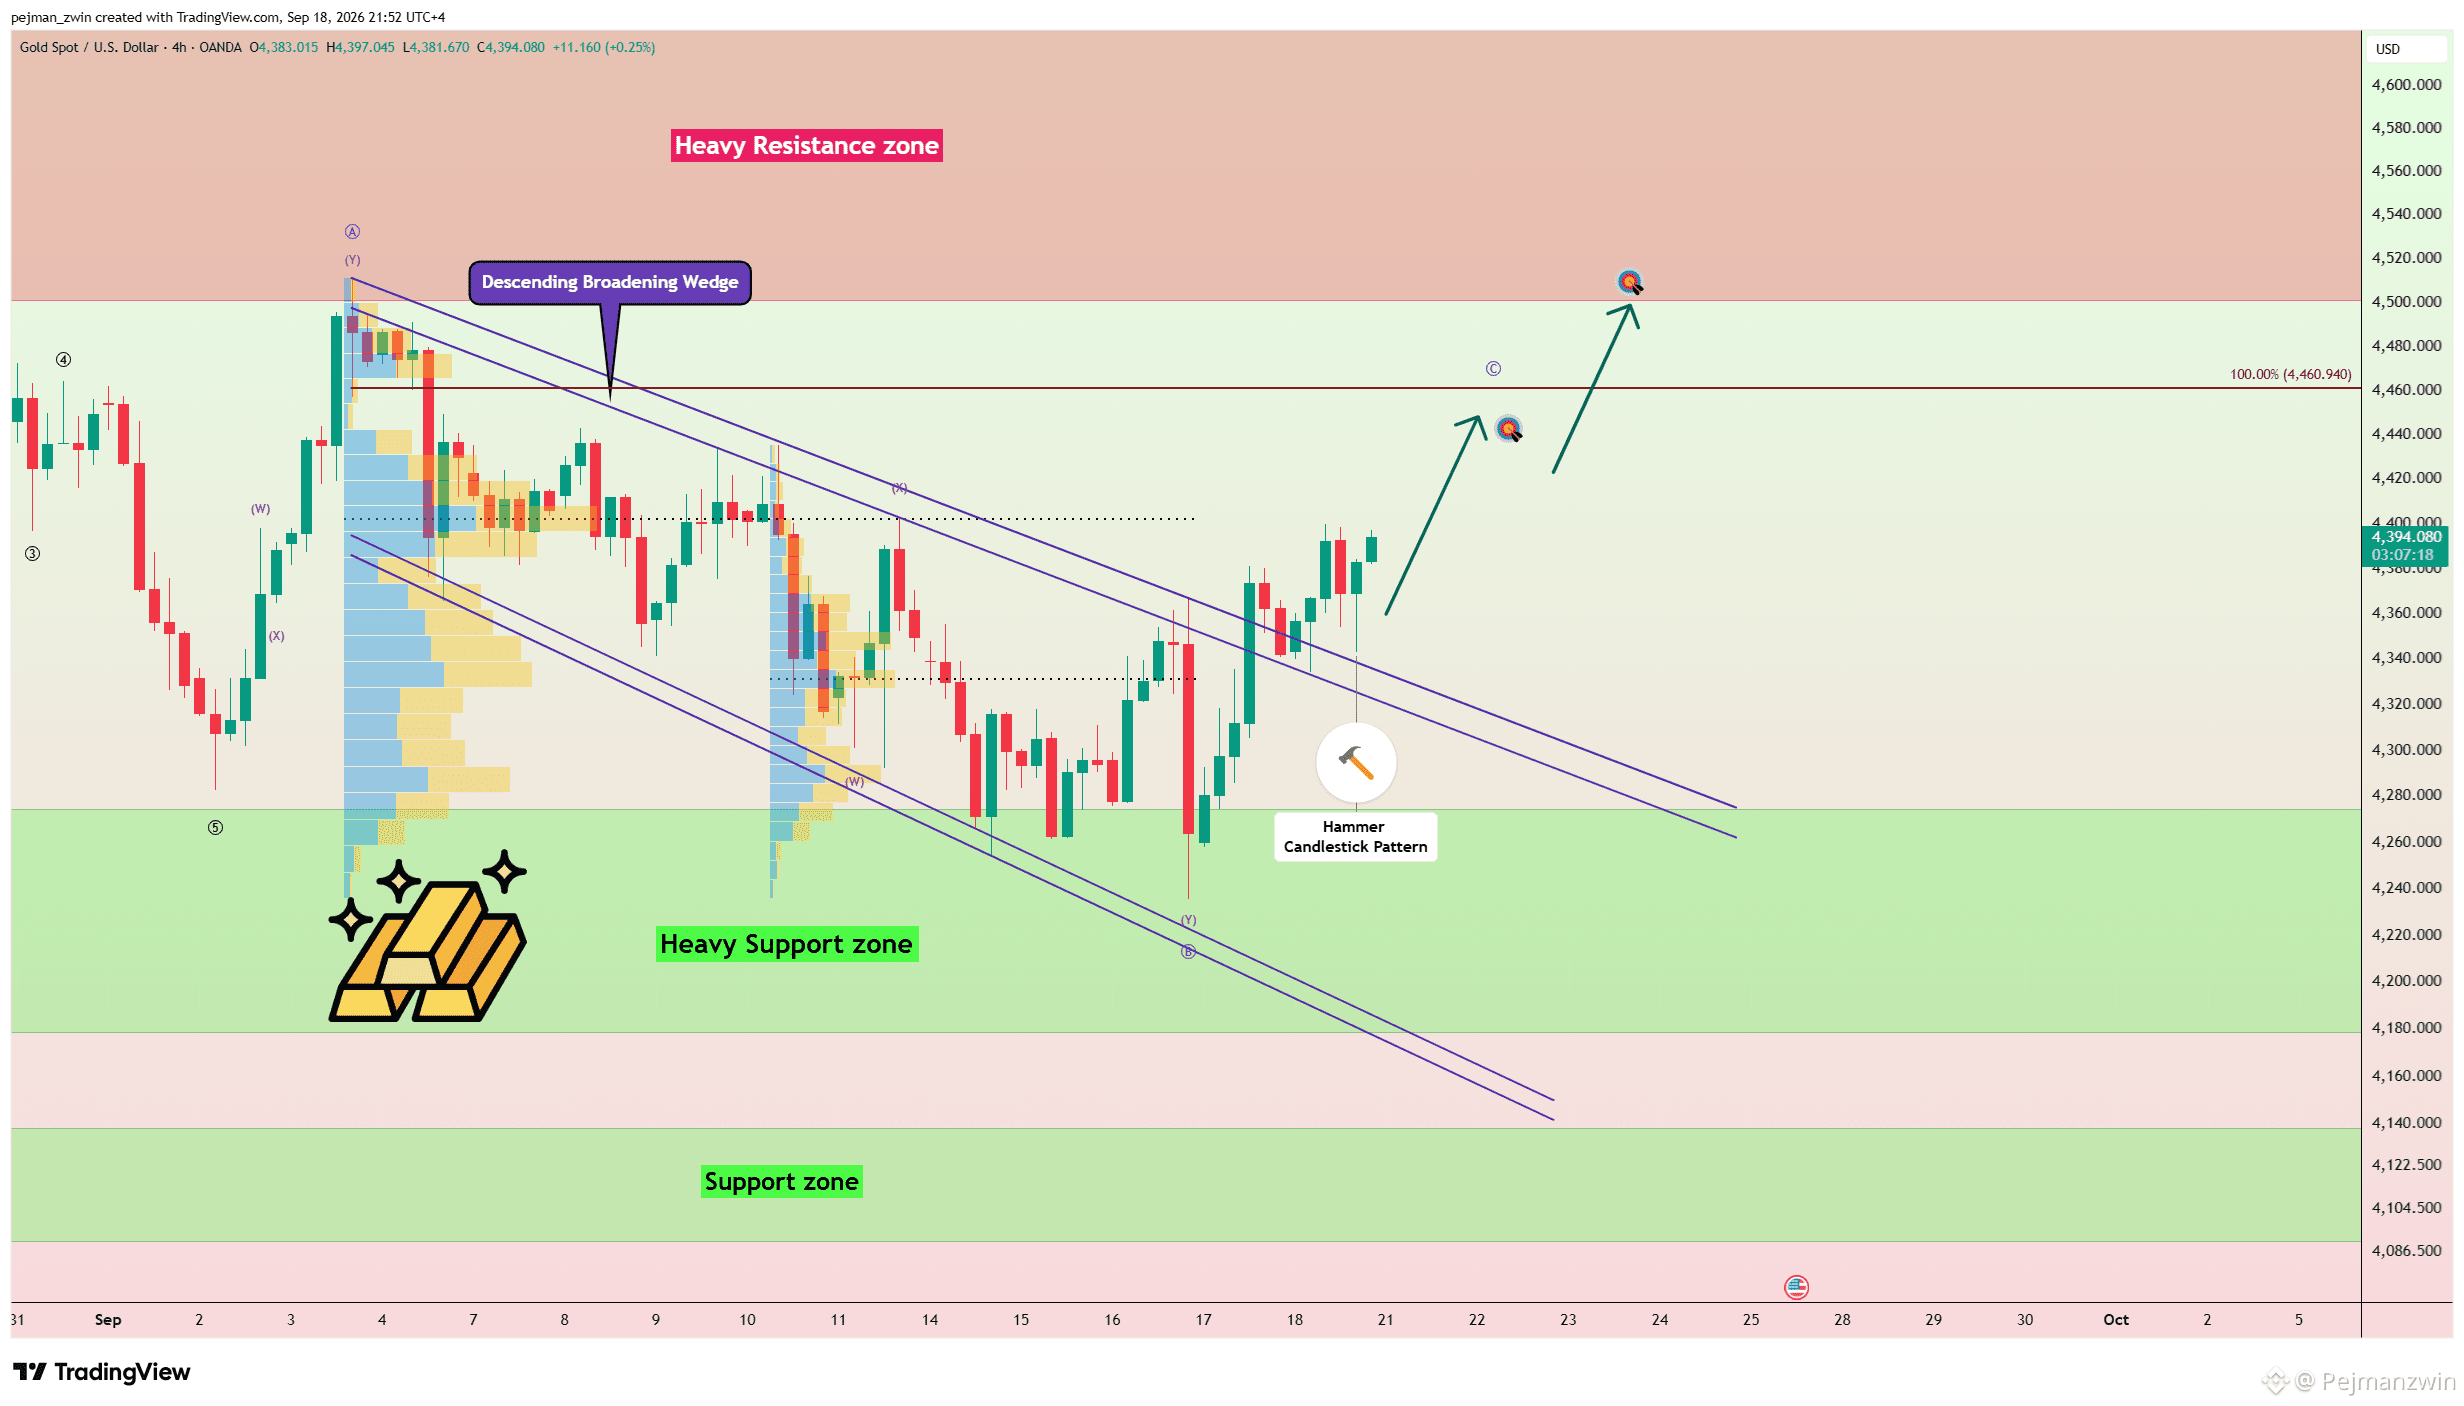
ブリッシュゴールドのブレイクが確定 — 次の崩落ポイントは$4,400?
$XAU は、想定されたシナリオに非常に順調に沿って進んできています。
価格は重要な$4,330の取引水準を上抜けすることに成功し、さらに重要なのは下降するブロードニング・ウェッジの上部トレンドラインを突き抜けた点です。
最初のターゲットはすでに到達しており、現在の強気構造におけるさらなる強さが確認されました。
ここからは重要な$4,400の取引水準に焦点が移ります。
すでにブレイクが確認され、現在の強気モメンタムを踏まえると、2つ目のターゲットに到達する確率は高まっています。
ただし、$4,400は依然として重要なレジスタンス領域です。この水準をきれいにブレイクして上で定着できれば、強気構造はさらに強化され、次の上昇局面への道が開ける可能性があります。
当面は、$4,400が重要な判断ポイントです。
ゴールドは$4,400を上抜けるのか、それともまず売り手がこの水準を守るのか?
#GOLD
$XAU は、想定されたシナリオに非常に順調に沿って進んできています。
価格は重要な$4,330の取引水準を上抜けすることに成功し、さらに重要なのは下降するブロードニング・ウェッジの上部トレンドラインを突き抜けた点です。
最初のターゲットはすでに到達しており、現在の強気構造におけるさらなる強さが確認されました。
ここからは重要な$4,400の取引水準に焦点が移ります。
すでにブレイクが確認され、現在の強気モメンタムを踏まえると、2つ目のターゲットに到達する確率は高まっています。
ただし、$4,400は依然として重要なレジスタンス領域です。この水準をきれいにブレイクして上で定着できれば、強気構造はさらに強化され、次の上昇局面への道が開ける可能性があります。
当面は、$4,400が重要な判断ポイントです。
ゴールドは$4,400を上抜けるのか、それともまず売り手がこの水準を守るのか?
#GOLD
Pejmanzwin
·
--
ブリッシュ$BTC 下落を退けろ——$75Kは$80Kに向けた動きを始められるか?
ビットコインはFRBの利上げ決定とケビン・ウォーシュの発言を受けて急激な値動きに見舞われたが、金やS&P 500とは異なり、BTCはこれまでサポート・ゾーン内に留まることに成功している。
いま、$75,000が重要な攻防の舞台だ。
約10億ドル規模のロングポジションが$74,860前後で清算される可能性がある一方、BTCはまた、累積ロング清算レバレッジが$73,800〜$74,680近辺で取引されている。
マクロ面での圧力にもかかわらず、ビットコインのテクニカル構造はなお興味深い。
50日SMA(デイリー)と200日SMA(デイリー)の間での有効なゴールデンクロスが維持されており、また過去12日間のエリオット波動構造は、強い弱気というよりは修正的に見える。
BTCが$73,500を上回っている限り、さらに強気の再挑戦があると見ている。
重要な$77,280を上抜ければ、$78,370へ向かう道が開け、その後は累積ショート清算レバレッジである$79,800〜$80,700が視野に入る。
トレード設定
最初のTP:$76,990
第2のTP:$78,370
第3のTP:$79,800〜$80,700
損切り:$73,500
重要レベル:$77,280
新たなCMEギャップ:$79,110〜$79,270
ビットコインは先にどのレベルに到達する?
🟢 $79,800
🔴 $73,500
ビットコインはFRBの利上げ決定とケビン・ウォーシュの発言を受けて急激な値動きに見舞われたが、金やS&P 500とは異なり、BTCはこれまでサポート・ゾーン内に留まることに成功している。
いま、$75,000が重要な攻防の舞台だ。
約10億ドル規模のロングポジションが$74,860前後で清算される可能性がある一方、BTCはまた、累積ロング清算レバレッジが$73,800〜$74,680近辺で取引されている。
マクロ面での圧力にもかかわらず、ビットコインのテクニカル構造はなお興味深い。
50日SMA(デイリー)と200日SMA(デイリー)の間での有効なゴールデンクロスが維持されており、また過去12日間のエリオット波動構造は、強い弱気というよりは修正的に見える。
BTCが$73,500を上回っている限り、さらに強気の再挑戦があると見ている。
重要な$77,280を上抜ければ、$78,370へ向かう道が開け、その後は累積ショート清算レバレッジである$79,800〜$80,700が視野に入る。
トレード設定
最初のTP:$76,990
第2のTP:$78,370
第3のTP:$79,800〜$80,700
損切り:$73,500
重要レベル:$77,280
新たなCMEギャップ:$79,110〜$79,270
ビットコインは先にどのレベルに到達する?
🟢 $79,800
🔴 $73,500
ログインして、さらにコンテンツを読む