Gold Has Been Falling for 7 Days — But Buyers Still Look Strong
$XAU has remained in a bearish trend for the past 6–7 days, but the decline has developed with relatively weak momentum.
More importantly, the powerful bullish move completed in less than two days has still not been fully retraced after nearly a week of selling, suggesting that buyers continue to show relative strength.
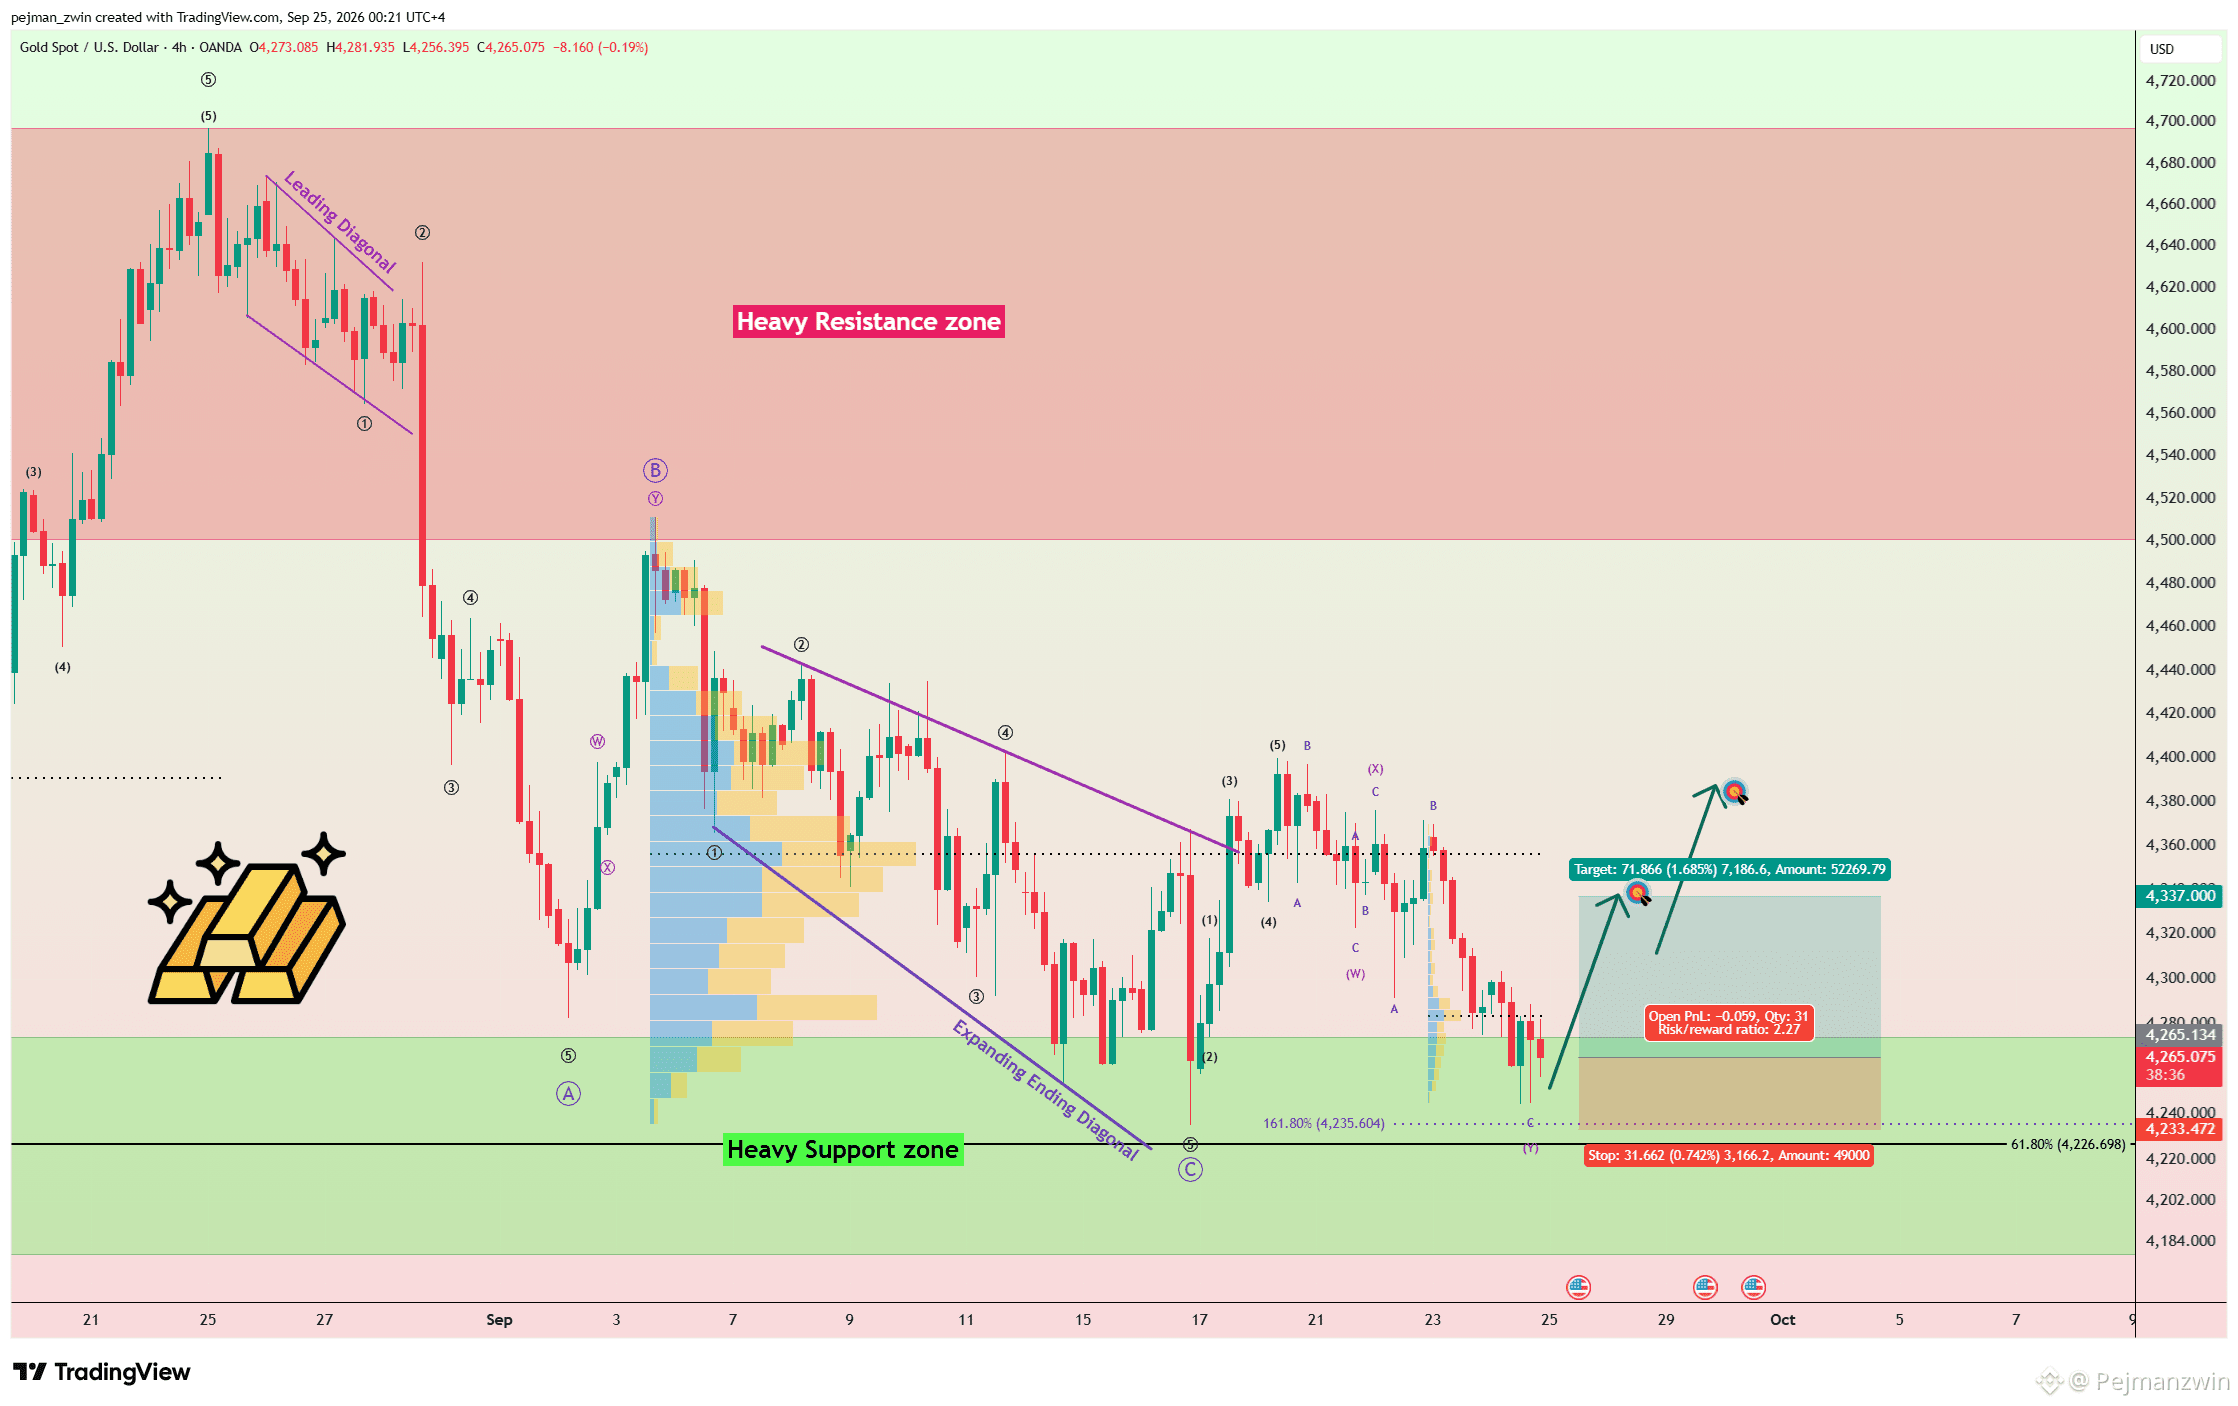
Gold is now trading near the 61.8% Fibonacci retracement on the Daily timeframe and inside the Heavy Support Zone at $4,178–$4,274.
From an Elliott Wave perspective, the 4-hour structure still appears to be completing a Double Three Correction (W-X-Y).
I initially expected this correction to finish earlier, but as long as gold remains above $4,233, the current structure remains valid.
Another supportive factor could come from the U.S. 10-Year Treasury Yield. If US10Y begins to decline from its current resistance structure, lower yields could provide additional support for gold.
For bullish confirmation, I want to see gold break above $4,284.
That could open the way toward $4,337 first.
A confirmed breakout above $4,355 could then extend the recovery toward $4,381 and potentially higher levels.
Trade Setup
First TP: $4,337
Second TP: $4,381
Stop Loss: $4,229
Key Levels: $4,284 | $4,355 | $4,400
Which level will gold reach first?
🟢 $4,381
🔴 $4,229
#GOLD
$XAU has remained in a bearish trend for the past 6–7 days, but the decline has developed with relatively weak momentum.
More importantly, the powerful bullish move completed in less than two days has still not been fully retraced after nearly a week of selling, suggesting that buyers continue to show relative strength.
Gold is now trading near the 61.8% Fibonacci retracement on the Daily timeframe and inside the Heavy Support Zone at $4,178–$4,274.
From an Elliott Wave perspective, the 4-hour structure still appears to be completing a Double Three Correction (W-X-Y).
I initially expected this correction to finish earlier, but as long as gold remains above $4,233, the current structure remains valid.
Another supportive factor could come from the U.S. 10-Year Treasury Yield. If US10Y begins to decline from its current resistance structure, lower yields could provide additional support for gold.
For bullish confirmation, I want to see gold break above $4,284.
That could open the way toward $4,337 first.
A confirmed breakout above $4,355 could then extend the recovery toward $4,381 and potentially higher levels.
Trade Setup
First TP: $4,337
Second TP: $4,381
Stop Loss: $4,229
Key Levels: $4,284 | $4,355 | $4,400
Which level will gold reach first?
🟢 $4,381
🔴 $4,229
#GOLD