

Crypto Trader 343
275 投稿

Crypto Trader 343
報告
ユーザーをブロック
Thanks for Sporting Me. and Follow me For More.....
1 フォロー
25 フォロワー
260 いいね
投稿
記事
翻訳参照
SOL/USD Technical Analysis📊 $SOL /USD Technical Analysis
{spot}(SOLUSDT)
Solana ($SOL ) vs US Dollar — October 28, 2026
1. Current Market Overview
Solana (SOL) is showing short-term bullish momentum, but the price is approaching resistance where a pullback could occur.
Current price: Approximately $102.90
24-hour change: Approximately +1.6% to +3.3%, depending on the data source and timestamp.
Short-term trend: Bullish
Market condition: Potentially overbought on shorter timeframes.
Overall bias: Bullish, but confirmation is needed before entering a trade.
2. Important Support and Resistance Levels
Level Price (USD) Significance
Resistance 3 $112.79 Major upside target
Resistance 2 $106.28 Secondary resistance
Resistance 1 $103.56 Immediate resistance
Current Price $102.90 Current market area
Support 1 $99.13 Immediate support
Support 2 $96.72 Secondary support
Support 3 $91.07 Major support
These levels are based on published daily technical analysis and may change as the market moves.
3. Technical Indicator Analysis
Moving averages: Shorter-term moving averages are generally indicating bullish momentum.
RSI: Some intraday readings are above 70, suggesting overbought conditions and the possibility of a short-term pullback.
MACD: Positive readings on several intraday analyses support the current bullish momentum.
Trend strength: ADX readings above 25 in the cited intraday analysis indicate a relatively strong trend, although ADX alone does not establish direction.
4. Trading Scenarios
🟢 Scenario A: Bullish Trade (BUY)
Entry condition:
Wait for a confirmed breakout above $103.56.
Look for a successful retest of the breakout level.
Potential targets:
TP1: $106.28
TP2: $110.00
TP3: $112.79
Stop-loss idea: Below the confirmed retest low.
Risk: A breakout without strong buying volume could turn into a false breakout.
🔴 Scenario B: Bearish Trade (SELL)
Entry condition:
Watch for rejection near $103.50–$104.00.
Look for a break below $99.13 for stronger bearish confirmation.
Potential targets:
TP1: $96.72
TP2: $94.00
TP3: $91.07
Stop-loss idea: Above the rejection high.
Risk: Strong buying pressure could invalidate the bearish setup.
These are conditional scenarios, not guaranteed price predictions.
5. My Trading Recommendation
Trading Factor Assessment
Short-term direction Bullish
Immediate resistance $103.56
Immediate support $99.13
Buying immediately Risky near resistance
Buying after breakout confirmation Potential opportunity
Selling Wait for bearish confirmation
My preferred approach
I would wait for confirmation rather than enter immediately.
BUY: If SOL breaks above $103.56 and successfully retests the level.
SELL: If SOL fails at resistance and bearish momentum develops.
NO TRADE: If the price continues moving sideways between support and resistance.
The market can move sharply in either direction, so use a stop-loss and avoid excessive leverage.
Note: The analysis uses published market data available on October 28, 2026. Verify the live price and chart before trading.
---
📈 Let me know your trading timeframe
Which timeframe do you trade?
1. 5-minute chart (scalping)
2. 15-minute chart
3. 1-hour chart
4. 4-hour chart
5. Daily chart (long-term)
Tell me your timeframe, and I can provide a more focused SOL/USD entry, stop-loss, and take-profit setup.
#EarningsSeason #solana
SOL/USD Technical Analysis
📊 $SOL /USD Technical Analysis
Solana ($SOL ) vs US Dollar — October 28, 2026
1. Current Market Overview
Solana (SOL) is showing short-term bullish momentum, but the price is approaching resistance where a pullback could occur.
Current price: Approximately $102.90
24-hour change: Approximately +1.6% to +3.3%, depending on the data source and timestamp.
Short-term trend: Bullish
Market condition: Potentially overbought on shorter timeframes.
Overall bias: Bullish, but confirmation is needed before entering a trade.
2. Important Support and Resistance Levels
Level Price (USD) Significance
Resistance 3 $112.79 Major upside target
Resistance 2 $106.28 Secondary resistance
Resistance 1 $103.56 Immediate resistance
Current Price $102.90 Current market area
Support 1 $99.13 Immediate support
Support 2 $96.72 Secondary support
Support 3 $91.07 Major support
These levels are based on published daily technical analysis and may change as the market moves.
3. Technical Indicator Analysis
Moving averages: Shorter-term moving averages are generally indicating bullish momentum.
RSI: Some intraday readings are above 70, suggesting overbought conditions and the possibility of a short-term pullback.
MACD: Positive readings on several intraday analyses support the current bullish momentum.
Trend strength: ADX readings above 25 in the cited intraday analysis indicate a relatively strong trend, although ADX alone does not establish direction.
4. Trading Scenarios
🟢 Scenario A: Bullish Trade (BUY)
Entry condition:
Wait for a confirmed breakout above $103.56.
Look for a successful retest of the breakout level.
Potential targets:
TP1: $106.28
TP2: $110.00
TP3: $112.79
Stop-loss idea: Below the confirmed retest low.
Risk: A breakout without strong buying volume could turn into a false breakout.
🔴 Scenario B: Bearish Trade (SELL)
Entry condition:
Watch for rejection near $103.50–$104.00.
Look for a break below $99.13 for stronger bearish confirmation.
Potential targets:
TP1: $96.72
TP2: $94.00
TP3: $91.07
Stop-loss idea: Above the rejection high.
Risk: Strong buying pressure could invalidate the bearish setup.
These are conditional scenarios, not guaranteed price predictions.
5. My Trading Recommendation
Trading Factor Assessment
Short-term direction Bullish
Immediate resistance $103.56
Immediate support $99.13
Buying immediately Risky near resistance
Buying after breakout confirmation Potential opportunity
Selling Wait for bearish confirmation
My preferred approach
I would wait for confirmation rather than enter immediately.
BUY: If SOL breaks above $103.56 and successfully retests the level.
SELL: If SOL fails at resistance and bearish momentum develops.
NO TRADE: If the price continues moving sideways between support and resistance.
The market can move sharply in either direction, so use a stop-loss and avoid excessive leverage.
Note: The analysis uses published market data available on October 28, 2026. Verify the live price and chart before trading.
---
📈 Let me know your trading timeframe
Which timeframe do you trade?
1. 5-minute chart (scalping)
2. 15-minute chart
3. 1-hour chart
4. 4-hour chart
5. Daily chart (long-term)
Tell me your timeframe, and I can provide a more focused SOL/USD entry, stop-loss, and take-profit setup.
#EarningsSeason #solana
27
記事
SOL/USD テクニカル分析📊 $SOL /USD テクニカル分析
ソラナ(SOL)対米ドル — 2026年10月28日
1. 現在の市場概況
ソラナ($SOL )は短期的に強気の勢いを見せていますが、価格は反落する可能性のあるレジスタンスに近づいています。
現在価格:約102.90ドル
24時間変動率:データソースやタイムスタンプによって異なりますが、約+1.6%~+3.3%。
短期トレンド:強気
市場状況:短期時間軸では買われすぎの可能性があります。
全体的な見方:強気ですが、取引に入る前に確認が必要です。
SOL/USD テクニカル分析
📊 $SOL /USD テクニカル分析
ソラナ(SOL)対米ドル — 2026年10月28日
1. 現在の市場概況
ソラナ($SOL )は短期的に強気の勢いを見せていますが、価格は反落する可能性のあるレジスタンスに近づいています。
現在価格:約102.90ドル
24時間変動率:データソースやタイムスタンプによって異なりますが、約+1.6%~+3.3%。
短期トレンド:強気
市場状況:短期時間軸では買われすぎの可能性があります。
全体的な見方:強気ですが、取引に入る前に確認が必要です。
ソラナ(SOL)対米ドル — 2026年10月28日
1. 現在の市場概況
ソラナ($SOL )は短期的に強気の勢いを見せていますが、価格は反落する可能性のあるレジスタンスに近づいています。
現在価格:約102.90ドル
24時間変動率:データソースやタイムスタンプによって異なりますが、約+1.6%~+3.3%。
短期トレンド:強気
市場状況:短期時間軸では買われすぎの可能性があります。
全体的な見方:強気ですが、取引に入る前に確認が必要です。
36

記事
LTC/USD分析 — 2026年10月27日📊 $LTC /USD分析 — 2026年10月27日
現在の市場バイアス:弱気 📉
ライトコイン(LTC/USD)は56.20~56.50ドル付近で取引されています。直近の値動きには売り圧力が見られ、買い手が近くのレジスタンス水準を回復しない限り、テクニカル指標はさらなる下落を示唆しています。
ライトコイン
1. 現在の市場概況
指標 現在の数値
LTC/USD価格 56.20~56.50ドル
24時間高値 57.11~57.15ドル
24時間安値 55.92~56.01ドル
市場トレンド 弱気
RSI(14) 約36~46(情報源により異なる)
MACD 弱気
LTC/USD分析 — 2026年10月27日
📊 $LTC /USD分析 — 2026年10月27日
現在の市場バイアス:弱気 📉
ライトコイン(LTC/USD)は56.20~56.50ドル付近で取引されています。直近の値動きには売り圧力が見られ、買い手が近くのレジスタンス水準を回復しない限り、テクニカル指標はさらなる下落を示唆しています。
ライトコイン
1. 現在の市場概況
指標 現在の数値
LTC/USD価格 56.20~56.50ドル
24時間高値 57.11~57.15ドル
24時間安値 55.92~56.01ドル
市場トレンド 弱気
RSI(14) 約36~46(情報源により異なる)
MACD 弱気
現在の市場バイアス:弱気 📉
ライトコイン(LTC/USD)は56.20~56.50ドル付近で取引されています。直近の値動きには売り圧力が見られ、買い手が近くのレジスタンス水準を回復しない限り、テクニカル指標はさらなる下落を示唆しています。
ライトコイン
1. 現在の市場概況
指標 現在の数値
LTC/USD価格 56.20~56.50ドル
24時間高値 57.11~57.15ドル
24時間安値 55.92~56.01ドル
市場トレンド 弱気
RSI(14) 約36~46(情報源により異なる)
MACD 弱気
92
📊 $BTC /USD テクニカル分析 — 2026年10月27日
{future}(BTCUSDT)
最新の入手可能な市場データによると、ビットコイン(BTC/USD)は79,800~80,000ドル付近で取引されています。短期トレンドは弱含みですが、日足と週足では上昇の可能性が見られます。市場の見通しはまちまちなため、取引に入る前に確認することが重要です。
1. 現在の市場概況
指標 分析
$BTC /USD 価格 約79,800~80,000ドル
短期トレンド 弱気
日足トレンド まちまち/上昇の可能性
週足トレンド 強気寄り
直近のサポート 79,400ドル
より強いサポート 78,100ドル
直近のレジスタンス 81,200ドル
主要レジスタンス 82,600ドル
市場の状態 もみ合い
これらの水準は概算であり、最新の入手可能なテクニカル指標に基づいています。
2. 重要なサポートとレジスタンス
🟢 サポート水準
BTC/USDが下落した場合は、以下の水準に注目してください。
79,400ドル:直近のサポート。
78,100ドル:次の重要なサポート。
77,800ドル:さらに下値の目安。
75,000ドル:売り圧力が強まった場合の下位サポートゾーン。
79,400ドルを下抜けると、78,100ドルに向けて下落する可能性が高まります。この水準も下抜けた場合、さらに下のサポートゾーンが視野に入る可能性があります。
🔴 レジスタンス水準
BTC/USDが上昇した場合は、以下の水準に注目してください。
80,800ドル:短期的なレジスタンスゾーン。
81,200ドル:重要なブレイクアウト水準。
82,600ドル:次の主要レジスタンス。
84,500ドル:上位のレジスタンスゾーン。
81,200ドルを上回る水準を維持できれば、特に取引量の増加を伴う場合、強気の見通しが改善する可能性があります。
---
3. BTC/USDの取引シナリオ
🟢 シナリオA:買いセットアップ
ビットコインが上昇を確認できる動きを示した場合、ロングの候補を検討してください。
条件:
BTCが81,200ドルを上抜ける。
15分足または1時間足のローソク足がレジスタンスを上回って確定する。
価格がブレイクアウト水準を再テストし、その水準を維持する。
取引プランの例:
項目 水準
エントリー 確認後、81,250~81,500ドル
損切り 80,700ドル
目標1 82,000ドル
目標2 82,600ドル
目標3 84,000ドル
これらは仮定上の水準であり、リアルタイムの取引シグナルではありません。価格が上昇したというだけで買うのではなく、価格の動きを確認してから判断してください。
#BinancePick #EarningsSeason
📊 $BTC /USD テクニカル分析 — 2026年10月27日
最新の入手可能な市場データによると、ビットコイン(BTC/USD)は79,800~80,000ドル付近で取引されています。短期トレンドは弱含みですが、日足と週足では上昇の可能性が見られます。市場の見通しはまちまちなため、取引に入る前に確認することが重要です。
1. 現在の市場概況
指標 分析
$BTC /USD 価格 約79,800~80,000ドル
短期トレンド 弱気
日足トレンド まちまち/上昇の可能性
週足トレンド 強気寄り
直近のサポート 79,400ドル
より強いサポート 78,100ドル
直近のレジスタンス 81,200ドル
主要レジスタンス 82,600ドル
市場の状態 もみ合い
これらの水準は概算であり、最新の入手可能なテクニカル指標に基づいています。
2. 重要なサポートとレジスタンス
🟢 サポート水準
BTC/USDが下落した場合は、以下の水準に注目してください。
79,400ドル:直近のサポート。
78,100ドル:次の重要なサポート。
77,800ドル:さらに下値の目安。
75,000ドル:売り圧力が強まった場合の下位サポートゾーン。
79,400ドルを下抜けると、78,100ドルに向けて下落する可能性が高まります。この水準も下抜けた場合、さらに下のサポートゾーンが視野に入る可能性があります。
🔴 レジスタンス水準
BTC/USDが上昇した場合は、以下の水準に注目してください。
80,800ドル:短期的なレジスタンスゾーン。
81,200ドル:重要なブレイクアウト水準。
82,600ドル:次の主要レジスタンス。
84,500ドル:上位のレジスタンスゾーン。
81,200ドルを上回る水準を維持できれば、特に取引量の増加を伴う場合、強気の見通しが改善する可能性があります。
---
3. BTC/USDの取引シナリオ
🟢 シナリオA:買いセットアップ
ビットコインが上昇を確認できる動きを示した場合、ロングの候補を検討してください。
条件:
BTCが81,200ドルを上抜ける。
15分足または1時間足のローソク足がレジスタンスを上回って確定する。
価格がブレイクアウト水準を再テストし、その水準を維持する。
取引プランの例:
項目 水準
エントリー 確認後、81,250~81,500ドル
損切り 80,700ドル
目標1 82,000ドル
目標2 82,600ドル
目標3 84,000ドル
これらは仮定上の水準であり、リアルタイムの取引シグナルではありません。価格が上昇したというだけで買うのではなく、価格の動きを確認してから判断してください。
#BinancePick #EarningsSeason
69
翻訳参照
📊 $BTC /USDT Technical Analysis — October 26, 2026
{future}(BTCUSDT)
Bitcoin (BTC/USDT) technical analysis for short-term trading.
Important: I don't have a verified live BTC/USDT price feed in this chat. The price levels below are illustrative levels from the previous analysis, not confirmed current market prices. Please verify them on your exchange before trading.
1. Key Support and Resistance Levels
LevelPrice (USDT)SignificanceResistance 3$84,000Major resistanceResistance 2$82,500Secondary resistanceResistance 1$81,000Short-term breakout levelMarket Zone$80,000Potential decision areaSupport 1$79,000Immediate supportSupport 2$78,000Potential downside targetSupport 3$76,000Major support zone
2. 🔴 SHORT Scenario
A short setup could develop if Bitcoin breaks below $79,000 and confirms the breakdown.
Potential trade setup:
Entry: Below $79,000 after confirmation and a successful retest
Take Profit 1: $78,000
Take Profit 2: $77,000
Take Profit 3: $76,000–$76,500
Stop Loss: Above the relevant resistance or retest high
Confirmation signals:
A 15-minute or 1-hour candle closes below support.
Selling volume increases.
The price retests $79,000 and fails to reclaim it.
Avoid entering immediately after a sudden price drop without confirmation.
3. 🟢 LONG Scenario
A potential long setup could develop if Bitcoin breaks above $81,000 and successfully retests that level as support.
Potential trade setup:
Entry: Above $81,000 after a confirmed breakout and retest
Take Profit 1: $82,000
Take Profit 2: $82,500
Take Profit 3: $84,000
Stop Loss: Below the retest low or relevant support
Confirmation signals:
A 1-hour candle closes above resistance.
Buying volume increases.
The price holds above $81,000 after the breakout.
A brief wick above resistance is not sufficient confirmation of a breakout.
4. 📈 Trading Strategy
BTC/USDT ConditionPossible ActionPrice breaks below $79,000Look for a SHORT setupPrice remains between $79,000 and $81,000Wait for confirmationPrice breaks above $81,000Look for a LONG setupPrice shows a false
📊 $BTC /USDT Technical Analysis — October 26, 2026
Bitcoin (BTC/USDT) technical analysis for short-term trading.
Important: I don't have a verified live BTC/USDT price feed in this chat. The price levels below are illustrative levels from the previous analysis, not confirmed current market prices. Please verify them on your exchange before trading.
1. Key Support and Resistance Levels
LevelPrice (USDT)SignificanceResistance 3$84,000Major resistanceResistance 2$82,500Secondary resistanceResistance 1$81,000Short-term breakout levelMarket Zone$80,000Potential decision areaSupport 1$79,000Immediate supportSupport 2$78,000Potential downside targetSupport 3$76,000Major support zone
2. 🔴 SHORT Scenario
A short setup could develop if Bitcoin breaks below $79,000 and confirms the breakdown.
Potential trade setup:
Entry: Below $79,000 after confirmation and a successful retest
Take Profit 1: $78,000
Take Profit 2: $77,000
Take Profit 3: $76,000–$76,500
Stop Loss: Above the relevant resistance or retest high
Confirmation signals:
A 15-minute or 1-hour candle closes below support.
Selling volume increases.
The price retests $79,000 and fails to reclaim it.
Avoid entering immediately after a sudden price drop without confirmation.
3. 🟢 LONG Scenario
A potential long setup could develop if Bitcoin breaks above $81,000 and successfully retests that level as support.
Potential trade setup:
Entry: Above $81,000 after a confirmed breakout and retest
Take Profit 1: $82,000
Take Profit 2: $82,500
Take Profit 3: $84,000
Stop Loss: Below the retest low or relevant support
Confirmation signals:
A 1-hour candle closes above resistance.
Buying volume increases.
The price holds above $81,000 after the breakout.
A brief wick above resistance is not sufficient confirmation of a breakout.
4. 📈 Trading Strategy
BTC/USDT ConditionPossible ActionPrice breaks below $79,000Look for a SHORT setupPrice remains between $79,000 and $81,000Wait for confirmationPrice breaks above $81,000Look for a LONG setupPrice shows a false
74
·
--
ブリッシュ
翻訳参照
سونے کی قیمت میں آج پھر بڑی کمی ریکارڈ
فی تولہ سونے کی قیمت 12 ہزار 489 روپے کم ہونے کے بعد 4 لاکھ 55 ہزار 327 روپے ہو گئی ، 10 گرام سونا 11 ہزار 240 روپےسستا
#GOLD #GOLD_UPDATE
سونے کی قیمت میں آج پھر بڑی کمی ریکارڈ
فی تولہ سونے کی قیمت 12 ہزار 489 روپے کم ہونے کے بعد 4 لاکھ 55 ہزار 327 روپے ہو گئی ، 10 گرام سونا 11 ہزار 240 روپےسستا
#GOLD #GOLD_UPDATE
فی تولہ سونے کی قیمت 12 ہزار 489 روپے کم ہونے کے بعد 4 لاکھ 55 ہزار 327 روپے ہو گئی ، 10 گرام سونا 11 ہزار 240 روپےسستا
#GOLD #GOLD_UPDATE

166
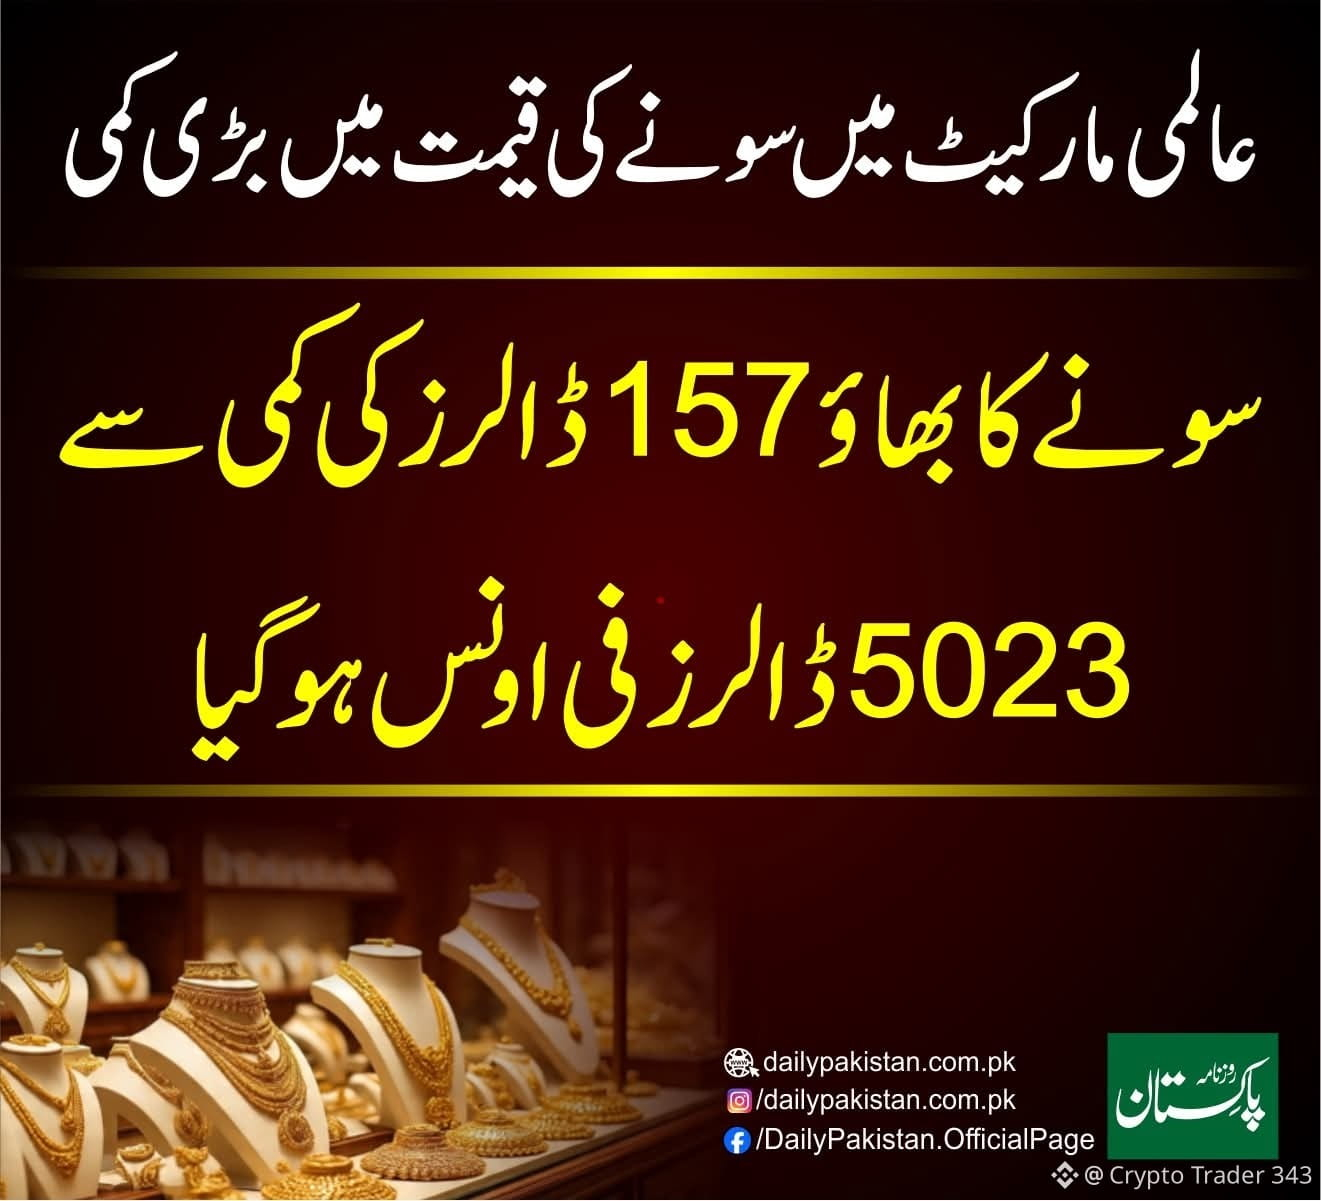
パキスタンにおける金の価格が再び下落
2026年3月6日にパキスタンで金の価格が再び下落したことが記録され、これは世界市場での下落傾向に沿ったものです。
オールパキスタン宝石商協会によると、金の1トラロイオンスあたりの価格が3,400パキスタン・ルピー下落し、新しい価格は533,762パキスタン・ルピーとなりました。
同様に、10グラムの金も2,915パキスタン・ルピー安くなり、457,614パキスタン・ルピーで販売されました。その前の木曜日には、1トラロイオンスの金が537,162パキスタン・ルピーに達し、その日は2,800パキスタン・ルピーの下落がありました。
世界市場でも金の価格は34ドル下がり、5,110ドル1オンスになりましたが、20ドルのプレミアムも含まれています。
一方、銀の価格はわずかに上昇し、1トラロイオンスあたり104パキスタン・ルピー高くなり、8,914パキスタン・ルピーに達しました。
#GOLD #GOLD_UPDATE #GoldenOpportunity

3
194


国際市場での価格の低下に伴い、パキスタンでも金が安くなりました
3400ルピーの低下により、1トラロイオンスの価格は533,762ルピーになり、10グラムの金は2915ルピー安くなりました
#GOLD #GOLD_UPDATE
国際市場での価格の低下に伴い、パキスタンでも金が安くなりました
3400ルピーの低下により、1トラロイオンスの価格は533,762ルピーになり、10グラムの金は2915ルピー安くなりました
#GOLD #GOLD_UPDATE
3400ルピーの低下により、1トラロイオンスの価格は533,762ルピーになり、10グラムの金は2915ルピー安くなりました
#GOLD #GOLD_UPDATE

8



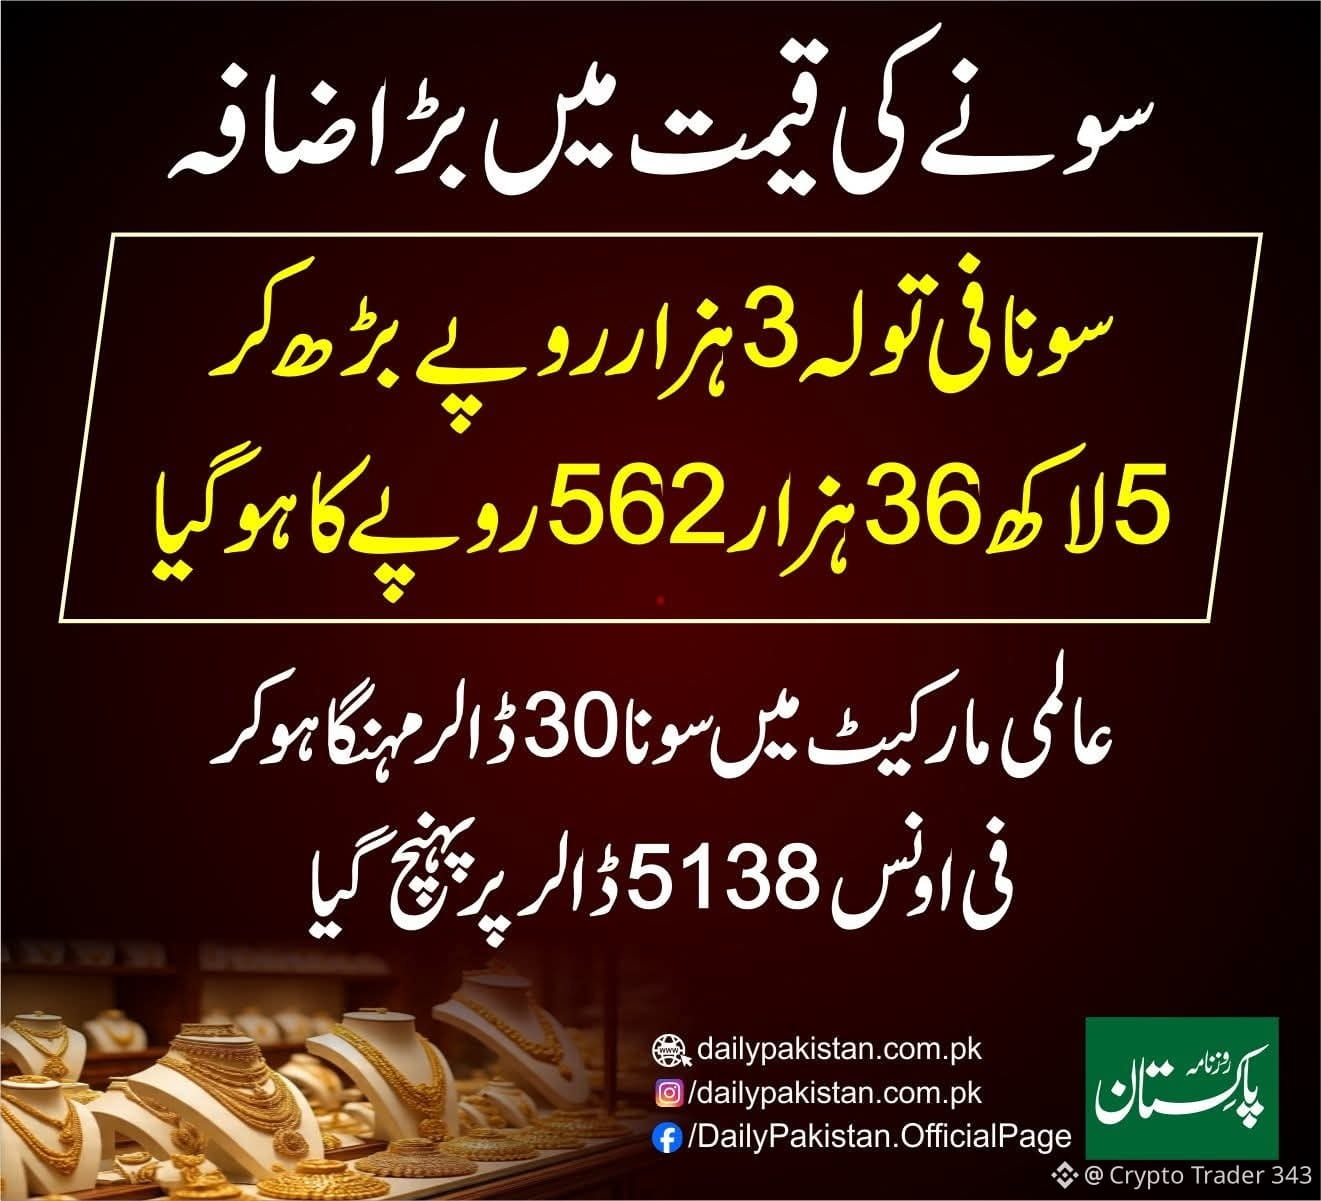
金の価格が大幅に上昇
金は1トラロイオンスあたり3千ルピー上昇し、5万3千562ルピーになりました
国際市場で金は30ドル高騰し、1オンスあたり5138ドルに達しました
#GOLD #GoldRate #GOLD_UPDATE
金の価格が大幅に上昇
金は1トラロイオンスあたり3千ルピー上昇し、5万3千562ルピーになりました
国際市場で金は30ドル高騰し、1オンスあたり5138ドルに達しました
#GOLD #GoldRate #GOLD_UPDATE
金は1トラロイオンスあたり3千ルピー上昇し、5万3千562ルピーになりました
国際市場で金は30ドル高騰し、1オンスあたり5138ドルに達しました
#GOLD #GoldRate #GOLD_UPDATE
2
212
📌 土曜日に金の価格が上昇 — 一日で7,100ルピー増加
パキスタンで金の価格が上昇しています。土曜日には、1トラロイオンスの金が7,100ルピーの増加で5,33,562ルピーに達しました。
同様に、10グラムの金の価格も6,087ルピー増加し4,57,443ルピーになりました。
前日にも金の価格が2,500ルピー増加し、その後1トラロイオンスの価格は5,26,462ルピーに達しました。
国際市場でも金の価格が71ドルの増加で5,108ドル1オンスになり、その中には20ドルのプレミアムが含まれています。世界的な経済の不確実性が金の価格上昇の大きな理由とされています。
銀の価格も顕著に上昇し、1トラロイオンスの銀は374ルピー増加して8,948ルピーに達しました。
国際市場の上昇傾向が地元の市場にも影響を及ぼしており、価格の変動が続いています。
#GoldPrice #GOLD_UPDATE
#GoldRatePakistan #GOLD
#SilverPrice

3
225


サウナ 7000 ハザー ルピー フィ トララ メンガ
最近の追加によりフィトララの価格は5 ラク 26 ハザー 962 ルピーになり、10 グラムの金の値段は6100 ルピーの増加です
#GOLD #GOLD_UPDATE
サウナ 7000 ハザー ルピー フィ トララ メンガ
最近の追加によりフィトララの価格は5 ラク 26 ハザー 962 ルピーになり、10 グラムの金の値段は6100 ルピーの増加です
#GOLD #GOLD_UPDATE
最近の追加によりフィトララの価格は5 ラク 26 ハザー 962 ルピーになり、10 グラムの金の値段は6100 ルピーの増加です
#GOLD #GOLD_UPDATE

3
856

ログインして、さらにコンテンツを読む
厳選トピックで世界の暗号資産トレーダーの仲間入り
⚡️ 暗号資産に関する最新かつ有益な情報が見つかります。
💬 世界最大の暗号資産取引所から信頼されています。
👍 認証を受けたクリエイターから、有益なインサイトを得られます。
メール / 電話番号