

حسينہ
23 投稿

حسينہ
報告
ユーザーをブロック
No Enjoyment Like Reading 📚
取引を発注
高頻度トレーダー
1.1年
3 フォロー
52 フォロワー
109 いいね
投稿
ポートフォリオ
·
--
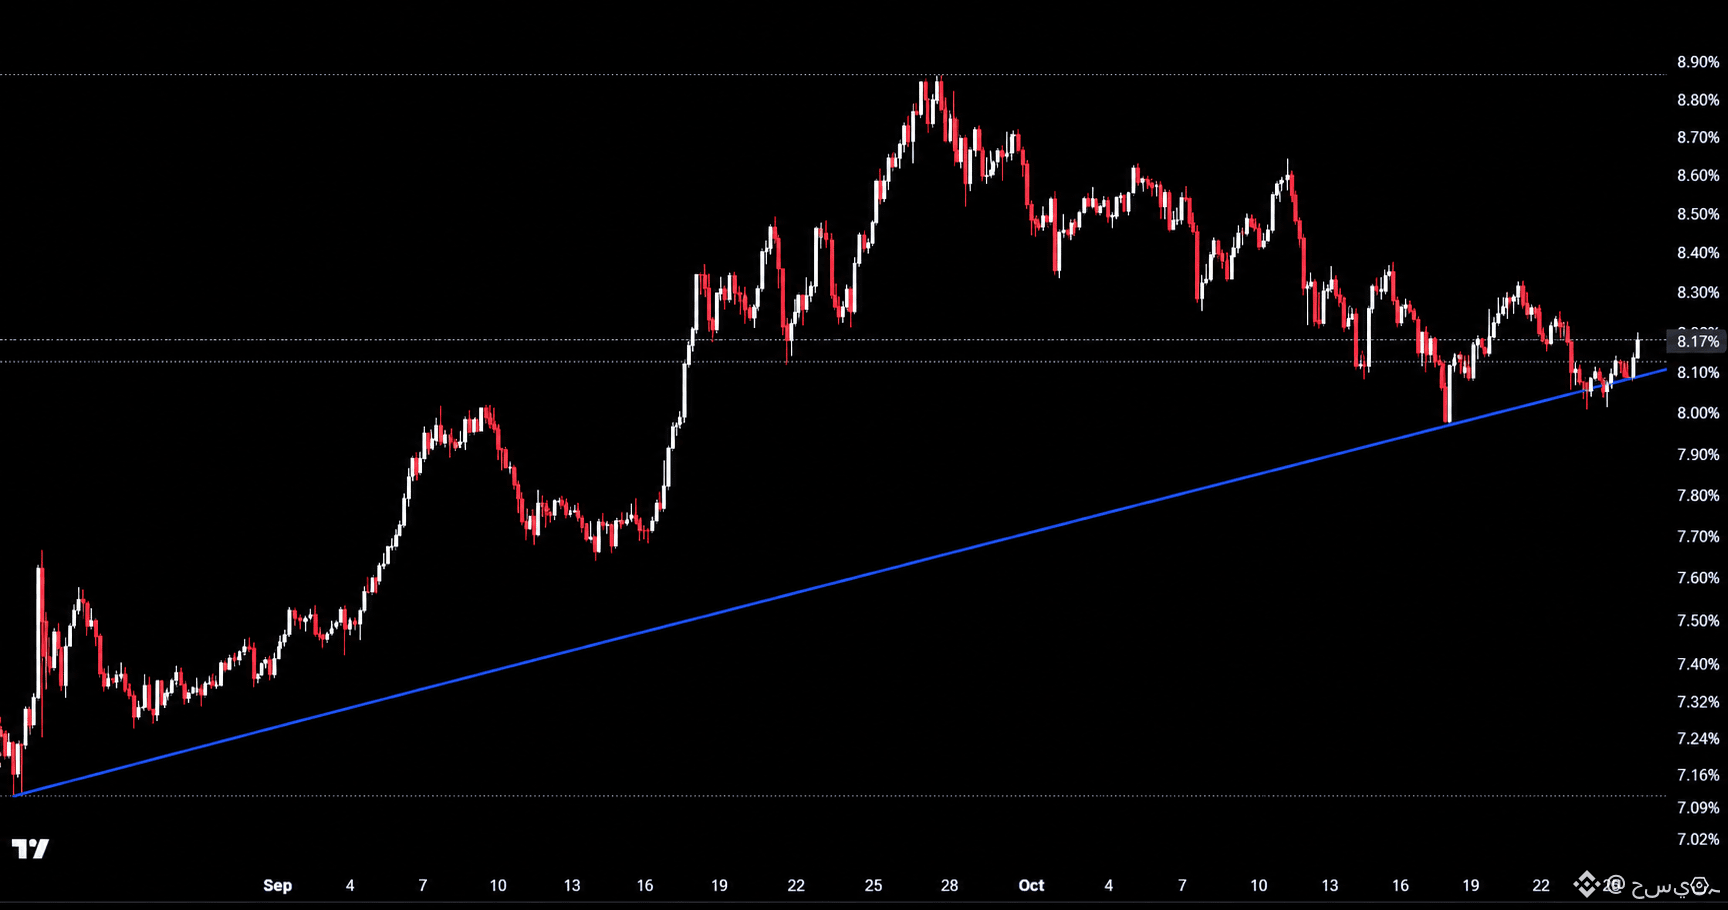
$アルトコインのドミナンス(上位10銘柄を除く)は8.17%。8月から続く上昇トレンドライン(約8.08%)を再び試した後、反発しています。この水準を維持する限り、アルトコインに有利な構造が続きます。
このトレンドラインを維持すれば、ドミナンスは8.30%〜8.60%に向けて上昇し、アルトコインはビットコインに対して優位に立ちます。下抜ければ7.80%〜7.70%に下落し、アルトコインへの資金シフトは停滞します。#Altcoins
$アルトコインのドミナンス(上位10銘柄を除く)は8.17%。8月から続く上昇トレンドライン(約8.08%)を再び試した後、反発しています。この水準を維持する限り、アルトコインに有利な構造が続きます。
このトレンドラインを維持すれば、ドミナンスは8.30%〜8.60%に向けて上昇し、アルトコインはビットコインに対して優位に立ちます。下抜ければ7.80%〜7.70%に下落し、アルトコインへの資金シフトは停滞します。#Altcoins
このトレンドラインを維持すれば、ドミナンスは8.30%〜8.60%に向けて上昇し、アルトコインはビットコインに対して優位に立ちます。下抜ければ7.80%〜7.70%に下落し、アルトコインへの資金シフトは停滞します。#Altcoins
2
44
·
--
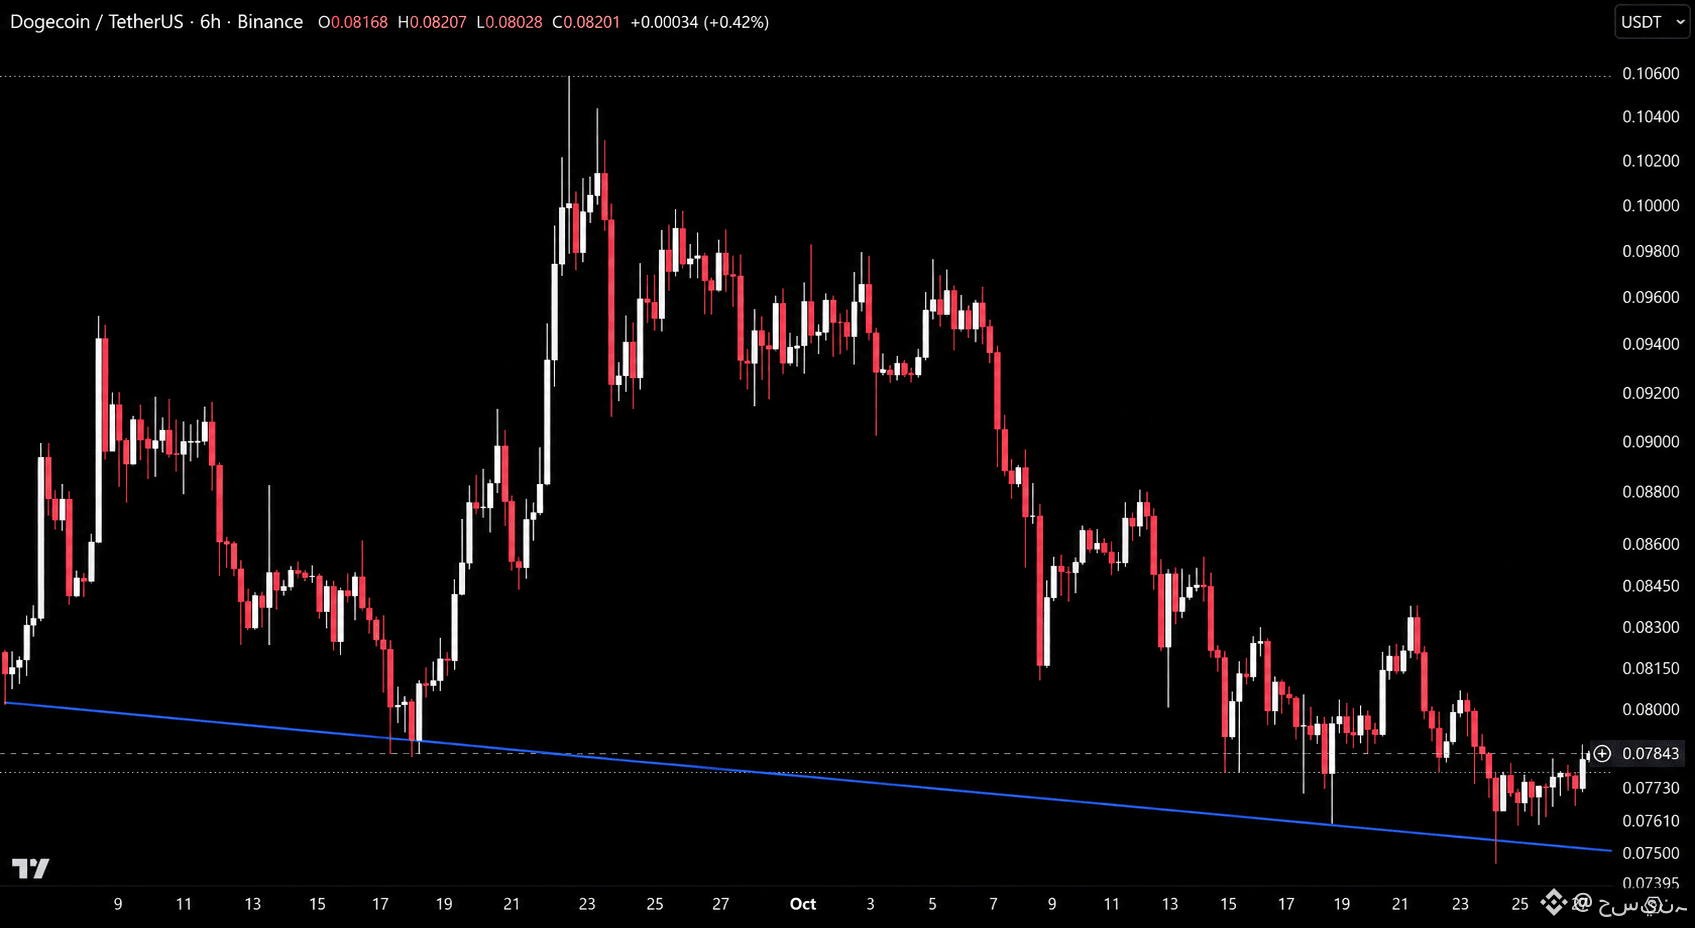
$DOGE は0.07943で取引されており、9月初旬から続く下降サポートライン(0.07520付近)で反発しています。これは、長い下ヒゲを付けた後、0.10600付近の高値から下落した動きです。
このサポートを維持できれば、0.08000〜0.08300に向けて反発する可能性があります。ここを割り込むとサポートラインが崩れ、0.07400に向かう展開が見込まれます。 #DOGE
{future}(DOGEUSDT)
$DOGE は0.07943で取引されており、9月初旬から続く下降サポートライン(0.07520付近)で反発しています。これは、長い下ヒゲを付けた後、0.10600付近の高値から下落した動きです。
このサポートを維持できれば、0.08000〜0.08300に向けて反発する可能性があります。ここを割り込むとサポートラインが崩れ、0.07400に向かう展開が見込まれます。 #DOGE
このサポートを維持できれば、0.08000〜0.08300に向けて反発する可能性があります。ここを割り込むとサポートラインが崩れ、0.07400に向かう展開が見込まれます。 #DOGE
2
272
·
--
$SUI
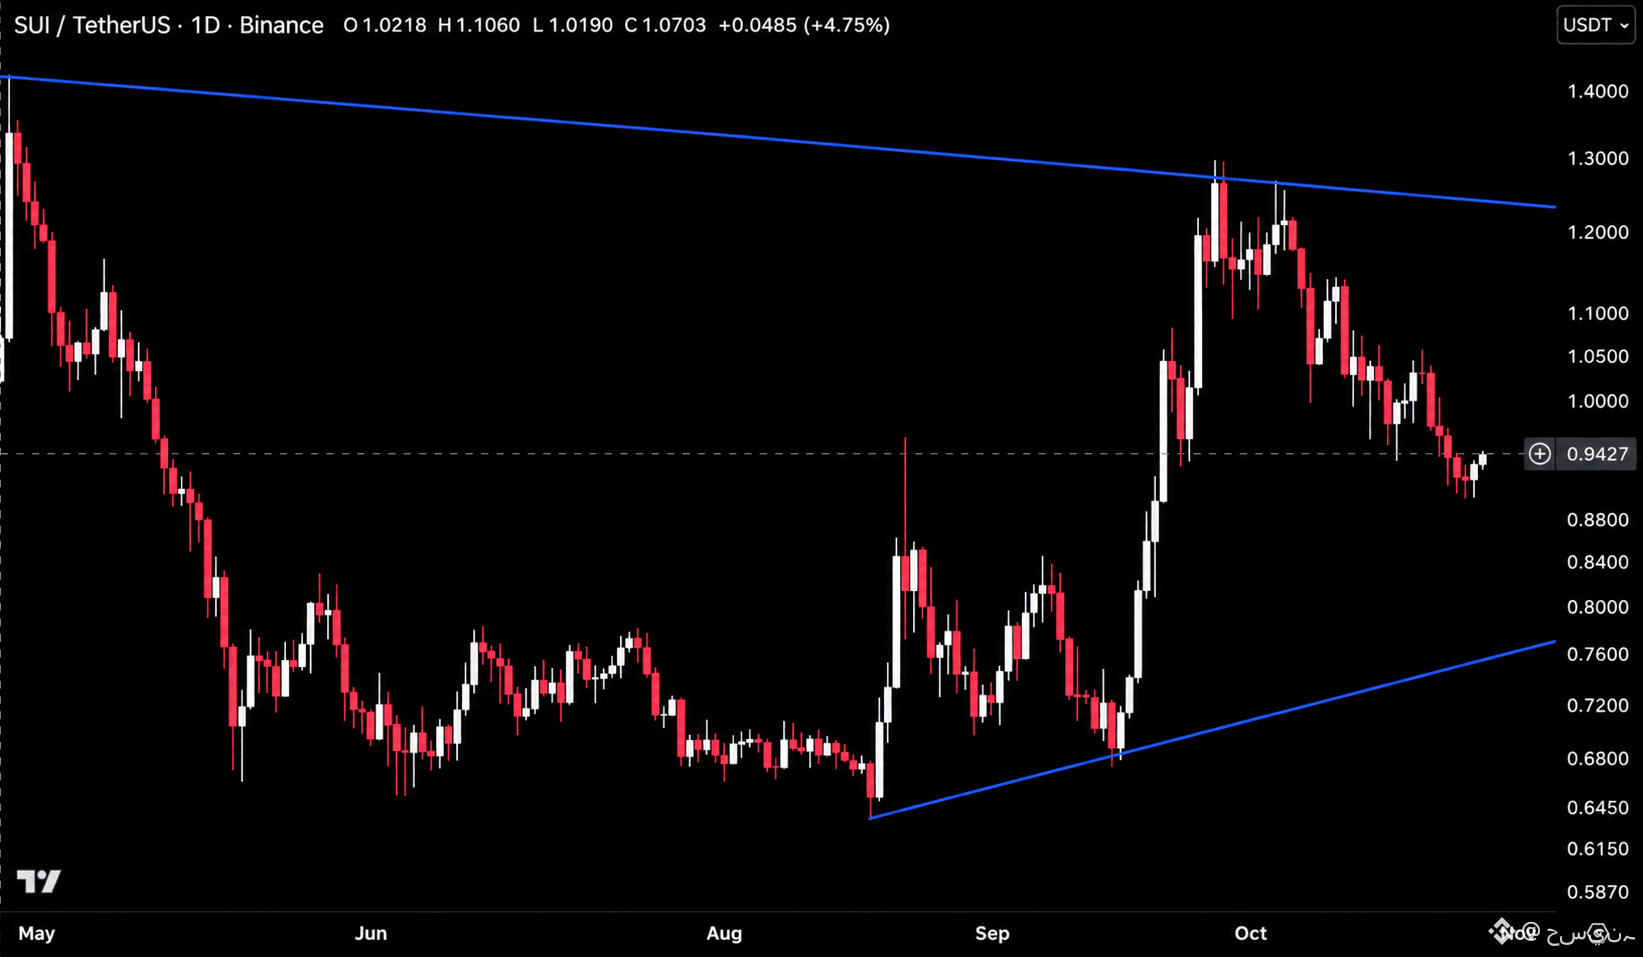
高値圏の1.3000付近から下落した後、日足チャートでは対称三角形の中で0.9000のゾーンから反発し、現在0.9427で取引されています。下降レジスタンスは1.2300付近、上昇サポートは0.7700付近にあります。
0.9000を維持すれば、1.0000〜1.0500に向けて反発する展開が見込まれます。ここを下抜けると、まず0.8800〜0.8400がサポートとなり、その後は0.7700付近の上昇トレンドラインに向かって下落する可能性があります。 #SUI
{future}(SUIUSDT)
$SUI
高値圏の1.3000付近から下落した後、日足チャートでは対称三角形の中で0.9000のゾーンから反発し、現在0.9427で取引されています。下降レジスタンスは1.2300付近、上昇サポートは0.7700付近にあります。
0.9000を維持すれば、1.0000〜1.0500に向けて反発する展開が見込まれます。ここを下抜けると、まず0.8800〜0.8400がサポートとなり、その後は0.7700付近の上昇トレンドラインに向かって下落する可能性があります。 #SUI
高値圏の1.3000付近から下落した後、日足チャートでは対称三角形の中で0.9000のゾーンから反発し、現在0.9427で取引されています。下降レジスタンスは1.2300付近、上昇サポートは0.7700付近にあります。
0.9000を維持すれば、1.0000〜1.0500に向けて反発する展開が見込まれます。ここを下抜けると、まず0.8800〜0.8400がサポートとなり、その後は0.7700付近の上昇トレンドラインに向かって下落する可能性があります。 #SUI
2
456
·
--
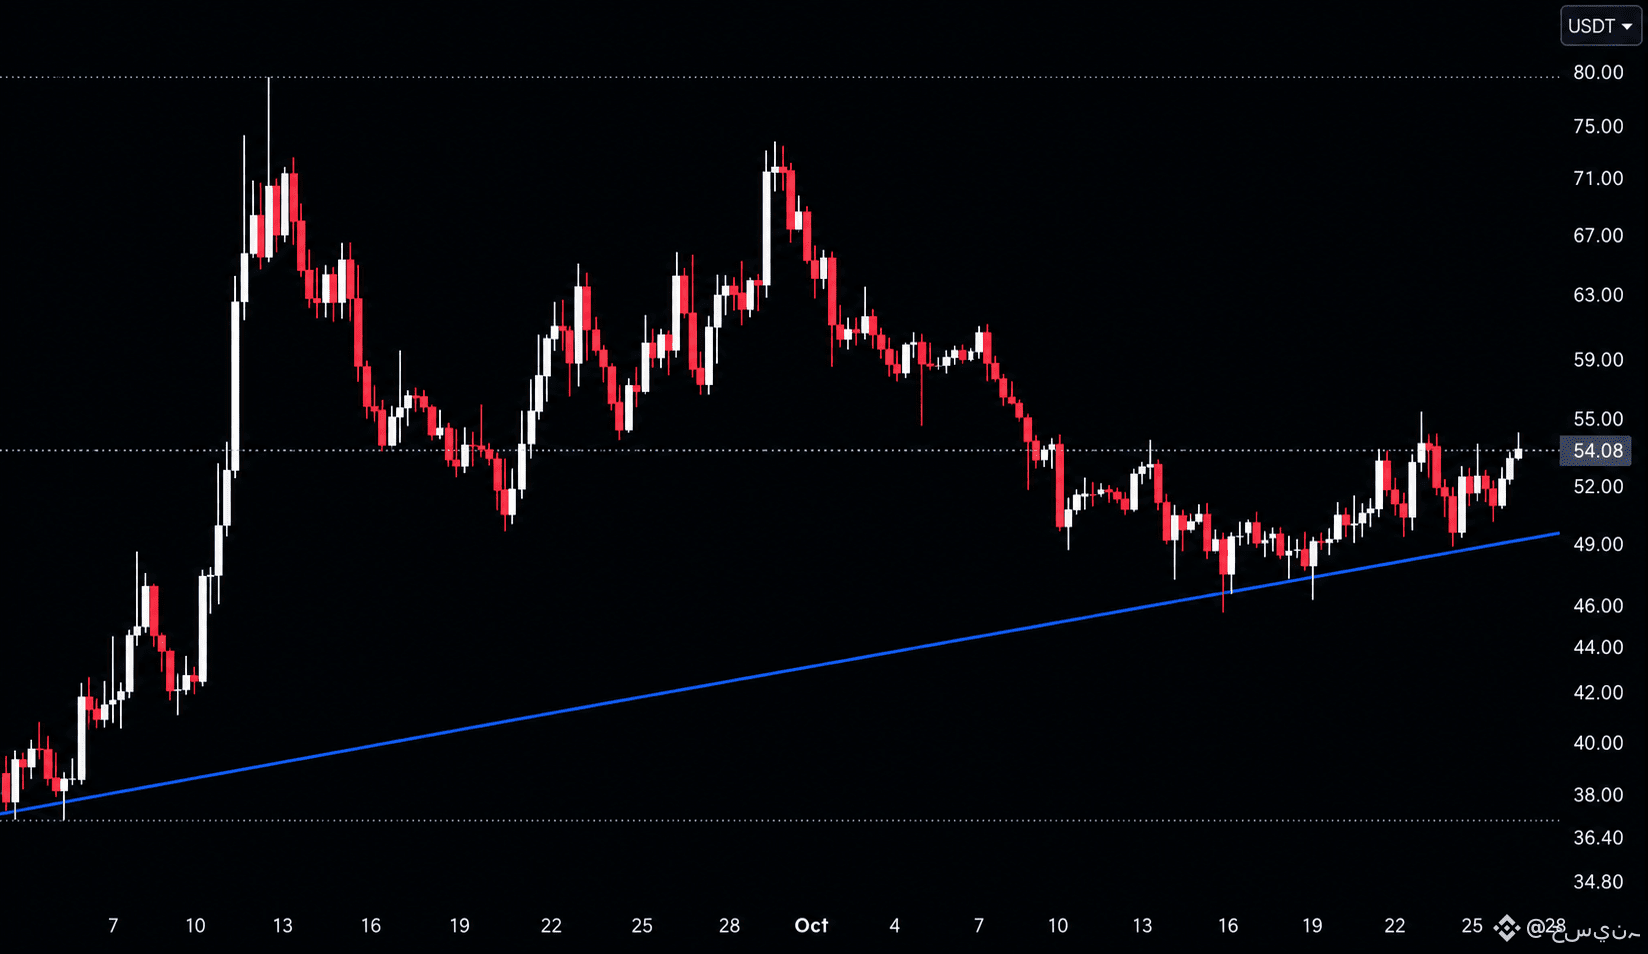
$DASH は55.00で取引されており、8月下旬から続く上昇トレンドラインの49.00付近で反発し、高値79.00付近から下落した後、55.00のレジスタンスに迫っています。
55.00を上抜ければ、59.00~63.00に向かう可能性があります。ここで反落すれば、49.00付近のトレンドラインに向けて再び下落し、これを割り込むと44.00~46.00が視野に入ります。#DASH
{future}(DASHUSDT)
$DASH は55.00で取引されており、8月下旬から続く上昇トレンドラインの49.00付近で反発し、高値79.00付近から下落した後、55.00のレジスタンスに迫っています。
55.00を上抜ければ、59.00~63.00に向かう可能性があります。ここで反落すれば、49.00付近のトレンドラインに向けて再び下落し、これを割り込むと44.00~46.00が視野に入ります。#DASH
55.00を上抜ければ、59.00~63.00に向かう可能性があります。ここで反落すれば、49.00付近のトレンドラインに向けて再び下落し、これを割り込むと44.00~46.00が視野に入ります。#DASH
2
7
·
--
翻訳参照
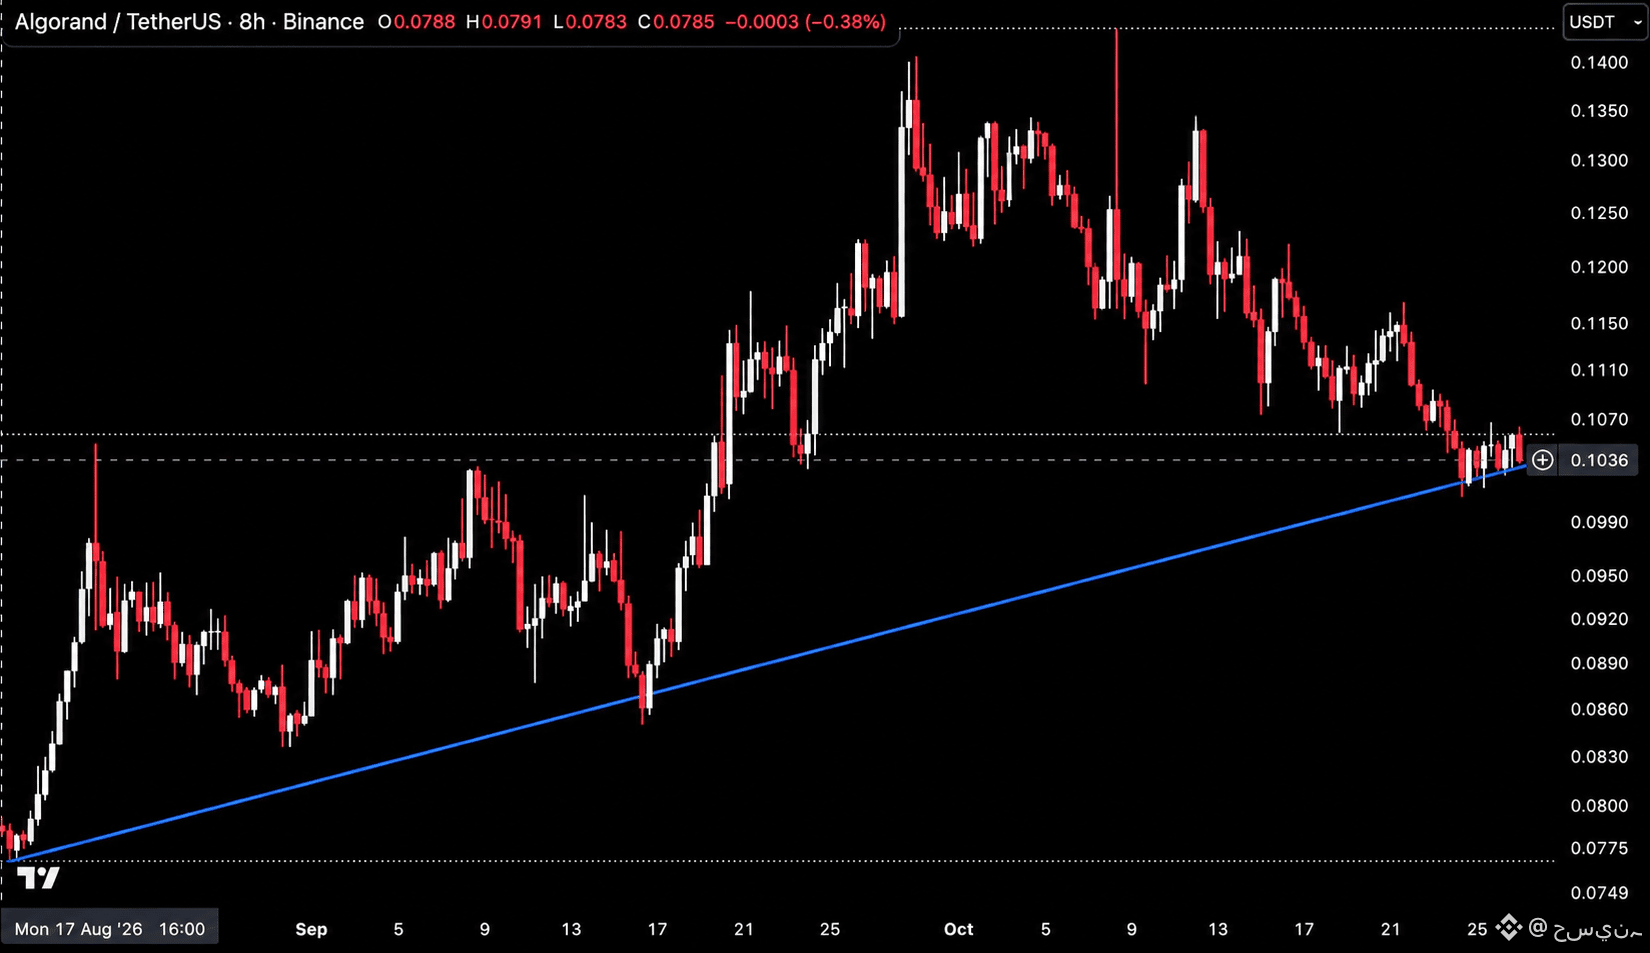
$ALGO is trading at 0.1033, testing the rising trendline from August near 0.1030 after a slide from highs near 0.1400, with price compressing just above it.
Hold this trendline and this pushes back toward 0.1070 to 0.1150. Lose it and the trendline breaks, opening the door toward 0.0990 to 0.0920. #ALGO
{future}(ALGOUSDT)
$ALGO is trading at 0.1033, testing the rising trendline from August near 0.1030 after a slide from highs near 0.1400, with price compressing just above it.
Hold this trendline and this pushes back toward 0.1070 to 0.1150. Lose it and the trendline breaks, opening the door toward 0.0990 to 0.0920. #ALGO
Hold this trendline and this pushes back toward 0.1070 to 0.1150. Lose it and the trendline breaks, opening the door toward 0.0990 to 0.0920. #ALGO
2
10
·
--
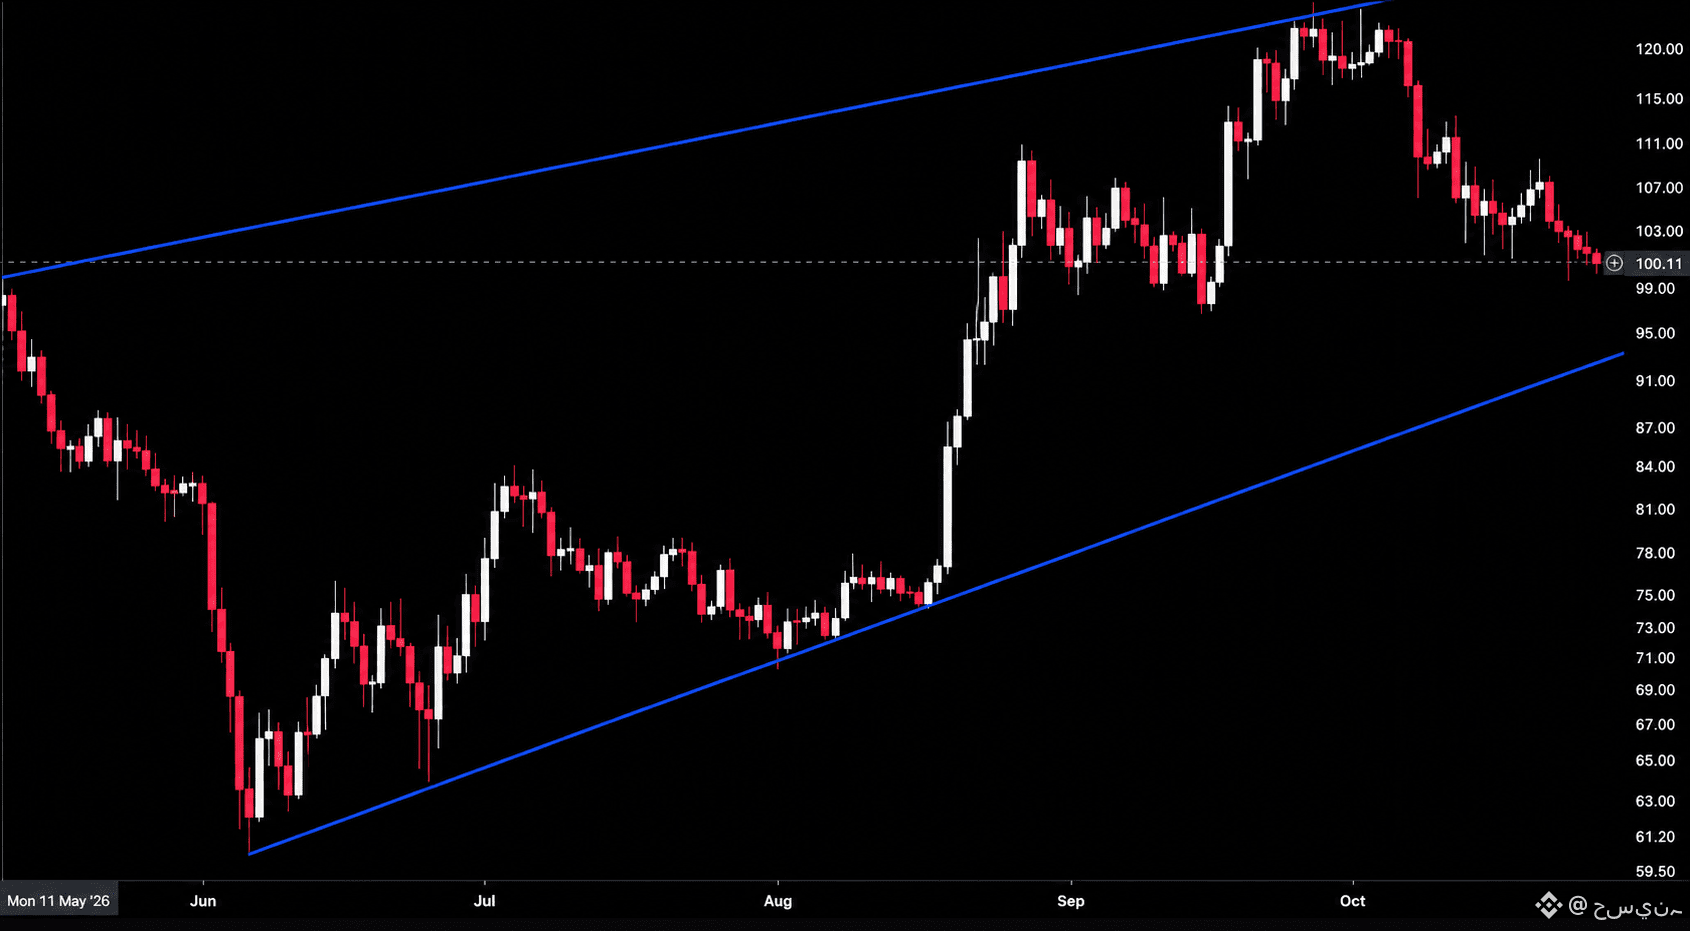
$SOL は101で取引されており、122.00付近の上側トレンドラインで反落した後、6月以降の上昇チャネル内で下落しています。価格は現在、99.00~95.00のサポートエリアに近づいており、その下には92.00付近のチャネル下限トレンドラインがあります。
99.00~95.00のエリアを維持できれば、103.00~107.00に向けて反発します。このエリアを下抜けると、92.00~87.00付近のチャネルサポートに向けて下落します。 #SOL
{future}(SOLUSDT)
$SOL は101で取引されており、122.00付近の上側トレンドラインで反落した後、6月以降の上昇チャネル内で下落しています。価格は現在、99.00~95.00のサポートエリアに近づいており、その下には92.00付近のチャネル下限トレンドラインがあります。
99.00~95.00のエリアを維持できれば、103.00~107.00に向けて反発します。このエリアを下抜けると、92.00~87.00付近のチャネルサポートに向けて下落します。 #SOL
99.00~95.00のエリアを維持できれば、103.00~107.00に向けて反発します。このエリアを下抜けると、92.00~87.00付近のチャネルサポートに向けて下落します。 #SOL
2
378
·
--
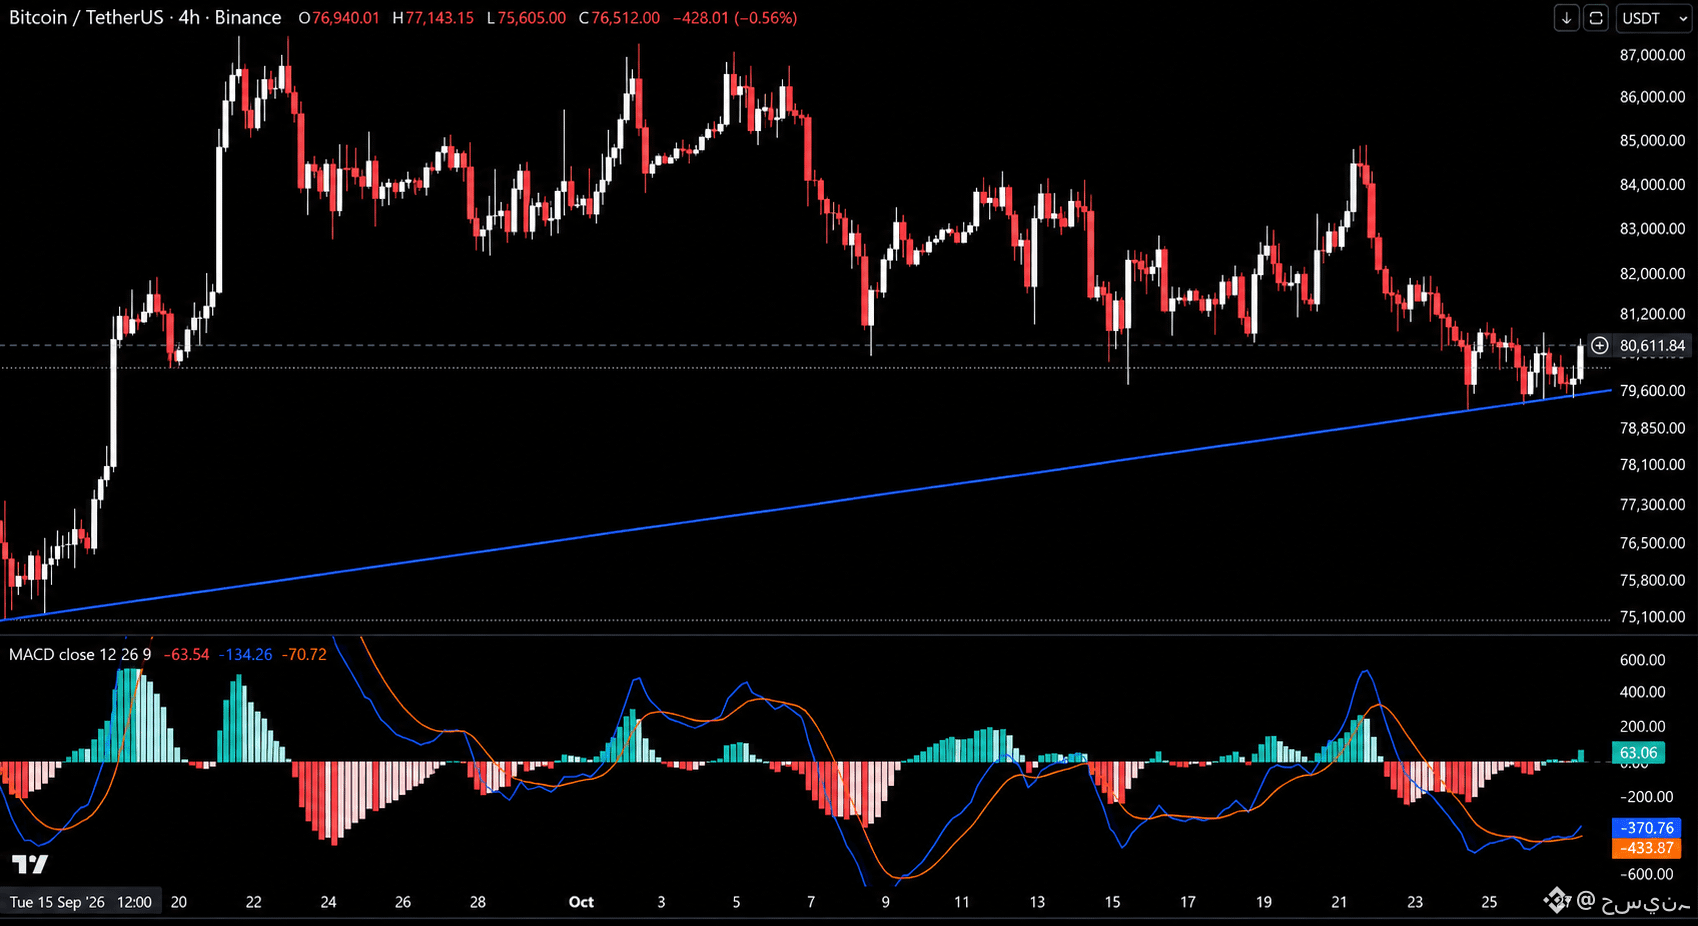
$BTC は80,611.84で取引されており、79,600付近にある9月からの上昇トレンドラインで反発しています。4時間足のMACDも、MACDラインがシグナルラインをさらに上回り、強気に転じています。
このトレンドラインを維持し、MACDのゴールデンクロスが続けば、82,000〜84,000を目指す展開になります。トレンドラインを割り込めばクロスは失敗し、78,850〜78,100が視野に入ります。#Btc
{future}(BTCUSDT)
$BTC は80,611.84で取引されており、79,600付近にある9月からの上昇トレンドラインで反発しています。4時間足のMACDも、MACDラインがシグナルラインをさらに上回り、強気に転じています。
このトレンドラインを維持し、MACDのゴールデンクロスが続けば、82,000〜84,000を目指す展開になります。トレンドラインを割り込めばクロスは失敗し、78,850〜78,100が視野に入ります。#Btc
このトレンドラインを維持し、MACDのゴールデンクロスが続けば、82,000〜84,000を目指す展開になります。トレンドラインを割り込めばクロスは失敗し、78,850〜78,100が視野に入ります。#Btc
2
44
·
--
翻訳参照
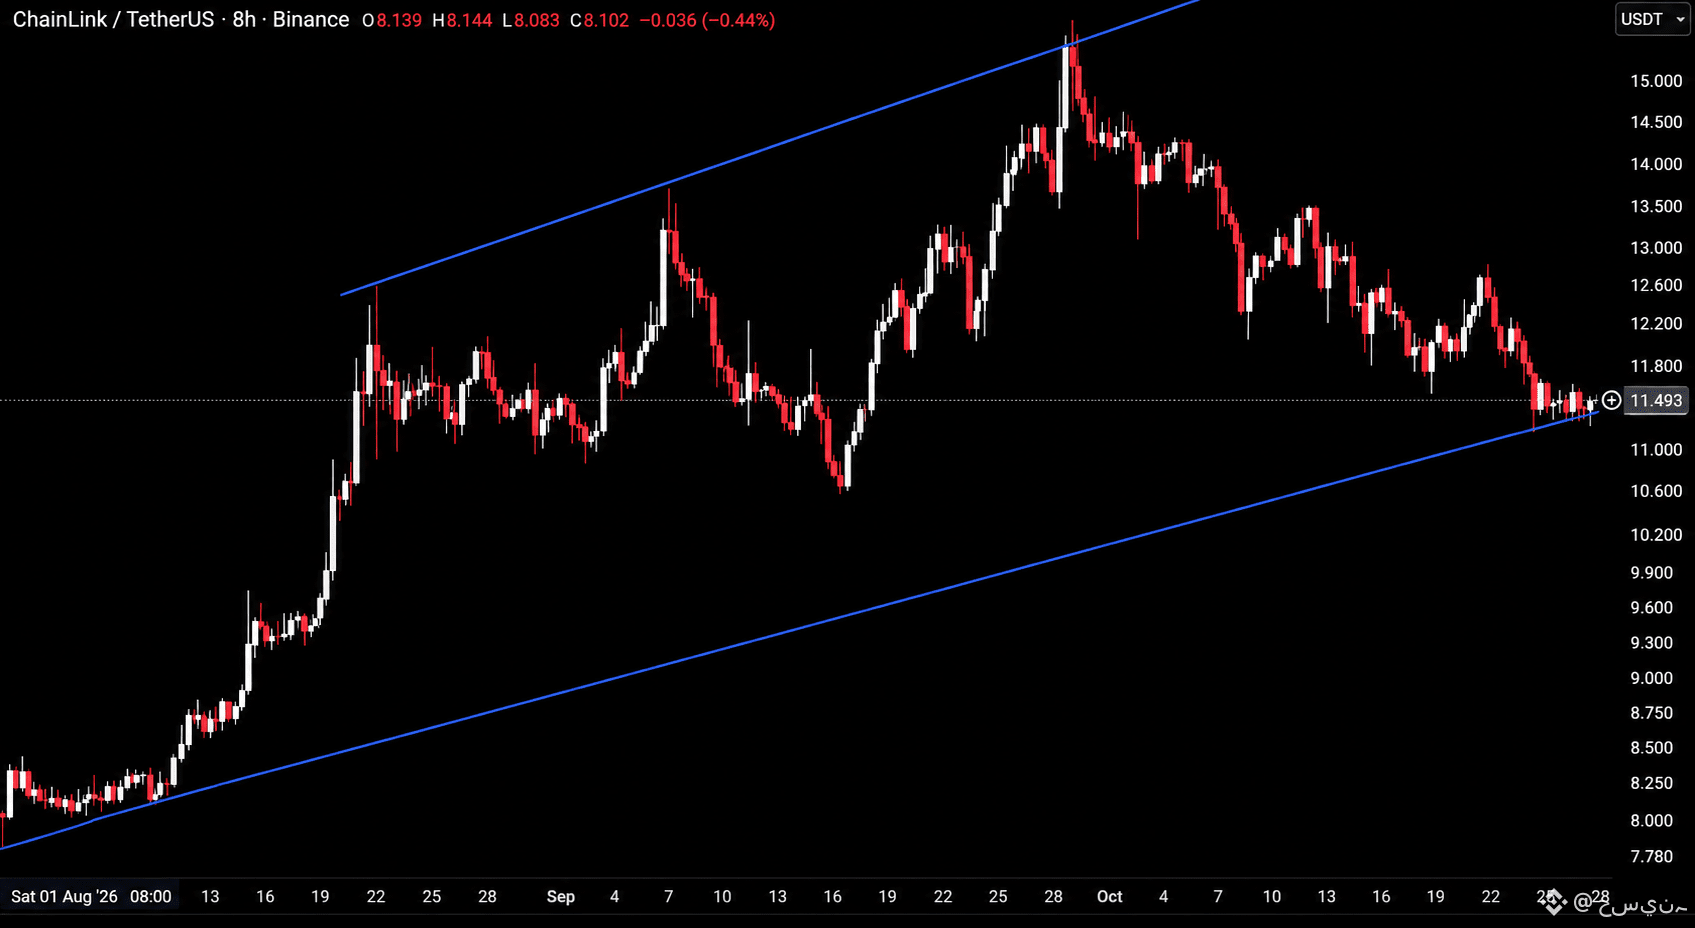
$LINK is trading at 11.55, testing the rising trendline from August near 11.300, which also acts as the lower boundary of the rising channel, after a steady slide from highs near 15.500.
Hold this trendline and this bounces back toward 12.200 to 12.600. Lose it and the channel breaks, opening the door toward 10.600 to 10.200. #LINK
{future}(LINKUSDT)
$LINK is trading at 11.55, testing the rising trendline from August near 11.300, which also acts as the lower boundary of the rising channel, after a steady slide from highs near 15.500.
Hold this trendline and this bounces back toward 12.200 to 12.600. Lose it and the channel breaks, opening the door toward 10.600 to 10.200. #LINK
Hold this trendline and this bounces back toward 12.200 to 12.600. Lose it and the channel breaks, opening the door toward 10.600 to 10.200. #LINK
2
111
·
--
翻訳参照
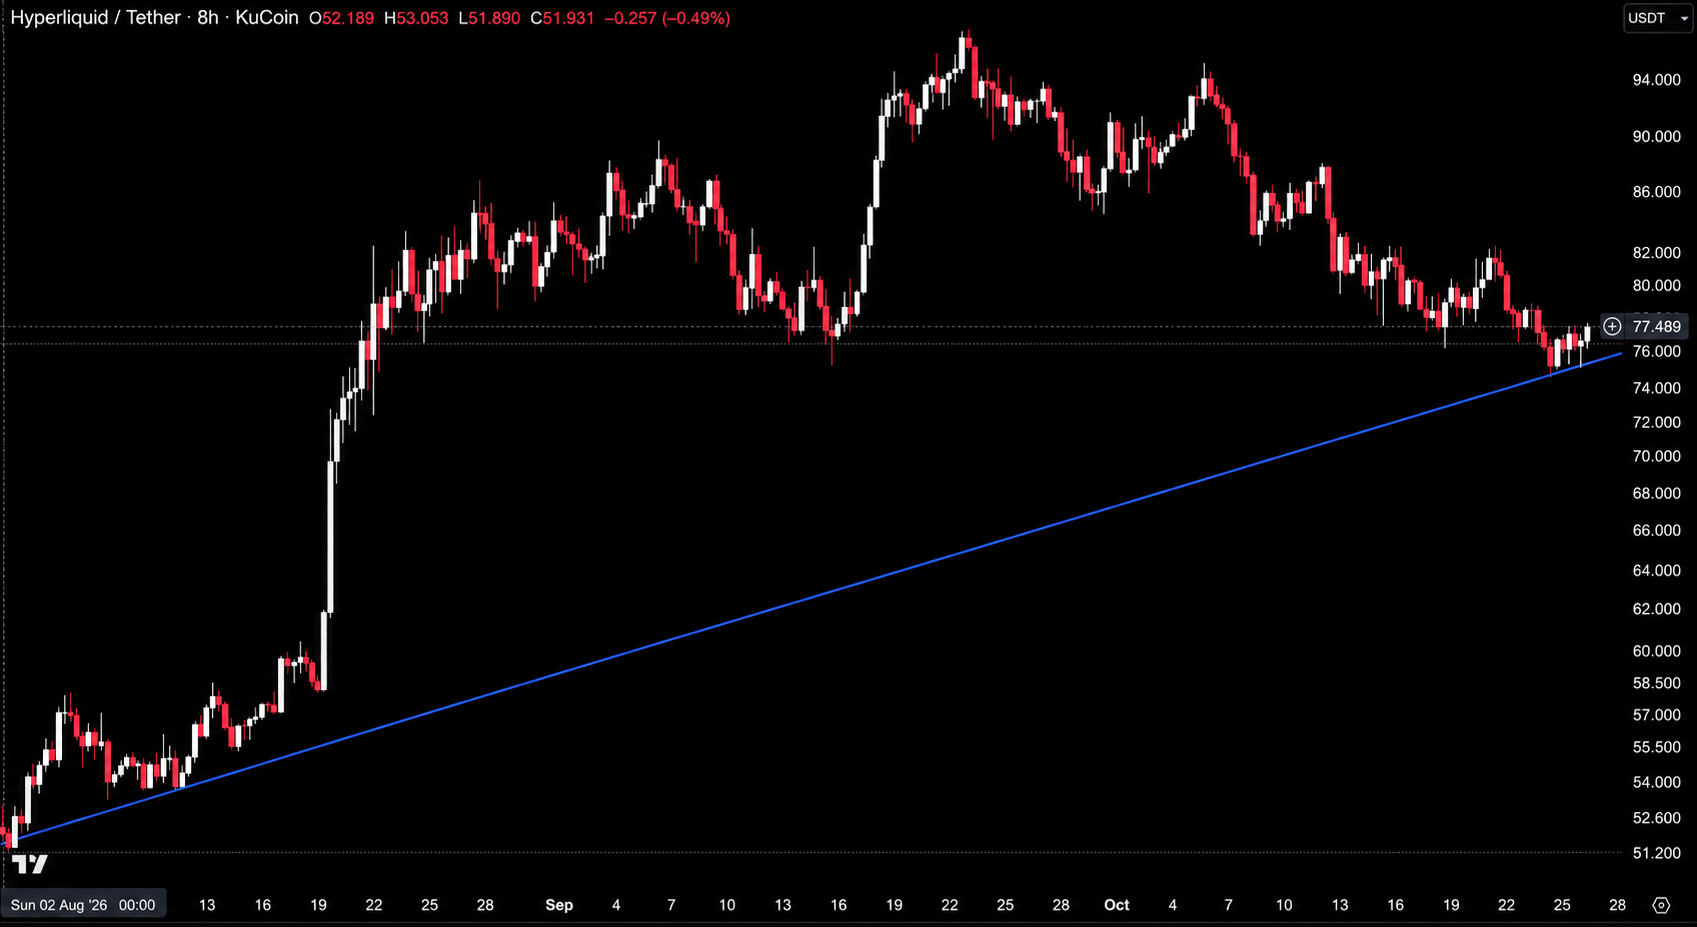
$HYPE is trading at 78, bouncing off the rising trendline from August near 75.500 after a slide from highs near 97.000, with price holding the 76.000 level on the latest retest.
Hold this trendline and this pushes back toward 80.000 to 82.000. Lo
se it and this drops back toward 72.000 to 70.000. #HYPE
{future}(HYPEUSDT)
$HYPE is trading at 78, bouncing off the rising trendline from August near 75.500 after a slide from highs near 97.000, with price holding the 76.000 level on the latest retest.
Hold this trendline and this pushes back toward 80.000 to 82.000. Lo
se it and this drops back toward 72.000 to 70.000. #HYPE
Hold this trendline and this pushes back toward 80.000 to 82.000. Lo
se it and this drops back toward 72.000 to 70.000. #HYPE
2
186
·
--
翻訳参照
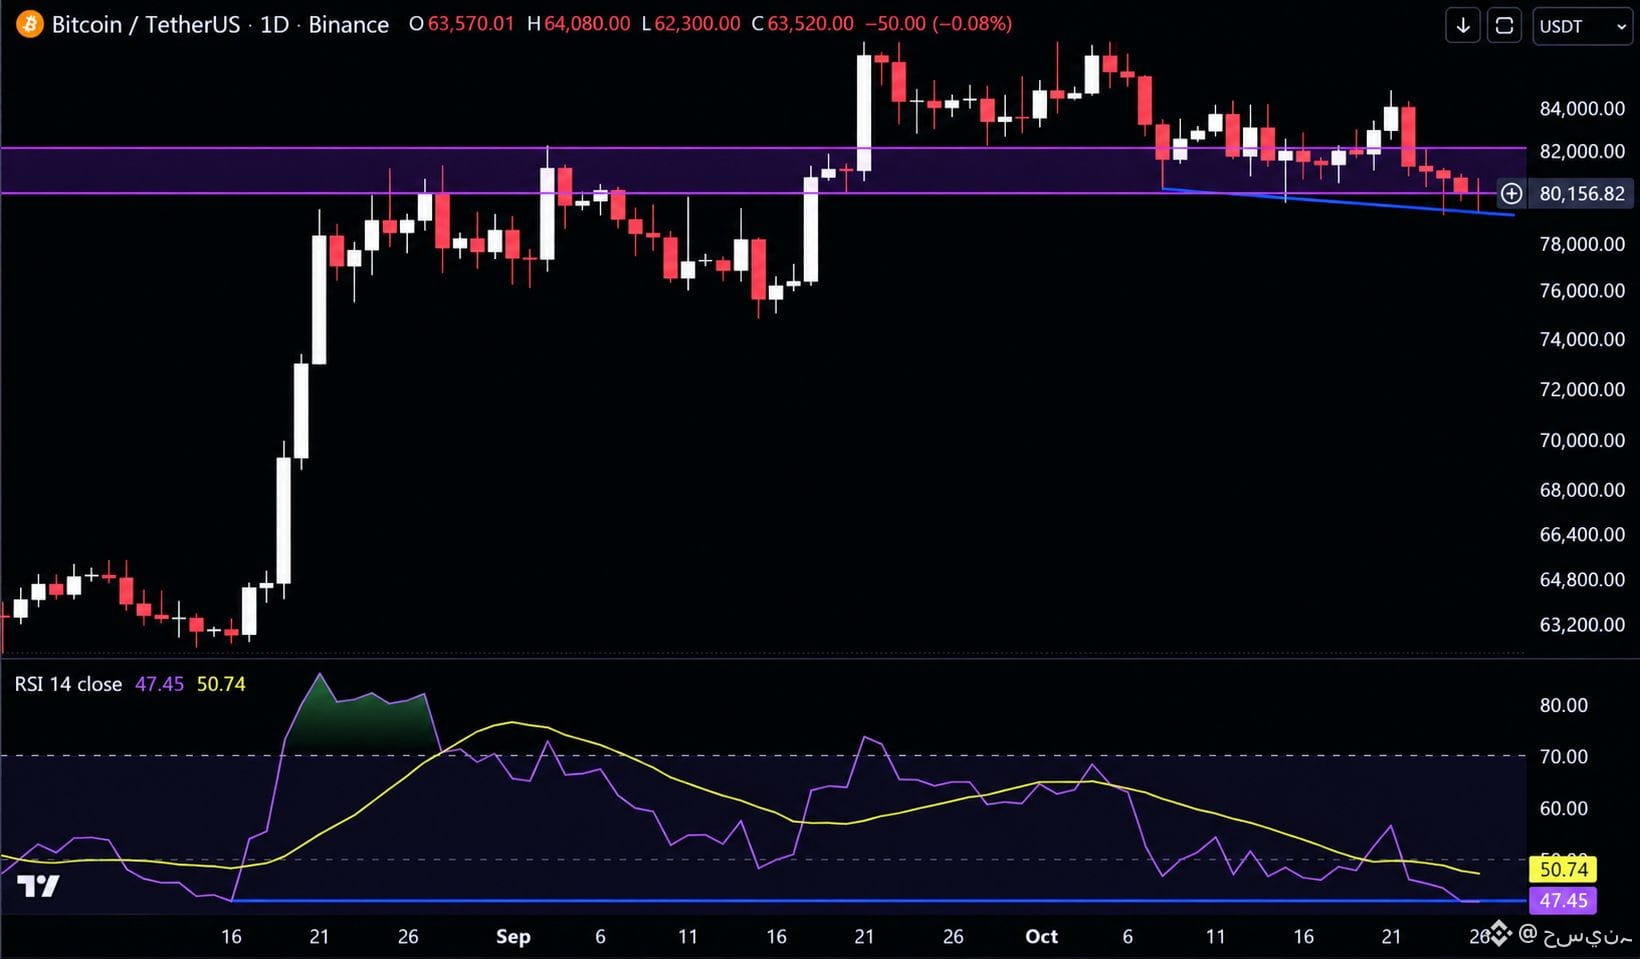
$BTC is trading at 80,050, with the daily RSI back at 41.6, the same level it was at when the August pump started, while price is still up about 25% from that point.
A full RSI reset without price giving back the move is what a healthy bull run looks like. Hold the bottom of the 80,000 to 82,100 zone and this pushes toward 84,000 to 86,000. Lose 79,400 and the structure weakens, with 76,000 to 75,000 in play. #Btc
{future}(BTCUSDT)
$BTC is trading at 80,050, with the daily RSI back at 41.6, the same level it was at when the August pump started, while price is still up about 25% from that point.
A full RSI reset without price giving back the move is what a healthy bull run looks like. Hold the bottom of the 80,000 to 82,100 zone and this pushes toward 84,000 to 86,000. Lose 79,400 and the structure weakens, with 76,000 to 75,000 in play. #Btc
A full RSI reset without price giving back the move is what a healthy bull run looks like. Hold the bottom of the 80,000 to 82,100 zone and this pushes toward 84,000 to 86,000. Lose 79,400 and the structure weakens, with 76,000 to 75,000 in play. #Btc
2
94
·
--
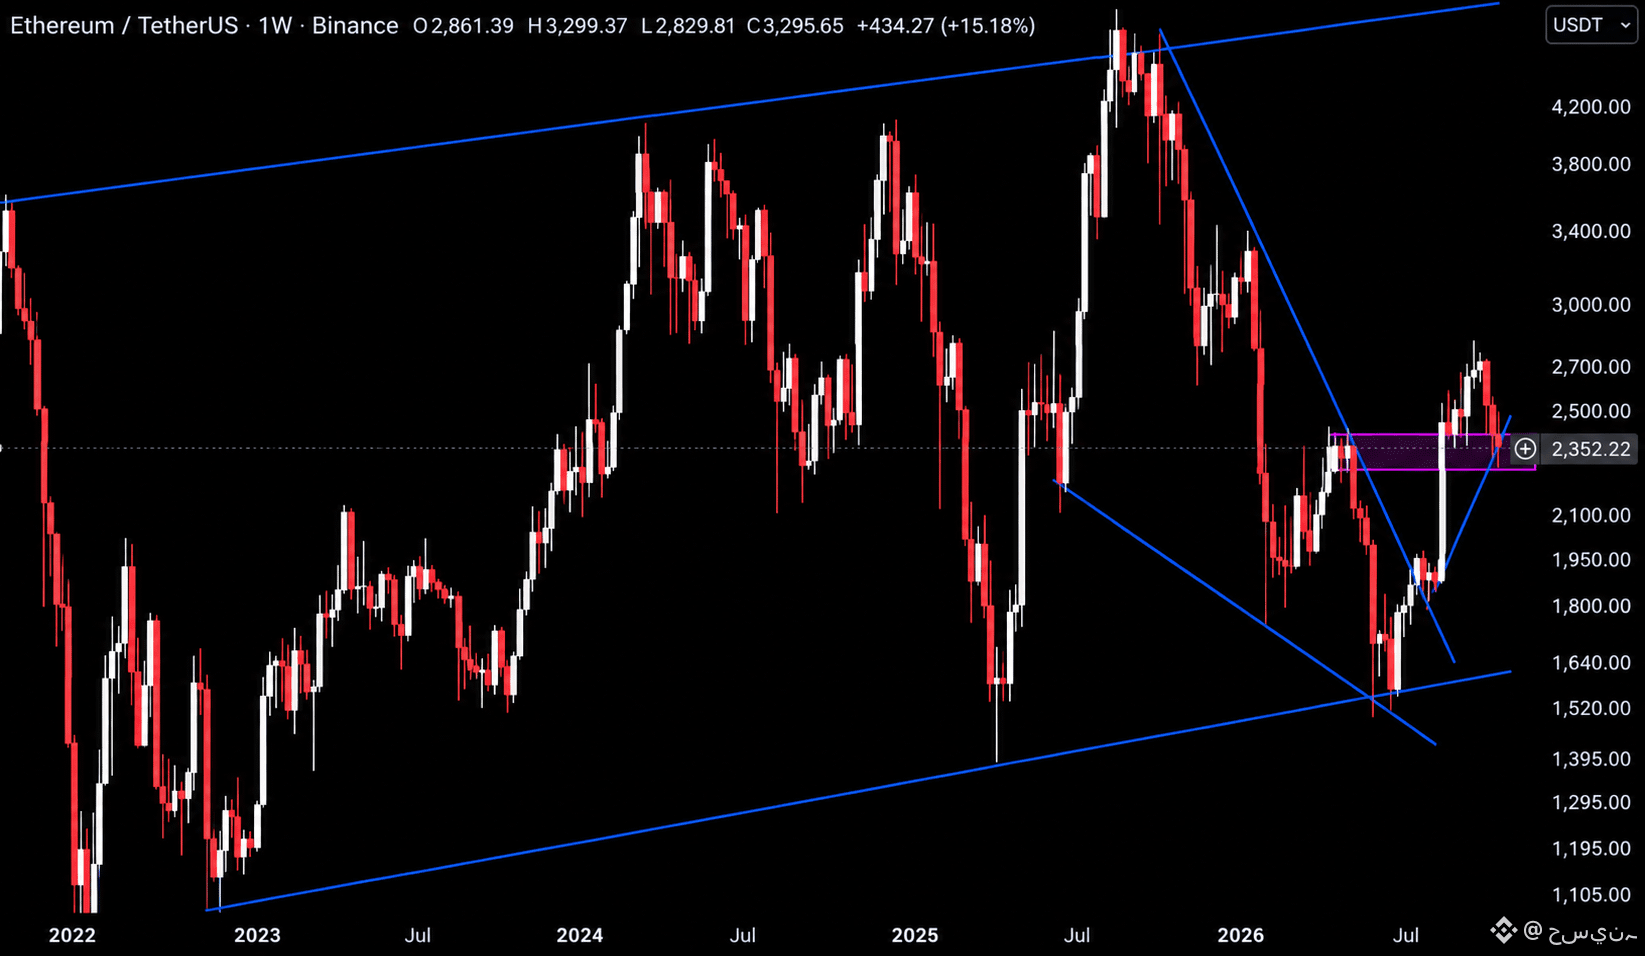
$ETH は2,320で取引されており、2,280〜2,410のサポートゾーン内に位置しています。下降ウェッジを上抜けた後、7月安値から伸びる小さな上昇トレンドライン上にあります。
週足終値がこのゾーンを上回れば、リテストが確認され、2,700〜2,800を目指す展開への道が開けます。下回れば、価格はウェッジに戻るように下落し、2,100〜1,950に向かう可能性があります。#Eth
{future}(ETHUSDT)
$ETH は2,320で取引されており、2,280〜2,410のサポートゾーン内に位置しています。下降ウェッジを上抜けた後、7月安値から伸びる小さな上昇トレンドライン上にあります。
週足終値がこのゾーンを上回れば、リテストが確認され、2,700〜2,800を目指す展開への道が開けます。下回れば、価格はウェッジに戻るように下落し、2,100〜1,950に向かう可能性があります。#Eth
週足終値がこのゾーンを上回れば、リテストが確認され、2,700〜2,800を目指す展開への道が開けます。下回れば、価格はウェッジに戻るように下落し、2,100〜1,950に向かう可能性があります。#Eth
2
71
·
--
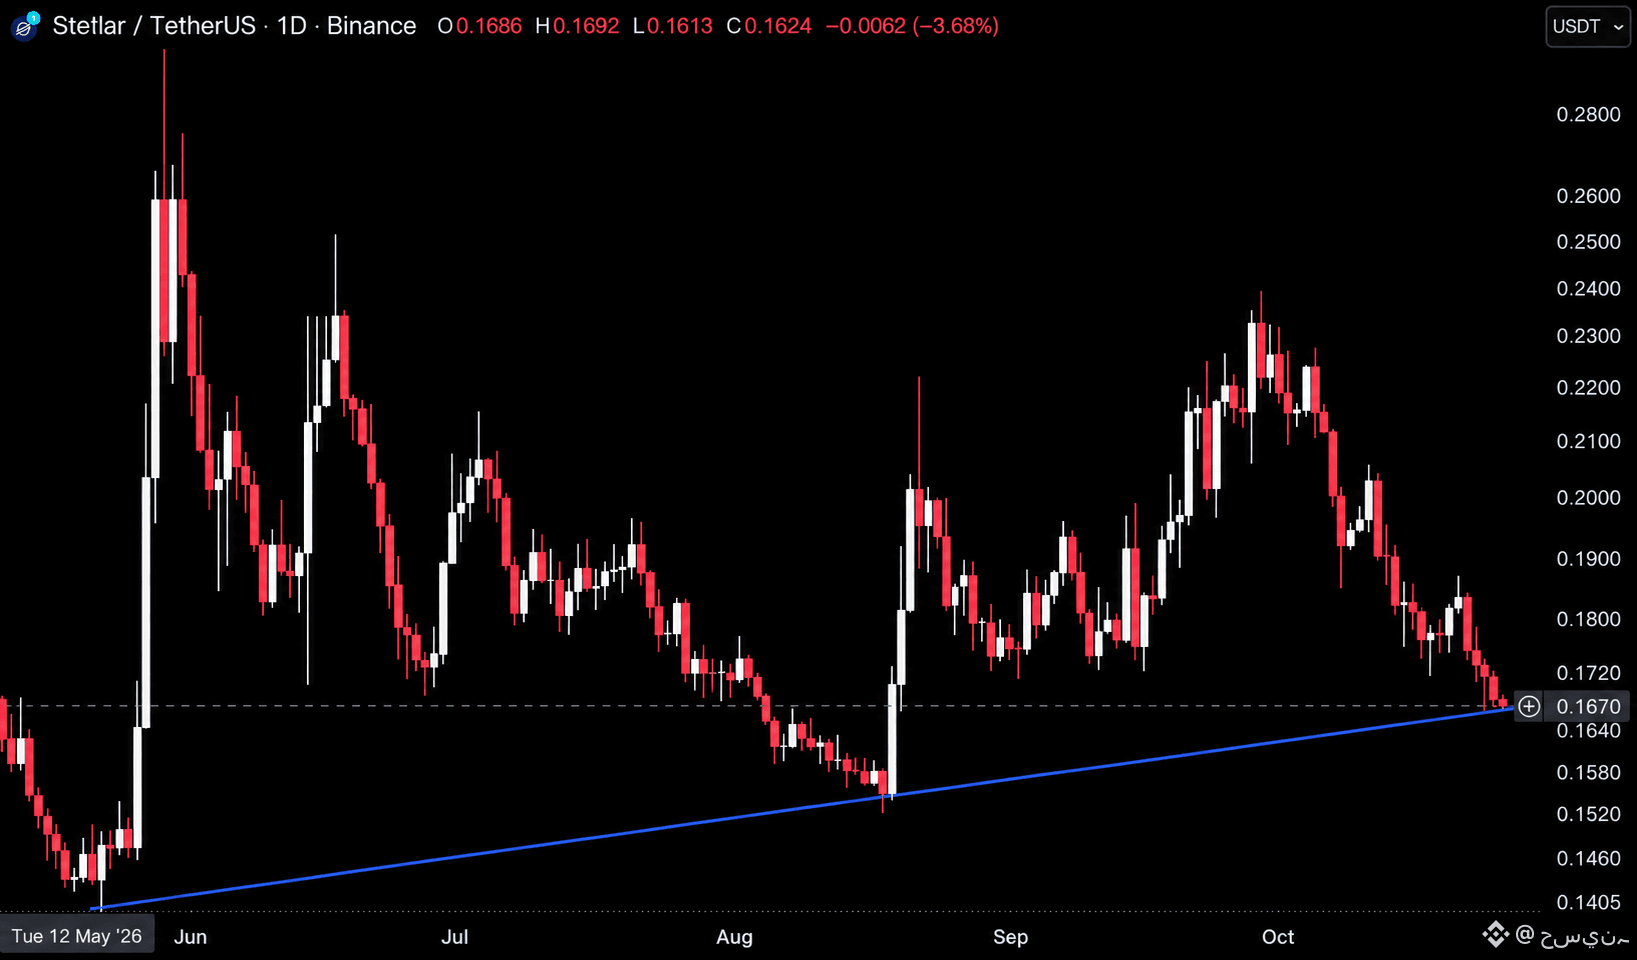
$XLM は0.1675で取引されており、0.2400付近の高値から着実に下落した後、5月から続く上昇トレンドラインを0.1650付近で試しています。
このトレンドラインを維持できれば、0.1800~0.1900に向けて反発するでしょう。割り込めば、0.1580~0.1520に向けて下落するでしょう。#XLM
{future}(XLMUSDT)
$XLM は0.1675で取引されており、0.2400付近の高値から着実に下落した後、5月から続く上昇トレンドラインを0.1650付近で試しています。
このトレンドラインを維持できれば、0.1800~0.1900に向けて反発するでしょう。割り込めば、0.1580~0.1520に向けて下落するでしょう。#XLM
このトレンドラインを維持できれば、0.1800~0.1900に向けて反発するでしょう。割り込めば、0.1580~0.1520に向けて下落するでしょう。#XLM
2
179
·
--
翻訳参照
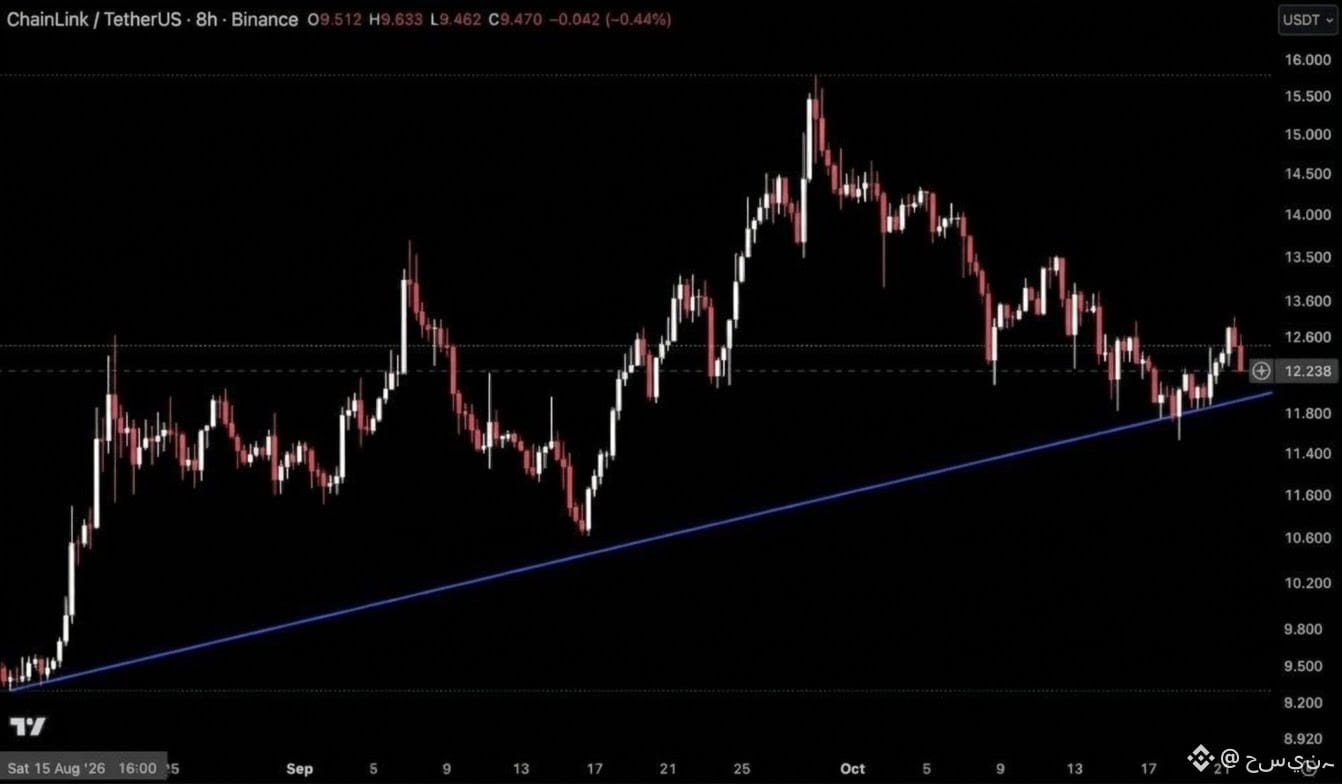
$LINK is trading at 11.5, near rising trendline from August near 11.800 after a slide from highs near 15.700.
Hold this trendline and this pushes back toward 12.600 to 13.500. Lose it and this drops back toward 11.400 to 11.000. #LINK
{future}(LINKUSDT)
$LINK is trading at 11.5, near rising trendline from August near 11.800 after a slide from highs near 15.700.
Hold this trendline and this pushes back toward 12.600 to 13.500. Lose it and this drops back toward 11.400 to 11.000. #LINK
Hold this trendline and this pushes back toward 12.600 to 13.500. Lose it and this drops back toward 11.400 to 11.000. #LINK
2
48
·
--
翻訳参照
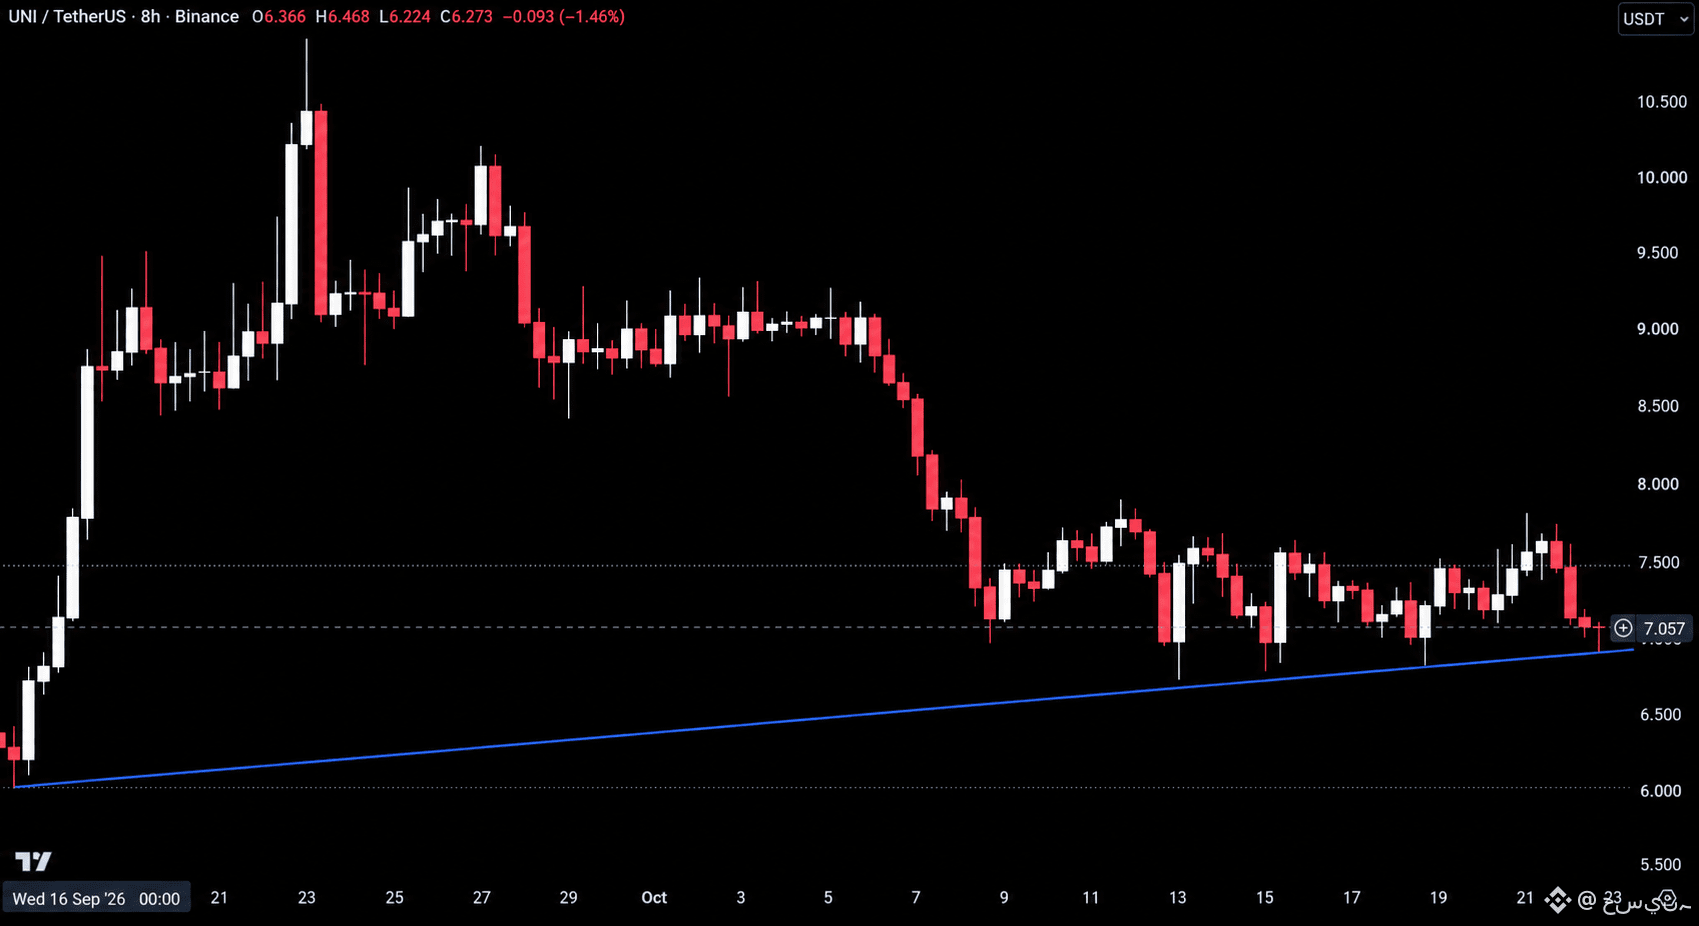
$UNI is trading at 6.97, testing the rising trendline from mid September near 6.900 for the fourth time after a slide from highs near 10.800, with price compressing into a tight range just above it.
Hold this trendline and this pushes back toward 7.500 to 8.000. Lose it and the support breaks, opening the door toward 6.500 to 6.000. #UNI
{future}(UNIUSDT)
$UNI is trading at 6.97, testing the rising trendline from mid September near 6.900 for the fourth time after a slide from highs near 10.800, with price compressing into a tight range just above it.
Hold this trendline and this pushes back toward 7.500 to 8.000. Lose it and the support breaks, opening the door toward 6.500 to 6.000. #UNI
Hold this trendline and this pushes back toward 7.500 to 8.000. Lose it and the support breaks, opening the door toward 6.500 to 6.000. #UNI
2
2
·
--
翻訳参照
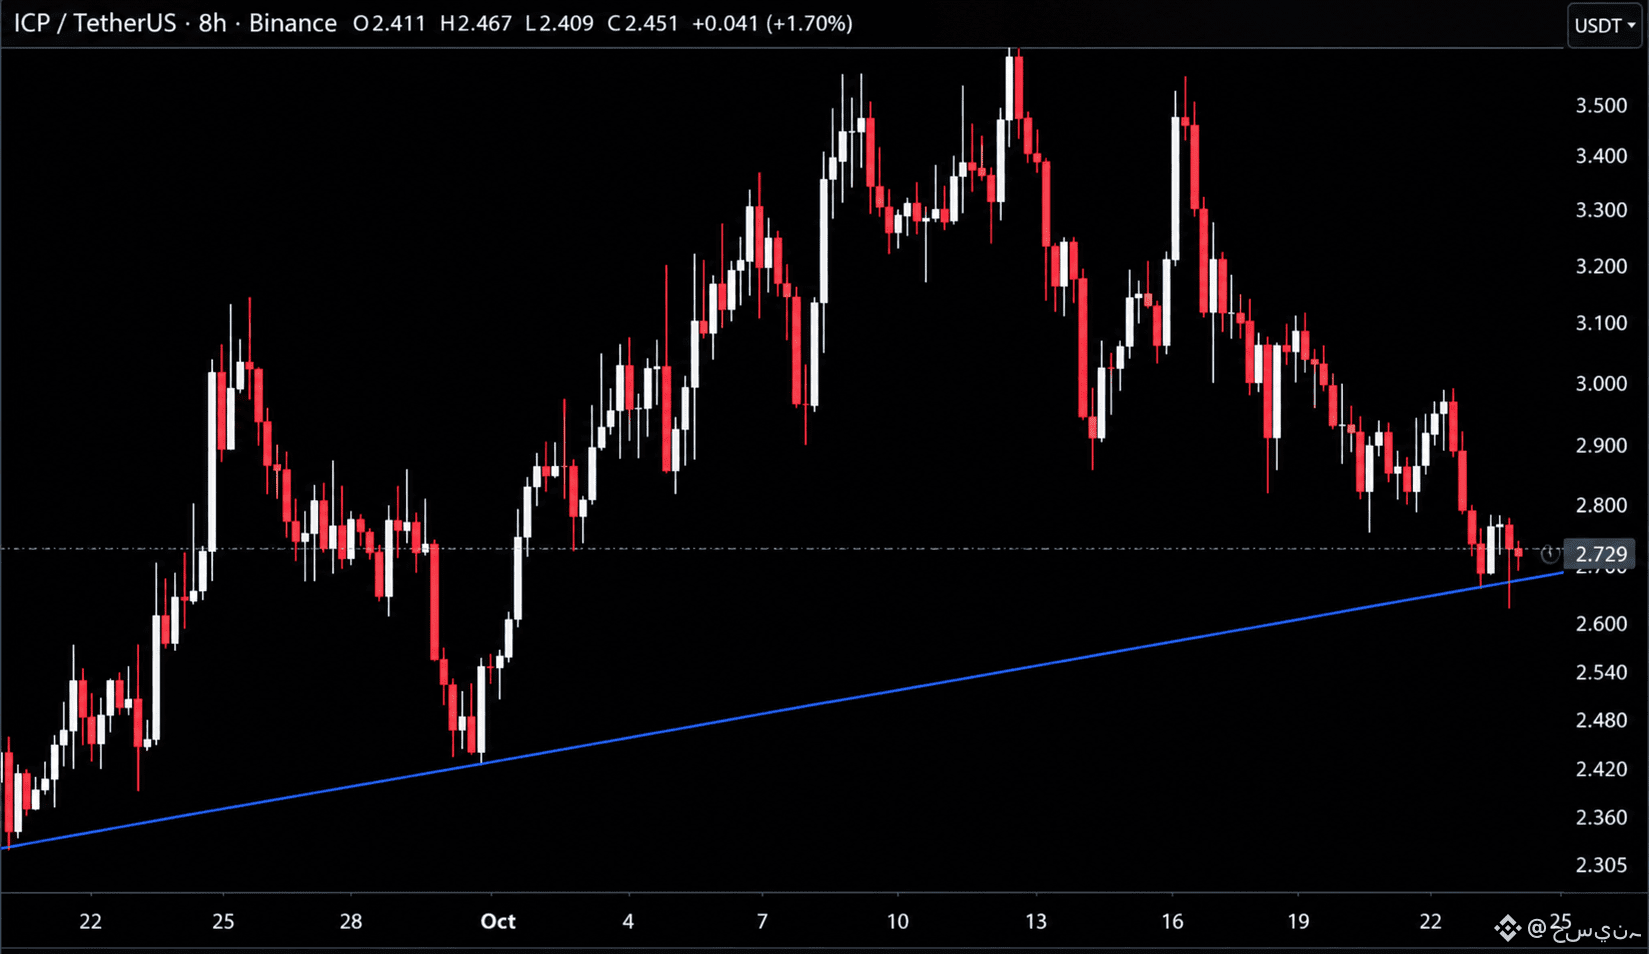
$ICP is trading at 2.65, near rising trendline from late August near 2.680 after a steady slide from highs near 3.600.
Hold this trendline and this pushes back toward 2.900 to 3.100. Lose it and this drops back toward 2.480 to 2.420. #ICP
{future}(ICPUSDT)
$ICP is trading at 2.65, near rising trendline from late August near 2.680 after a steady slide from highs near 3.600.
Hold this trendline and this pushes back toward 2.900 to 3.100. Lose it and this drops back toward 2.480 to 2.420. #ICP
Hold this trendline and this pushes back toward 2.900 to 3.100. Lose it and this drops back toward 2.480 to 2.420. #ICP
2
8
·
--
翻訳参照
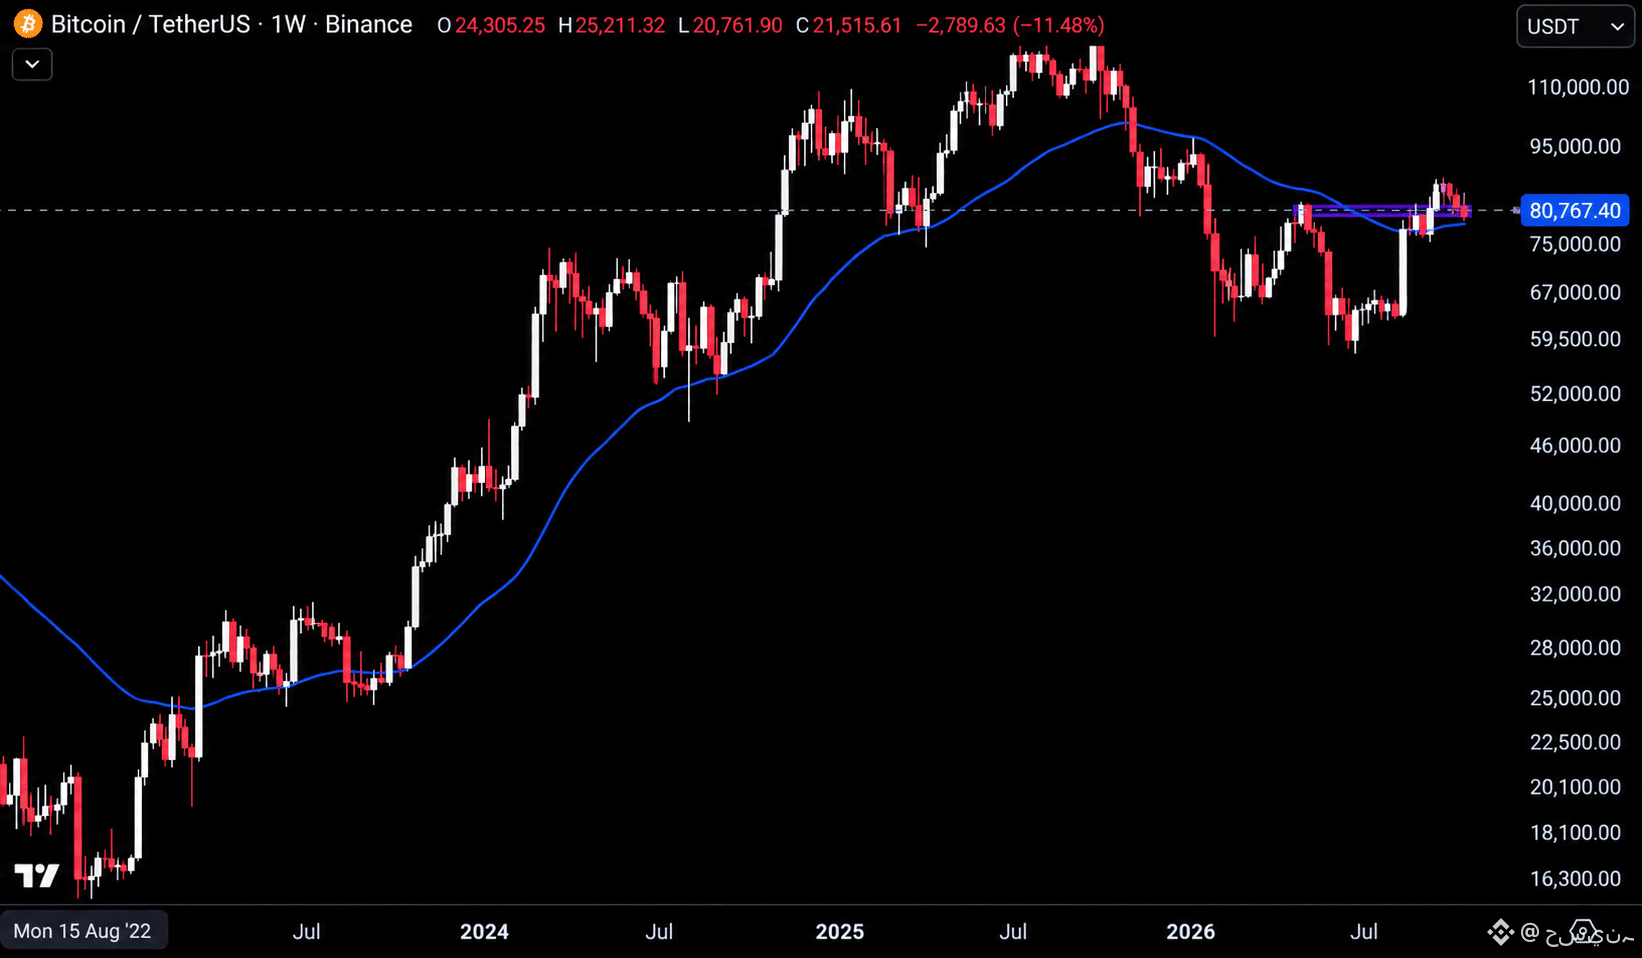
$BTC is trading at 80,767.40, a few hours from the weekly close and holding above the 50 week moving average near 77,000, with price sitting inside the 80,000 to 82,000 support zone.
A weekly close above the 50 week MA keeps the bullish structure intact and opens the door toward 84,000 to 89,000. A weekly close below it sends this back toward 75,000 to 67,000. #BTC
{future}(BTCUSDT)
$BTC is trading at 80,767.40, a few hours from the weekly close and holding above the 50 week moving average near 77,000, with price sitting inside the 80,000 to 82,000 support zone.
A weekly close above the 50 week MA keeps the bullish structure intact and opens the door toward 84,000 to 89,000. A weekly close below it sends this back toward 75,000 to 67,000. #BTC
A weekly close above the 50 week MA keeps the bullish structure intact and opens the door toward 84,000 to 89,000. A weekly close below it sends this back toward 75,000 to 67,000. #BTC
2
26
·
--
翻訳参照
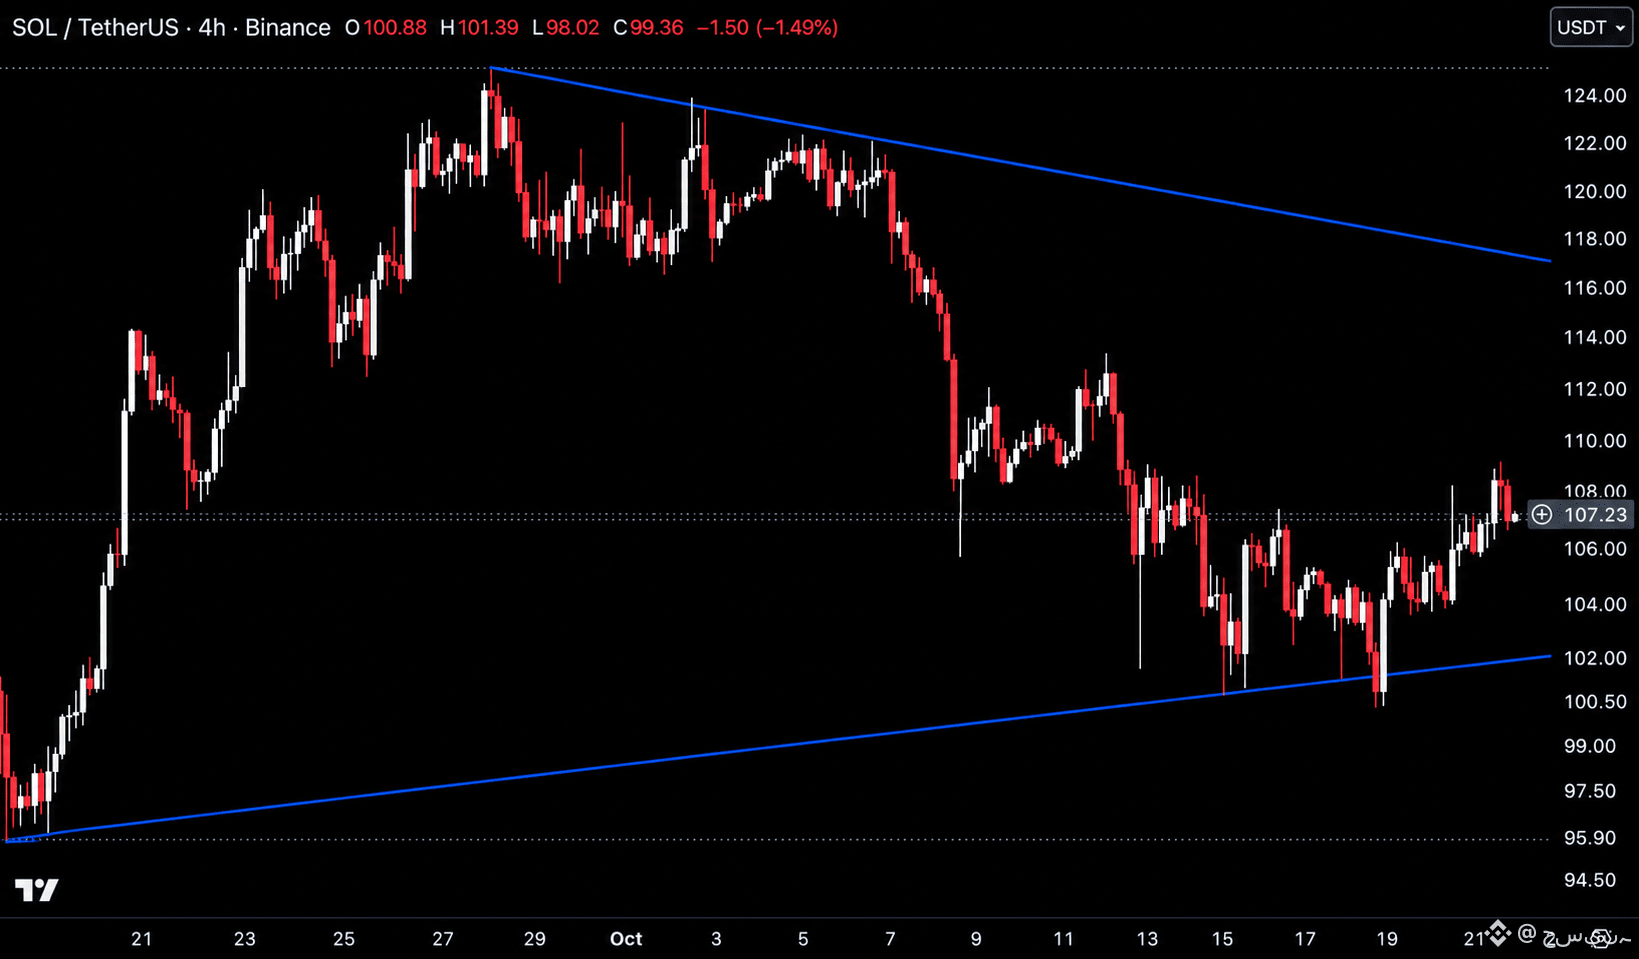
$SOL is trading at 101, rising trendline from September near 101.00 inside a symmetrical triangle, with descending resistance from the 125.00 high sitting near 117.00.
Hold this trendline and this pushes back toward 110.00 to 114.00. Lose it and this drops back toward 99.00 to 97.50. #SOL
{future}(SOLUSDT)
$SOL is trading at 101, rising trendline from September near 101.00 inside a symmetrical triangle, with descending resistance from the 125.00 high sitting near 117.00.
Hold this trendline and this pushes back toward 110.00 to 114.00. Lose it and this drops back toward 99.00 to 97.50. #SOL
Hold this trendline and this pushes back toward 110.00 to 114.00. Lose it and this drops back toward 99.00 to 97.50. #SOL
2
46
·
--
翻訳参照
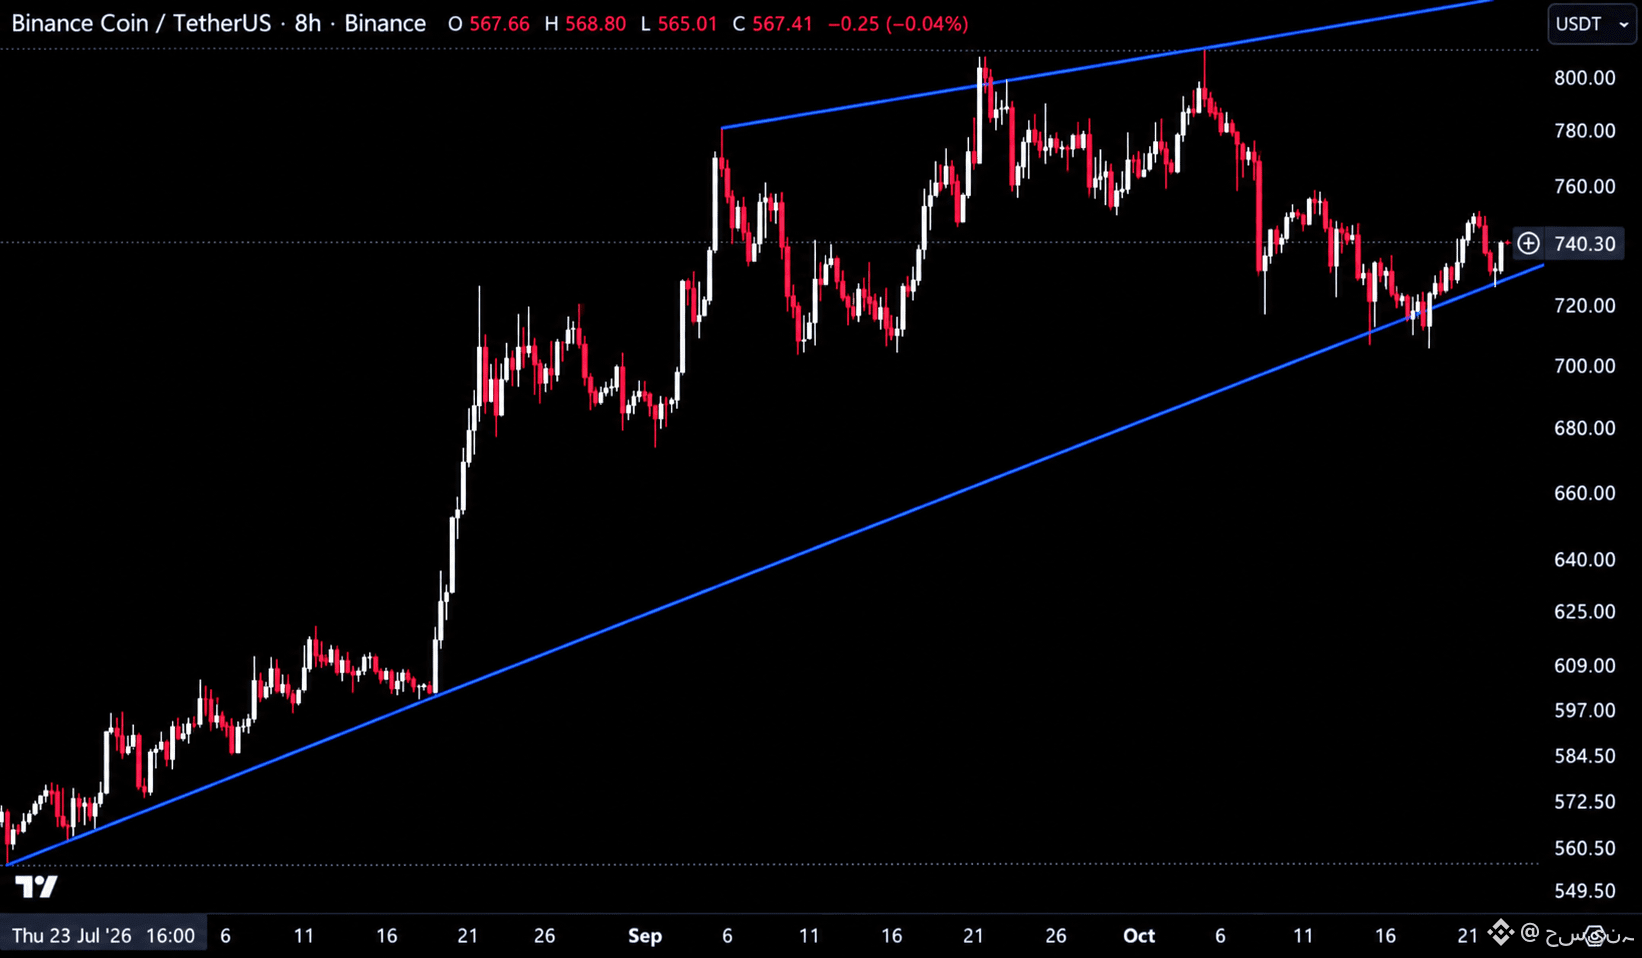
$BNB is trading at 744, bouncing off the rising trendline from July near 730.00 after a pullback from highs near 810.00.
Hold this trendline and this pushes back toward 760.00 to 780.00. Lose it and this drops back toward 700.00 to 680.00. #BNB
{future}(BNBUSDT)
$BNB is trading at 744, bouncing off the rising trendline from July near 730.00 after a pullback from highs near 810.00.
Hold this trendline and this pushes back toward 760.00 to 780.00. Lose it and this drops back toward 700.00 to 680.00. #BNB
Hold this trendline and this pushes back toward 760.00 to 780.00. Lose it and this drops back toward 700.00 to 680.00. #BNB
2
29
·
--
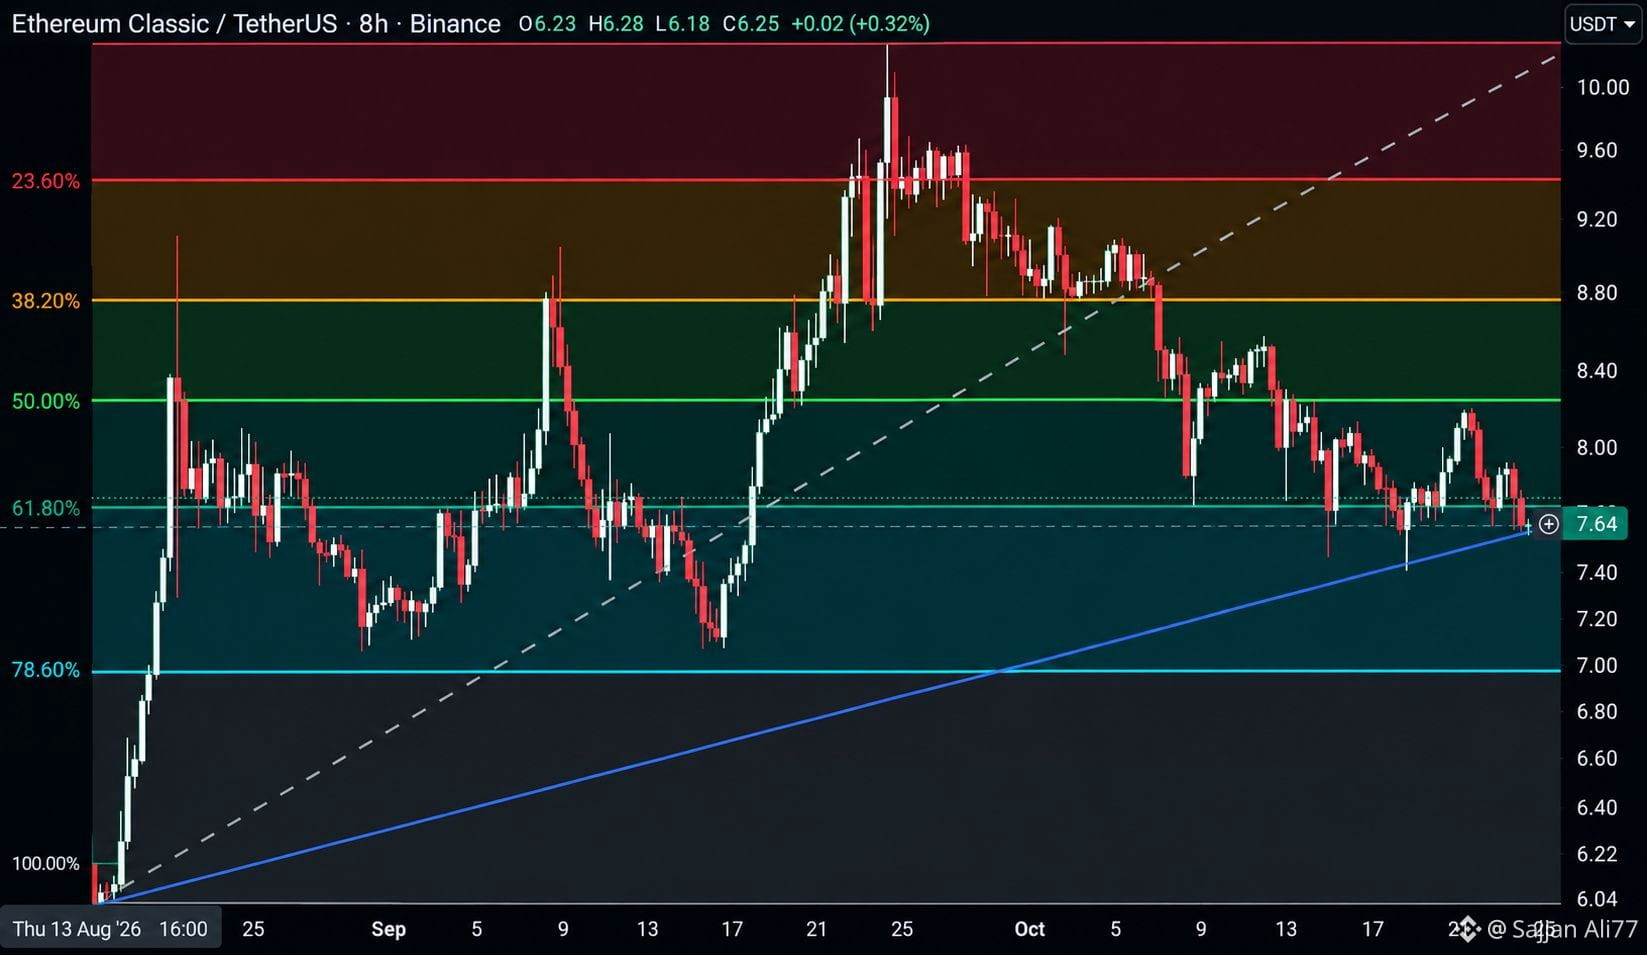
$ETC は7.64で取引されており、再び7.73付近のフィボナッチ61.8%水準で反応しています。この水準は、10.40付近の高値からの下落後、8月以来の上昇トレンドライン(7.60付近)とともにサポートとして機能しています。
61.8%水準を維持すれば、8.22付近の50%水準、さらに8.76付近の38.2%水準に向けて反発する可能性があります。この水準を割り込めば、6.97付近の78.6%水準まで下落する可能性があります。 #ETC
{future}(ETCUSDT)
$ETC は7.64で取引されており、再び7.73付近のフィボナッチ61.8%水準で反応しています。この水準は、10.40付近の高値からの下落後、8月以来の上昇トレンドライン(7.60付近)とともにサポートとして機能しています。
61.8%水準を維持すれば、8.22付近の50%水準、さらに8.76付近の38.2%水準に向けて反発する可能性があります。この水準を割り込めば、6.97付近の78.6%水準まで下落する可能性があります。 #ETC
61.8%水準を維持すれば、8.22付近の50%水準、さらに8.76付近の38.2%水準に向けて反発する可能性があります。この水準を割り込めば、6.97付近の78.6%水準まで下落する可能性があります。 #ETC
2
71
·
--
翻訳参照
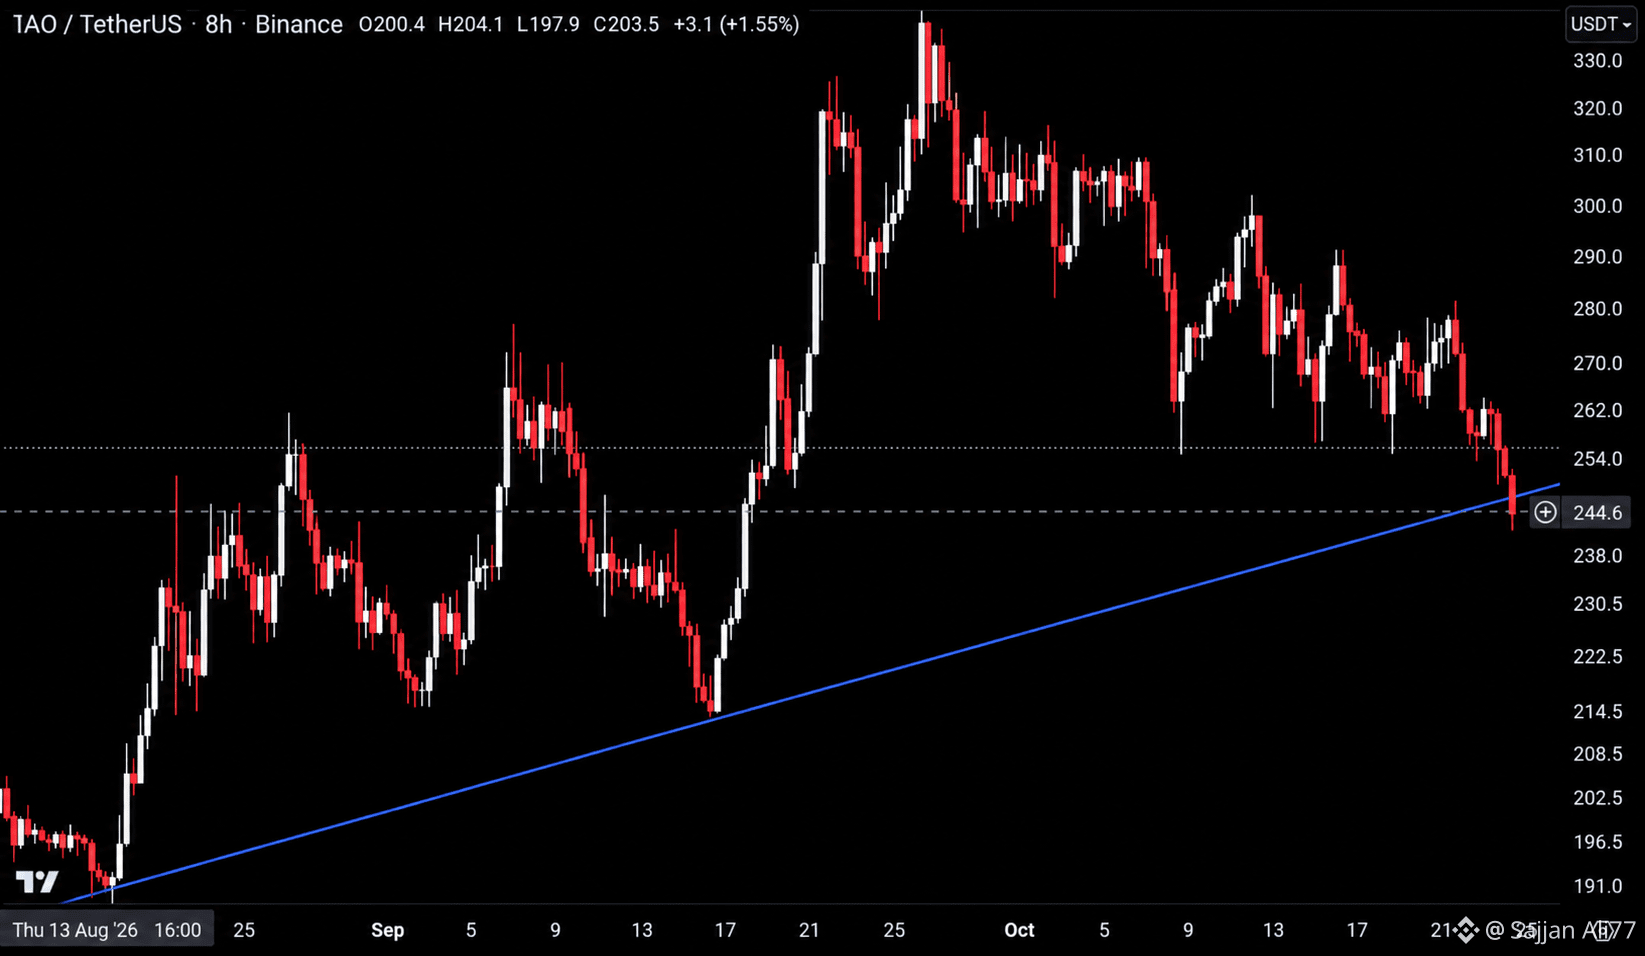
$TAO is trading at 244.6, testing the rising trendline from mid August right at this level after a steady slide from highs near 335.
Reclaim this trendline and this pushes back toward 254 to 262. Lose it and this drops back toward 230 to 214. #TAO
{future}(TAOUSDT)
$TAO is trading at 244.6, testing the rising trendline from mid August right at this level after a steady slide from highs near 335.
Reclaim this trendline and this pushes back toward 254 to 262. Lose it and this drops back toward 230 to 214. #TAO
Reclaim this trendline and this pushes back toward 254 to 262. Lose it and this drops back toward 230 to 214. #TAO
2
50
ログインして、さらにコンテンツを読む
厳選トピックで世界の暗号資産トレーダーの仲間入り
⚡️ 暗号資産に関する最新かつ有益な情報が見つかります。
💬 世界最大の暗号資産取引所から信頼されています。
👍 認証を受けたクリエイターから、有益なインサイトを得られます。
メール / 電話番号