
SmartmoneyCrypto
96 投稿

SmartmoneyCrypto
報告
ユーザーをブロック
📉📈 Market Structure & Levels
8 フォロー
29 フォロワー
77 いいね
投稿
すべて
引用
翻訳参照
we are making good profits in RUNE🚀🚀$RUNE
{future}(RUNEUSDT)
Here is setup thai I give
🚀 RUNEUSDT – BUY SETUP | Potential Bullish Opportunity
The RUNEUSDT pair is on our watchlist for a potential bullish move. Buyers should focus on proper risk management and confirmation before entering the trade.
📊 Trade Setup
🟢 Direction: BUY / LONG
🛑 Stop Loss: 0.5108
🎯 Take Profit Targets:
- TP1: 0.5400
- TP2: 0.6193
- TP3: 0.6495
📈 Trading Strategy
The first target at 0.5400 is the initial profit-taking zone. If bullish momentum continues, RUNE could potentially extend toward 0.6193 and 0.6495.
What Should Traders Watch?
1. Strong buying volume.
2. Bullish market structure.
3. Support holding above the entry area.
4. BTC stability and overall altcoin sentiment.
⚠️ Risk Management:
Always calculate your position size according to your risk tolerance. Avoid chasing the price and respect your stop loss.
💬 What's your target for RUNE? Can it reach 0.6495?
Share your analysis in the comments!
#RUNE #RUNEUSDT #THORChain #CryptoTrading #Binance #Altcoins #TradingSetup #CryptoAnalysis
we are making good profits in RUNE🚀🚀
$RUNE
Here is setup thai I give
🚀 RUNEUSDT – BUY SETUP | Potential Bullish Opportunity
The RUNEUSDT pair is on our watchlist for a potential bullish move. Buyers should focus on proper risk management and confirmation before entering the trade.
📊 Trade Setup
🟢 Direction: BUY / LONG
🛑 Stop Loss: 0.5108
🎯 Take Profit Targets:
- TP1: 0.5400
- TP2: 0.6193
- TP3: 0.6495
📈 Trading Strategy
The first target at 0.5400 is the initial profit-taking zone. If bullish momentum continues, RUNE could potentially extend toward 0.6193 and 0.6495.
What Should Traders Watch?
1. Strong buying volume.
2. Bullish market structure.
3. Support holding above the entry area.
4. BTC stability and overall altcoin sentiment.
⚠️ Risk Management:
Always calculate your position size according to your risk tolerance. Avoid chasing the price and respect your stop loss.
💬 What's your target for RUNE? Can it reach 0.6495?
Share your analysis in the comments!
#RUNE #RUNEUSDT #THORChain #CryptoTrading #Binance #Altcoins #TradingSetup #CryptoAnalysis
Here is setup thai I give
🚀 RUNEUSDT – BUY SETUP | Potential Bullish Opportunity
The RUNEUSDT pair is on our watchlist for a potential bullish move. Buyers should focus on proper risk management and confirmation before entering the trade.
📊 Trade Setup
🟢 Direction: BUY / LONG
🛑 Stop Loss: 0.5108
🎯 Take Profit Targets:
- TP1: 0.5400
- TP2: 0.6193
- TP3: 0.6495
📈 Trading Strategy
The first target at 0.5400 is the initial profit-taking zone. If bullish momentum continues, RUNE could potentially extend toward 0.6193 and 0.6495.
What Should Traders Watch?
1. Strong buying volume.
2. Bullish market structure.
3. Support holding above the entry area.
4. BTC stability and overall altcoin sentiment.
⚠️ Risk Management:
Always calculate your position size according to your risk tolerance. Avoid chasing the price and respect your stop loss.
💬 What's your target for RUNE? Can it reach 0.6495?
Share your analysis in the comments!
#RUNE #RUNEUSDT #THORChain #CryptoTrading #Binance #Altcoins #TradingSetup #CryptoAnalysis
209
翻訳参照
🚀 RUNEUSDT – BUY SETUP | Potential Bullish Opportunity$RUNE
{future}(RUNEUSDT)
The RUNEUSDT pair is on our watchlist for a potential bullish move. Buyers should focus on proper risk management and confirmation before entering the trade.
📊 Trade Setup
🟢 Direction: BUY / LONG
🛑 Stop Loss: 0.5108
🎯 Take Profit Targets:
- TP1: 0.5400
- TP2: 0.6193
- TP3: 0.6495
📈 Trading Strategy
The first target at 0.5400 is the initial profit-taking zone. If bullish momentum continues, RUNE could potentially extend toward 0.6193 and 0.6495.
What Should Traders Watch?
1. Strong buying volume.
2. Bullish market structure.
3. Support holding above the entry area.
4. BTC stability and overall altcoin sentiment.
⚠️ Risk Management:
Always calculate your position size according to your risk tolerance. Avoid chasing the price and respect your stop loss.
💬 What's your target for RUNE? Can it reach 0.6495?
Share your analysis in the comments!
#RUNE #RUNEUSDT #THORChain #CryptoTrading #Binance #Altcoins #TradingSetup #CryptoAnalysis
🚀 RUNEUSDT – BUY SETUP | Potential Bullish Opportunity
$RUNE
The RUNEUSDT pair is on our watchlist for a potential bullish move. Buyers should focus on proper risk management and confirmation before entering the trade.
📊 Trade Setup
🟢 Direction: BUY / LONG
🛑 Stop Loss: 0.5108
🎯 Take Profit Targets:
- TP1: 0.5400
- TP2: 0.6193
- TP3: 0.6495
📈 Trading Strategy
The first target at 0.5400 is the initial profit-taking zone. If bullish momentum continues, RUNE could potentially extend toward 0.6193 and 0.6495.
What Should Traders Watch?
1. Strong buying volume.
2. Bullish market structure.
3. Support holding above the entry area.
4. BTC stability and overall altcoin sentiment.
⚠️ Risk Management:
Always calculate your position size according to your risk tolerance. Avoid chasing the price and respect your stop loss.
💬 What's your target for RUNE? Can it reach 0.6495?
Share your analysis in the comments!
#RUNE #RUNEUSDT #THORChain #CryptoTrading #Binance #Altcoins #TradingSetup #CryptoAnalysis
The RUNEUSDT pair is on our watchlist for a potential bullish move. Buyers should focus on proper risk management and confirmation before entering the trade.
📊 Trade Setup
🟢 Direction: BUY / LONG
🛑 Stop Loss: 0.5108
🎯 Take Profit Targets:
- TP1: 0.5400
- TP2: 0.6193
- TP3: 0.6495
📈 Trading Strategy
The first target at 0.5400 is the initial profit-taking zone. If bullish momentum continues, RUNE could potentially extend toward 0.6193 and 0.6495.
What Should Traders Watch?
1. Strong buying volume.
2. Bullish market structure.
3. Support holding above the entry area.
4. BTC stability and overall altcoin sentiment.
⚠️ Risk Management:
Always calculate your position size according to your risk tolerance. Avoid chasing the price and respect your stop loss.
💬 What's your target for RUNE? Can it reach 0.6495?
Share your analysis in the comments!
#RUNE #RUNEUSDT #THORChain #CryptoTrading #Binance #Altcoins #TradingSetup #CryptoAnalysis
175
翻訳参照
🚀 CGPTUSDT – BUY OPPORTUNITY | BULLISH SETUPCGPTUSDT is presenting a potential bullish trading opportunity. Buyers may take control if price holds the entry zone and bullish momentum develops.
$CGPT
📊 TRADE SETUP
🟢 Entry Zone: 0.01845 – 0.01860
🛑 Stop Loss: 0.01755
🎯 Take Profit Targets:
- TP1: 0.01920
- TP2: 0.01960
📈 Market Strategy
The entry zone is the key area to watch. A successful bounce with strong buying volume could push the price toward the first target at 0.01920.
If bullish momentum continues, the next potential target is 0.01960.
⚠️ Risk Management
- Avoid entering without confirmation.
- Always respect your stop loss.
- Don't risk more than you can afford to lose.
- Consider booking partial profits at TP1.
🔥 Stay disciplined. Trade the setup, not your emotions!
What do you think? Can CGPTUSDT reach 0.01960?
#CGPTUSDT #CryptoTrading #Binance #Altcoins #BuySignal #TechnicalAnalysis #CryptoMarket
{future}(CGPTUSDT)
🚀 CGPTUSDT – BUY OPPORTUNITY | BULLISH SETUP
CGPTUSDT is presenting a potential bullish trading opportunity. Buyers may take control if price holds the entry zone and bullish momentum develops.
$CGPT
📊 TRADE SETUP
🟢 Entry Zone: 0.01845 – 0.01860
🛑 Stop Loss: 0.01755
🎯 Take Profit Targets:
- TP1: 0.01920
- TP2: 0.01960
📈 Market Strategy
The entry zone is the key area to watch. A successful bounce with strong buying volume could push the price toward the first target at 0.01920.
If bullish momentum continues, the next potential target is 0.01960.
⚠️ Risk Management
- Avoid entering without confirmation.
- Always respect your stop loss.
- Don't risk more than you can afford to lose.
- Consider booking partial profits at TP1.
🔥 Stay disciplined. Trade the setup, not your emotions!
What do you think? Can CGPTUSDT reach 0.01960?
#CGPTUSDT #CryptoTrading #Binance #Altcoins #BuySignal #TechnicalAnalysis #CryptoMarket
$CGPT
📊 TRADE SETUP
🟢 Entry Zone: 0.01845 – 0.01860
🛑 Stop Loss: 0.01755
🎯 Take Profit Targets:
- TP1: 0.01920
- TP2: 0.01960
📈 Market Strategy
The entry zone is the key area to watch. A successful bounce with strong buying volume could push the price toward the first target at 0.01920.
If bullish momentum continues, the next potential target is 0.01960.
⚠️ Risk Management
- Avoid entering without confirmation.
- Always respect your stop loss.
- Don't risk more than you can afford to lose.
- Consider booking partial profits at TP1.
🔥 Stay disciplined. Trade the setup, not your emotions!
What do you think? Can CGPTUSDT reach 0.01960?
#CGPTUSDT #CryptoTrading #Binance #Altcoins #BuySignal #TechnicalAnalysis #CryptoMarket
407
記事
翻訳参照
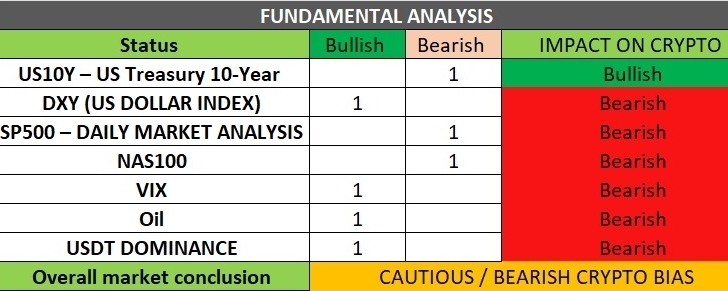
🚨 WHY ARE CRYPTO & GOLD FACING BEARISH PRESSURE? | MACRO MARKET ANALYSIS 📉Markets are not moving randomly. Behind the current bearish sentiment in Bitcoin, altcoins, and Gold, several important macroeconomic indicators are worth monitoring.
Let's break down the 7 key indicators that every serious trader should understand before taking their next position.
1️⃣ US10Y – US TREASURY 10-YEAR YIELD
📊 Key Levels:
- Previous rally: 4.55% → 5.326%
- Current support zone: 4.928%
- Important psychological level: 5.00%
US10Y has shown weakening momentum after rejection from 5.326%.
🔎 What to watch:
- Falling yields may provide relief for Bitcoin, Gold, and other risk assets.
- A recovery above 5% could bring renewed pressure.
2️⃣ DXY – US DOLLAR INDEX
📊 Current Reference: 101.963
The US Dollar Index is showing bullish momentum.
A stronger dollar generally creates headwinds for:
- Bitcoin and cryptocurrencies.
- Gold (XAUUSD).
- Other dollar-denominated assets.
A DXY reversal towards the downside could provide an opportunity for BTC and Gold to recover.
3️⃣ S&P 500 – BEARISH BREAKDOWN WARNING
📊 Reference Level: 7,577.7
Weakness in the S&P 500 can indicate declining investor confidence and increasing risk-off sentiment.
Potential impact:
- Bitcoin may experience additional selling pressure.
- Altcoins could face stronger downside volatility.
- Gold may attract safe-haven demand, although dollar strength and yields can limit its upside.
4️⃣ NASDAQ 100 – TECHNOLOGY MARKET WEAKNESS
NASDAQ 100 weakness is another important warning signal.
Technology stocks are generally sensitive to interest rates and liquidity conditions.
If NAS100 continues declining:
- Risk appetite may weaken.
- Bitcoin and altcoins could face additional selling.
- Investors may reduce exposure to high-risk assets.
Watch DXY and Treasury yields for confirmation.
5️⃣ VIX – RISING MARKET FEAR
📊 Reference Level: 19.41
VIX measures expected volatility in the US stock market.
When VIX rises sharply, it can indicate increasing uncertainty and fear.
Possible market impact:
- BTC: Higher volatility and potential selling pressure.
- Altcoins: Increased downside risk.
- Gold: Potential safe-haven demand, but short-term selling is also possible.
- USD: May benefit from safe-haven demand.
Remember: Rising VIX does not automatically mean every asset will fall.
6️⃣ CRUDE OIL – THE INFLATION FACTOR 🛢️
Oil is more than just a commodity. It is an important indicator of global inflation, supply-demand dynamics, and geopolitical risk.
Why should crypto and Gold traders monitor oil?
- Higher oil prices can increase inflation expectations.
- Persistent inflation may keep interest rates higher for longer.
- Higher yields and a stronger dollar can pressure Gold and crypto.
- Geopolitical uncertainty can increase safe-haven demand.
Oil's impact depends on how inflation expectations, monetary policy, and the dollar respond.
7️⃣ USDT DOMINANCE – CRYPTO RISK-OFF SIGNAL
📊 Current Structure: Bullish Recovery
USDT Dominance is showing a bullish short-term structure.
This is an important indicator for crypto traders.
When USDT.D rises, it can suggest that investors are moving towards stablecoins instead of holding BTC and altcoins.
What this means:
- Increasing USDT.D = Potential bearish pressure on crypto.
- Decreasing USDT.D = Potential recovery in BTC and altcoins.
Watch this chart alongside BTC market structure before entering trades.
---
🎯 MY OVERALL MARKET OUTLOOK
The combination of a stronger DXY, uncertain Treasury yields, weakness in major equity indices, rising VIX, and bullish USDT Dominance creates a cautious environment for crypto markets.
However, Gold and Bitcoin do not always move in the same direction.
Gold can benefit from safe-haven demand, while Bitcoin may behave more like a risk asset during periods of market stress.
🔥 WHAT SHOULD TRADERS DO NOW?
1. Avoid entering trades based on one indicator.
2. Monitor DXY and US10Y for macro confirmation.
3. Watch S&P 500 and NAS100 for risk sentiment.
4. Track VIX for volatility changes.
5. Monitor USDT.D for crypto market positioning.
6. Wait for technical confirmation before opening LONG or SHORT positions.
7. Protect capital with proper stop-loss management.
MY MESSAGE TO TRADERS:
Don't trade against the macro environment without a clear setup. Understand liquidity, monitor economic indicators, and let price action confirm your decision.
📌 What do you think?
Are we preparing for another bearish move in BTC and Gold, or could a reversal in DXY and US Treasury yields trigger a strong recovery?
$BTC $XAU
Share your analysis below! 👇
#Bitcoin #BTC #CryptoMarket #Gold #XAUUSD #DXY #US10Y #SP500 #NASDAQ #VIX #USDTDominance #MacroAnalysis #TradingStrategy
🚨 WHY ARE CRYPTO & GOLD FACING BEARISH PRESSURE? | MACRO MARKET ANALYSIS 📉
Markets are not moving randomly. Behind the current bearish sentiment in Bitcoin, altcoins, and Gold, several important macroeconomic indicators are worth monitoring.
Let's break down the 7 key indicators that every serious trader should understand before taking their next position.
1️⃣ US10Y – US TREASURY 10-YEAR YIELD
📊 Key Levels:
- Previous rally: 4.55% → 5.326%
- Current support zone: 4.928%
- Important psychological level: 5.00%
US10Y has shown weakening momentum after rejection from 5.326%.
🔎 What to watch:
- Falling yields may provide relief for Bitcoin, Gold, and other risk assets.
- A recovery above 5% could bring renewed pressure.
2️⃣ DXY – US DOLLAR INDEX
📊 Current Reference: 101.963
The US Dollar Index is showing bullish momentum.
A stronger dollar generally creates headwinds for:
- Bitcoin and cryptocurrencies.
- Gold (XAUUSD).
- Other dollar-denominated assets.
A DXY reversal towards the downside could provide an opportunity for BTC and Gold to recover.
3️⃣ S&P 500 – BEARISH BREAKDOWN WARNING
📊 Reference Level: 7,577.7
Weakness in the S&P 500 can indicate declining investor confidence and increasing risk-off sentiment.
Potential impact:
- Bitcoin may experience additional selling pressure.
- Altcoins could face stronger downside volatility.
- Gold may attract safe-haven demand, although dollar strength and yields can limit its upside.
4️⃣ NASDAQ 100 – TECHNOLOGY MARKET WEAKNESS
NASDAQ 100 weakness is another important warning signal.
Technology stocks are generally sensitive to interest rates and liquidity conditions.
If NAS100 continues declining:
- Risk appetite may weaken.
- Bitcoin and altcoins could face additional selling.
- Investors may reduce exposure to high-risk assets.
Watch DXY and Treasury yields for confirmation.
5️⃣ VIX – RISING MARKET FEAR
📊 Reference Level: 19.41
VIX measures expected volatility in the US stock market.
When VIX rises sharply, it can indicate increasing uncertainty and fear.
Possible market impact:
- BTC: Higher volatility and potential selling pressure.
- Altcoins: Increased downside risk.
- Gold: Potential safe-haven demand, but short-term selling is also possible.
- USD: May benefit from safe-haven demand.
Remember: Rising VIX does not automatically mean every asset will fall.
6️⃣ CRUDE OIL – THE INFLATION FACTOR 🛢️
Oil is more than just a commodity. It is an important indicator of global inflation, supply-demand dynamics, and geopolitical risk.
Why should crypto and Gold traders monitor oil?
- Higher oil prices can increase inflation expectations.
- Persistent inflation may keep interest rates higher for longer.
- Higher yields and a stronger dollar can pressure Gold and crypto.
- Geopolitical uncertainty can increase safe-haven demand.
Oil's impact depends on how inflation expectations, monetary policy, and the dollar respond.
7️⃣ USDT DOMINANCE – CRYPTO RISK-OFF SIGNAL
📊 Current Structure: Bullish Recovery
USDT Dominance is showing a bullish short-term structure.
This is an important indicator for crypto traders.
When USDT.D rises, it can suggest that investors are moving towards stablecoins instead of holding BTC and altcoins.
What this means:
- Increasing USDT.D = Potential bearish pressure on crypto.
- Decreasing USDT.D = Potential recovery in BTC and altcoins.
Watch this chart alongside BTC market structure before entering trades.
---
🎯 MY OVERALL MARKET OUTLOOK
The combination of a stronger DXY, uncertain Treasury yields, weakness in major equity indices, rising VIX, and bullish USDT Dominance creates a cautious environment for crypto markets.
However, Gold and Bitcoin do not always move in the same direction.
Gold can benefit from safe-haven demand, while Bitcoin may behave more like a risk asset during periods of market stress.
🔥 WHAT SHOULD TRADERS DO NOW?
1. Avoid entering trades based on one indicator.
2. Monitor DXY and US10Y for macro confirmation.
3. Watch S&P 500 and NAS100 for risk sentiment.
4. Track VIX for volatility changes.
5. Monitor USDT.D for crypto market positioning.
6. Wait for technical confirmation before opening LONG or SHORT positions.
7. Protect capital with proper stop-loss management.
MY MESSAGE TO TRADERS:
Don't trade against the macro environment without a clear setup. Understand liquidity, monitor economic indicators, and let price action confirm your decision.
📌 What do you think?
Are we preparing for another bearish move in BTC and Gold, or could a reversal in DXY and US Treasury yields trigger a strong recovery?
$BTC $XAU
Share your analysis below! 👇
#Bitcoin #BTC #CryptoMarket #Gold #XAUUSD #DXY #US10Y #SP500 #NASDAQ #VIX #USDTDominance #MacroAnalysis #TradingStrategy
Let's break down the 7 key indicators that every serious trader should understand before taking their next position.
1️⃣ US10Y – US TREASURY 10-YEAR YIELD
📊 Key Levels:
- Previous rally: 4.55% → 5.326%
- Current support zone: 4.928%
- Important psychological level: 5.00%
US10Y has shown weakening momentum after rejection from 5.326%.
🔎 What to watch:
- Falling yields may provide relief for Bitcoin, Gold, and other risk assets.
- A recovery above 5% could bring renewed pressure.
2️⃣ DXY – US DOLLAR INDEX
📊 Current Reference: 101.963
The US Dollar Index is showing bullish momentum.
A stronger dollar generally creates headwinds for:
- Bitcoin and cryptocurrencies.
- Gold (XAUUSD).
- Other dollar-denominated assets.
A DXY reversal towards the downside could provide an opportunity for BTC and Gold to recover.
3️⃣ S&P 500 – BEARISH BREAKDOWN WARNING
📊 Reference Level: 7,577.7
Weakness in the S&P 500 can indicate declining investor confidence and increasing risk-off sentiment.
Potential impact:
- Bitcoin may experience additional selling pressure.
- Altcoins could face stronger downside volatility.
- Gold may attract safe-haven demand, although dollar strength and yields can limit its upside.
4️⃣ NASDAQ 100 – TECHNOLOGY MARKET WEAKNESS
NASDAQ 100 weakness is another important warning signal.
Technology stocks are generally sensitive to interest rates and liquidity conditions.
If NAS100 continues declining:
- Risk appetite may weaken.
- Bitcoin and altcoins could face additional selling.
- Investors may reduce exposure to high-risk assets.
Watch DXY and Treasury yields for confirmation.
5️⃣ VIX – RISING MARKET FEAR
📊 Reference Level: 19.41
VIX measures expected volatility in the US stock market.
When VIX rises sharply, it can indicate increasing uncertainty and fear.
Possible market impact:
- BTC: Higher volatility and potential selling pressure.
- Altcoins: Increased downside risk.
- Gold: Potential safe-haven demand, but short-term selling is also possible.
- USD: May benefit from safe-haven demand.
Remember: Rising VIX does not automatically mean every asset will fall.
6️⃣ CRUDE OIL – THE INFLATION FACTOR 🛢️
Oil is more than just a commodity. It is an important indicator of global inflation, supply-demand dynamics, and geopolitical risk.
Why should crypto and Gold traders monitor oil?
- Higher oil prices can increase inflation expectations.
- Persistent inflation may keep interest rates higher for longer.
- Higher yields and a stronger dollar can pressure Gold and crypto.
- Geopolitical uncertainty can increase safe-haven demand.
Oil's impact depends on how inflation expectations, monetary policy, and the dollar respond.
7️⃣ USDT DOMINANCE – CRYPTO RISK-OFF SIGNAL
📊 Current Structure: Bullish Recovery
USDT Dominance is showing a bullish short-term structure.
This is an important indicator for crypto traders.
When USDT.D rises, it can suggest that investors are moving towards stablecoins instead of holding BTC and altcoins.
What this means:
- Increasing USDT.D = Potential bearish pressure on crypto.
- Decreasing USDT.D = Potential recovery in BTC and altcoins.
Watch this chart alongside BTC market structure before entering trades.
---
🎯 MY OVERALL MARKET OUTLOOK
The combination of a stronger DXY, uncertain Treasury yields, weakness in major equity indices, rising VIX, and bullish USDT Dominance creates a cautious environment for crypto markets.
However, Gold and Bitcoin do not always move in the same direction.
Gold can benefit from safe-haven demand, while Bitcoin may behave more like a risk asset during periods of market stress.
🔥 WHAT SHOULD TRADERS DO NOW?
1. Avoid entering trades based on one indicator.
2. Monitor DXY and US10Y for macro confirmation.
3. Watch S&P 500 and NAS100 for risk sentiment.
4. Track VIX for volatility changes.
5. Monitor USDT.D for crypto market positioning.
6. Wait for technical confirmation before opening LONG or SHORT positions.
7. Protect capital with proper stop-loss management.
MY MESSAGE TO TRADERS:
Don't trade against the macro environment without a clear setup. Understand liquidity, monitor economic indicators, and let price action confirm your decision.
📌 What do you think?
Are we preparing for another bearish move in BTC and Gold, or could a reversal in DXY and US Treasury yields trigger a strong recovery?
$BTC $XAU
Share your analysis below! 👇
#Bitcoin #BTC #CryptoMarket #Gold #XAUUSD #DXY #US10Y #SP500 #NASDAQ #VIX #USDTDominance #MacroAnalysis #TradingStrategy
421
翻訳参照
🥈 SILVER/USDT – BUY SIGNAL 🚀 | POTENTIAL UPSIDE AHEAD!Silver is showing a potential bullish opportunity. Traders can watch the 49.40 entry zone for a possible upward move toward the next resistance levels.
📊 Trading Setup
🔹 Pair: SILVER/USDT
🔹 Platform: MEXC
🟢 Buy Entry: 49.40
🎯 Take Profit Targets:
- TP1: 49.90
- TP2: 50.50
- TP3: 53.90
🛑 Stop Loss: 48.00
📈 Trade Strategy:
- Wait for price confirmation around the entry zone.
- Consider securing partial profits at TP1 and TP2.
- Let the remaining position target TP3 if bullish momentum continues.
- Always respect your stop loss and manage risk.
⚠️ Risk Management: Never risk more than you can afford to lose. Avoid entering blindly, and remember that market conditions can change quickly.
💬 **What is your target for Silver? TP1, TP2, or TP3?
#SILVER #SILVERUSDT #TradingSignal #CryptoTrading #MEXC #TechnicalAnalysis #TradingPapa
🥈 SILVER/USDT – BUY SIGNAL 🚀 | POTENTIAL UPSIDE AHEAD!
Silver is showing a potential bullish opportunity. Traders can watch the 49.40 entry zone for a possible upward move toward the next resistance levels.
📊 Trading Setup
🔹 Pair: SILVER/USDT
🔹 Platform: MEXC
🟢 Buy Entry: 49.40
🎯 Take Profit Targets:
- TP1: 49.90
- TP2: 50.50
- TP3: 53.90
🛑 Stop Loss: 48.00
📈 Trade Strategy:
- Wait for price confirmation around the entry zone.
- Consider securing partial profits at TP1 and TP2.
- Let the remaining position target TP3 if bullish momentum continues.
- Always respect your stop loss and manage risk.
⚠️ Risk Management: Never risk more than you can afford to lose. Avoid entering blindly, and remember that market conditions can change quickly.
💬 **What is your target for Silver? TP1, TP2, or TP3?
#SILVER #SILVERUSDT #TradingSignal #CryptoTrading #MEXC #TechnicalAnalysis #TradingPapa
📊 Trading Setup
🔹 Pair: SILVER/USDT
🔹 Platform: MEXC
🟢 Buy Entry: 49.40
🎯 Take Profit Targets:
- TP1: 49.90
- TP2: 50.50
- TP3: 53.90
🛑 Stop Loss: 48.00
📈 Trade Strategy:
- Wait for price confirmation around the entry zone.
- Consider securing partial profits at TP1 and TP2.
- Let the remaining position target TP3 if bullish momentum continues.
- Always respect your stop loss and manage risk.
⚠️ Risk Management: Never risk more than you can afford to lose. Avoid entering blindly, and remember that market conditions can change quickly.
💬 **What is your target for Silver? TP1, TP2, or TP3?
#SILVER #SILVERUSDT #TradingSignal #CryptoTrading #MEXC #TechnicalAnalysis #TradingPapa
210
記事
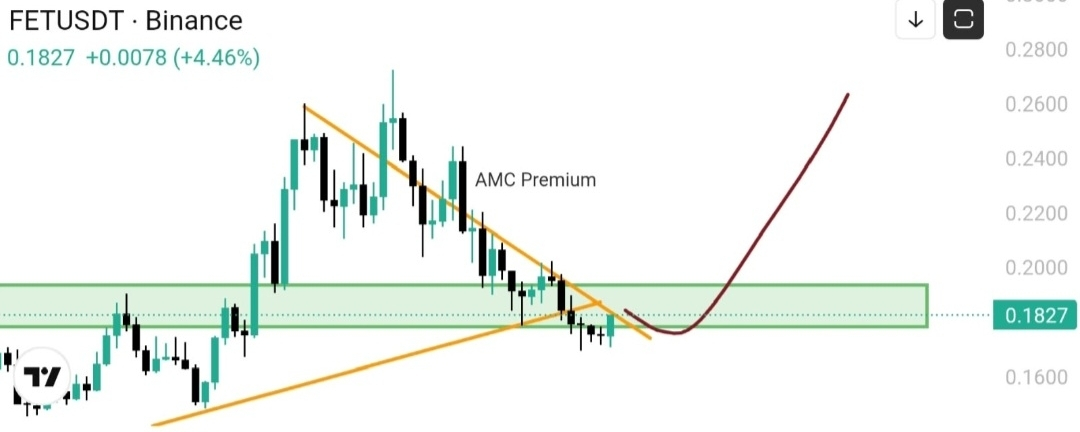
FETの買いセットアップ 🚀🔥🔥タイトル:FETは0.1827ドルで底打ち?このチャートパターンに注目している理由🧐
FETは現在0.1827ドル付近で取引されており、過去24時間で+4.46%上昇しています。チャートを見ると、よく見られるパターンが形成されています。下降ウェッジが主要な需要ゾーンに到達しています。
このチャートパターンについて、率直な見方をお伝えします。今は重要な転換点に差しかかっており、反発する可能性が高いと見ています。
🔍 このチャートが重要な理由
黄色の下降トレンドラインがFETの価格を強く抑え込んでいる一方で、下側のオレンジ色のサポートラインは価格を押し上げています。この2本のラインは、緑色の需要ゾーン(およそ0.17~0.19ドル)に向かって収束しています。価格は現在、このゾーン内でもみ合いながら下抜けておらず、売り圧力が弱まりつつあることを示しています。
FETの買いセットアップ 🚀🔥🔥
タイトル:FETは0.1827ドルで底打ち?このチャートパターンに注目している理由🧐
FETは現在0.1827ドル付近で取引されており、過去24時間で+4.46%上昇しています。チャートを見ると、よく見られるパターンが形成されています。下降ウェッジが主要な需要ゾーンに到達しています。
このチャートパターンについて、率直な見方をお伝えします。今は重要な転換点に差しかかっており、反発する可能性が高いと見ています。
🔍 このチャートが重要な理由
黄色の下降トレンドラインがFETの価格を強く抑え込んでいる一方で、下側のオレンジ色のサポートラインは価格を押し上げています。この2本のラインは、緑色の需要ゾーン(およそ0.17~0.19ドル)に向かって収束しています。価格は現在、このゾーン内でもみ合いながら下抜けておらず、売り圧力が弱まりつつあることを示しています。
FETは現在0.1827ドル付近で取引されており、過去24時間で+4.46%上昇しています。チャートを見ると、よく見られるパターンが形成されています。下降ウェッジが主要な需要ゾーンに到達しています。
このチャートパターンについて、率直な見方をお伝えします。今は重要な転換点に差しかかっており、反発する可能性が高いと見ています。
🔍 このチャートが重要な理由
黄色の下降トレンドラインがFETの価格を強く抑え込んでいる一方で、下側のオレンジ色のサポートラインは価格を押し上げています。この2本のラインは、緑色の需要ゾーン(およそ0.17~0.19ドル)に向かって収束しています。価格は現在、このゾーン内でもみ合いながら下抜けておらず、売り圧力が弱まりつつあることを示しています。
1
341
記事
翻訳参照
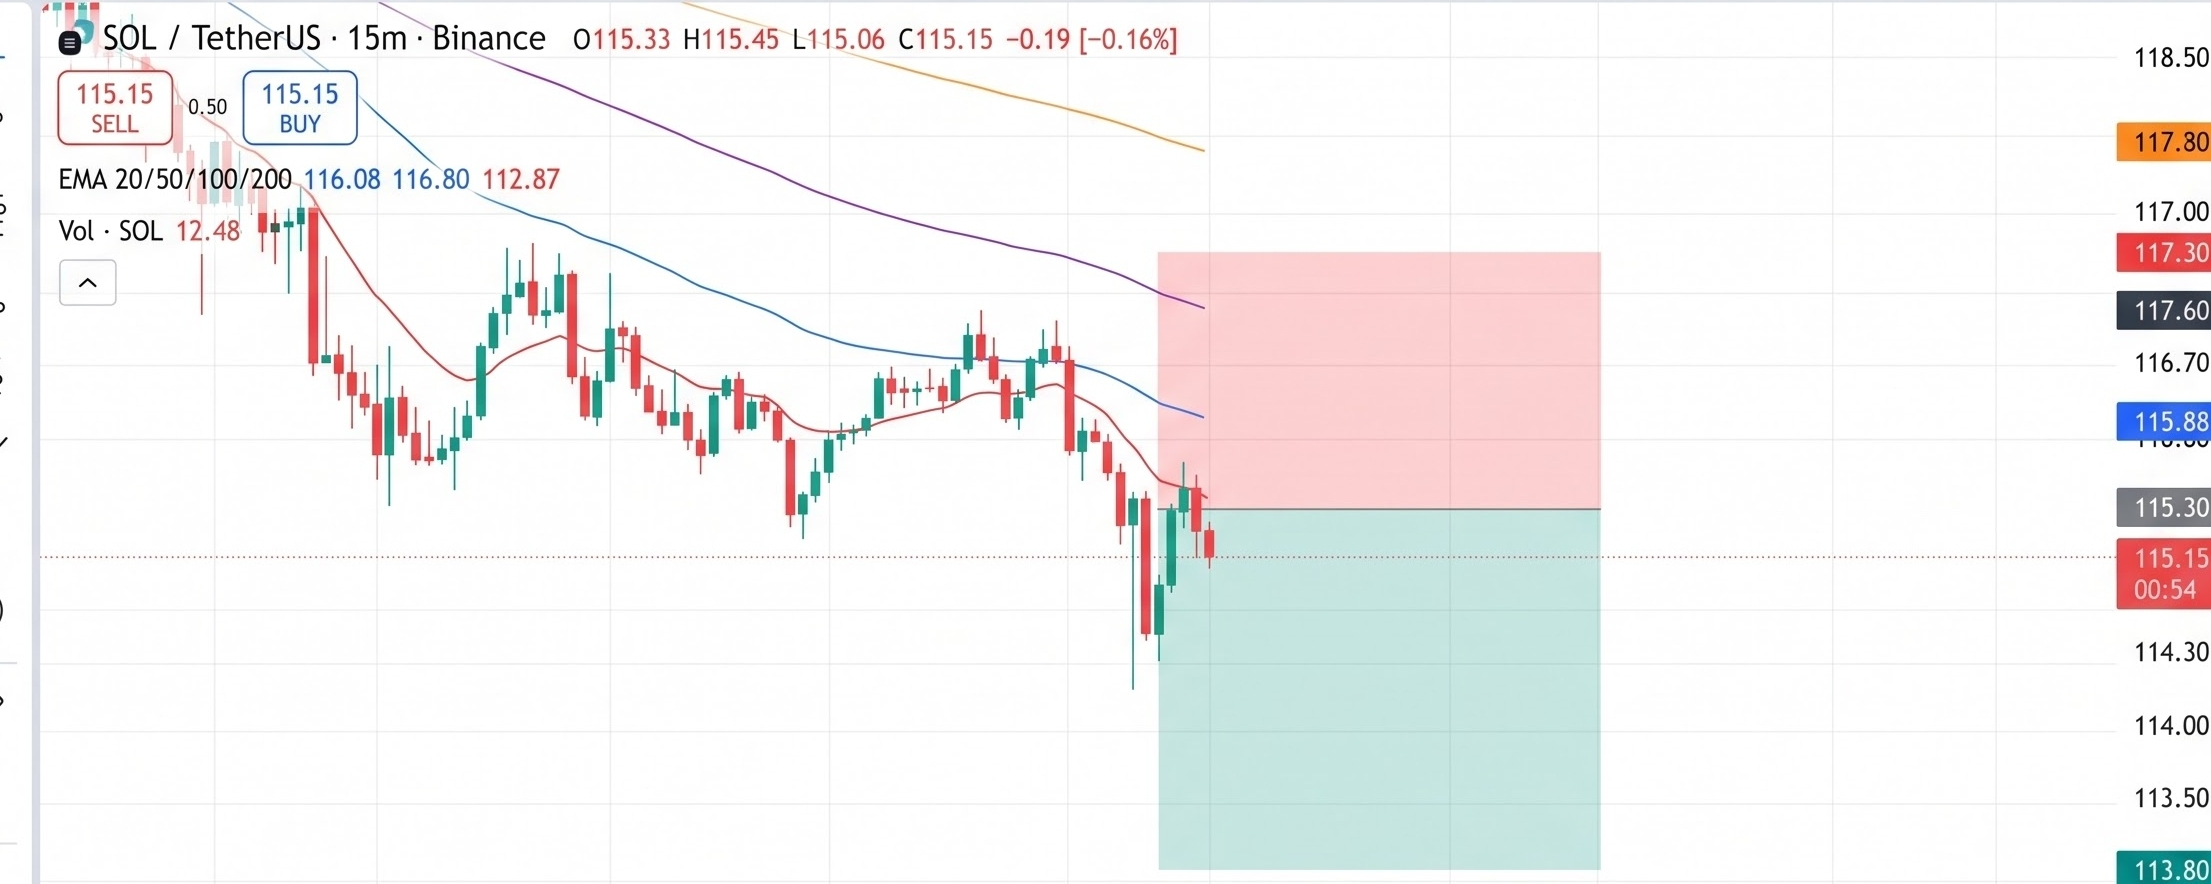
📉 $SOL/USDT Intraday Setup: Bearish Rejection at Key EMAsPair: $SOL / USDT
Timeframe: 15-Minute (15m)
Current Level: ~$115.15
🔍 Technical Overview
On the 15-minute chart, Solana ($SOL) continues to face heavy resistance after failing to sustain upward momentum above the $116.80 – $117.30 zone.
* Moving Average Resistance: Price action remains pinned beneath the dynamic resistance cluster formed by the 50, 100, and 200 EMAs (116.08 / 116.80 / 112.87). Each retest of these moving averages has met swift selling pressure.
* Breakdown Structure: The recent breakdown below the local support shelf near $115.30 signals continued bearish continuation towards recent intraday liquidity pools.
* Volume Confirmation: Spikes in sell volume around breakdown candles indicate active distribution.
🎯 Setup Breakdown (Short Bias)
* Entry Zone: $115.15 – $115.30 (retest of broken support)
* Stop Loss (SL): $117.30 (above the EMA cluster and recent swing high)
* Target 1 (TP1): $113.80
* Target 2 (TP2): $112.50 – $112.00 (key session demand zone)
* Risk/Reward Ratio: ~1:1.6 to 1:2.0+
⚠️ Key Risk Factors
A decisive 15m candle close back above $116.80 invalidates the bearish momentum and could trigger a short squeeze towards the $118.50 resistance ceiling. Manage position sizing and risk accordingly.
Disclaimer: This content is for educational and informational purposes only and does not constitute financial or investment advice. Always Do Your Own Research (DYOR) and apply strict risk management.
#Solana #SOL #CryptoTrading #TechnicalAnalysis #BinanceSquare #TradingSetup
$SOL
{future}(SOLUSDT)
📉 $SOL/USDT Intraday Setup: Bearish Rejection at Key EMAs
Pair: $SOL / USDT
Timeframe: 15-Minute (15m)
Current Level: ~$115.15
🔍 Technical Overview
On the 15-minute chart, Solana ($SOL ) continues to face heavy resistance after failing to sustain upward momentum above the $116.80 – $117.30 zone.
* Moving Average Resistance: Price action remains pinned beneath the dynamic resistance cluster formed by the 50, 100, and 200 EMAs (116.08 / 116.80 / 112.87). Each retest of these moving averages has met swift selling pressure.
* Breakdown Structure: The recent breakdown below the local support shelf near $115.30 signals continued bearish continuation towards recent intraday liquidity pools.
* Volume Confirmation: Spikes in sell volume around breakdown candles indicate active distribution.
🎯 Setup Breakdown (Short Bias)
* Entry Zone: $115.15 – $115.30 (retest of broken support)
* Stop Loss (SL): $117.30 (above the EMA cluster and recent swing high)
* Target 1 (TP1): $113.80
* Target 2 (TP2): $112.50 – $112.00 (key session demand zone)
* Risk/Reward Ratio: ~1:1.6 to 1:2.0+
⚠️ Key Risk Factors
A decisive 15m candle close back above $116.80 invalidates the bearish momentum and could trigger a short squeeze towards the $118.50 resistance ceiling. Manage position sizing and risk accordingly.
Disclaimer: This content is for educational and informational purposes only and does not constitute financial or investment advice. Always Do Your Own Research (DYOR) and apply strict risk management.
#Solana #SOL #CryptoTrading #TechnicalAnalysis #BinanceSquare #TradingSetup
$SOL
Timeframe: 15-Minute (15m)
Current Level: ~$115.15
🔍 Technical Overview
On the 15-minute chart, Solana ($SOL ) continues to face heavy resistance after failing to sustain upward momentum above the $116.80 – $117.30 zone.
* Moving Average Resistance: Price action remains pinned beneath the dynamic resistance cluster formed by the 50, 100, and 200 EMAs (116.08 / 116.80 / 112.87). Each retest of these moving averages has met swift selling pressure.
* Breakdown Structure: The recent breakdown below the local support shelf near $115.30 signals continued bearish continuation towards recent intraday liquidity pools.
* Volume Confirmation: Spikes in sell volume around breakdown candles indicate active distribution.
🎯 Setup Breakdown (Short Bias)
* Entry Zone: $115.15 – $115.30 (retest of broken support)
* Stop Loss (SL): $117.30 (above the EMA cluster and recent swing high)
* Target 1 (TP1): $113.80
* Target 2 (TP2): $112.50 – $112.00 (key session demand zone)
* Risk/Reward Ratio: ~1:1.6 to 1:2.0+
⚠️ Key Risk Factors
A decisive 15m candle close back above $116.80 invalidates the bearish momentum and could trigger a short squeeze towards the $118.50 resistance ceiling. Manage position sizing and risk accordingly.
Disclaimer: This content is for educational and informational purposes only and does not constitute financial or investment advice. Always Do Your Own Research (DYOR) and apply strict risk management.
#Solana #SOL #CryptoTrading #TechnicalAnalysis #BinanceSquare #TradingSetup
$SOL
1
193
·
--
ブリッシュ
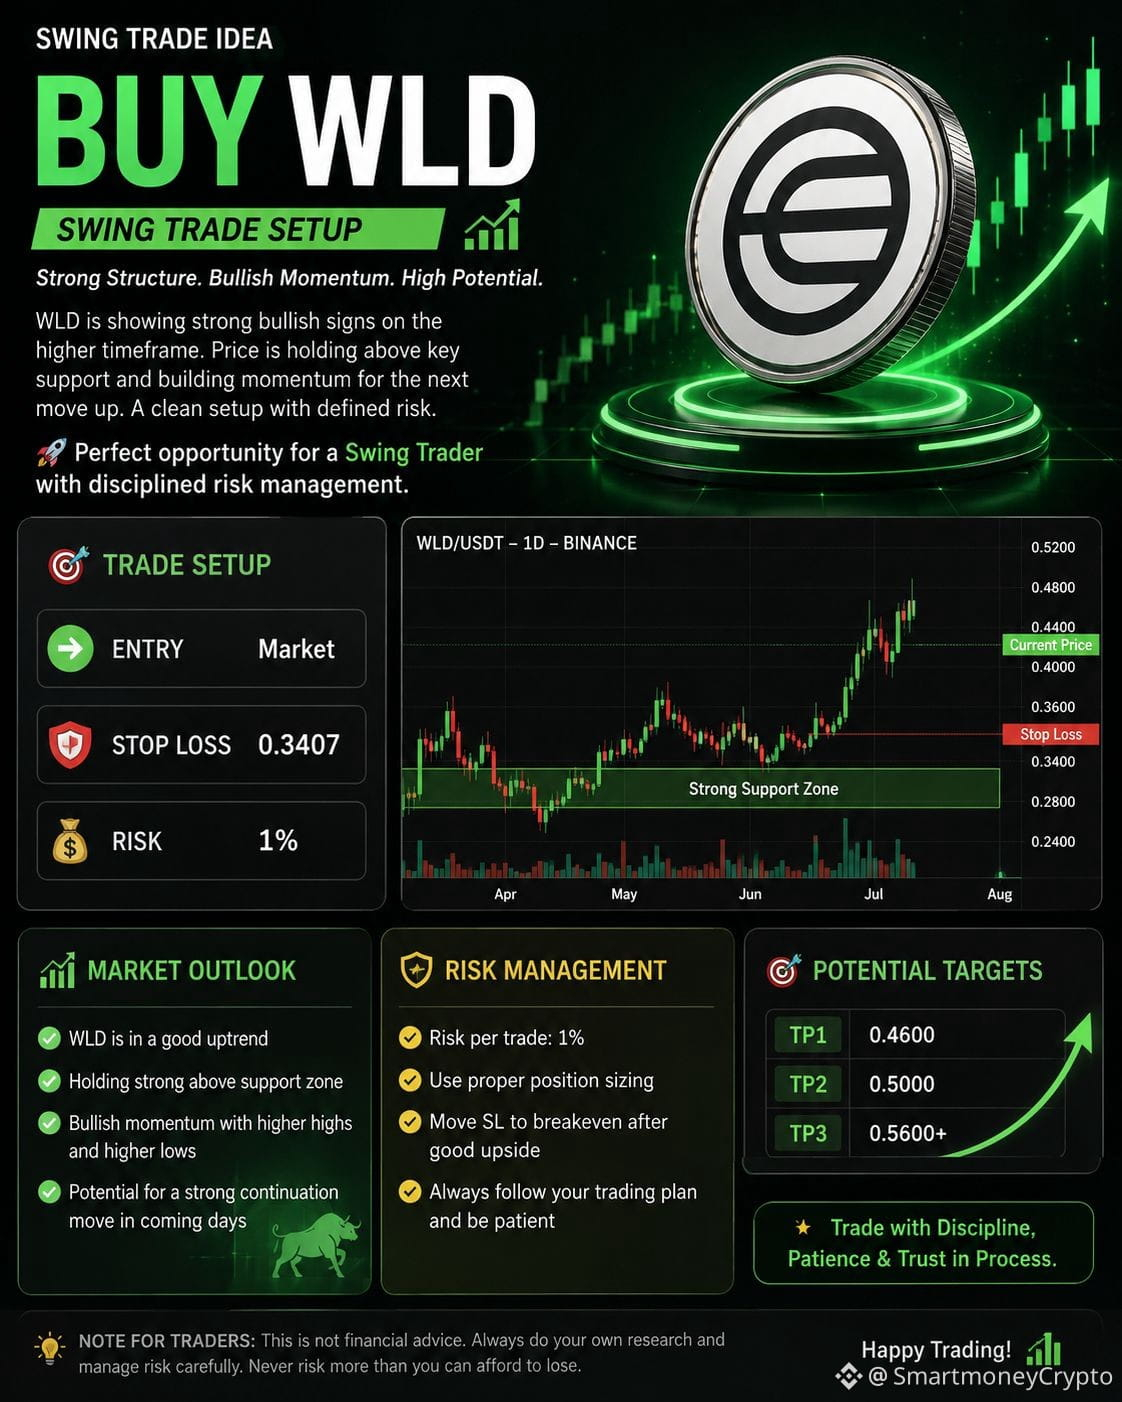
WLDをBUY — スイングトレードの機会
Worldcoin(WLD)は、管理されたリスクと規律ある実行に焦点を当てた、スイングトレードのセットアップの可能性として注目されています。
📊 トレードのセットアップ
- 🟢 エントリー:マーケット
- 🛑 ストップロス:0.3407
- 💰 リスク:1%/1トレード
- 📈 戦略:スイングトレード
🔥 市場見通し
WLDは強気のモメンタムを示しており、このセットアップは次の継続的な値動きに参加する機会を提供します。とはいえ、暗号資産市場は素早く動くため、事前に設定したストップロスと最大1%のリスクが重要です。
重要なのは、単に利益の出るエントリーを見つけることではありません。ポジションを正しく管理することが鍵です。トレーダーは過度なレバレッジを避け、適切なポジションサイズを用い、セットアップが無効になった場合はストップロスを尊重すべきです。
🎯 取引の方針
あなたの戦略に従ってマーケットでエントリーし、ストップロスは0.3407に維持しながら、トレードの進行に合わせて値動きを監視します。市場があなたに有利に強く動いた場合は、無理にリスクを増やすのではなく、利益を保護することを検討してください。
リスク管理が最優先です。1回のトレードが口座全体を傷つけてよいことは決してありません。
⚠️ これは取引のセットアップであり、保証された金融アドバイスではありません。必ずご自身で調査を行い、失っても構わない資金でのみ取引してください。
$WLD
{spot}(WLDUSDT)
WLDをBUY — スイングトレードの機会
Worldcoin(WLD)は、管理されたリスクと規律ある実行に焦点を当てた、スイングトレードのセットアップの可能性として注目されています。
📊 トレードのセットアップ
- 🟢 エントリー:マーケット
- 🛑 ストップロス:0.3407
- 💰 リスク:1%/1トレード
- 📈 戦略:スイングトレード
🔥 市場見通し
WLDは強気のモメンタムを示しており、このセットアップは次の継続的な値動きに参加する機会を提供します。とはいえ、暗号資産市場は素早く動くため、事前に設定したストップロスと最大1%のリスクが重要です。
重要なのは、単に利益の出るエントリーを見つけることではありません。ポジションを正しく管理することが鍵です。トレーダーは過度なレバレッジを避け、適切なポジションサイズを用い、セットアップが無効になった場合はストップロスを尊重すべきです。
🎯 取引の方針
あなたの戦略に従ってマーケットでエントリーし、ストップロスは0.3407に維持しながら、トレードの進行に合わせて値動きを監視します。市場があなたに有利に強く動いた場合は、無理にリスクを増やすのではなく、利益を保護することを検討してください。
リスク管理が最優先です。1回のトレードが口座全体を傷つけてよいことは決してありません。
⚠️ これは取引のセットアップであり、保証された金融アドバイスではありません。必ずご自身で調査を行い、失っても構わない資金でのみ取引してください。
$WLD
Worldcoin(WLD)は、管理されたリスクと規律ある実行に焦点を当てた、スイングトレードのセットアップの可能性として注目されています。
📊 トレードのセットアップ
- 🟢 エントリー:マーケット
- 🛑 ストップロス:0.3407
- 💰 リスク:1%/1トレード
- 📈 戦略:スイングトレード
🔥 市場見通し
WLDは強気のモメンタムを示しており、このセットアップは次の継続的な値動きに参加する機会を提供します。とはいえ、暗号資産市場は素早く動くため、事前に設定したストップロスと最大1%のリスクが重要です。
重要なのは、単に利益の出るエントリーを見つけることではありません。ポジションを正しく管理することが鍵です。トレーダーは過度なレバレッジを避け、適切なポジションサイズを用い、セットアップが無効になった場合はストップロスを尊重すべきです。
🎯 取引の方針
あなたの戦略に従ってマーケットでエントリーし、ストップロスは0.3407に維持しながら、トレードの進行に合わせて値動きを監視します。市場があなたに有利に強く動いた場合は、無理にリスクを増やすのではなく、利益を保護することを検討してください。
リスク管理が最優先です。1回のトレードが口座全体を傷つけてよいことは決してありません。
⚠️ これは取引のセットアップであり、保証された金融アドバイスではありません。必ずご自身で調査を行い、失っても構わない資金でのみ取引してください。
$WLD
142
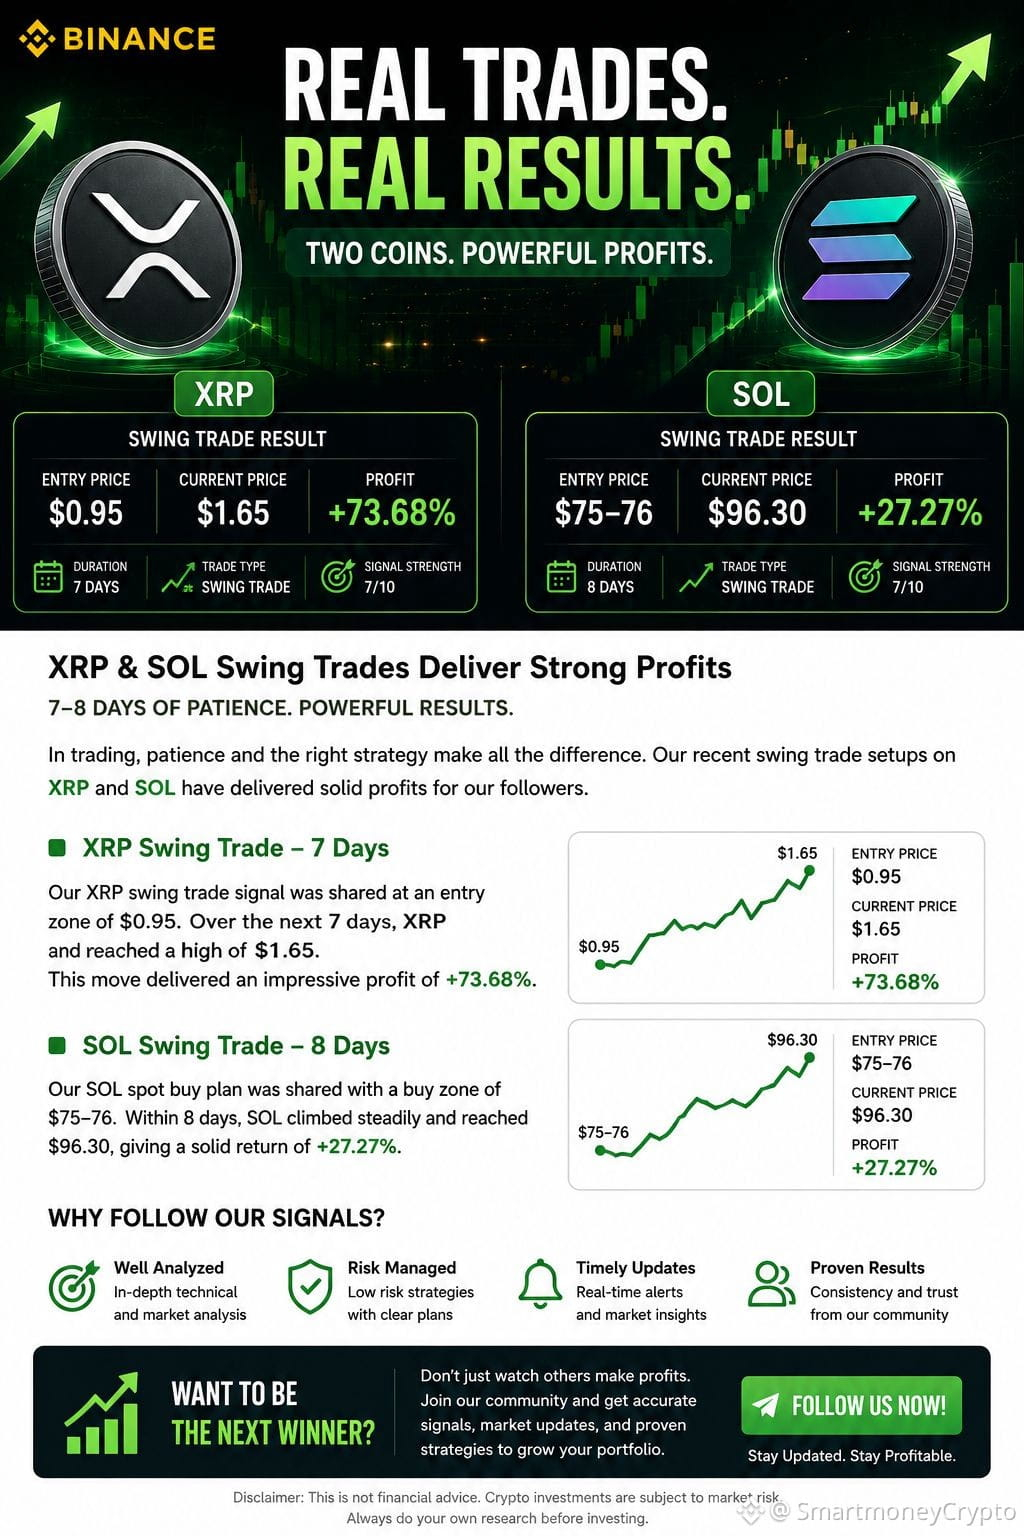
🚀 XRP & SOL: 7〜8日、2つの強力なスイングチャンス
結果はもちろん大事ですが、それと同じくらい「その裏にある戦略」も重要です。
最近、XRPとSOLでスイング/スポットのセットアップを共有しました。事前に定めたエントリーゾーン、リスク管理、そして明確な上昇目標があります。共有したセットアップに表示されていた価格に基づくと、どちらのコインも大きな値動きを見せました。
🟢 XRP — スイングトレード
エントリー: 約$0.95
値動き: $0.95 → $1.65
想定利益: +73.68%
取引期間: 7日
シグナルの強さ: 7/10
XRPは、セットアップが共有された後に強い値動きを見せました。重要なのは「百分率の上昇」だけではありません。すべてのローソク足を追いかけるのではなく、明確な計画、定義されたリスク、そして忍耐を持つことの大切さです。
🟣 SOL — スポットの積み増し
購入ゾーン: $75〜$76
値動き: $96.30へ向けて上昇
想定利益: おおよそ+27%〜28%(エントリー価格による)
取引期間: 8日
SOLのプランは、一度に全資金を投入するのではなく、段階的な積み増しに焦点を当てました。事前に定めた上昇ゾーンは$80、$85、$90+で、さらに長期では$100を超えた時点で再評価します。
📊 これらのトレードが示すこと
仮想通貨でチャンスを見つけるのに、毎時間トレードする必要はありません。規律あるアプローチなら、次に集中できます:
✅ 明確なエントリーゾーン
✅ 定義されたリスク
✅ 忍耐
✅ 事前に計画されたターゲット
✅ 定期的な市場アップデート
✅ FOMO(恐怖による焦り)や感情的な判断を避けること
今後の仮想通貨のセットアップを見つけたいなら、今後の市場分析、トレーディングアイデア、そしてエントリー/目標水準をわかりやすく説明する内容をフォローしてください。
トレードをそのまま真似しないでください。必ず自分で調査し、自分のリスクを管理してください。
⚠️ これらの結果は、それぞれのセットアップで共有されたエントリーと価格水準に基づくものです。将来のパフォーマンスを保証するものではなく、本コンテンツは投資助言ではありません。
#XRP #SOL #Solana #Ripple #CryptoTrading #SwingTrading #SpotTrading #Binance #CryptoSignals #TradingStrategy #RiskManagement #DYOR
🚀 XRP & SOL: 7〜8日、2つの強力なスイングチャンス
結果はもちろん大事ですが、それと同じくらい「その裏にある戦略」も重要です。
最近、XRPとSOLでスイング/スポットのセットアップを共有しました。事前に定めたエントリーゾーン、リスク管理、そして明確な上昇目標があります。共有したセットアップに表示されていた価格に基づくと、どちらのコインも大きな値動きを見せました。
🟢 XRP — スイングトレード
エントリー: 約$0.95
値動き: $0.95 → $1.65
想定利益: +73.68%
取引期間: 7日
シグナルの強さ: 7/10
XRPは、セットアップが共有された後に強い値動きを見せました。重要なのは「百分率の上昇」だけではありません。すべてのローソク足を追いかけるのではなく、明確な計画、定義されたリスク、そして忍耐を持つことの大切さです。
🟣 SOL — スポットの積み増し
購入ゾーン: $75〜$76
値動き: $96.30へ向けて上昇
想定利益: おおよそ+27%〜28%(エントリー価格による)
取引期間: 8日
SOLのプランは、一度に全資金を投入するのではなく、段階的な積み増しに焦点を当てました。事前に定めた上昇ゾーンは$80、$85、$90+で、さらに長期では$100を超えた時点で再評価します。
📊 これらのトレードが示すこと
仮想通貨でチャンスを見つけるのに、毎時間トレードする必要はありません。規律あるアプローチなら、次に集中できます:
✅ 明確なエントリーゾーン
✅ 定義されたリスク
✅ 忍耐
✅ 事前に計画されたターゲット
✅ 定期的な市場アップデート
✅ FOMO(恐怖による焦り)や感情的な判断を避けること
今後の仮想通貨のセットアップを見つけたいなら、今後の市場分析、トレーディングアイデア、そしてエントリー/目標水準をわかりやすく説明する内容をフォローしてください。
トレードをそのまま真似しないでください。必ず自分で調査し、自分のリスクを管理してください。
⚠️ これらの結果は、それぞれのセットアップで共有されたエントリーと価格水準に基づくものです。将来のパフォーマンスを保証するものではなく、本コンテンツは投資助言ではありません。
#XRP #SOL #Solana #Ripple #CryptoTrading #SwingTrading #SpotTrading #Binance #CryptoSignals #TradingStrategy #RiskManagement #DYOR
結果はもちろん大事ですが、それと同じくらい「その裏にある戦略」も重要です。
最近、XRPとSOLでスイング/スポットのセットアップを共有しました。事前に定めたエントリーゾーン、リスク管理、そして明確な上昇目標があります。共有したセットアップに表示されていた価格に基づくと、どちらのコインも大きな値動きを見せました。
🟢 XRP — スイングトレード
エントリー: 約$0.95
値動き: $0.95 → $1.65
想定利益: +73.68%
取引期間: 7日
シグナルの強さ: 7/10
XRPは、セットアップが共有された後に強い値動きを見せました。重要なのは「百分率の上昇」だけではありません。すべてのローソク足を追いかけるのではなく、明確な計画、定義されたリスク、そして忍耐を持つことの大切さです。
🟣 SOL — スポットの積み増し
購入ゾーン: $75〜$76
値動き: $96.30へ向けて上昇
想定利益: おおよそ+27%〜28%(エントリー価格による)
取引期間: 8日
SOLのプランは、一度に全資金を投入するのではなく、段階的な積み増しに焦点を当てました。事前に定めた上昇ゾーンは$80、$85、$90+で、さらに長期では$100を超えた時点で再評価します。
📊 これらのトレードが示すこと
仮想通貨でチャンスを見つけるのに、毎時間トレードする必要はありません。規律あるアプローチなら、次に集中できます:
✅ 明確なエントリーゾーン
✅ 定義されたリスク
✅ 忍耐
✅ 事前に計画されたターゲット
✅ 定期的な市場アップデート
✅ FOMO(恐怖による焦り)や感情的な判断を避けること
今後の仮想通貨のセットアップを見つけたいなら、今後の市場分析、トレーディングアイデア、そしてエントリー/目標水準をわかりやすく説明する内容をフォローしてください。
トレードをそのまま真似しないでください。必ず自分で調査し、自分のリスクを管理してください。
⚠️ これらの結果は、それぞれのセットアップで共有されたエントリーと価格水準に基づくものです。将来のパフォーマンスを保証するものではなく、本コンテンツは投資助言ではありません。
#XRP #SOL #Solana #Ripple #CryptoTrading #SwingTrading #SpotTrading #Binance #CryptoSignals #TradingStrategy #RiskManagement #DYOR
165
記事
DEXE Network:戦略的スイングトレード機会を見極める 🟢私たちはDEXEの直近の市場構造を分析しており、強力なブレイクアウトの可能性に向けて重要なテクニカル指標が一致しているのを確認しています。規律ある構造的なセットアップを探しているトレーダーにとって、この資産は有望な兆しを示しています。
以下に、確信度の高いスイングトレード計画の内訳を示します。
📊 セットアップ:DEXEの強気ロング・チャンス
私たちは、DEXEが主要なサポート水準を取り戻し、強い出来高のもとでしっかりと推移していることを根拠に、強気のエントリーを狙います。テクニカル面のストーリーは大きな上昇余地を示しており、複数日を見据えたスイングトレードの有力候補です。
DEXE Network:戦略的スイングトレード機会を見極める 🟢
私たちはDEXEの直近の市場構造を分析しており、強力なブレイクアウトの可能性に向けて重要なテクニカル指標が一致しているのを確認しています。規律ある構造的なセットアップを探しているトレーダーにとって、この資産は有望な兆しを示しています。
以下に、確信度の高いスイングトレード計画の内訳を示します。
📊 セットアップ:DEXEの強気ロング・チャンス
私たちは、DEXEが主要なサポート水準を取り戻し、強い出来高のもとでしっかりと推移していることを根拠に、強気のエントリーを狙います。テクニカル面のストーリーは大きな上昇余地を示しており、複数日を見据えたスイングトレードの有力候補です。
以下に、確信度の高いスイングトレード計画の内訳を示します。
📊 セットアップ:DEXEの強気ロング・チャンス
私たちは、DEXEが主要なサポート水準を取り戻し、強い出来高のもとでしっかりと推移していることを根拠に、強気のエントリーを狙います。テクニカル面のストーリーは大きな上昇余地を示しており、複数日を見据えたスイングトレードの有力候補です。
266
ログインして、さらにコンテンツを読む
厳選トピックで世界の暗号資産トレーダーの仲間入り
⚡️ 暗号資産に関する最新かつ有益な情報が見つかります。
💬 世界最大の暗号資産取引所から信頼されています。
👍 認証を受けたクリエイターから、有益なインサイトを得られます。
メール / 電話番号
トレンドトピック
BTCRebounds80K
閲覧回数 16,798
454人が討論中
$BTC ロング設定 ... 次の目標 81,923.14
バランスの取れたモメンタムシグナルとともに、上値レンジのブレイクアウトを確認
エントリー: 78,610.70 - 78,959.38 (ロング)
TP1: 79,831.07
TP2: 80,877.11
最終TP: 81,923.14
SL: 77,739.01
過去24時間で価格は上昇し、直近の24時間足の高値を上回って推移しました。4時間足の相対力指数は中立を保っているため、トレーダーはこの水準がサポートに転じるかどうかを注視しています。
78,610.70を維持する限り、相場構造は良好です
取引の際は必ず損切りを設定してください
取引 $BTC
投資助言ではありません。必ずご自身で調査してください。
毎日の取引分析とインサイダーニュースをお届けします。いいね&フォローをお願いします。@SarwatAK
#HotTrends #TechnicalAnalysis #BTCRebounds80K
SarwatAK
·いいね:0件
·閲覧回数 223
Binance98PercentReplenished
閲覧回数 16,914
426人が討論中
USMidterms-WhatAreMarketsExpecting?
閲覧回数 270,147
1,901人が討論中