

Pair: $SOL / USDT
Timeframe: 15-Minute (15m)
Current Level: ~$115.15
🔍 Technical Overview
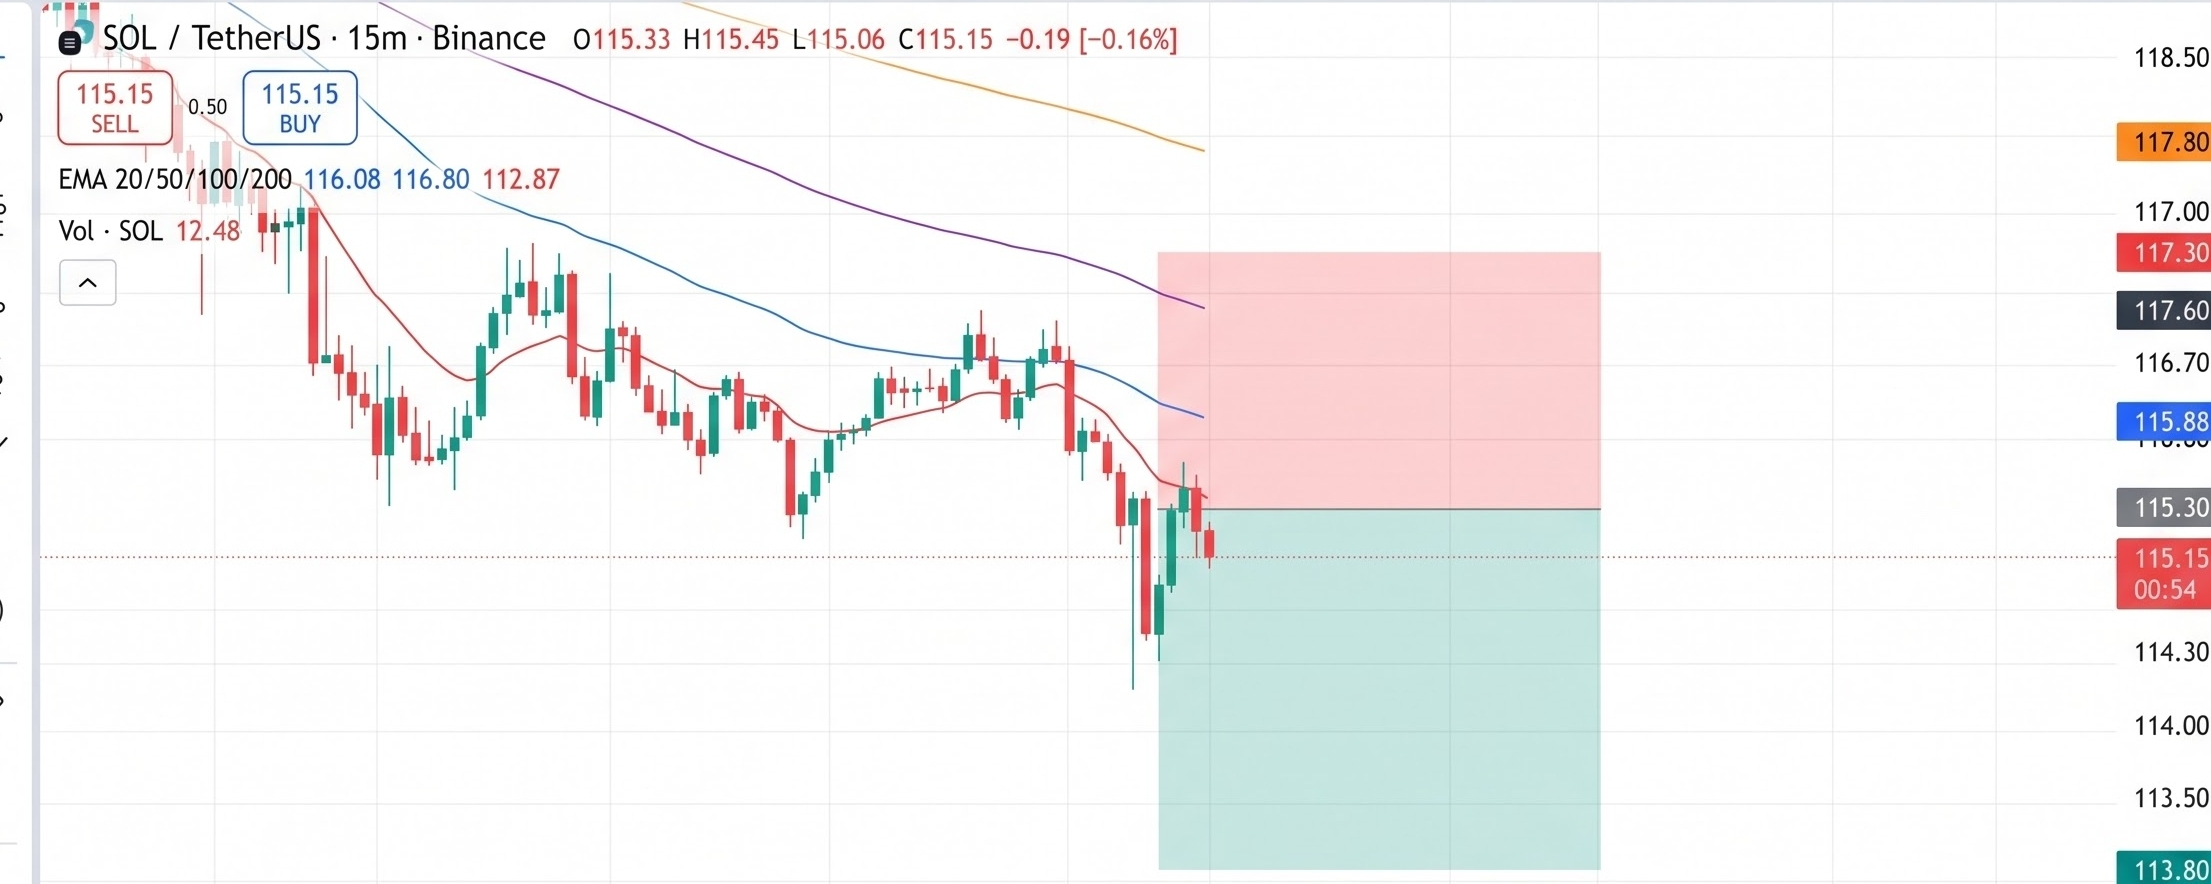
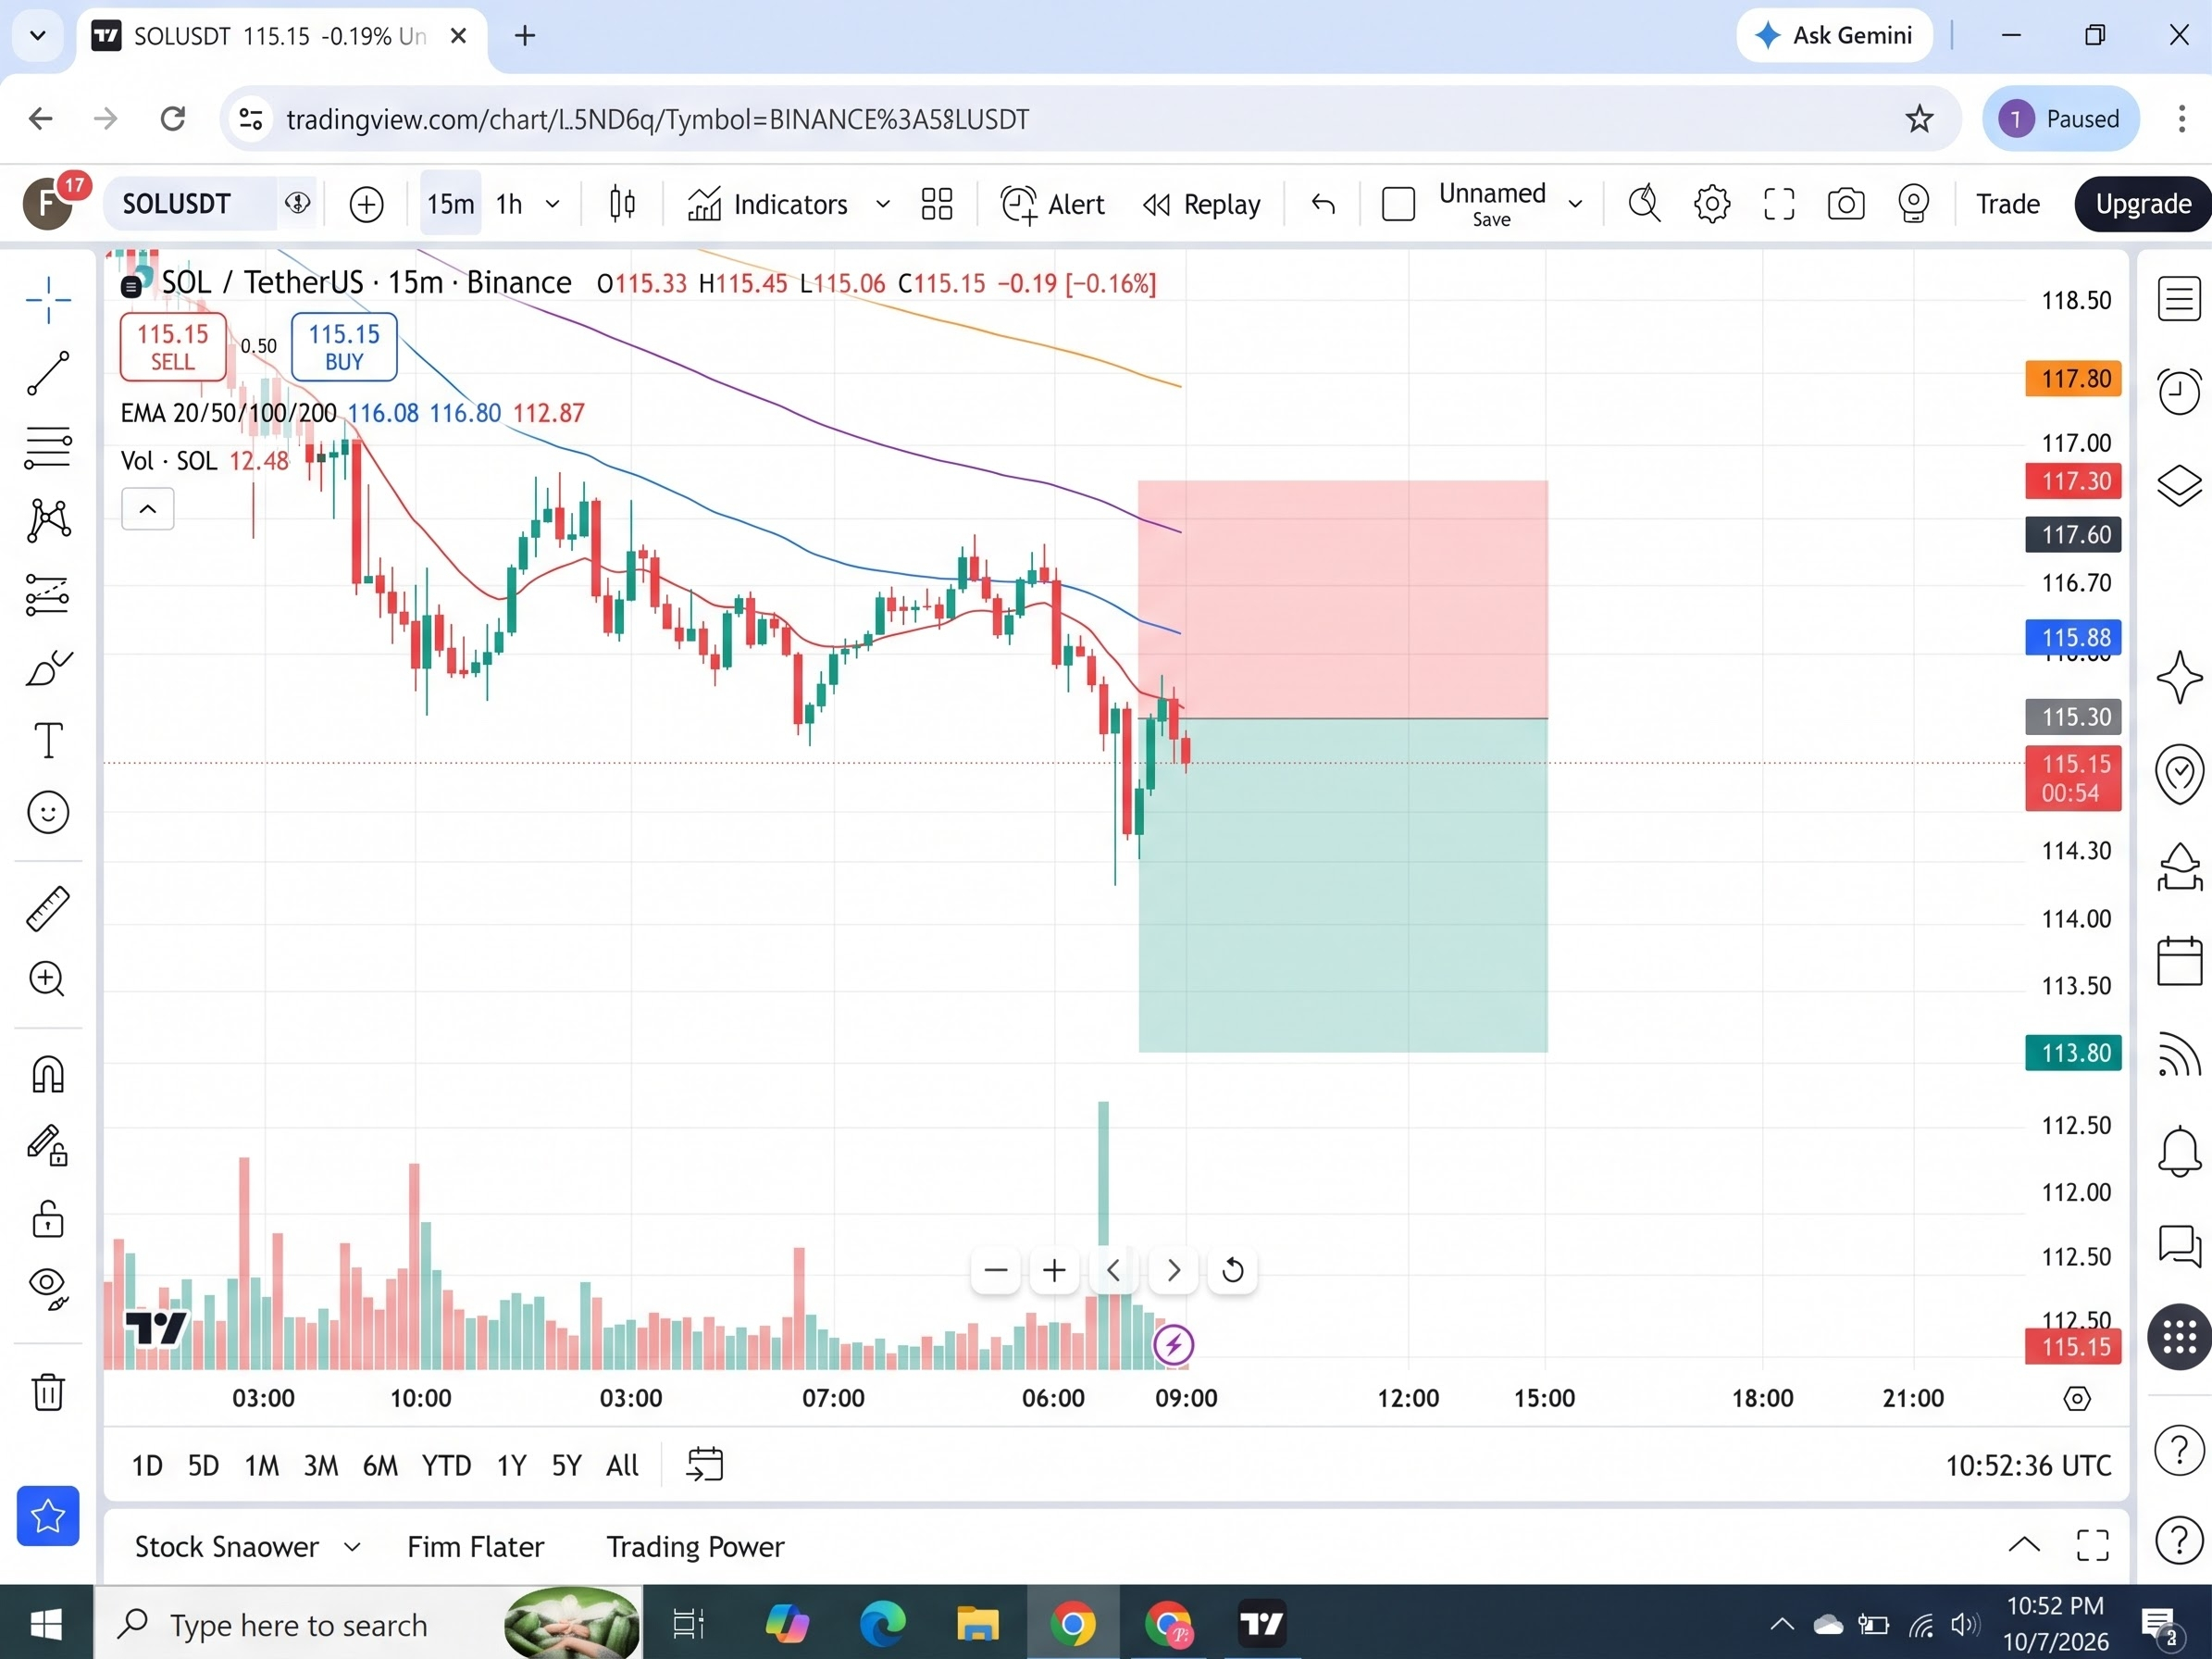
On the 15-minute chart, Solana ($SOL) continues to face heavy resistance after failing to sustain upward momentum above the $116.80 – $117.30 zone.
* Moving Average Resistance: Price action remains pinned beneath the dynamic resistance cluster formed by the 50, 100, and 200 EMAs (116.08 / 116.80 / 112.87). Each retest of these moving averages has met swift selling pressure.
* Breakdown Structure: The recent breakdown below the local support shelf near $115.30 signals continued bearish continuation towards recent intraday liquidity pools.
* Volume Confirmation: Spikes in sell volume around breakdown candles indicate active distribution.
🎯 Setup Breakdown (Short Bias)
* Entry Zone: $115.15 – $115.30 (retest of broken support)
* Stop Loss (SL): $117.30 (above the EMA cluster and recent swing high)
* Target 1 (TP1): $113.80
* Target 2 (TP2): $112.50 – $112.00 (key session demand zone)
* Risk/Reward Ratio: ~1:1.6 to 1:2.0+
⚠️ Key Risk Factors
A decisive 15m candle close back above $116.80 invalidates the bearish momentum and could trigger a short squeeze towards the $118.50 resistance ceiling. Manage position sizing and risk accordingly.
Disclaimer: This content is for educational and informational purposes only and does not constitute financial or investment advice. Always Do Your Own Research (DYOR) and apply strict risk management.
#Solana #SOL #CryptoTrading #TechnicalAnalysis #BinanceSquare #TradingSetup
