

MD ERFAN UDDIN1
181 投稿

MD ERFAN UDDIN1
報告
ユーザーをブロック
Loss is a experience profit is a success
高頻度トレーダー
5.2年
18 フォロー
375 フォロワー
462 いいね
投稿
すべて
引用
PINNED
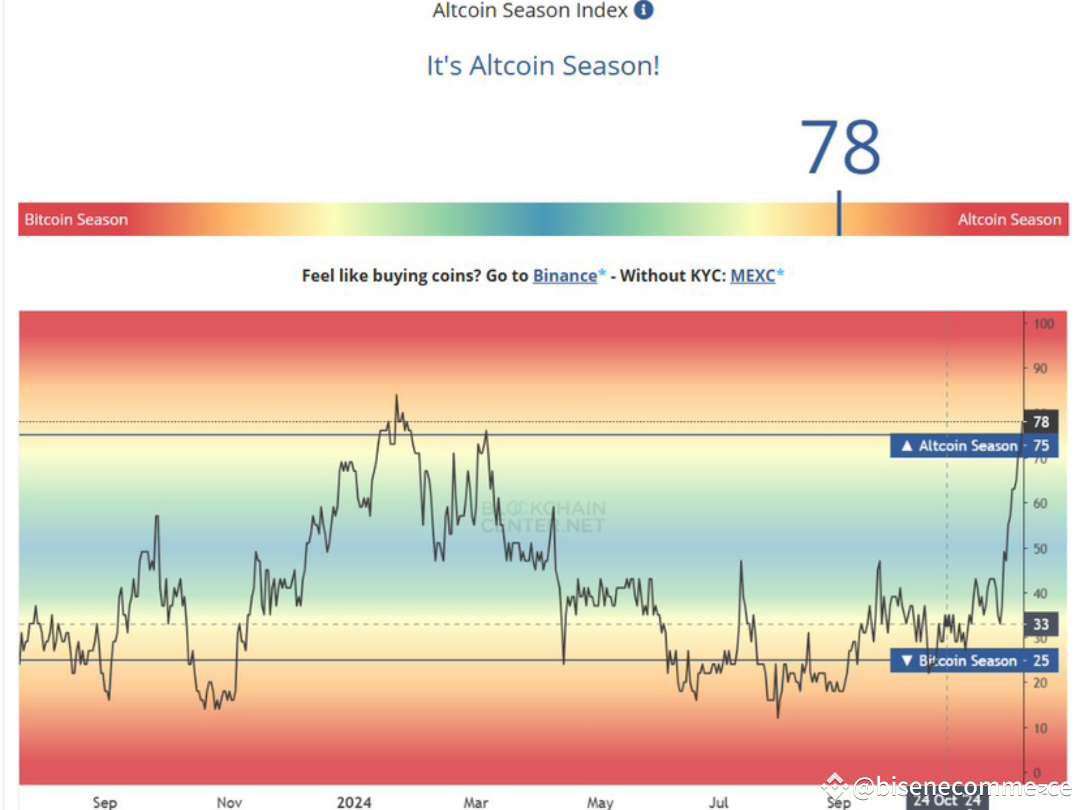
アルトコインシーズンインデックス: 市場トレンドを見極めるための究極のガイド 🚀(誰も教えてくれなかったと思います)
今何が起こっているのか?
🎯 アルトコインシーズンインデックスは78です – アルトコインの支配力が強いです!
🔴 75以上: 公式にアルトコインシーズンです – アルトコインはビットコインを上回ります。
🔵 25以下: ビットコインシーズンに切り替わります – ビットコインが主導します。
アルトコインシーズンはどのように測定されるのか?
📊 インデックススケール (0-100):
0-25: ビットコインが支配します。
26-74: 中立または混合市場。
75-100: アルトコインが完全にコントロールしています。
🧮 計算例:
過去90日間のビットコインに対する上位50のアルトコインのパフォーマンスを測定します。
現在のトレンド: アルトコインがビットコインを大きく上回っています!
次は何か?
🔺 いつピークに達するのか?
歴史的に、アルトコインシーズンは暗号市場のピークに近い時期にピークを迎えます。RSIと市場感情を監視してください!
🔻 いつ底に達するのか?
ビットコインシーズン: 大きなアルトコインのラリーの後にしばしば現れ、資本がBTCに戻ります。
このトレンドをどう取引するか?
🛒 アルトコインを早めに購入: ブレイクアウトの可能性がある強いコインを特定します。
🕒 エグジットのタイミングを計る: インデックスが90-100に近づいたらスケールアウトします – 過熱を示します!
🔄 BTCに戻る: 市場の修正中やインデックスが75を下回った場合はビットコインにシフトします。
2024年の重要な洞察
📈 現在の急上昇はアルトコインのマクロトレンドを示唆しています。
🔄 ボラティリティが待っています: アルトコインシーズン後にビットコインが支配力を取り戻すのを監視してください。
例: 2021年のアルトコインシーズンではイーサリアム、ソラナ、アバランチが先頭を切っていました – このサイクルでも同様のリーダーを期待してください!
成功のためのプロのヒント
🛑 FOMOを避ける: 明確なシグナルがあるときのみエントリーします。
📖 調査を行う: すべてのアルトコインが同等にパフォーマンスを発揮するわけではありません – ユーティリティと採用に焦点を当てます。
🛠️ ツールを利用する: トレンドに先んじてアルトコインシーズンインデックスを毎日追跡します。
{spot}(BTCUSDT)
{spot}(PEPEUSDT)
{spot}(DOGSUSDT)
💡 結論: 市場はアルトコインシーズンを叫んでいます。賢いトレーダーは早めにポジショニングしていますが、次の波に備えてビットコインに戻る準備を常にしておきましょう!🌊
アルトコインシーズンインデックス: 市場トレンドを見極めるための究極のガイド 🚀(誰も教えてくれなかったと思います)
今何が起こっているのか?
🎯 アルトコインシーズンインデックスは78です – アルトコインの支配力が強いです!
🔴 75以上: 公式にアルトコインシーズンです – アルトコインはビットコインを上回ります。
🔵 25以下: ビットコインシーズンに切り替わります – ビットコインが主導します。
アルトコインシーズンはどのように測定されるのか?
📊 インデックススケール (0-100):
0-25: ビットコインが支配します。
26-74: 中立または混合市場。
75-100: アルトコインが完全にコントロールしています。
🧮 計算例:
過去90日間のビットコインに対する上位50のアルトコインのパフォーマンスを測定します。
現在のトレンド: アルトコインがビットコインを大きく上回っています!
次は何か?
🔺 いつピークに達するのか?
歴史的に、アルトコインシーズンは暗号市場のピークに近い時期にピークを迎えます。RSIと市場感情を監視してください!
🔻 いつ底に達するのか?
ビットコインシーズン: 大きなアルトコインのラリーの後にしばしば現れ、資本がBTCに戻ります。
このトレンドをどう取引するか?
🛒 アルトコインを早めに購入: ブレイクアウトの可能性がある強いコインを特定します。
🕒 エグジットのタイミングを計る: インデックスが90-100に近づいたらスケールアウトします – 過熱を示します!
🔄 BTCに戻る: 市場の修正中やインデックスが75を下回った場合はビットコインにシフトします。
2024年の重要な洞察
📈 現在の急上昇はアルトコインのマクロトレンドを示唆しています。
🔄 ボラティリティが待っています: アルトコインシーズン後にビットコインが支配力を取り戻すのを監視してください。
例: 2021年のアルトコインシーズンではイーサリアム、ソラナ、アバランチが先頭を切っていました – このサイクルでも同様のリーダーを期待してください!
成功のためのプロのヒント
🛑 FOMOを避ける: 明確なシグナルがあるときのみエントリーします。
📖 調査を行う: すべてのアルトコインが同等にパフォーマンスを発揮するわけではありません – ユーティリティと採用に焦点を当てます。
🛠️ ツールを利用する: トレンドに先んじてアルトコインシーズンインデックスを毎日追跡します。
💡 結論: 市場はアルトコインシーズンを叫んでいます。賢いトレーダーは早めにポジショニングしていますが、次の波に備えてビットコインに戻る準備を常にしておきましょう!🌊
今何が起こっているのか?
🎯 アルトコインシーズンインデックスは78です – アルトコインの支配力が強いです!
🔴 75以上: 公式にアルトコインシーズンです – アルトコインはビットコインを上回ります。
🔵 25以下: ビットコインシーズンに切り替わります – ビットコインが主導します。
アルトコインシーズンはどのように測定されるのか?
📊 インデックススケール (0-100):
0-25: ビットコインが支配します。
26-74: 中立または混合市場。
75-100: アルトコインが完全にコントロールしています。
🧮 計算例:
過去90日間のビットコインに対する上位50のアルトコインのパフォーマンスを測定します。
現在のトレンド: アルトコインがビットコインを大きく上回っています!
次は何か?
🔺 いつピークに達するのか?
歴史的に、アルトコインシーズンは暗号市場のピークに近い時期にピークを迎えます。RSIと市場感情を監視してください!
🔻 いつ底に達するのか?
ビットコインシーズン: 大きなアルトコインのラリーの後にしばしば現れ、資本がBTCに戻ります。
このトレンドをどう取引するか?
🛒 アルトコインを早めに購入: ブレイクアウトの可能性がある強いコインを特定します。
🕒 エグジットのタイミングを計る: インデックスが90-100に近づいたらスケールアウトします – 過熱を示します!
🔄 BTCに戻る: 市場の修正中やインデックスが75を下回った場合はビットコインにシフトします。
2024年の重要な洞察
📈 現在の急上昇はアルトコインのマクロトレンドを示唆しています。
🔄 ボラティリティが待っています: アルトコインシーズン後にビットコインが支配力を取り戻すのを監視してください。
例: 2021年のアルトコインシーズンではイーサリアム、ソラナ、アバランチが先頭を切っていました – このサイクルでも同様のリーダーを期待してください!
成功のためのプロのヒント
🛑 FOMOを避ける: 明確なシグナルがあるときのみエントリーします。
📖 調査を行う: すべてのアルトコインが同等にパフォーマンスを発揮するわけではありません – ユーティリティと採用に焦点を当てます。
🛠️ ツールを利用する: トレンドに先んじてアルトコインシーズンインデックスを毎日追跡します。
💡 結論: 市場はアルトコインシーズンを叫んでいます。賢いトレーダーは早めにポジショニングしていますが、次の波に備えてビットコインに戻る準備を常にしておきましょう!🌊
3
112
·
--
ブリッシュ
翻訳参照
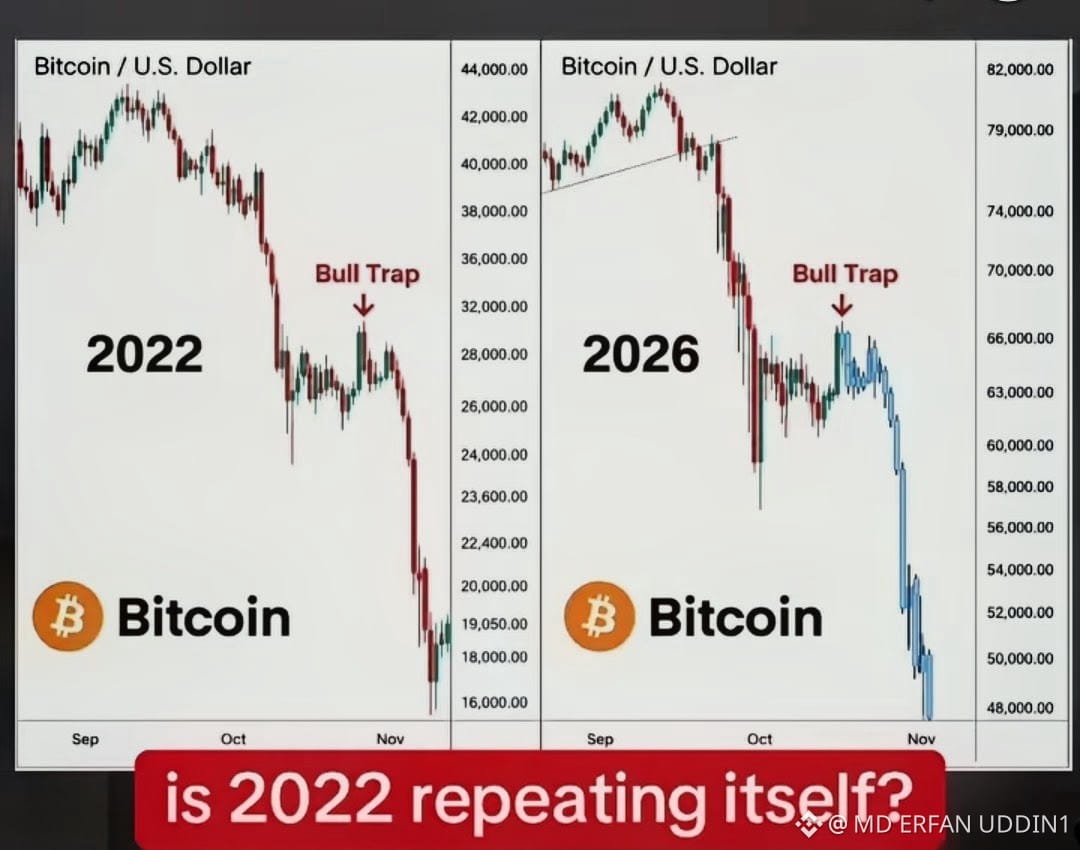
Warning all my followers: this pump is a major trap—a classic bull trap! ⚠️
Don't rush into buying any coins right now. Please wait a bit. BTC's movement might take it to 90k, or it could dump back down very rapidly.
Stay cautious, everyone! Keep following me and stay tuned—some big surprises are coming your way soon! 🚀
{spot}(BTCUSDT)
{spot}(ETHUSDT)
{spot}(SOLUSDT)
Warning all my followers: this pump is a major trap—a classic bull trap! ⚠️
Don't rush into buying any coins right now. Please wait a bit. BTC's movement might take it to 90k, or it could dump back down very rapidly.
Stay cautious, everyone! Keep following me and stay tuned—some big surprises are coming your way soon! 🚀
Don't rush into buying any coins right now. Please wait a bit. BTC's movement might take it to 90k, or it could dump back down very rapidly.
Stay cautious, everyone! Keep following me and stay tuned—some big surprises are coming your way soon! 🚀
92
·
--
ブリッシュ
翻訳参照
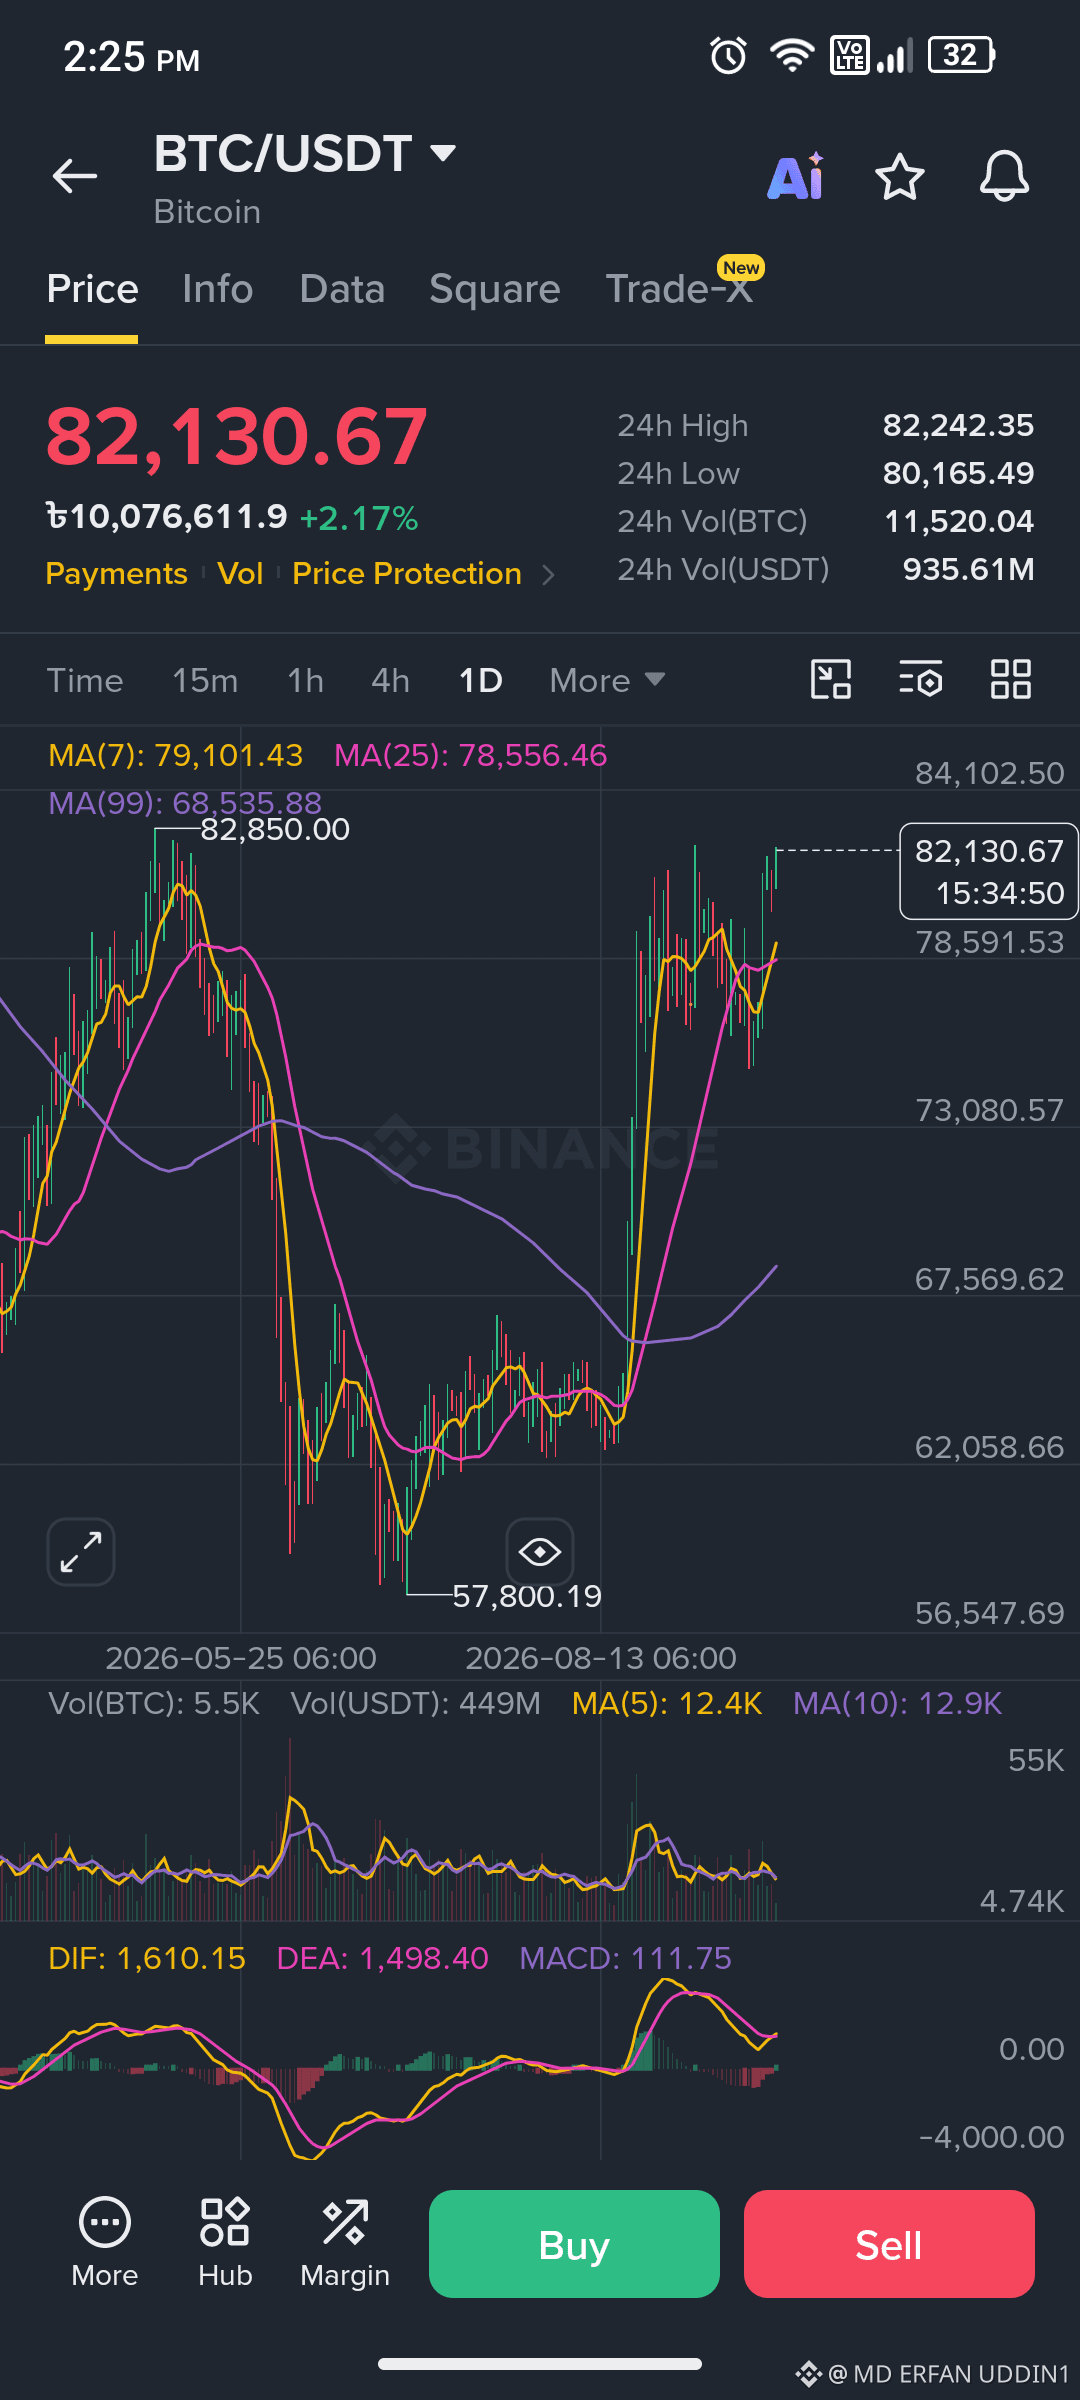
Hello everyone, how are you all doing? I hope you're well. A lot of you traded and made good profits from the prediction I shared yesterday. Moving forward, I’ll do my best to provide even more precise predictions to help you maximize your profits."
{spot}(BTCUSDT)
Hello everyone, how are you all doing? I hope you're well. A lot of you traded and made good profits from the prediction I shared yesterday. Moving forward, I’ll do my best to provide even more precise predictions to help you maximize your profits."
78
記事
翻訳参照
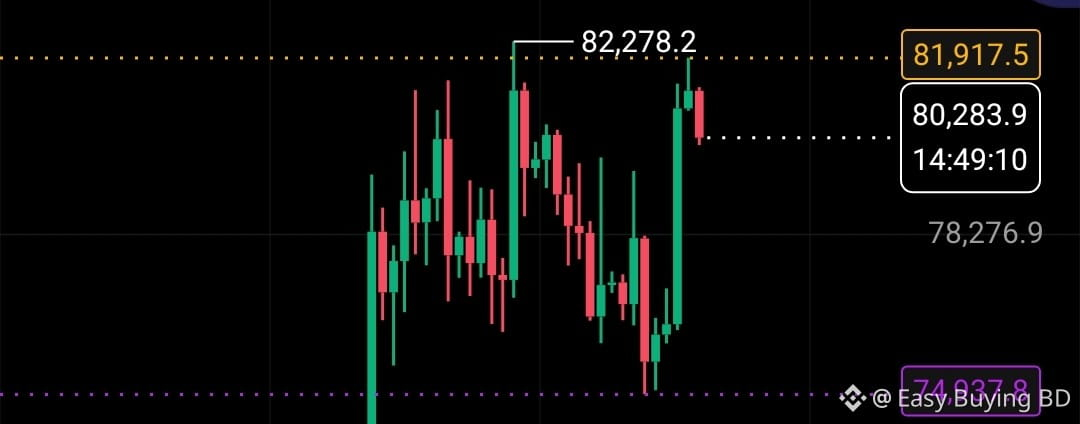
why was $btcrejected at 82k? Why Was Bitcoin($BTCRejected at $82K?3 Reasons Behind the Sunday Pullback
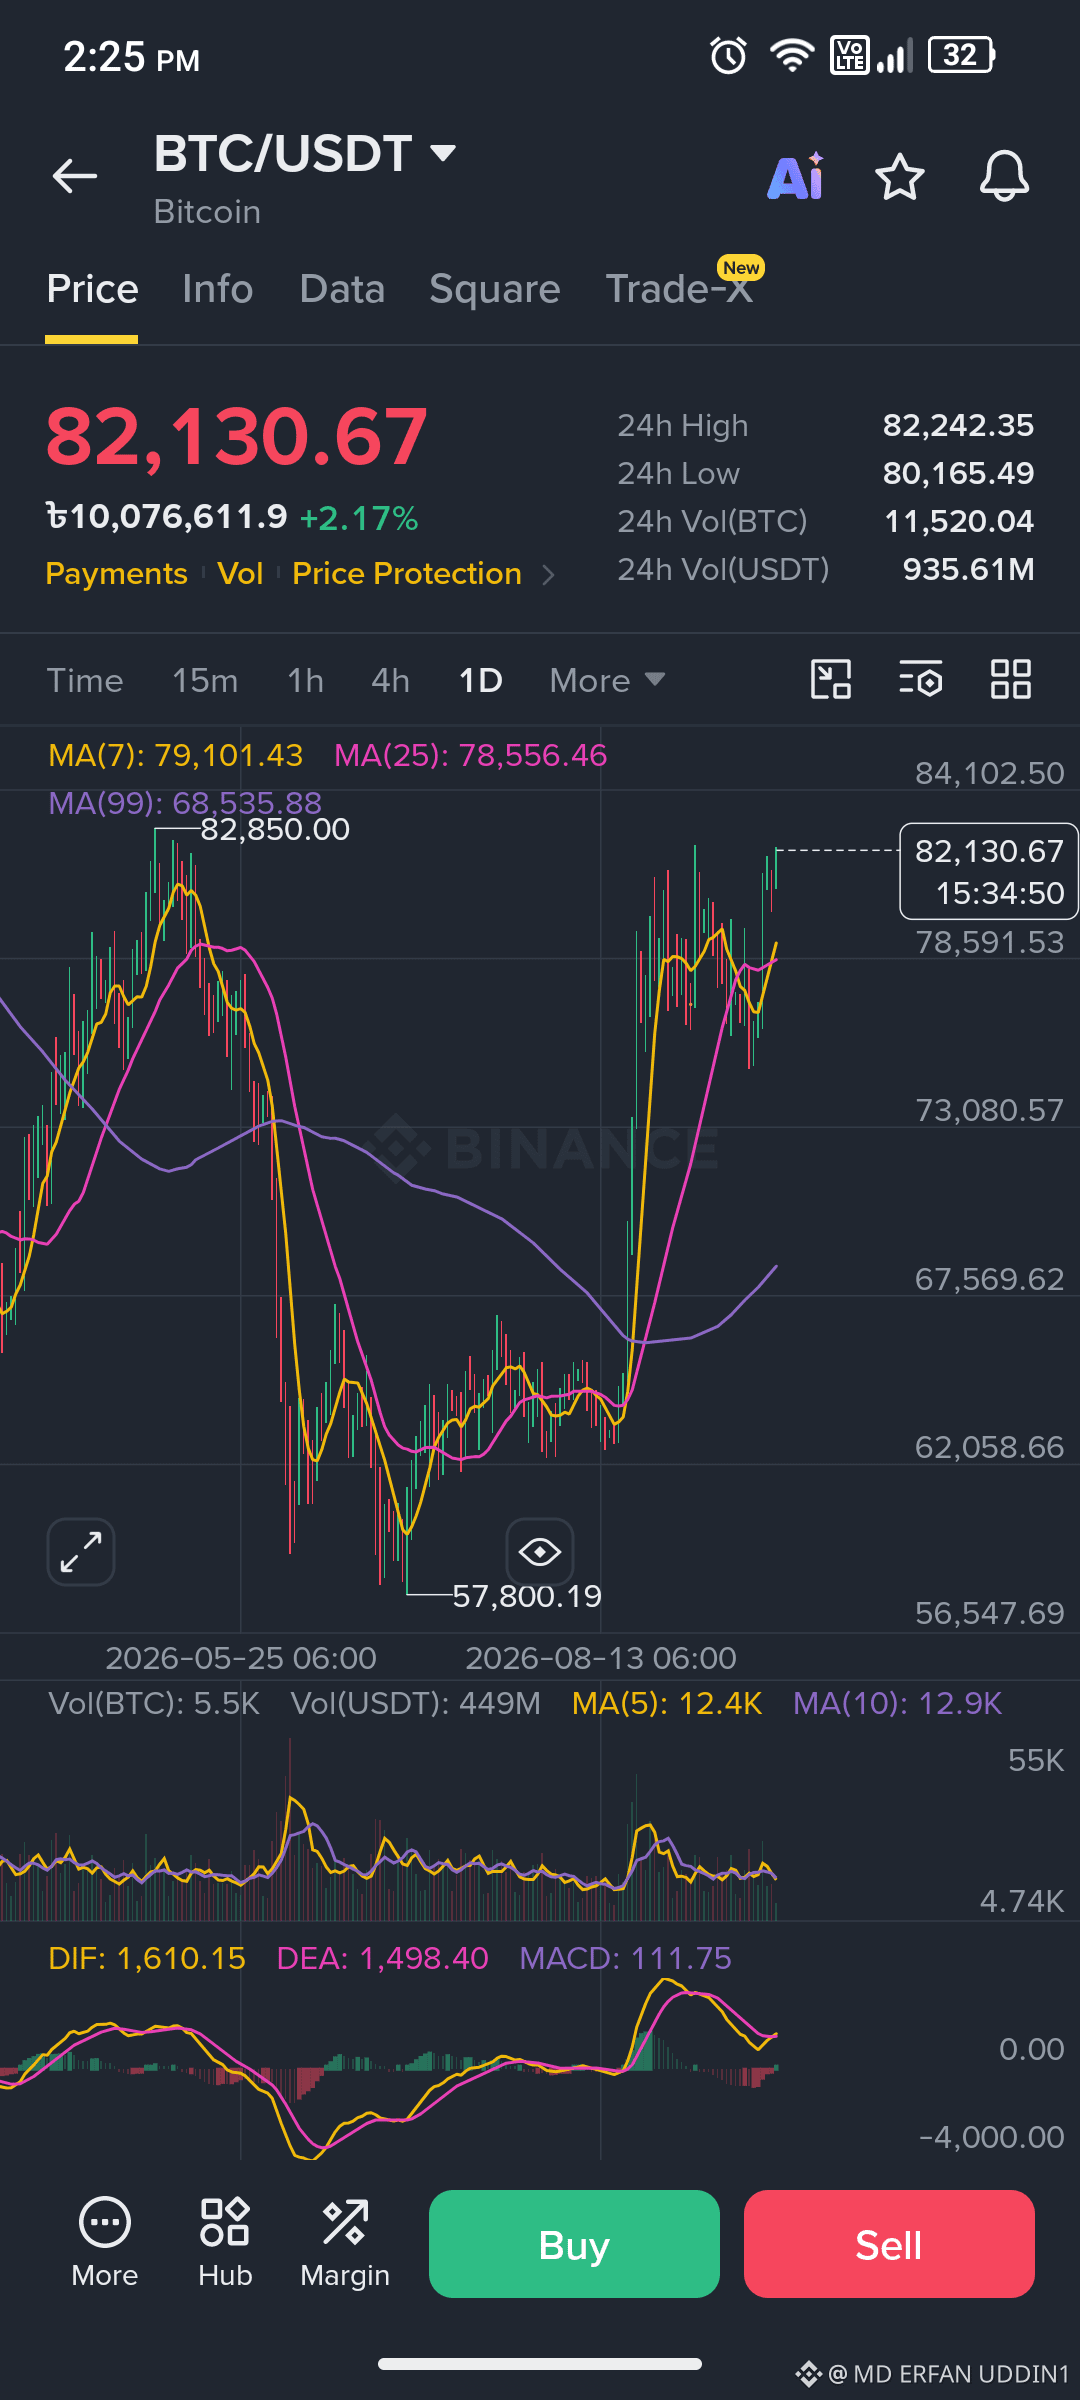
Bitcoin recently made another serious attempt to break out, nearing the $82,000mark over the weekend. However, the rally was abruptly halted, sending BTC sliding back below the $80,000level.
Why is this specific price zone proving so difficult to crack? Here is an analytical breakdown of the three primary forces that triggered the Sunday pullback:
🧱 1. The 200-Day Moving Average Ceiling
The rejection wasn't random; it hit a massive technical wall.
* The Moving Average: The $82,100zone aligns almost perfectly with the 200-day Simple Moving Average (SMA).
* Historical Ceiling: This specific technical boundary has acted as the ultimate ceiling for every major recovery attempt over the past few months. Because the weekend volume wasn't aggressive enough to overpower the sellers, the line held firm.
📉 2. Short-Term Holders Exiting at Breakeven
Behind the technical charts is a clear behavioral pattern among recent buyers, highlighted by on-chain analysts.
* The SOPR Metric: The Short-Term Holder SOPR (Spent Output Profit Ratio) reveals that recent buyers who have been "underwater" are acting defensively.
* Selling the Pump: Instead of holding for a macro breakout, these traders are using every rally toward $82Kas an opportunity to sell and exit at breakeven. This constant supply absorption effectively kills the buying momentum right at the resistance line.
🌍 3. Macro Headwinds and Geopolitical Jitters
Bitcoin does not operate in a vacuum, and external liquidity factors played a major role in the weekend reversal.
* Tightening Liquidity: An unexpectedly hot U.S. jobs report has revived hawkish Federal Reserve bets. When rate expectations rise, dollar liquidity tightens, pulling capital away from risk-on assets like crypto.
* Middle East Tensions: Adding to the macroeconomic pressure, the weekend breakout attempt was further stalled by worrisome geopolitical news emerging from the Middle East, causing global traders to de-risk and step to the sidelines.
The Takeaway: The resistance at $82,000is a heavy combination of technical ceilings, exhausted short-term holders, and a tightening macro environment. For Bitcoin to successfully clear this hurdle on its next attempt, it will require a sustained behavioral shift—where short-term buyers finally decide to hold through the resistance rather than selling into the strength.
{spot}(BTCUSDT)
why was $btcrejected at 82k?
Why Was Bitcoin($BTCRejected at $82K?3 Reasons Behind the Sunday Pullback
Bitcoin recently made another serious attempt to break out, nearing the $82,000mark over the weekend. However, the rally was abruptly halted, sending BTC sliding back below the $80,000level.
Why is this specific price zone proving so difficult to crack? Here is an analytical breakdown of the three primary forces that triggered the Sunday pullback:
🧱 1. The 200-Day Moving Average Ceiling
The rejection wasn't random; it hit a massive technical wall.
* The Moving Average: The $82,100zone aligns almost perfectly with the 200-day Simple Moving Average (SMA).
* Historical Ceiling: This specific technical boundary has acted as the ultimate ceiling for every major recovery attempt over the past few months. Because the weekend volume wasn't aggressive enough to overpower the sellers, the line held firm.
📉 2. Short-Term Holders Exiting at Breakeven
Behind the technical charts is a clear behavioral pattern among recent buyers, highlighted by on-chain analysts.
* The SOPR Metric: The Short-Term Holder SOPR (Spent Output Profit Ratio) reveals that recent buyers who have been "underwater" are acting defensively.
* Selling the Pump: Instead of holding for a macro breakout, these traders are using every rally toward $82Kas an opportunity to sell and exit at breakeven. This constant supply absorption effectively kills the buying momentum right at the resistance line.
🌍 3. Macro Headwinds and Geopolitical Jitters
Bitcoin does not operate in a vacuum, and external liquidity factors played a major role in the weekend reversal.
* Tightening Liquidity: An unexpectedly hot U.S. jobs report has revived hawkish Federal Reserve bets. When rate expectations rise, dollar liquidity tightens, pulling capital away from risk-on assets like crypto.
* Middle East Tensions: Adding to the macroeconomic pressure, the weekend breakout attempt was further stalled by worrisome geopolitical news emerging from the Middle East, causing global traders to de-risk and step to the sidelines.
The Takeaway: The resistance at $82,000is a heavy combination of technical ceilings, exhausted short-term holders, and a tightening macro environment. For Bitcoin to successfully clear this hurdle on its next attempt, it will require a sustained behavioral shift—where short-term buyers finally decide to hold through the resistance rather than selling into the strength.
Bitcoin recently made another serious attempt to break out, nearing the $82,000mark over the weekend. However, the rally was abruptly halted, sending BTC sliding back below the $80,000level.
Why is this specific price zone proving so difficult to crack? Here is an analytical breakdown of the three primary forces that triggered the Sunday pullback:
🧱 1. The 200-Day Moving Average Ceiling
The rejection wasn't random; it hit a massive technical wall.
* The Moving Average: The $82,100zone aligns almost perfectly with the 200-day Simple Moving Average (SMA).
* Historical Ceiling: This specific technical boundary has acted as the ultimate ceiling for every major recovery attempt over the past few months. Because the weekend volume wasn't aggressive enough to overpower the sellers, the line held firm.
📉 2. Short-Term Holders Exiting at Breakeven
Behind the technical charts is a clear behavioral pattern among recent buyers, highlighted by on-chain analysts.
* The SOPR Metric: The Short-Term Holder SOPR (Spent Output Profit Ratio) reveals that recent buyers who have been "underwater" are acting defensively.
* Selling the Pump: Instead of holding for a macro breakout, these traders are using every rally toward $82Kas an opportunity to sell and exit at breakeven. This constant supply absorption effectively kills the buying momentum right at the resistance line.
🌍 3. Macro Headwinds and Geopolitical Jitters
Bitcoin does not operate in a vacuum, and external liquidity factors played a major role in the weekend reversal.
* Tightening Liquidity: An unexpectedly hot U.S. jobs report has revived hawkish Federal Reserve bets. When rate expectations rise, dollar liquidity tightens, pulling capital away from risk-on assets like crypto.
* Middle East Tensions: Adding to the macroeconomic pressure, the weekend breakout attempt was further stalled by worrisome geopolitical news emerging from the Middle East, causing global traders to de-risk and step to the sidelines.
The Takeaway: The resistance at $82,000is a heavy combination of technical ceilings, exhausted short-term holders, and a tightening macro environment. For Bitcoin to successfully clear this hurdle on its next attempt, it will require a sustained behavioral shift—where short-term buyers finally decide to hold through the resistance rather than selling into the strength.
1
53
翻訳参照
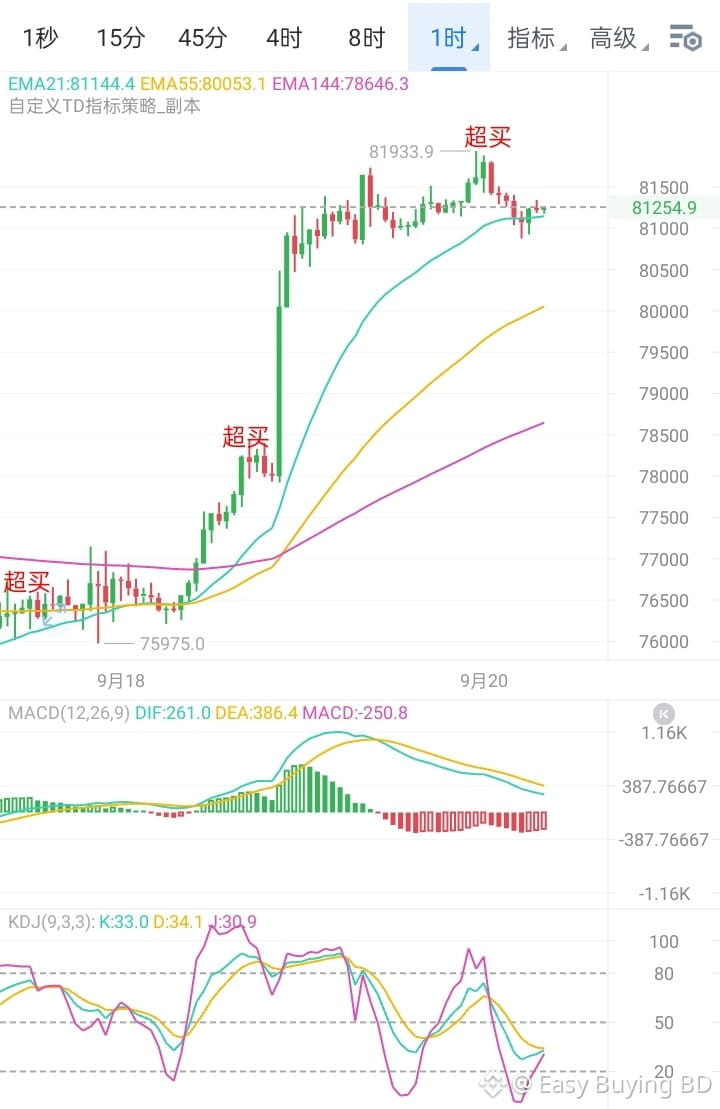
After surging to around 81900 last night, Bitcoin was hit by a rebound from the bears, but quickly halted its pullback near 80800 in the early hours, indicating strong buying support below. The price has now returned to around 81200. Structurally, yesterday’s pullback after the rally did not break key support, and the 80800 level has formed the preliminary shape of a short-term double bottom. The retracement was also limited, constituting a healthy correction within a strong market.
On the moving-average system, short-term moving averages are beginning to turn upward, with the price reclaiming 81200 and the bullish alignment recovering. If the 80800-81000 support zone holds during the day, the price is expected to challenge the previous high near 81900 again. A breakout would further open up upside toward around 82500.
In terms of trading, remain bullish on a pullback that holds above 80800, with 81900 as the initial target and continued holding after a breakout. Overall, continue to focus on buying dips, with particular attention to the effectiveness of support at 80800. As long as this level holds, the short-term bullish structure will remain unchanged.
{spot}(BTCUSDT)
After surging to around 81900 last night, Bitcoin was hit by a rebound from the bears, but quickly halted its pullback near 80800 in the early hours, indicating strong buying support below. The price has now returned to around 81200. Structurally, yesterday’s pullback after the rally did not break key support, and the 80800 level has formed the preliminary shape of a short-term double bottom. The retracement was also limited, constituting a healthy correction within a strong market.
On the moving-average system, short-term moving averages are beginning to turn upward, with the price reclaiming 81200 and the bullish alignment recovering. If the 80800-81000 support zone holds during the day, the price is expected to challenge the previous high near 81900 again. A breakout would further open up upside toward around 82500.
In terms of trading, remain bullish on a pullback that holds above 80800, with 81900 as the initial target and continued holding after a breakout. Overall, continue to focus on buying dips, with particular attention to the effectiveness of support at 80800. As long as this level holds, the short-term bullish structure will remain unchanged.
On the moving-average system, short-term moving averages are beginning to turn upward, with the price reclaiming 81200 and the bullish alignment recovering. If the 80800-81000 support zone holds during the day, the price is expected to challenge the previous high near 81900 again. A breakout would further open up upside toward around 82500.
In terms of trading, remain bullish on a pullback that holds above 80800, with 81900 as the initial target and continued holding after a breakout. Overall, continue to focus on buying dips, with particular attention to the effectiveness of support at 80800. As long as this level holds, the short-term bullish structure will remain unchanged.
1
45
開設わずか6日後のウェブサイトが、$TRUMPの最大の強気ニュースを明かしました。
DJT Newsによると:
$SOLチームはTrumpPadを開発しています。
将来的には、新しいコインはもはやSOLやステーブルコインとペアになることはなく、
一律で$TRUMPを使用します。新しいコインが増えるほど$TRUMPの利用が高まり、
それに応じて取引量と手数料も増加していくとのことです。
しかし調べてみると:
• サイトは9月12日に登録され、9月18日に「独占」を公開した
• レポート全体は、事情に詳しい匿名の情報源に依存している
• プロジェクトチームは公式発表を行っていない
• 公式サイトにはプロダクトページがない
• コントラクト、コード、ローンチ日が存在しない
そこで、これはプロジェクトのローンチに先立つ誇大な期待(ハイプ)なのでしょうか。
それとも、誰かが特定の意図で$TRUMPのためのニュースを作る目的でウェブサイトを立ち上げたのでしょうか?
現時点では、正直なところ判別するのは難しいです。
{spot}(SOLUSDT)
{spot}(TRUMPUSDT)
開設わずか6日後のウェブサイトが、$TRUMPの最大の強気ニュースを明かしました。
DJT Newsによると:
$SOLチームはTrumpPadを開発しています。
将来的には、新しいコインはもはやSOLやステーブルコインとペアになることはなく、
一律で$TRUMPを使用します。新しいコインが増えるほど$TRUMPの利用が高まり、
それに応じて取引量と手数料も増加していくとのことです。
しかし調べてみると:
• サイトは9月12日に登録され、9月18日に「独占」を公開した
• レポート全体は、事情に詳しい匿名の情報源に依存している
• プロジェクトチームは公式発表を行っていない
• 公式サイトにはプロダクトページがない
• コントラクト、コード、ローンチ日が存在しない
そこで、これはプロジェクトのローンチに先立つ誇大な期待(ハイプ)なのでしょうか。
それとも、誰かが特定の意図で$TRUMPのためのニュースを作る目的でウェブサイトを立ち上げたのでしょうか?
現時点では、正直なところ判別するのは難しいです。
DJT Newsによると:
$SOLチームはTrumpPadを開発しています。
将来的には、新しいコインはもはやSOLやステーブルコインとペアになることはなく、
一律で$TRUMPを使用します。新しいコインが増えるほど$TRUMPの利用が高まり、
それに応じて取引量と手数料も増加していくとのことです。
しかし調べてみると:
• サイトは9月12日に登録され、9月18日に「独占」を公開した
• レポート全体は、事情に詳しい匿名の情報源に依存している
• プロジェクトチームは公式発表を行っていない
• 公式サイトにはプロダクトページがない
• コントラクト、コード、ローンチ日が存在しない
そこで、これはプロジェクトのローンチに先立つ誇大な期待(ハイプ)なのでしょうか。
それとも、誰かが特定の意図で$TRUMPのためのニュースを作る目的でウェブサイトを立ち上げたのでしょうか?
現時点では、正直なところ判別するのは難しいです。
1
441
記事
翻訳参照
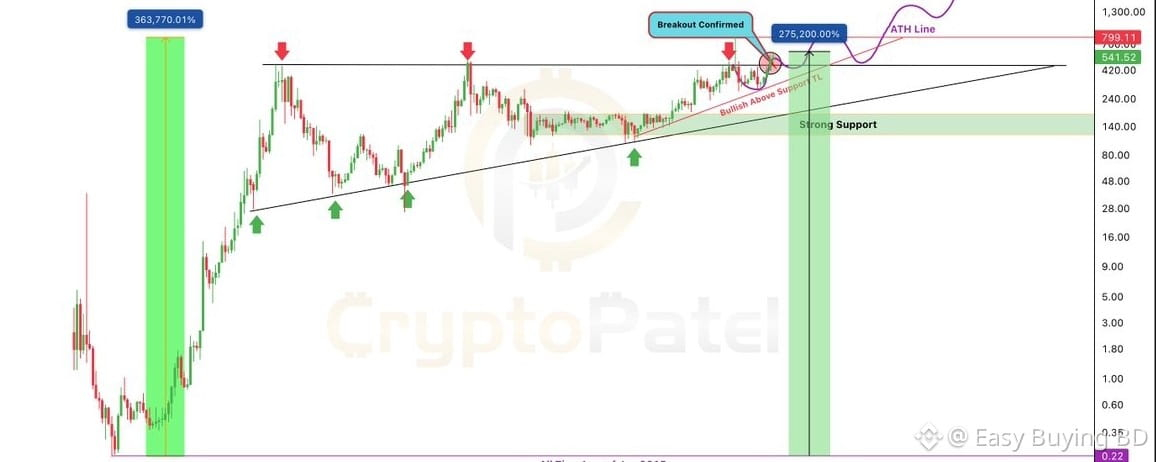
XMR Above ZEC Breakout Confirmed$XMRAbove $ZEC| Breakout Confirmed. Can This Old Resistance Become The Launchpad For $1,000–$2,000?#XMR has already broken above the critical ~$440macro resistance that rejected price across multiple major cycles. The next phase is no longer about breaking $440,it's about Holding $440as support.
The 3W structure now shows a potential Resistance → Breakout → Retest → Support → Expansion sequence.
Why This Setup Matters:
✅ $440multi-year resistance already broken
✅ Former resistance is now being tested as strong support
✅ HTF structure remains bullish while price holds above $440✅ Currently No Upside resistance & $799.11ATH Price
✅ Above $799,XMR enters a much thinner historical-supply environment
The $ZECcomparison makes the setup even more interesting.
#ZEC recently expanded from roughly $16→ $1,550+(~97X), demonstrating how aggressively privacy assets can reprice after major structural breakouts.
This does Not guarantee the same move for XMR, but the structural similarity makes the sector worth watching closely.
Upside Roadmap: $800→ $1,000→ $1,500→$2,000Critical Support: $440$XMRLONG-TERM PERFORMANCE:
XMR/USDT Is Currently Up ~275,200% Over The Last 11 Years, Meaning A $1Investment Held Since Then Would Be Worth Approximately $2,752Today.
Strategy: Don't chase the breakout blindly. Watch how XMR/USDT reacts around $440.Continued HTF closes above this level would keep the breakout structure intact. A decisive HTF close below $440would invalidate the setup and increase downside risk toward the $300and $140–$180zones.
The breakout has already happened. Now $440must prove it has become the new floor.
Educational Only. Not Financial Advice. ALWAYS DYOR.
@monero
#xmr #ZEC
{future}(XMRUSDT)
{spot}(ZECUSDT)
XMR Above ZEC Breakout Confirmed
$XMRAbove $ZEC| Breakout Confirmed. Can This Old Resistance Become The Launchpad For $1,000–$2,000?#XMR has already broken above the critical ~$440macro resistance that rejected price across multiple major cycles. The next phase is no longer about breaking $440,it's about Holding $440as support.
The 3W structure now shows a potential Resistance → Breakout → Retest → Support → Expansion sequence.
Why This Setup Matters:
✅ $440multi-year resistance already broken
✅ Former resistance is now being tested as strong support
✅ HTF structure remains bullish while price holds above $440✅ Currently No Upside resistance & $799.11ATH Price
✅ Above $799,XMR enters a much thinner historical-supply environment
The $ZECcomparison makes the setup even more interesting.
#ZEC recently expanded from roughly $16→ $1,550+(~97X), demonstrating how aggressively privacy assets can reprice after major structural breakouts.
This does Not guarantee the same move for XMR, but the structural similarity makes the sector worth watching closely.
Upside Roadmap: $800→ $1,000→ $1,500→$2,000Critical Support: $440$XMRLONG-TERM PERFORMANCE:
XMR/USDT Is Currently Up ~275,200% Over The Last 11 Years, Meaning A $1Investment Held Since Then Would Be Worth Approximately $2,752Today.
Strategy: Don't chase the breakout blindly. Watch how XMR/USDT reacts around $440.Continued HTF closes above this level would keep the breakout structure intact. A decisive HTF close below $440would invalidate the setup and increase downside risk toward the $300and $140–$180zones.
The breakout has already happened. Now $440must prove it has become the new floor.
Educational Only. Not Financial Advice. ALWAYS DYOR.
@monero
#xmr #ZEC
The 3W structure now shows a potential Resistance → Breakout → Retest → Support → Expansion sequence.
Why This Setup Matters:
✅ $440multi-year resistance already broken
✅ Former resistance is now being tested as strong support
✅ HTF structure remains bullish while price holds above $440✅ Currently No Upside resistance & $799.11ATH Price
✅ Above $799,XMR enters a much thinner historical-supply environment
The $ZECcomparison makes the setup even more interesting.
#ZEC recently expanded from roughly $16→ $1,550+(~97X), demonstrating how aggressively privacy assets can reprice after major structural breakouts.
This does Not guarantee the same move for XMR, but the structural similarity makes the sector worth watching closely.
Upside Roadmap: $800→ $1,000→ $1,500→$2,000Critical Support: $440$XMRLONG-TERM PERFORMANCE:
XMR/USDT Is Currently Up ~275,200% Over The Last 11 Years, Meaning A $1Investment Held Since Then Would Be Worth Approximately $2,752Today.
Strategy: Don't chase the breakout blindly. Watch how XMR/USDT reacts around $440.Continued HTF closes above this level would keep the breakout structure intact. A decisive HTF close below $440would invalidate the setup and increase downside risk toward the $300and $140–$180zones.
The breakout has already happened. Now $440must prove it has become the new floor.
Educational Only. Not Financial Advice. ALWAYS DYOR.
@monero
#xmr #ZEC
1
50
·
--
ブリッシュ
翻訳参照
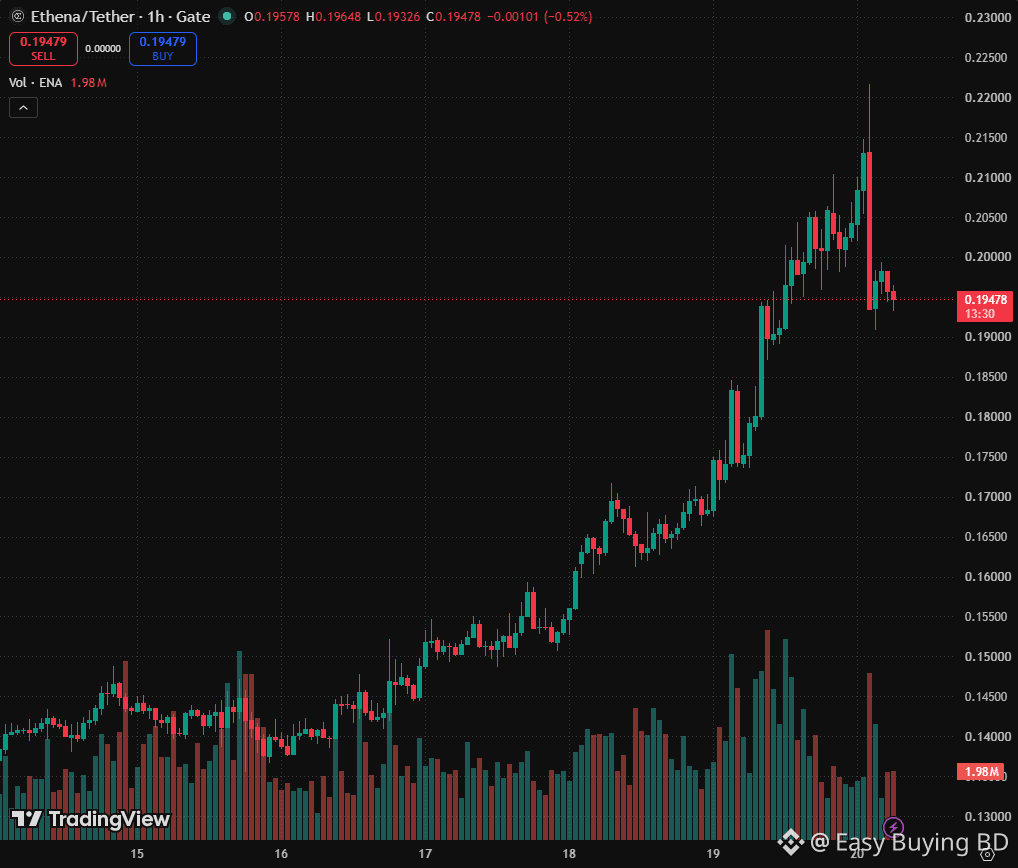
$$ENAENAUSDT | Bullish Continuation Setup
ENAUSDT has shown strong bullish momentum on the 1 hour chart, with price trading above the Williams Alligator lines and maintaining a positive market structure. Following the sharp upward move, price consolidated near the entry zone while the RSI remained bullish, with no clear bearish divergence visible.
The overall analysis was completed on the 1 hour chart, while the trade was executed on the 15 minute chart after lower time frame confirmation.
Trade plan:
- Entry:0.20259
- Take profit:0.21052
- Stop loss:0.19464
- Risk to reward ratio: approximately 1:1
The setup remains valid as long as price holds the identified support area and bullish momentum continues.
{spot}(ENAUSDT)
#ENA
$$ENAENAUSDT | Bullish Continuation Setup
ENAUSDT has shown strong bullish momentum on the 1 hour chart, with price trading above the Williams Alligator lines and maintaining a positive market structure. Following the sharp upward move, price consolidated near the entry zone while the RSI remained bullish, with no clear bearish divergence visible.
The overall analysis was completed on the 1 hour chart, while the trade was executed on the 15 minute chart after lower time frame confirmation.
Trade plan:
- Entry:0.20259
- Take profit:0.21052
- Stop loss:0.19464
- Risk to reward ratio: approximately 1:1
The setup remains valid as long as price holds the identified support area and bullish momentum continues.
#ENA
ENAUSDT has shown strong bullish momentum on the 1 hour chart, with price trading above the Williams Alligator lines and maintaining a positive market structure. Following the sharp upward move, price consolidated near the entry zone while the RSI remained bullish, with no clear bearish divergence visible.
The overall analysis was completed on the 1 hour chart, while the trade was executed on the 15 minute chart after lower time frame confirmation.
Trade plan:
- Entry:0.20259
- Take profit:0.21052
- Stop loss:0.19464
- Risk to reward ratio: approximately 1:1
The setup remains valid as long as price holds the identified support area and bullish momentum continues.
#ENA
1
78

記事
翻訳参照
#BTCবিটকয়েনের দাম ১ লাখ ডলার ($100,000) অতিক্রম করার বিষয়টি এখন আর কেবল স্বপ্ন নয়, বরং ২০২৬ সালের এই সময়ে এটি একটি বাস্তব সম্ভাবনা হয়ে দাঁড়িয়েছে। বিটকয়েন রিজার্ভ কীভাবে দামকে এই উচ্চতায় নিয়ে যাবে, তার ৩টি প্রধান কারণ নিচে দেওয়া হলো:
১. বিশাল অংকের কেনাকাটা (The Supply Shock)
আমেরিকার প্রস্তাবিত আইন অনুযায়ী, তারা প্রতি বছর ২ লাখ করে মোট ১০ লাখ (১ মিলিয়ন) বিটকয়েন কিনবে।
বিটকয়েনের মোট সংখ্যা নির্দিষ্ট (মাত্র ২ কোটি ১০ লাখ)। এর মধ্যে বেশিরভাগই দীর্ঘমেয়াদী বিনিয়োগকারীদের কাছে আটকে আছে।
যখন আমেরিকার মতো একটি দেশ বাজার থেকে এত বিশাল পরিমাণ বিটকয়েন কেনা শুরু করবে, তখন বাজারে বিটকয়েনের সংকট দেখা দেবে। অর্থনীতির নিয়ম অনুযায়ী, সরবরাহ কমলে এবং চাহিদা বাড়লে দাম হু হু করে বাড়বে।
২. অন্যান্য দেশের প্রতিযোগিতা (Game Theory)
আমেরিকা যদি বিটকয়েন কেনা শুরু করে, তবে চীন, রাশিয়া বা ইউরোপীয় দেশগুলো হাত গুটিয়ে বসে থাকবে না। তারা ভয় পাবে যে আমেরিকা যদি সব বিটকয়েন দখল করে নেয়, তবে ভবিষ্যতে তারা পিছিয়ে পড়বে।
একে বলা হয় "গেম থিওরি"। একটি দেশ কেনা শুরু করলে অন্য দেশগুলোও নিজেদের রিজার্ভ রক্ষার জন্য বিটকয়েন কিনতে বাধ্য হবে।
এই বৈশ্বিক প্রতিযোগিতার কারণে বিটকয়েনের দাম খুব দ্রুত ১ লাখ ডলারের মাইলফলক ছাড়িয়ে যেতে পারে।
৩. প্রাতিষ্ঠানিক ও সাধারণ মানুষের আস্থা
যখন বিটকয়েন কোনো দেশের সরকারি কোষাগারে (Treasury) জায়গা পায়, তখন সাধারণ মানুষের কাছে এর গ্রহণযোগ্যতা অনেক বেড়ে যায়।
বড় বড় ব্যাংক এবং পেনশন ফান্ডগুলো তখন দ্বিধাহীনভাবে ক্রিপ্টোকারেন্সিতে বিনিয়োগ করবে।
বর্তমানে বিটকয়েন ৯১,০০০ থেকে ৯৫,০০০ ডলারের মধ্যে ওঠানামা করছে। বিশেষজ্ঞদের মতে, বিটকয়েন রিজার্ভের প্রথম কেনাকাটাটি শুরু হওয়ামাত্রই এটি সাইকোলজিক্যাল বাধা ১ লাখ ডলার পার করে ফেলবে।$BTC
{spot}(BTCUSDT)
#BTC
বিটকয়েনের দাম ১ লাখ ডলার ($100,000) অতিক্রম করার বিষয়টি এখন আর কেবল স্বপ্ন নয়, বরং ২০২৬ সালের এই সময়ে এটি একটি বাস্তব সম্ভাবনা হয়ে দাঁড়িয়েছে। বিটকয়েন রিজার্ভ কীভাবে দামকে এই উচ্চতায় নিয়ে যাবে, তার ৩টি প্রধান কারণ নিচে দেওয়া হলো:
১. বিশাল অংকের কেনাকাটা (The Supply Shock)
আমেরিকার প্রস্তাবিত আইন অনুযায়ী, তারা প্রতি বছর ২ লাখ করে মোট ১০ লাখ (১ মিলিয়ন) বিটকয়েন কিনবে।
বিটকয়েনের মোট সংখ্যা নির্দিষ্ট (মাত্র ২ কোটি ১০ লাখ)। এর মধ্যে বেশিরভাগই দীর্ঘমেয়াদী বিনিয়োগকারীদের কাছে আটকে আছে।
যখন আমেরিকার মতো একটি দেশ বাজার থেকে এত বিশাল পরিমাণ বিটকয়েন কেনা শুরু করবে, তখন বাজারে বিটকয়েনের সংকট দেখা দেবে। অর্থনীতির নিয়ম অনুযায়ী, সরবরাহ কমলে এবং চাহিদা বাড়লে দাম হু হু করে বাড়বে।
২. অন্যান্য দেশের প্রতিযোগিতা (Game Theory)
আমেরিকা যদি বিটকয়েন কেনা শুরু করে, তবে চীন, রাশিয়া বা ইউরোপীয় দেশগুলো হাত গুটিয়ে বসে থাকবে না। তারা ভয় পাবে যে আমেরিকা যদি সব বিটকয়েন দখল করে নেয়, তবে ভবিষ্যতে তারা পিছিয়ে পড়বে।
একে বলা হয় "গেম থিওরি"। একটি দেশ কেনা শুরু করলে অন্য দেশগুলোও নিজেদের রিজার্ভ রক্ষার জন্য বিটকয়েন কিনতে বাধ্য হবে।
এই বৈশ্বিক প্রতিযোগিতার কারণে বিটকয়েনের দাম খুব দ্রুত ১ লাখ ডলারের মাইলফলক ছাড়িয়ে যেতে পারে।
৩. প্রাতিষ্ঠানিক ও সাধারণ মানুষের আস্থা
যখন বিটকয়েন কোনো দেশের সরকারি কোষাগারে (Treasury) জায়গা পায়, তখন সাধারণ মানুষের কাছে এর গ্রহণযোগ্যতা অনেক বেড়ে যায়।
বড় বড় ব্যাংক এবং পেনশন ফান্ডগুলো তখন দ্বিধাহীনভাবে ক্রিপ্টোকারেন্সিতে বিনিয়োগ করবে।
বর্তমানে বিটকয়েন ৯১,০০০ থেকে ৯৫,০০০ ডলারের মধ্যে ওঠানামা করছে। বিশেষজ্ঞদের মতে, বিটকয়েন রিজার্ভের প্রথম কেনাকাটাটি শুরু হওয়ামাত্রই এটি সাইকোলজিক্যাল বাধা ১ লাখ ডলার পার করে ফেলবে।$BTC
১. বিশাল অংকের কেনাকাটা (The Supply Shock)
আমেরিকার প্রস্তাবিত আইন অনুযায়ী, তারা প্রতি বছর ২ লাখ করে মোট ১০ লাখ (১ মিলিয়ন) বিটকয়েন কিনবে।
বিটকয়েনের মোট সংখ্যা নির্দিষ্ট (মাত্র ২ কোটি ১০ লাখ)। এর মধ্যে বেশিরভাগই দীর্ঘমেয়াদী বিনিয়োগকারীদের কাছে আটকে আছে।
যখন আমেরিকার মতো একটি দেশ বাজার থেকে এত বিশাল পরিমাণ বিটকয়েন কেনা শুরু করবে, তখন বাজারে বিটকয়েনের সংকট দেখা দেবে। অর্থনীতির নিয়ম অনুযায়ী, সরবরাহ কমলে এবং চাহিদা বাড়লে দাম হু হু করে বাড়বে।
২. অন্যান্য দেশের প্রতিযোগিতা (Game Theory)
আমেরিকা যদি বিটকয়েন কেনা শুরু করে, তবে চীন, রাশিয়া বা ইউরোপীয় দেশগুলো হাত গুটিয়ে বসে থাকবে না। তারা ভয় পাবে যে আমেরিকা যদি সব বিটকয়েন দখল করে নেয়, তবে ভবিষ্যতে তারা পিছিয়ে পড়বে।
একে বলা হয় "গেম থিওরি"। একটি দেশ কেনা শুরু করলে অন্য দেশগুলোও নিজেদের রিজার্ভ রক্ষার জন্য বিটকয়েন কিনতে বাধ্য হবে।
এই বৈশ্বিক প্রতিযোগিতার কারণে বিটকয়েনের দাম খুব দ্রুত ১ লাখ ডলারের মাইলফলক ছাড়িয়ে যেতে পারে।
৩. প্রাতিষ্ঠানিক ও সাধারণ মানুষের আস্থা
যখন বিটকয়েন কোনো দেশের সরকারি কোষাগারে (Treasury) জায়গা পায়, তখন সাধারণ মানুষের কাছে এর গ্রহণযোগ্যতা অনেক বেড়ে যায়।
বড় বড় ব্যাংক এবং পেনশন ফান্ডগুলো তখন দ্বিধাহীনভাবে ক্রিপ্টোকারেন্সিতে বিনিয়োগ করবে।
বর্তমানে বিটকয়েন ৯১,০০০ থেকে ৯৫,০০০ ডলারের মধ্যে ওঠানামা করছে। বিশেষজ্ঞদের মতে, বিটকয়েন রিজার্ভের প্রথম কেনাকাটাটি শুরু হওয়ামাত্রই এটি সাইকোলজিক্যাল বাধা ১ লাখ ডলার পার করে ফেলবে।$BTC
1
91
·
--
ブリッシュ
最近のUsual(USUAL)のポンプ
急騰の要因:
プロトコルの成長: マルチアービトラージボットのローンチとエコシステムのアップデートにより、投資家の信頼が高まった。
低い流通供給: 多くのトークンがまだロックされていたり、リワードのためにステーキングされているため、取引所での利用可能な供給が少なく、価格が上昇しやすい。
新規上場のハイプ: 大手取引所での新しいプロジェクトとして、次の大きな「ジェム」を求めるトレーダーからの「FOMO」(見逃したくない恐怖)を引き寄せる。
マーケットセンチメント: 「トップゲイナー」リストでトレンド入りしており、必然的に投機的な買いのボリュームが増加している。$USUAL
{spot}(USUALUSDT)
Usual Crypto
最近のUsual(USUAL)のポンプ
急騰の要因:
プロトコルの成長: マルチアービトラージボットのローンチとエコシステムのアップデートにより、投資家の信頼が高まった。
低い流通供給: 多くのトークンがまだロックされていたり、リワードのためにステーキングされているため、取引所での利用可能な供給が少なく、価格が上昇しやすい。
新規上場のハイプ: 大手取引所での新しいプロジェクトとして、次の大きな「ジェム」を求めるトレーダーからの「FOMO」(見逃したくない恐怖)を引き寄せる。
マーケットセンチメント: 「トップゲイナー」リストでトレンド入りしており、必然的に投機的な買いのボリュームが増加している。$USUAL
Usual Crypto
急騰の要因:
プロトコルの成長: マルチアービトラージボットのローンチとエコシステムのアップデートにより、投資家の信頼が高まった。
低い流通供給: 多くのトークンがまだロックされていたり、リワードのためにステーキングされているため、取引所での利用可能な供給が少なく、価格が上昇しやすい。
新規上場のハイプ: 大手取引所での新しいプロジェクトとして、次の大きな「ジェム」を求めるトレーダーからの「FOMO」(見逃したくない恐怖)を引き寄せる。
マーケットセンチメント: 「トップゲイナー」リストでトレンド入りしており、必然的に投機的な買いのボリュームが増加している。$USUAL
Usual Crypto
1
100
·
--
弱気相場
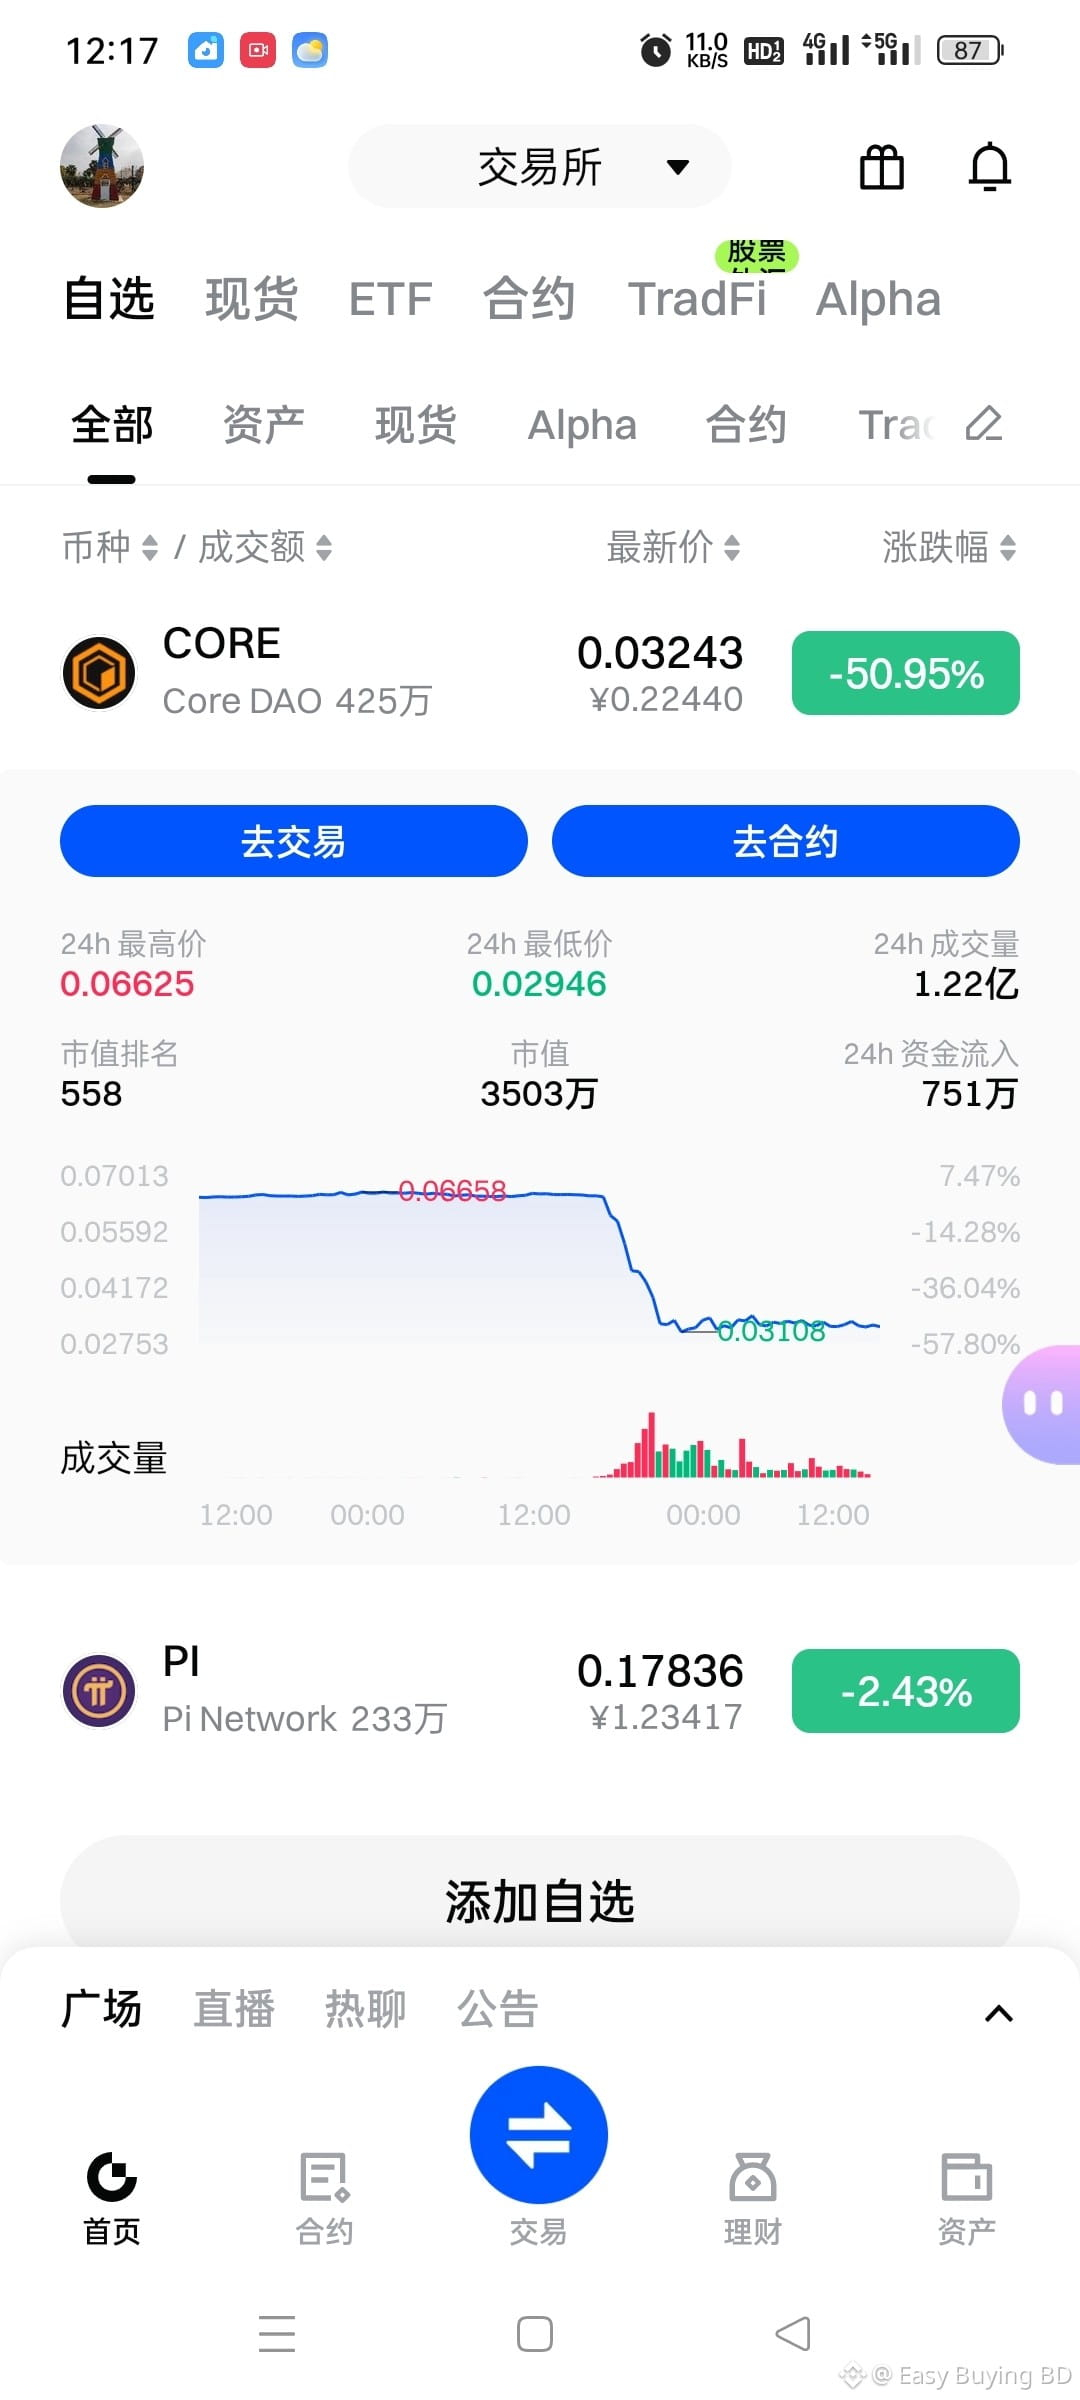
$CORE の芽生えが新たな関心を呼び起こしていますが、この注目を集めているのは何でしょうか?
624
go.kryll.io/xray-coredaoorg-70...
X-Ray 分析:
CORE
幅
グローバルスコア: 81.5/100
του take
市場データ
現在の価格: $ 0.044961
24時間の変化:
-31.31%
24時間の取引量: $ 19.8M
時価総額: $ 48.7M
プレイするために
監査スコア
財務: 84.1
基本的: 71.2
社会的: 92.0
セキュリティ: 88.6
分析
常に DYOR
自分自身の調査を行ってください
#CoreDAO🔶️🔥👀
$CORE の芽生えが新たな関心を呼び起こしていますが、この注目を集めているのは何でしょうか?
624
go.kryll.io/xray-coredaoorg-70...
X-Ray 分析:
CORE
幅
グローバルスコア: 81.5/100
του take
市場データ
現在の価格: $ 0.044961
24時間の変化:
-31.31%
24時間の取引量: $ 19.8M
時価総額: $ 48.7M
プレイするために
監査スコア
財務: 84.1
基本的: 71.2
社会的: 92.0
セキュリティ: 88.6
分析
常に DYOR
自分自身の調査を行ってください
#CoreDAO🔶️🔥👀
624
go.kryll.io/xray-coredaoorg-70...
X-Ray 分析:
CORE
幅
グローバルスコア: 81.5/100
του take
市場データ
現在の価格: $ 0.044961
24時間の変化:
-31.31%
24時間の取引量: $ 19.8M
時価総額: $ 48.7M
プレイするために
監査スコア
財務: 84.1
基本的: 71.2
社会的: 92.0
セキュリティ: 88.6
分析
常に DYOR
自分自身の調査を行ってください
#CoreDAO🔶️🔥👀

1
86
·
--
弱気相場
Core Foundation ($CORE)とMaple Financeの間の状況は、高リスクの法的闘争ですが、ここでは推測と確認されたリスクを区別するのに役立つ現在の事実の整理を示します:
1. 争いの核心 ($155百万)
この対立は、lstBTC(流動ステーキング)プロジェクトのためにユーザーが預けた$155百万のビットコインに集中しています。Core Foundationは、Maple Financeが競合製品を立ち上げるためにCoreの独自技術と機密データを使用したことで、パートナーシップを違反したと主張しています。
2. 法的状況:差止命令
Core Foundationは実際に重要な予備的ラウンドで勝利しました。ケイマン諸島の裁判所はMaple Financeに対して差止命令を出しました。これにより、Mapleは法的に以下のことを禁止されています:
自社の競合する流動ステーキングトークンを立ち上げること。
仲裁が進行中の間、COREトークンの取り扱いまたは争われている知的財産の使用。
3. 「崩壊」リスク(80%の確率?)
市場の感情は変動しやすいですが、「崩壊の80%の確率」を確認する公式な財務データはありません。
仲裁の結果:Coreが勝つと、仲裁裁定は法的に拘束力があります。企業が倒産している場合、資金の回収は難しいかもしれませんが、裁判所は資産の押収や業務の停止を命じることができるため、「不可能」ではありません。
資産の安全性:主なリスクは、$155百万のビットコインが破産から隔離された金庫に保管されているかどうかです。資金が分離されている場合、訴訟に勝者が誰であってもユーザーの財産として残ります。もしそれがMapleの運営資金と混同されていた場合、リスクは大幅に増加します。
4. なぜ$150百万の支払いが懸念されるのか
Coreが支払う必要があるか、$150百万を失うというあなたの指摘は、仲裁が失敗した場合の「機会コスト」またはユーザー資金の損失を指しています。Coreが敗れ、資金が回収されなければ、ユーザーに対して大きな負債を負うことになり、エコシステムの安定性が脅かされる可能性があります。
$BTC
{spot}(BTCUSDT)
Core Foundation ($CORE)とMaple Financeの間の状況は、高リスクの法的闘争ですが、ここでは推測と確認されたリスクを区別するのに役立つ現在の事実の整理を示します:
1. 争いの核心 ($155百万)
この対立は、lstBTC(流動ステーキング)プロジェクトのためにユーザーが預けた$155百万のビットコインに集中しています。Core Foundationは、Maple Financeが競合製品を立ち上げるためにCoreの独自技術と機密データを使用したことで、パートナーシップを違反したと主張しています。
2. 法的状況:差止命令
Core Foundationは実際に重要な予備的ラウンドで勝利しました。ケイマン諸島の裁判所はMaple Financeに対して差止命令を出しました。これにより、Mapleは法的に以下のことを禁止されています:
自社の競合する流動ステーキングトークンを立ち上げること。
仲裁が進行中の間、COREトークンの取り扱いまたは争われている知的財産の使用。
3. 「崩壊」リスク(80%の確率?)
市場の感情は変動しやすいですが、「崩壊の80%の確率」を確認する公式な財務データはありません。
仲裁の結果:Coreが勝つと、仲裁裁定は法的に拘束力があります。企業が倒産している場合、資金の回収は難しいかもしれませんが、裁判所は資産の押収や業務の停止を命じることができるため、「不可能」ではありません。
資産の安全性:主なリスクは、$155百万のビットコインが破産から隔離された金庫に保管されているかどうかです。資金が分離されている場合、訴訟に勝者が誰であってもユーザーの財産として残ります。もしそれがMapleの運営資金と混同されていた場合、リスクは大幅に増加します。
4. なぜ$150百万の支払いが懸念されるのか
Coreが支払う必要があるか、$150百万を失うというあなたの指摘は、仲裁が失敗した場合の「機会コスト」またはユーザー資金の損失を指しています。Coreが敗れ、資金が回収されなければ、ユーザーに対して大きな負債を負うことになり、エコシステムの安定性が脅かされる可能性があります。
$BTC
1. 争いの核心 ($155百万)
この対立は、lstBTC(流動ステーキング)プロジェクトのためにユーザーが預けた$155百万のビットコインに集中しています。Core Foundationは、Maple Financeが競合製品を立ち上げるためにCoreの独自技術と機密データを使用したことで、パートナーシップを違反したと主張しています。
2. 法的状況:差止命令
Core Foundationは実際に重要な予備的ラウンドで勝利しました。ケイマン諸島の裁判所はMaple Financeに対して差止命令を出しました。これにより、Mapleは法的に以下のことを禁止されています:
自社の競合する流動ステーキングトークンを立ち上げること。
仲裁が進行中の間、COREトークンの取り扱いまたは争われている知的財産の使用。
3. 「崩壊」リスク(80%の確率?)
市場の感情は変動しやすいですが、「崩壊の80%の確率」を確認する公式な財務データはありません。
仲裁の結果:Coreが勝つと、仲裁裁定は法的に拘束力があります。企業が倒産している場合、資金の回収は難しいかもしれませんが、裁判所は資産の押収や業務の停止を命じることができるため、「不可能」ではありません。
資産の安全性:主なリスクは、$155百万のビットコインが破産から隔離された金庫に保管されているかどうかです。資金が分離されている場合、訴訟に勝者が誰であってもユーザーの財産として残ります。もしそれがMapleの運営資金と混同されていた場合、リスクは大幅に増加します。
4. なぜ$150百万の支払いが懸念されるのか
Coreが支払う必要があるか、$150百万を失うというあなたの指摘は、仲裁が失敗した場合の「機会コスト」またはユーザー資金の損失を指しています。Coreが敗れ、資金が回収されなければ、ユーザーに対して大きな負債を負うことになり、エコシステムの安定性が脅かされる可能性があります。
$BTC

51
記事
#レンジトレーディング戦略 レンジトレーディング戦略:機関投資家のアプローチ#レンジトレーディング戦略 レンジトレーディング戦略:機関投資家のアプローチ
ほとんどの小売トレーダーはレンジ市場でお金を失います。彼らはブレイクアウトを期待してトップで購入したり、ブレイクダウンを期待してボトムで売ったりしますが、価格が逆転して彼らをストップアウトさせるのを見守るだけです。問題はレンジ自体ではなく、そのアプローチです。
機関投資家とスマートマネーコンセプト(SMC)は、レンジを取引する別の方法を教えています。ノイズと戦う代わりに、流動性、操作、および注文フローに焦点を当てています。この文書は、機関投資家のフレームワークを使用してレンジを取引する方法を解説します。
#レンジトレーディング戦略 レンジトレーディング戦略:機関投資家のアプローチ
#レンジトレーディング戦略 レンジトレーディング戦略:機関投資家のアプローチ
ほとんどの小売トレーダーはレンジ市場でお金を失います。彼らはブレイクアウトを期待してトップで購入したり、ブレイクダウンを期待してボトムで売ったりしますが、価格が逆転して彼らをストップアウトさせるのを見守るだけです。問題はレンジ自体ではなく、そのアプローチです。
機関投資家とスマートマネーコンセプト(SMC)は、レンジを取引する別の方法を教えています。ノイズと戦う代わりに、流動性、操作、および注文フローに焦点を当てています。この文書は、機関投資家のフレームワークを使用してレンジを取引する方法を解説します。
ほとんどの小売トレーダーはレンジ市場でお金を失います。彼らはブレイクアウトを期待してトップで購入したり、ブレイクダウンを期待してボトムで売ったりしますが、価格が逆転して彼らをストップアウトさせるのを見守るだけです。問題はレンジ自体ではなく、そのアプローチです。
機関投資家とスマートマネーコンセプト(SMC)は、レンジを取引する別の方法を教えています。ノイズと戦う代わりに、流動性、操作、および注文フローに焦点を当てています。この文書は、機関投資家のフレームワークを使用してレンジを取引する方法を解説します。
49
#BTCETFFeeRace $BTC
{spot}(BTCUSDT)
長期的なリターンの向上:管理手数料が低く(現在は0.14%まで低下)、あなたの投資がファンドプロバイダーによって食いつぶされることが少なくなります。数年の間に、0.1%の違いが何千ドルも節約できます。
手頃さ:ビットコインETFは、標準のS&P 500インデックスファンドと同じくらい安くなり、日常の個人投資家にも手の届くものとなっています。
機関投資家のセキュリティ:モルガン・スタンレー、ブラックロック、フィデリティなどの大手間の激しい競争により、ビットコインを管理するためにプライベートキーを扱うことなく、規制された安全な方法で保有することができます。
流動性の向上:支配を巡る競争が莫大な取引量を生み出します。この高い流動性により、大量を瞬時に最良の市場価格で売買することが可能です。
プロフェッショナルの信頼:非常に低い手数料により、金融アドバイザーが伝統的な退職ポートフォリオ(401kなど)にビットコインを組み込むことが容易になり、より「安定した」お金が市場に流入しています。
#BTCETFFeeRace $BTC
長期的なリターンの向上:管理手数料が低く(現在は0.14%まで低下)、あなたの投資がファンドプロバイダーによって食いつぶされることが少なくなります。数年の間に、0.1%の違いが何千ドルも節約できます。
手頃さ:ビットコインETFは、標準のS&P 500インデックスファンドと同じくらい安くなり、日常の個人投資家にも手の届くものとなっています。
機関投資家のセキュリティ:モルガン・スタンレー、ブラックロック、フィデリティなどの大手間の激しい競争により、ビットコインを管理するためにプライベートキーを扱うことなく、規制された安全な方法で保有することができます。
流動性の向上:支配を巡る競争が莫大な取引量を生み出します。この高い流動性により、大量を瞬時に最良の市場価格で売買することが可能です。
プロフェッショナルの信頼:非常に低い手数料により、金融アドバイザーが伝統的な退職ポートフォリオ(401kなど)にビットコインを組み込むことが容易になり、より「安定した」お金が市場に流入しています。
長期的なリターンの向上:管理手数料が低く(現在は0.14%まで低下)、あなたの投資がファンドプロバイダーによって食いつぶされることが少なくなります。数年の間に、0.1%の違いが何千ドルも節約できます。
手頃さ:ビットコインETFは、標準のS&P 500インデックスファンドと同じくらい安くなり、日常の個人投資家にも手の届くものとなっています。
機関投資家のセキュリティ:モルガン・スタンレー、ブラックロック、フィデリティなどの大手間の激しい競争により、ビットコインを管理するためにプライベートキーを扱うことなく、規制された安全な方法で保有することができます。
流動性の向上:支配を巡る競争が莫大な取引量を生み出します。この高い流動性により、大量を瞬時に最良の市場価格で売買することが可能です。
プロフェッショナルの信頼:非常に低い手数料により、金融アドバイザーが伝統的な退職ポートフォリオ(401kなど)にビットコインを組み込むことが容易になり、より「安定した」お金が市場に流入しています。
1
100
$SIGN
{spot}(SIGNUSDT)
#signdigitalsovereigninfra $SIGN 私のクリプトジャーニー
1. リアルタイム市場インサイト
Binance Squareは最新ニュースとテクニカル分析のためのワンストップハブとして機能します。Binanceエコシステムに統合されているため、市場を動かす情報が発生した瞬間に得られ、情報に基づいたトレーディング判断を下すのに役立ちます。
2. エキスパートとの直接インタラクション
このプラットフォームには、経験豊富なトレーダーや業界リーダーの大規模なコミュニティがあります。お気に入りのアナリストをフォローしたり、質問をしたり、ディスカッションに参加したりして、エキスパートとリテール投資家のギャップを埋めることができます。
3. コンテンツのマネタイズ
質の高いコンテンツを共有するクリエイター向けに、Binance Squareは収益を得る複数の方法を提供します。Write to Earnプログラムやチッピング機能を通じて、クリエイターはフォロワーからのエンゲージメントに基づいて直接クリプト報酬を受け取ることができます。
4. 限定アルファとプロジェクトのアップデート
多くのプロジェクトがBinance Squareを利用して、独占的なアップデートや「アルファ」(初期段階の情報)を投稿します。アクティブでいることで、今後のローンチやエコシステムの発展に関する前列の席を得ることができます。
5. 安全でシームレスな統合
Binanceアプリに直接組み込まれているため、フィッシングの標的となることが多いサードパーティのソーシャルメディアサイトは必要ありません。分析を読むことから安全な環境で取引を実行することができます。
Binanceチームへの最高の敬意
$SIGN
#signdigitalsovereigninfra $SIGN 私のクリプトジャーニー
1. リアルタイム市場インサイト
Binance Squareは最新ニュースとテクニカル分析のためのワンストップハブとして機能します。Binanceエコシステムに統合されているため、市場を動かす情報が発生した瞬間に得られ、情報に基づいたトレーディング判断を下すのに役立ちます。
2. エキスパートとの直接インタラクション
このプラットフォームには、経験豊富なトレーダーや業界リーダーの大規模なコミュニティがあります。お気に入りのアナリストをフォローしたり、質問をしたり、ディスカッションに参加したりして、エキスパートとリテール投資家のギャップを埋めることができます。
3. コンテンツのマネタイズ
質の高いコンテンツを共有するクリエイター向けに、Binance Squareは収益を得る複数の方法を提供します。Write to Earnプログラムやチッピング機能を通じて、クリエイターはフォロワーからのエンゲージメントに基づいて直接クリプト報酬を受け取ることができます。
4. 限定アルファとプロジェクトのアップデート
多くのプロジェクトがBinance Squareを利用して、独占的なアップデートや「アルファ」(初期段階の情報)を投稿します。アクティブでいることで、今後のローンチやエコシステムの発展に関する前列の席を得ることができます。
5. 安全でシームレスな統合
Binanceアプリに直接組み込まれているため、フィッシングの標的となることが多いサードパーティのソーシャルメディアサイトは必要ありません。分析を読むことから安全な環境で取引を実行することができます。
Binanceチームへの最高の敬意
#signdigitalsovereigninfra $SIGN 私のクリプトジャーニー
1. リアルタイム市場インサイト
Binance Squareは最新ニュースとテクニカル分析のためのワンストップハブとして機能します。Binanceエコシステムに統合されているため、市場を動かす情報が発生した瞬間に得られ、情報に基づいたトレーディング判断を下すのに役立ちます。
2. エキスパートとの直接インタラクション
このプラットフォームには、経験豊富なトレーダーや業界リーダーの大規模なコミュニティがあります。お気に入りのアナリストをフォローしたり、質問をしたり、ディスカッションに参加したりして、エキスパートとリテール投資家のギャップを埋めることができます。
3. コンテンツのマネタイズ
質の高いコンテンツを共有するクリエイター向けに、Binance Squareは収益を得る複数の方法を提供します。Write to Earnプログラムやチッピング機能を通じて、クリエイターはフォロワーからのエンゲージメントに基づいて直接クリプト報酬を受け取ることができます。
4. 限定アルファとプロジェクトのアップデート
多くのプロジェクトがBinance Squareを利用して、独占的なアップデートや「アルファ」(初期段階の情報)を投稿します。アクティブでいることで、今後のローンチやエコシステムの発展に関する前列の席を得ることができます。
5. 安全でシームレスな統合
Binanceアプリに直接組み込まれているため、フィッシングの標的となることが多いサードパーティのソーシャルメディアサイトは必要ありません。分析を読むことから安全な環境で取引を実行することができます。
Binanceチームへの最高の敬意
1
7
·
--
弱気相場
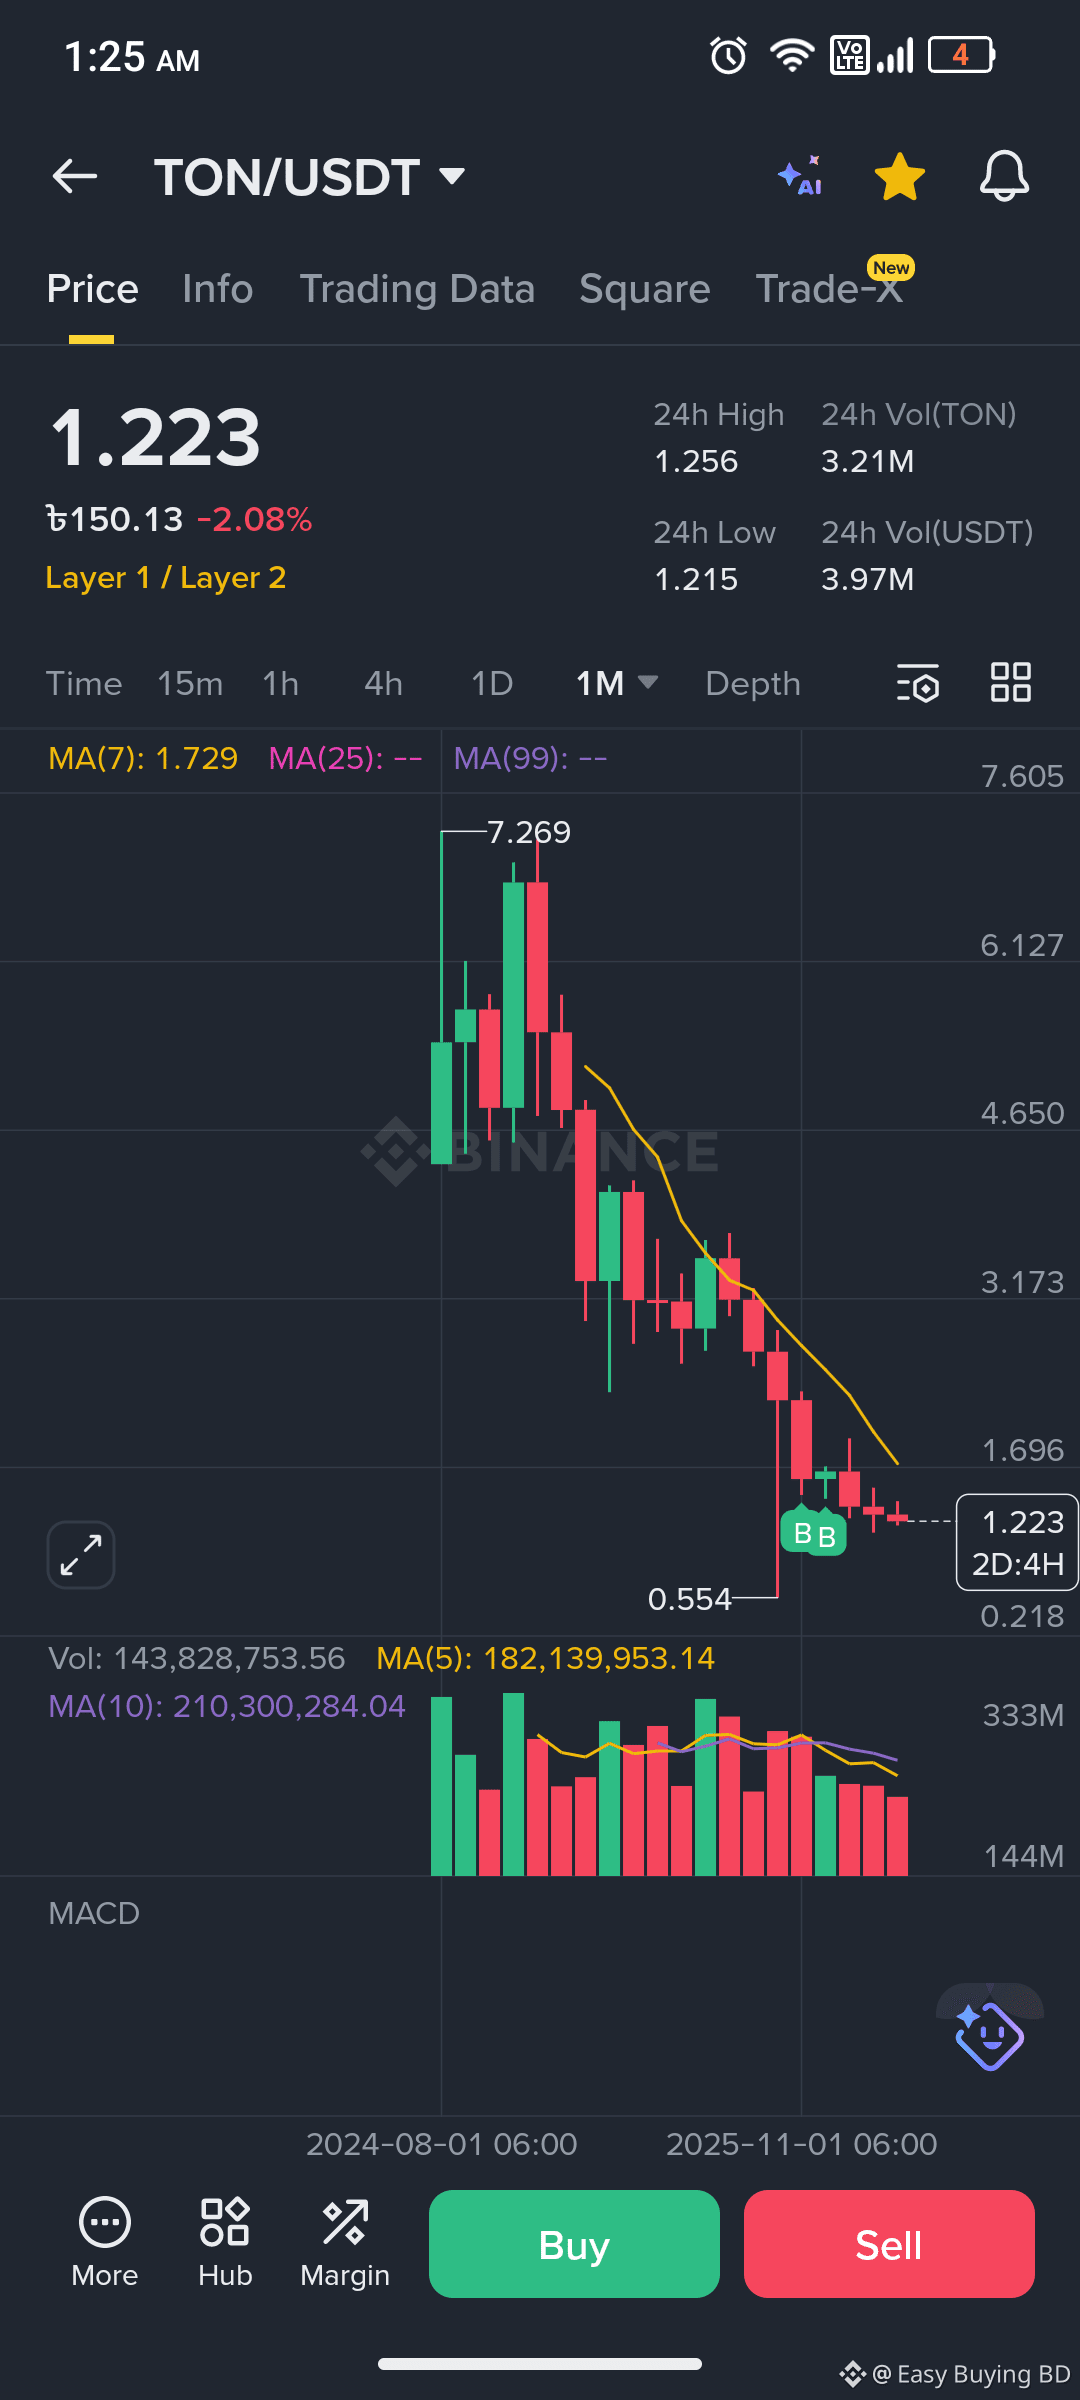
TON価格分析と予測(2026年3月):
現在の価格:2026年3月30日現在、Toncoin(TON)は約1.24ドルで取引されています。
短期的見通し(2026年後半):アナリストは1.13ドルから2.85ドルの価格範囲を予測しています。強気の予測は、エコシステムが拡大するにつれて8ドルから13ドルのターゲットを示唆しています。
長期的見通し(2028年~2030年):予測は保守的な1.31ドルから2030年までの機関投資家向けの19.50ドル~32.81ドルまでの範囲です。極端な「強気ケース」シナリオは49.22ドル~150ドルに達します。
主な要因:
Telegram統合:埋め込まれたTelegramウォレットを介して9億5000万人のユーザーに直接暗号アクセスを提供します。
エコシステムの成長:AI向けのAgenticKitやRust Node v1のアップグレードなどの最近のローンチにより、ネットワークの安定性が向上します。
今後のアップグレード:新しいTONコンセンサス(2026年第2四半期)は、スケーラビリティを大幅に向上させることを目的としています。
注意:暗号通貨は非常に投機的で変動が激しいです。
$TON
{spot}(TONUSDT)
TON価格分析と予測(2026年3月):
現在の価格:2026年3月30日現在、Toncoin(TON)は約1.24ドルで取引されています。
短期的見通し(2026年後半):アナリストは1.13ドルから2.85ドルの価格範囲を予測しています。強気の予測は、エコシステムが拡大するにつれて8ドルから13ドルのターゲットを示唆しています。
長期的見通し(2028年~2030年):予測は保守的な1.31ドルから2030年までの機関投資家向けの19.50ドル~32.81ドルまでの範囲です。極端な「強気ケース」シナリオは49.22ドル~150ドルに達します。
主な要因:
Telegram統合:埋め込まれたTelegramウォレットを介して9億5000万人のユーザーに直接暗号アクセスを提供します。
エコシステムの成長:AI向けのAgenticKitやRust Node v1のアップグレードなどの最近のローンチにより、ネットワークの安定性が向上します。
今後のアップグレード:新しいTONコンセンサス(2026年第2四半期)は、スケーラビリティを大幅に向上させることを目的としています。
注意:暗号通貨は非常に投機的で変動が激しいです。
$TON
現在の価格:2026年3月30日現在、Toncoin(TON)は約1.24ドルで取引されています。
短期的見通し(2026年後半):アナリストは1.13ドルから2.85ドルの価格範囲を予測しています。強気の予測は、エコシステムが拡大するにつれて8ドルから13ドルのターゲットを示唆しています。
長期的見通し(2028年~2030年):予測は保守的な1.31ドルから2030年までの機関投資家向けの19.50ドル~32.81ドルまでの範囲です。極端な「強気ケース」シナリオは49.22ドル~150ドルに達します。
主な要因:
Telegram統合:埋め込まれたTelegramウォレットを介して9億5000万人のユーザーに直接暗号アクセスを提供します。
エコシステムの成長:AI向けのAgenticKitやRust Node v1のアップグレードなどの最近のローンチにより、ネットワークの安定性が向上します。
今後のアップグレード:新しいTONコンセンサス(2026年第2四半期)は、スケーラビリティを大幅に向上させることを目的としています。
注意:暗号通貨は非常に投機的で変動が激しいです。
$TON
2
103
·
--
弱気相場
ETH価格分析と予測(2026年3月):
現在の価格:2026年3月30日時点で、イーサリアム(ETH)は約1,996ドルで取引されています。
短期見通し(2026年後半):アナリストは、2,481ドルから3,509ドルに回復することを予想しています。強気の予測では、グラムスタンダムネットワークのアップグレードに伴い、4,572ドルに達する可能性があります。
長期見通し(2028年~2030年):予測は、2027年の平均5,222ドルから、2030年までに機関投資家の目標である11,800ドルから14,454ドルまでの範囲です。
主要なドライバー:
ネットワークアップグレード:グラムスタンダムとヘゴタのアップグレードは、速度を向上させ、ガス料金を75%削減することを目指しています。
ステーキングとETF:スポットイーサETFを通じた機関投資家の流入の増加と、高いステーキング参加率(供給の29%)が構造的な支援を提供します。
市場の支配力:イーサリアムは、トークン化された実世界資産(RWA)市場の65%を保持しています。
注意:暗号通貨は非常にボラティリティが高いです。$ETH
{spot}(ETHUSDT)
ETH価格分析と予測(2026年3月):
現在の価格:2026年3月30日時点で、イーサリアム(ETH)は約1,996ドルで取引されています。
短期見通し(2026年後半):アナリストは、2,481ドルから3,509ドルに回復することを予想しています。強気の予測では、グラムスタンダムネットワークのアップグレードに伴い、4,572ドルに達する可能性があります。
長期見通し(2028年~2030年):予測は、2027年の平均5,222ドルから、2030年までに機関投資家の目標である11,800ドルから14,454ドルまでの範囲です。
主要なドライバー:
ネットワークアップグレード:グラムスタンダムとヘゴタのアップグレードは、速度を向上させ、ガス料金を75%削減することを目指しています。
ステーキングとETF:スポットイーサETFを通じた機関投資家の流入の増加と、高いステーキング参加率(供給の29%)が構造的な支援を提供します。
市場の支配力:イーサリアムは、トークン化された実世界資産(RWA)市場の65%を保持しています。
注意:暗号通貨は非常にボラティリティが高いです。$ETH
現在の価格:2026年3月30日時点で、イーサリアム(ETH)は約1,996ドルで取引されています。
短期見通し(2026年後半):アナリストは、2,481ドルから3,509ドルに回復することを予想しています。強気の予測では、グラムスタンダムネットワークのアップグレードに伴い、4,572ドルに達する可能性があります。
長期見通し(2028年~2030年):予測は、2027年の平均5,222ドルから、2030年までに機関投資家の目標である11,800ドルから14,454ドルまでの範囲です。
主要なドライバー:
ネットワークアップグレード:グラムスタンダムとヘゴタのアップグレードは、速度を向上させ、ガス料金を75%削減することを目指しています。
ステーキングとETF:スポットイーサETFを通じた機関投資家の流入の増加と、高いステーキング参加率(供給の29%)が構造的な支援を提供します。
市場の支配力:イーサリアムは、トークン化された実世界資産(RWA)市場の65%を保持しています。
注意:暗号通貨は非常にボラティリティが高いです。$ETH
131
ログインして、さらにコンテンツを読む
厳選トピックで世界の暗号資産トレーダーの仲間入り
⚡️ 暗号資産に関する最新かつ有益な情報が見つかります。
💬 世界最大の暗号資産取引所から信頼されています。
👍 認証を受けたクリエイターから、有益なインサイトを得られます。
メール / 電話番号
トレンドトピック
QNTRises39%
閲覧回数 8,672
505人が討論中
#qntrises39%
🚀 $QNT ポンプ中 +39%!超大型の機関投資家ニュース!💥
QNT は、機関投資家による採用の大きな勢いを受けて $100 を突破しつつあります!🔥
$QNT
📰 ラリーをけん引する大ニュース:
Quant Network の Overledger インフラが、トークン化された預金とデジタルバンキングのソリューション導入を後押ししています。企業の取引量は 553% 超増加しており、QNT はわずか数時間で $70 から $100 超まで急騰!📊📈
🟡 あなたが知っておくべき Binance のアップデート:
資金口座の移行:Binance は、ユーザーの仮想通貨残高を「資金口座」から「現物口座」へ公式に移行しています。
「Stocks Account(株式口座)」への名称変更:資金口座は、6つの主要資産(USD、USDC、USDT、USD1、U、BNB)を使った株式&株式オプション取引の決済専用として「Stocks Account(株式口座)」に改名されます。
対応が必要:自動の一括移管が始まる前に、Binance アプリで「ワンクリック移行」機能を確認し、仮想通貨を現物口座へ移してください!
🤔 QNT は次に $110 をぶち抜くのか、それともここで調整局面なのか?下に価格予想を投稿してください!👇
#QNT #Quant #BinanceUpdates #CryptoNews
Lily星星
·いいね:1件
·閲覧回数 2.9k
EthereumBreaksAbove$2700
閲覧回数 1,103
61人が討論中
BitgetBreachForgedRequestsNotStolenKeys
閲覧回数 8,091
415人が討論中