

DOODHI
88 投稿

DOODHI
報告
ユーザーをブロック
chart analysis and breakout expert spot trading and future trading
取引を発注
高頻度トレーダー
4.9年
49 フォロー
38 フォロワー
59 いいね
投稿
ポートフォリオ
すべて
引用
ライブ
·
--
記事
翻訳参照
$STX USDT 8H chart analysisSTXUSDT 8H chart analysis
Short-term bullish recovery Major resistance overhead
Based on your TradingView screenshot, STX is showing a potential bullish reversal from an important support zone. However, confirmation is still needed.
1. Market structure
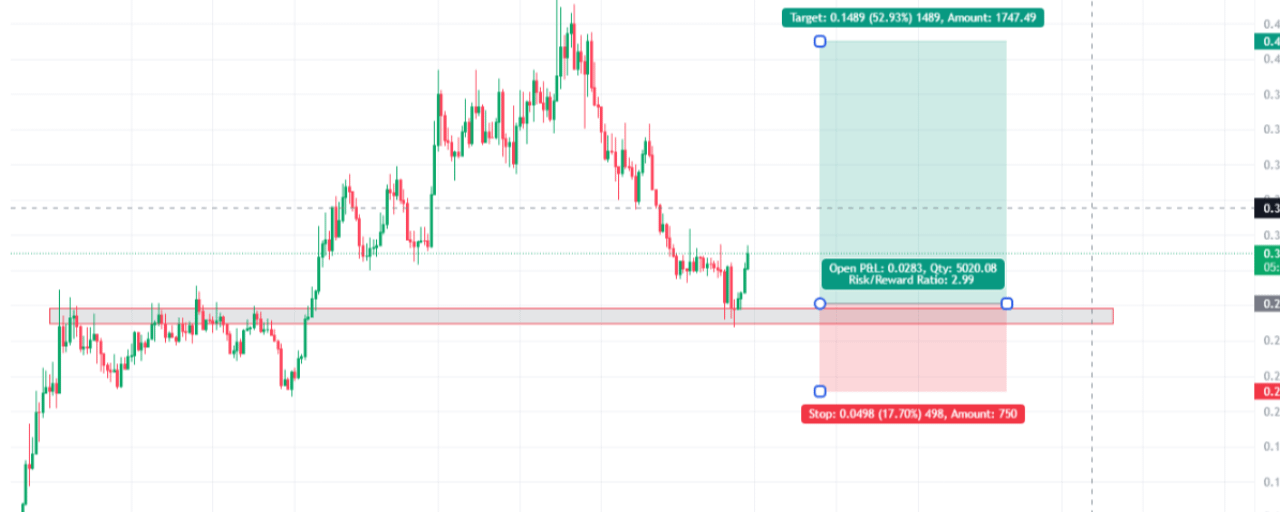
Previous trend: Strong bullish rally from approximately $0.13 to $0.45.After the top: Clear bearish structure with lower highs and lower lows.Current situation: Price has reached the previous accumulation/support zone around $0.26–$0.27 and bounced.Current price: Approximately $0.3097.
The recent bounce is encouraging, but the 8H trend has not yet fully reversed.
2. Important price levels
Level
Price
Significance
Major resistance
$0.33–0.34
Breakout confirmation
Resistance 2
$0.36–0.37
Previous supply
Major target
$0.42–0.43
Your chart target
Current price
$0.3097
Current trading area
Support 1
$0.28–0.29
Short-term support
Strong support
$0.26–0.27
Demand zone
Stop-loss area
$0.23
Trade invalidation
3. Analysis of your long position
Your TradingView long-position tool shows:
Entry: approximately $0.281Target: approximately $0.430Stop-loss: approximately $0.231Risk/reward: 1:2.99Potential upside: 52.93%Potential downside: 17.70%
Risk/reward is attractive
Your entry is strategically positioned near the historical demand zone.
However, the main concern is that price is still below the $0.33–$0.34 resistance.
4. What I expect next
Scenario A — Bullish continuation
Preferred confirmation
Price holds above $0.28–$0.29.An 8H candle closes above $0.33–$0.34.Price retests that level successfully.Potential upside targets: $0.36, $0.39 and $0.42–$0.43.Scenario B — Bearish rejectionRisk scenarioPrice gets rejected around $0.33.Falls below $0.28.Retests $0.26–$0.27.Losing that demand zone could expose lower prices.
5. My trading opinion
I like the location of your entry because it is close to historical support. But I would not consider the bullish reversal confirmed yet.
My preferred confirmation would be an 8H candle close above $0.33–$0.34, followed by a successful retest.
One important point: Your stop at $0.231 is below the support zone, which gives the trade room to fluctuate, but the position size should be calculated according to your maximum acceptable account loss.
One question
Are you already holding this STX long position, or are you planning to enter around $0.28?
That changes whether I would focus on managing the existing trade or finding a better entry.
$BTC
$STX
{spot}(STXUSDT)
#STX #STX/USDT #STXBTC #BinanceReports80%Recoveryof$6.3BillioninLossesfromHackIncident
$STX USDT 8H chart analysis
STXUSDT 8H chart analysis
Short-term bullish recovery Major resistance overhead
Based on your TradingView screenshot, STX is showing a potential bullish reversal from an important support zone. However, confirmation is still needed.
1. Market structure
Previous trend: Strong bullish rally from approximately $0.13 to $0.45.After the top: Clear bearish structure with lower highs and lower lows.Current situation: Price has reached the previous accumulation/support zone around $0.26–$0.27 and bounced.Current price: Approximately $0.3097.
The recent bounce is encouraging, but the 8H trend has not yet fully reversed.
2. Important price levels
Level
Price
Significance
Major resistance
$0.33–0.34
Breakout confirmation
Resistance 2
$0.36–0.37
Previous supply
Major target
$0.42–0.43
Your chart target
Current price
$0.3097
Current trading area
Support 1
$0.28–0.29
Short-term support
Strong support
$0.26–0.27
Demand zone
Stop-loss area
$0.23
Trade invalidation
3. Analysis of your long position
Your TradingView long-position tool shows:
Entry: approximately $0.281Target: approximately $0.430Stop-loss: approximately $0.231Risk/reward: 1:2.99Potential upside: 52.93%Potential downside: 17.70%
Risk/reward is attractive
Your entry is strategically positioned near the historical demand zone.
However, the main concern is that price is still below the $0.33–$0.34 resistance.
4. What I expect next
Scenario A — Bullish continuation
Preferred confirmation
Price holds above $0.28–$0.29.An 8H candle closes above $0.33–$0.34.Price retests that level successfully.Potential upside targets: $0.36, $0.39 and $0.42–$0.43.Scenario B — Bearish rejectionRisk scenarioPrice gets rejected around $0.33.Falls below $0.28.Retests $0.26–$0.27.Losing that demand zone could expose lower prices.
5. My trading opinion
I like the location of your entry because it is close to historical support. But I would not consider the bullish reversal confirmed yet.
My preferred confirmation would be an 8H candle close above $0.33–$0.34, followed by a successful retest.
One important point: Your stop at $0.231 is below the support zone, which gives the trade room to fluctuate, but the position size should be calculated according to your maximum acceptable account loss.
One question
Are you already holding this STX long position, or are you planning to enter around $0.28?
That changes whether I would focus on managing the existing trade or finding a better entry.
$BTC
$STX
#STX #STX/USDT #STXBTC #BinanceReports80%Recoveryof$6.3BillioninLossesfromHackIncident
114
·
--
🚀 MAGMAUSDT – 強気のモメンタム | 1時間足チャート分析
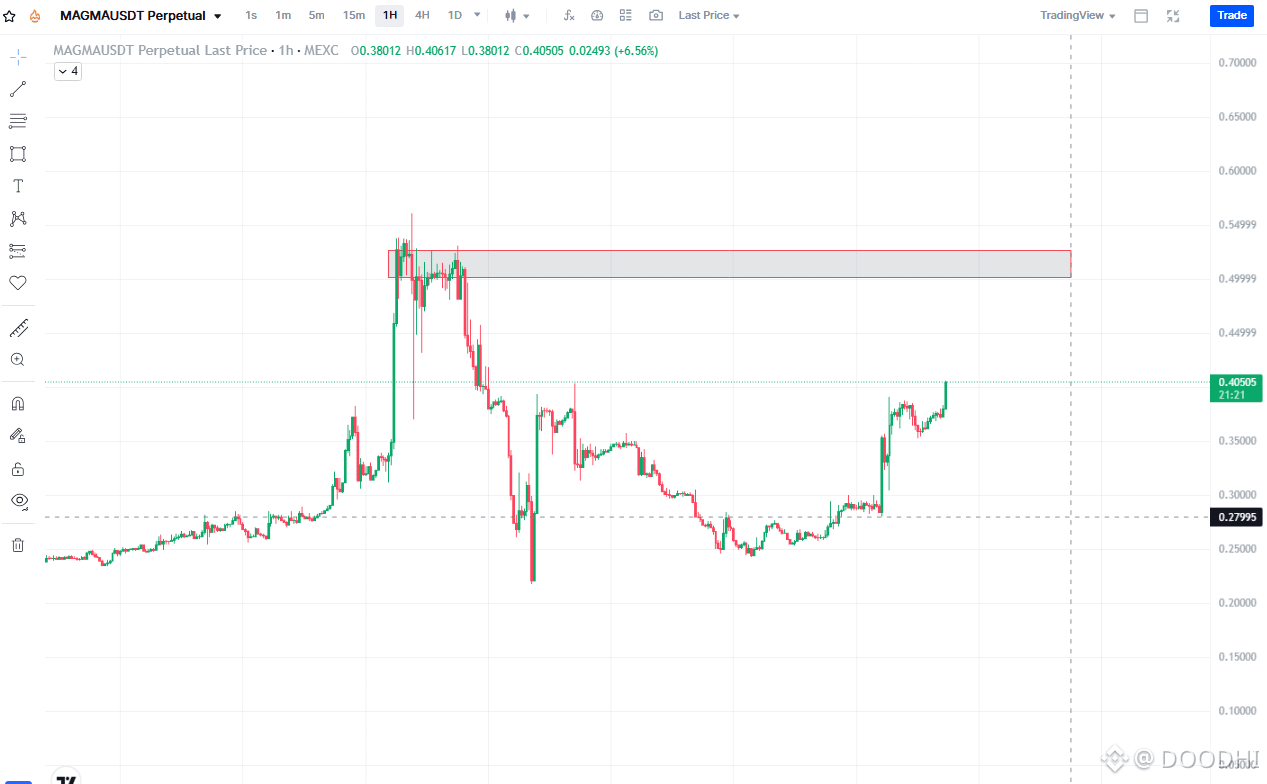
MAGMAUSDTは1時間足チャートで強い上昇モメンタムを示しており、現在の価格は約0.40505 USDTです。
📊 テクニカル分析:
価格は0.25~0.28のサポートエリアから大きく回復し、現在は重要なレジスタンスゾーンに近づいています。買い手の勢いは強まっていますが、大きなブレイクアウトを期待するには確認が必要です。
🔑 注目すべき重要な価格水準:
🟢 現在の価格: 0.40505 USDT
🎯 目標1: 0.4500 USDT
🎯 目標2: 0.5000 USDT
🔴 主要レジスタンスゾーン: 0.4990~0.5500 USDT
⚠️ 重要なサポート: 0.3500 USDT
強気シナリオ:
MAGMAUSDTがモメンタムを維持し、0.4500を上抜けた場合、次は0.5000に向かう可能性があります。レジスタンスゾーンを力強く上抜ければ、さらなる上昇への道が開けるかもしれません。
弱気シナリオ:
価格が反落し、0.3500を下回った場合、強気のモメンタムが弱まり、より大きな調整が起こる可能性が高まります。
📌 私の見解: MAGMAUSDTは興味深い回復を見せていますが、これから試すレジスタンスゾーンが重要なポイントとなります。必ず値動きを確認してから取引し、リスクを慎重に管理してください。
💬 皆さんはどう思いますか? MAGMAUSDTは0.5000を上抜けるでしょうか、それとも売り手が主導権を握るでしょうか?
DYOR(ご自身で調査してください)– これはテクニカル分析であり、投資助言ではありません。適切なリスク管理のもとで取引してください。
$MAGMA
{future}(MAGMAUSDT)
#BinanceReports80%Recoveryof$6.3BillioninLossesfromHackIncident #TRMCambodianCasinosReceived$1.07BInCrypto #IolePlansToSellAll151.21Bitcoin #SuspectedNorthKoreaAttacksAccountForNearly89%OfCryptoHackLosses #MAGMAUSTD
🚀 MAGMAUSDT – 強気のモメンタム | 1時間足チャート分析
MAGMAUSDTは1時間足チャートで強い上昇モメンタムを示しており、現在の価格は約0.40505 USDTです。
📊 テクニカル分析:
価格は0.25~0.28のサポートエリアから大きく回復し、現在は重要なレジスタンスゾーンに近づいています。買い手の勢いは強まっていますが、大きなブレイクアウトを期待するには確認が必要です。
🔑 注目すべき重要な価格水準:
🟢 現在の価格: 0.40505 USDT
🎯 目標1: 0.4500 USDT
🎯 目標2: 0.5000 USDT
🔴 主要レジスタンスゾーン: 0.4990~0.5500 USDT
⚠️ 重要なサポート: 0.3500 USDT
強気シナリオ:
MAGMAUSDTがモメンタムを維持し、0.4500を上抜けた場合、次は0.5000に向かう可能性があります。レジスタンスゾーンを力強く上抜ければ、さらなる上昇への道が開けるかもしれません。
弱気シナリオ:
価格が反落し、0.3500を下回った場合、強気のモメンタムが弱まり、より大きな調整が起こる可能性が高まります。
📌 私の見解: MAGMAUSDTは興味深い回復を見せていますが、これから試すレジスタンスゾーンが重要なポイントとなります。必ず値動きを確認してから取引し、リスクを慎重に管理してください。
💬 皆さんはどう思いますか? MAGMAUSDTは0.5000を上抜けるでしょうか、それとも売り手が主導権を握るでしょうか?
DYOR(ご自身で調査してください)– これはテクニカル分析であり、投資助言ではありません。適切なリスク管理のもとで取引してください。
$MAGMA
#BinanceReports80%Recoveryof$6.3BillioninLossesfromHackIncident #TRMCambodianCasinosReceived$1.07BInCrypto #IolePlansToSellAll151.21Bitcoin #SuspectedNorthKoreaAttacksAccountForNearly89%OfCryptoHackLosses #MAGMAUSTD
1
1
203
·
--
$BIRB
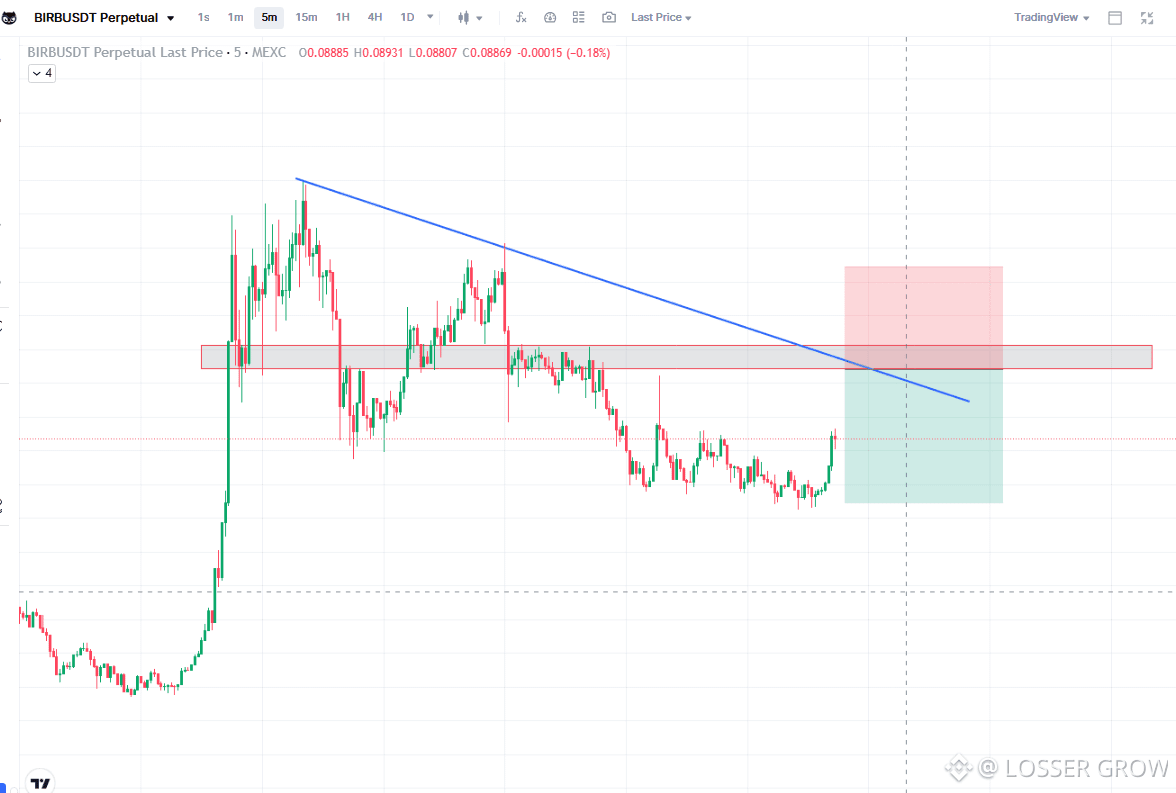
ショートスキャルピング
エントリー 0.0925
エントリー 0.0940
利確 0.0885
利確 0.0855
損切り 0.0980
$BTC
$BIRB
{future}(BIRBUSDT)
#BinanceReports80%Recoveryof$6.3BillioninLossesfromHackIncident #BIRB #TRMCambodianCasinosReceived$1.07BInCrypto #IolePlansToSellAll151.21Bitcoin #SuspectedNorthKoreaAttacksAccountForNearly89%OfCryptoHackLosses
$BIRB
ショートスキャルピング
エントリー 0.0925
エントリー 0.0940
利確 0.0885
利確 0.0855
損切り 0.0980
$BTC
$BIRB
#BinanceReports80%Recoveryof$6.3BillioninLossesfromHackIncident #BIRB #TRMCambodianCasinosReceived$1.07BInCrypto #IolePlansToSellAll151.21Bitcoin #SuspectedNorthKoreaAttacksAccountForNearly89%OfCryptoHackLosses
ショートスキャルピング
エントリー 0.0925
エントリー 0.0940
利確 0.0885
利確 0.0855
損切り 0.0980
$BTC
$BIRB
#BinanceReports80%Recoveryof$6.3BillioninLossesfromHackIncident #BIRB #TRMCambodianCasinosReceived$1.07BInCrypto #IolePlansToSellAll151.21Bitcoin #SuspectedNorthKoreaAttacksAccountForNearly89%OfCryptoHackLosses
3
334
·
--
ブリッシュ
翻訳参照
$IDOL
Long scalping
ENTRY 0.024
ENTRY 0.0235
TP 0.0255
TP 0.0265
SL 0.022
$BTC $IDOL
#ASICHasReceivedNoPredictionMarketApplications #IDOL #HKDollarStablecoinHKDAPToLaunchOnSolana
$IDOL
Long scalping
ENTRY 0.024
ENTRY 0.0235
TP 0.0255
TP 0.0265
SL 0.022
$BTC $IDOL
#ASICHasReceivedNoPredictionMarketApplications #IDOL #HKDollarStablecoinHKDAPToLaunchOnSolana
Long scalping
ENTRY 0.024
ENTRY 0.0235
TP 0.0255
TP 0.0265
SL 0.022
$BTC $IDOL
#ASICHasReceivedNoPredictionMarketApplications #IDOL #HKDollarStablecoinHKDAPToLaunchOnSolana
1
131
·
--
弱気相場
翻訳参照
$IDOL
Short here
entry 0.0253
TP 0.024
0.0235
SL 0.026$
#IolePlansToSellAll151.21Bitcoin #ASICHasReceivedNoPredictionMarketApplications #IDOL
$IDOL
Short here
entry 0.0253
TP 0.024
0.0235
SL 0.026$
#IolePlansToSellAll151.21Bitcoin #ASICHasReceivedNoPredictionMarketApplications #IDOL
Short here
entry 0.0253
TP 0.024
0.0235
SL 0.026$
#IolePlansToSellAll151.21Bitcoin #ASICHasReceivedNoPredictionMarketApplications #IDOL
5
2
204
·
--
ブリッシュ
翻訳参照
BNB chain most undervalued meme token under 1M market cap BUILDER you're missing $BTC $ETH #memecoin🚀🚀🚀 #meme板块关注热点 #meme2027
BNB chain most undervalued meme token under 1M market cap BUILDER you're missing $BTC $ETH #memecoin🚀🚀🚀 #meme板块关注热点 #meme2027
20
·
--
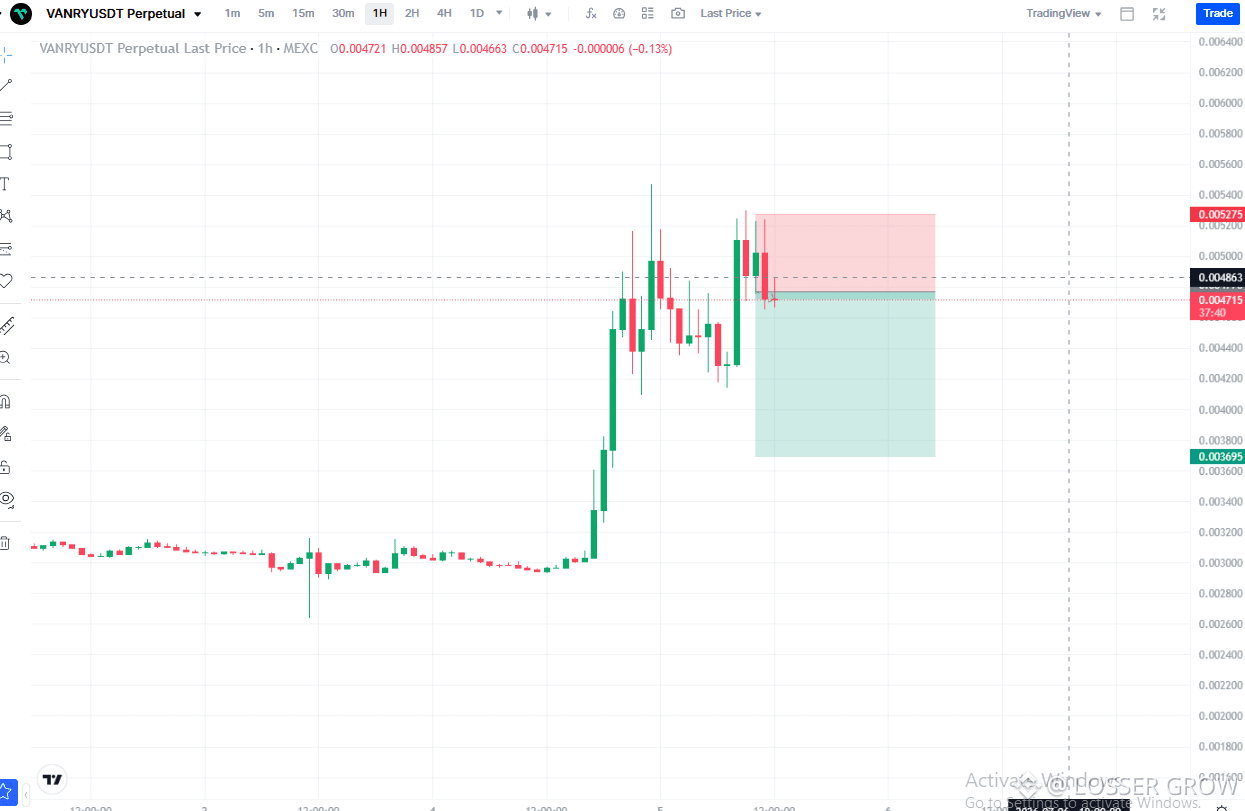
VANRYUSDT 1H チャート:
$VANRY 更新 📉
強いインパルスの上昇の後、価格は 0.0048〜0.0050 付近の重要なレジスタンス・ゾーンを試している。
🔹 レジスタンスからの拒否(反発)が起これば、0.0037〜0.0038 までの押し戻しが引き起こされる可能性。
🔹 価格が 0.0050 を下回っている限り、短期では売り手が優勢。
🔹 0.0050 を上抜けしてしっかり終値で確定すれば、弱気シナリオは無効となり、さらに上昇する次の波への扉が開くかもしれない。
取引アイデア:
✅ レジスタンス付近でショート
🎯 想定:0.0037
❌ 損切り:0.00525 超え
忍耐が重要—エントリーする前に市場が動きを確認するのを待とう。
#VANRY #Crypto #Altcoins #Trading #テクニカル分析 #MEXC #クリプトトレーディング
または、より短くて引き込まれるバージョンが欲しいなら:
$VANRY ここは面白そうだ。👀
大規模なポンプの後、0.0050 近辺で拒否された。
📍 レジスタンス:0.0049〜0.0050
🎯 弱気の目標:0.0037
🛑 無効条件:0.00525 超え
買い手がレジスタンスを取り返せなければ、これは堅実なショートのセットアップになり得る。
必ず確認を待て。📊
$VANRY $BTC
{future}(VANRYUSDT)
#VANRY #crypto #Trading #Altcoins
VANRYUSDT 1H チャート:
$VANRY 更新 📉
強いインパルスの上昇の後、価格は 0.0048〜0.0050 付近の重要なレジスタンス・ゾーンを試している。
🔹 レジスタンスからの拒否(反発)が起これば、0.0037〜0.0038 までの押し戻しが引き起こされる可能性。
🔹 価格が 0.0050 を下回っている限り、短期では売り手が優勢。
🔹 0.0050 を上抜けしてしっかり終値で確定すれば、弱気シナリオは無効となり、さらに上昇する次の波への扉が開くかもしれない。
取引アイデア:
✅ レジスタンス付近でショート
🎯 想定:0.0037
❌ 損切り:0.00525 超え
忍耐が重要—エントリーする前に市場が動きを確認するのを待とう。
#VANRY #Crypto #Altcoins #Trading #テクニカル分析 #MEXC #クリプトトレーディング
または、より短くて引き込まれるバージョンが欲しいなら:
$VANRY ここは面白そうだ。👀
大規模なポンプの後、0.0050 近辺で拒否された。
📍 レジスタンス:0.0049〜0.0050
🎯 弱気の目標:0.0037
🛑 無効条件:0.00525 超え
買い手がレジスタンスを取り返せなければ、これは堅実なショートのセットアップになり得る。
必ず確認を待て。📊
$VANRY $BTC
#VANRY #crypto #Trading #Altcoins
122

·
--
📊 RECALL/USDT テクニカル分析 (2H チャート)
現在価格: $0.3536
構造: 降下三角形ブレイクアウトウオッチ
主要レベル:
🔴 サポートゾーン: $0.29 – $0.31
🟠 レジスタンスゾーン (TP1): $0.39 – $0.40
🟢 主要レジスタンス / TP2: $0.47 – $0.49 (トレンドラインレジスタンス)
分析:
価格は$0.30のサポートゾーンから成功裏に反発し、現在は$0.35–$0.36の中間レジスタンスをテストしています。
もしブルが$0.39を超えてブレイクアウトできれば、モメンタムは$0.49近くの上部トレンドラインに向かって延長する可能性があります。
しかし、現在のレベルからの拒否は$0.30の需要ゾーンの再テストを引き起こすかもしれません。
バイアス: $0.33のサポートが維持される限り、短期的に強気。
ターゲット:
TP1 → $0.39
TP2 → $0.48–$0.49
無効化: $0.30$RECALL 以下で、強い需要ゾーンからの早期逆転サインが示されます 💪
$0.39以上のブレイクアウト確認を見守り、$0.49エリアを目指します 🚀
#RECALL #CryptoAnalysis #TradingSetup $RECALL
{future}(RECALLUSDT)
📊 RECALL/USDT テクニカル分析 (2H チャート)
現在価格: $0.3536
構造: 降下三角形ブレイクアウトウオッチ
主要レベル:
🔴 サポートゾーン: $0.29 – $0.31
🟠 レジスタンスゾーン (TP1): $0.39 – $0.40
🟢 主要レジスタンス / TP2: $0.47 – $0.49 (トレンドラインレジスタンス)
分析:
価格は$0.30のサポートゾーンから成功裏に反発し、現在は$0.35–$0.36の中間レジスタンスをテストしています。
もしブルが$0.39を超えてブレイクアウトできれば、モメンタムは$0.49近くの上部トレンドラインに向かって延長する可能性があります。
しかし、現在のレベルからの拒否は$0.30の需要ゾーンの再テストを引き起こすかもしれません。
バイアス: $0.33のサポートが維持される限り、短期的に強気。
ターゲット:
TP1 → $0.39
TP2 → $0.48–$0.49
無効化: $0.30$RECALL 以下で、強い需要ゾーンからの早期逆転サインが示されます 💪
$0.39以上のブレイクアウト確認を見守り、$0.49エリアを目指します 🚀
#RECALL #CryptoAnalysis #TradingSetup $RECALL
194
·
--
利益ドン 🤪 4.94$
利益ドン 🤪 4.94$


BullishBanter
·
--
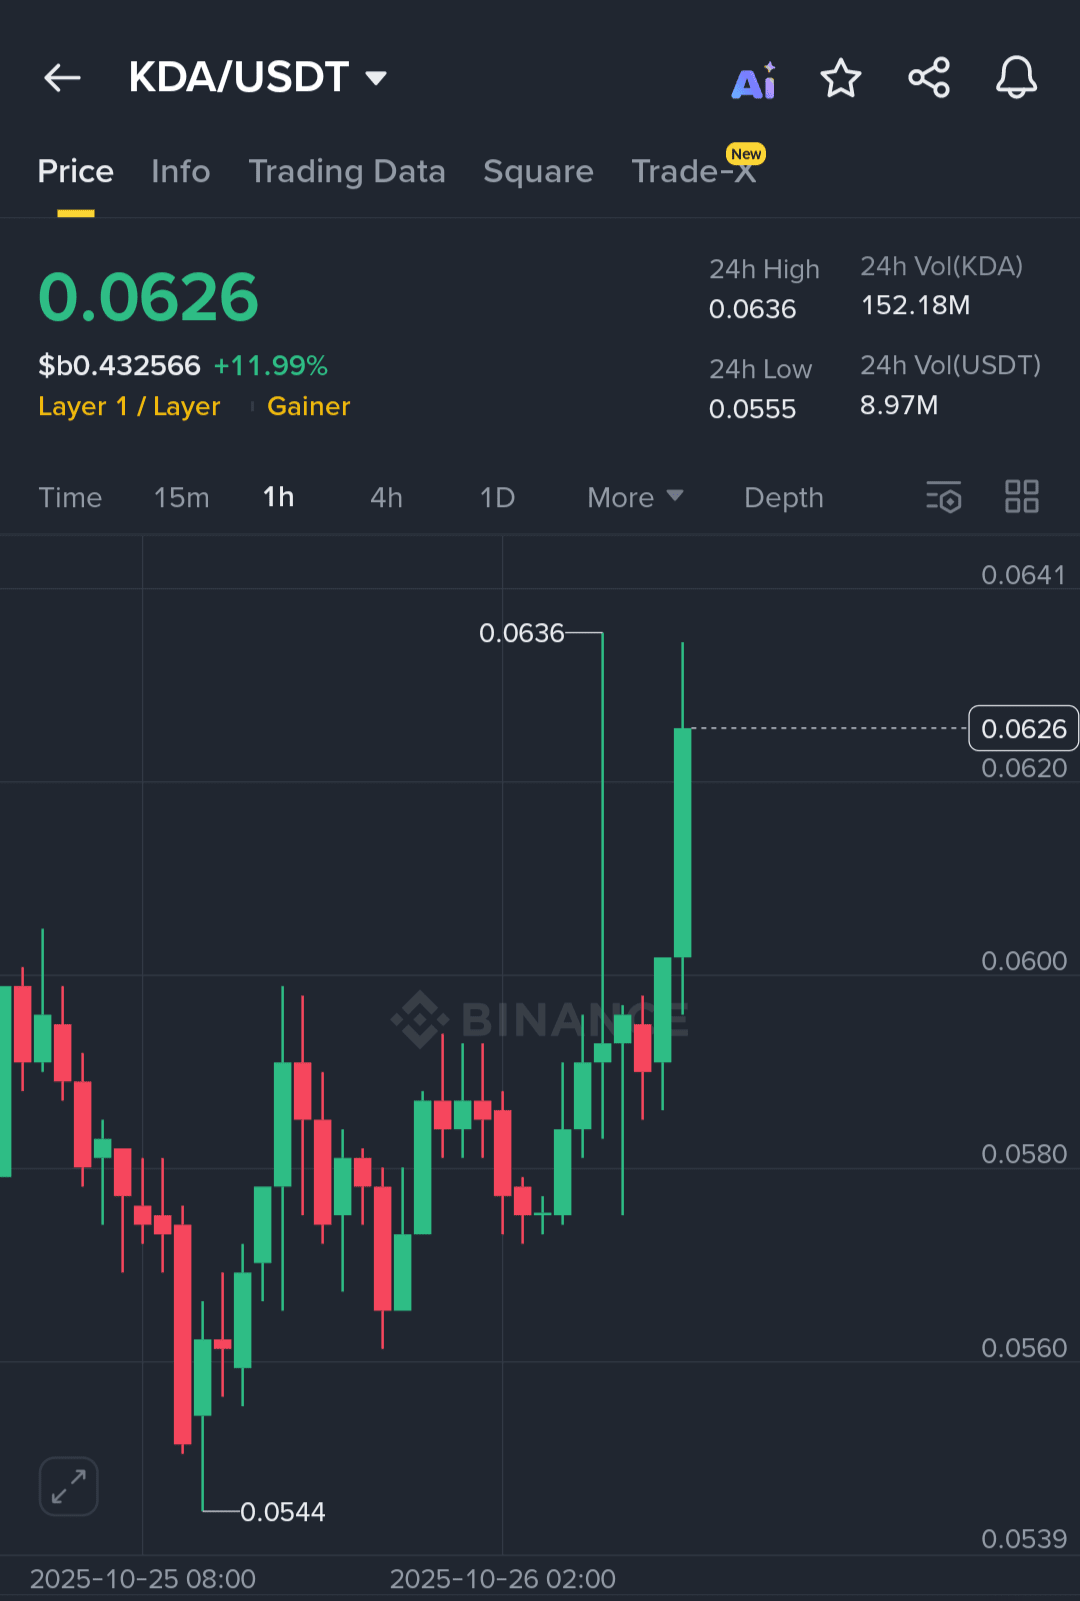
$KDA / USDT ... 強気のモメンタムが $0.065+ ゾーンに向かって構築中
$KDA は、$0.054サポート地域から急激に反発した後、強い回復モメンタムを示しています。買い手は積極的に介入し、上昇するボリュームで重要な抵抗レベルを突破しています.... 潜在的な延長上昇トレンドの開始を示唆しています。
将来の取引設定:
エントリーゾーン: $0.061 – $0.062
ターゲット 1: $0.064
ターゲット 2: $0.066
ターゲット 3: $0.069
ストップロス: $0.058未満
トレンドは、$0.058サポートを上回って保持している限り強気です。
ここで$KDA で購入および取引してください
$KDA は、$0.054サポート地域から急激に反発した後、強い回復モメンタムを示しています。買い手は積極的に介入し、上昇するボリュームで重要な抵抗レベルを突破しています.... 潜在的な延長上昇トレンドの開始を示唆しています。
将来の取引設定:
エントリーゾーン: $0.061 – $0.062
ターゲット 1: $0.064
ターゲット 2: $0.066
ターゲット 3: $0.069
ストップロス: $0.058未満
トレンドは、$0.058サポートを上回って保持している限り強気です。
ここで$KDA で購入および取引してください
13

ログインして、さらにコンテンツを読む
厳選トピックで世界の暗号資産トレーダーの仲間入り
⚡️ 暗号資産に関する最新かつ有益な情報が見つかります。
💬 世界最大の暗号資産取引所から信頼されています。
👍 認証を受けたクリエイターから、有益なインサイトを得られます。
メール / 電話番号
トレンドトピック
BinanceSAFUFundTransferCompleted7499BTC
閲覧回数 8,689
325人が討論中
速報:バイナンスが63億ドルの90%を補填—私の見解
みんな、暗号資産史上最大の資金回収が実現しました。
バイナンスは10月31日、3回目のセキュリティ更新で次の内容を発表しました。
盗まれた資産の90%が補填済み—昨日の80%から増加しています。
何が起きたのでしょうか?
被害総額:約63億ドル(10月29日、ホットウォレット)バイナンスは補填のため、会社資金から63億4,000万ドルを確保
資金源:企業資金+SAFU基金(10億ドルの基金)+先物保険基金
結果:主要な10種類のトークンが現在、すべて100%の裏付けを確保:$BTC、$ETH、$USDT、$BNB、$SOL、$USDC、$XRP、$USD1、$RLUSD、$ZEC
残りの10%は流動性の低いトークンで、調達にはさらに時間がかかります
出金は11月1日に再開する見込みです
私の分析:これが、バイナンスが今も業界ナンバーワンである理由です。自社資金で2日以内に63億ドルを補填できる取引所はほかにありません。SAFUが実際に機能することを示しています。
これで信頼は戻ると思いますか?それとも、まだ不安ですか?
ぜひ下に意見を投稿してください—すべてのコメントに目を通します。
Binance #SAFU #CryptoRecovery #BinanceSecurity #BTC#binancesafufundtransfercompleted7499btc
True News
·いいね:23件
·閲覧回数 10.1k
BinanceRecovery90% of stolen assets
閲覧回数 47,334
107人が討論中
YiHe:ProofOfReserves:10TokensAt100%Backing
閲覧回数 80,634
476人が討論中