
Crypto Adda Official
59 投稿

Crypto Adda Official
報告
ユーザーをブロック
Decoding charts and spotting multi-X gems before the crowd 📊✨ 10 years in crypto. Pure price action and discipline 🧠 Find me on X: BazaidRaza 🚀
1 フォロー
84 フォロワー
39 いいね
投稿
すべて
引用
·
--
ブリッシュ
翻訳参照
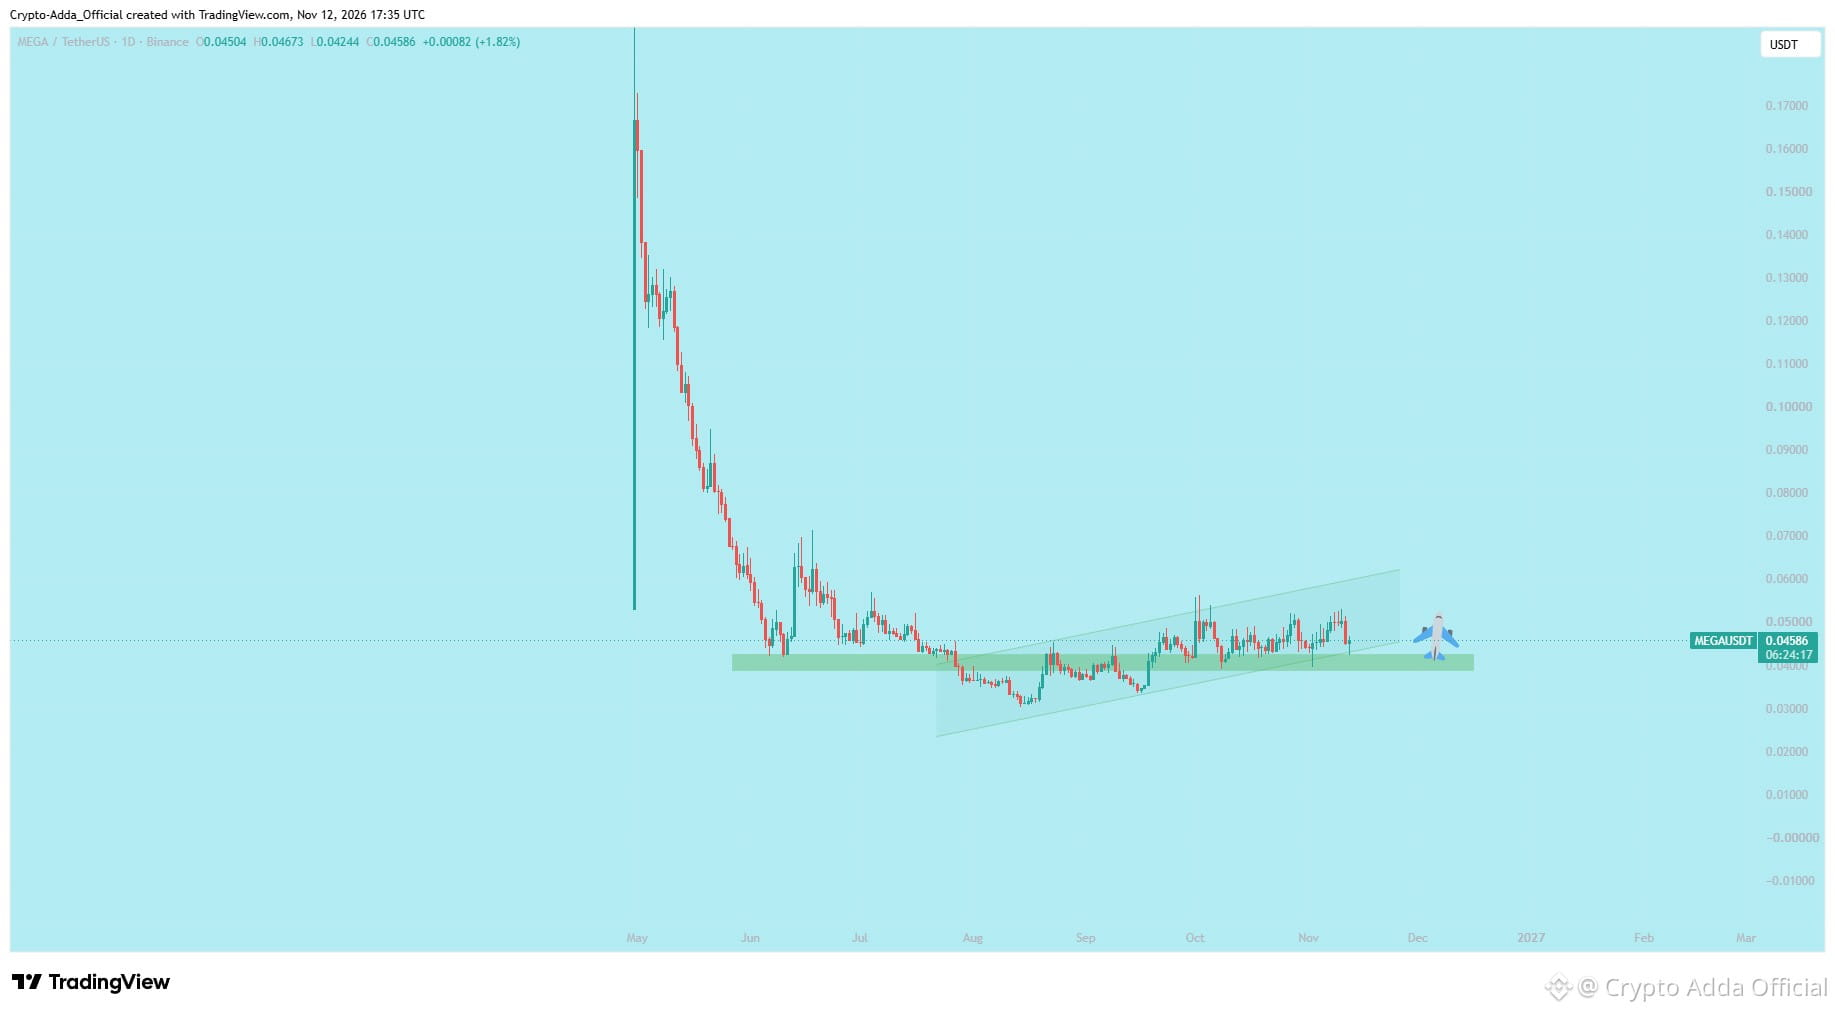
$MEGA /USDT daily chart technical breakdown! 📊 Price action is forming a bullish ascending channel right above a major green demand support zone around 0.040 to 0.045. 📈
• Clean accumulation pattern building up inside the channel structure
• Buyers actively defending the key support block and absorbing sell pressure
• Holding this zone sets up a powerful upward expansion phase
Patience and strict risk management are the keys to catching major moves. 🧠💎
Catch more chart breakdowns and community updates by checking my profile bio and finding me on X: BazaidRaza 🚀
$MAGMA $AGT #AGT #MAGMA #DODOX #play
$MEGA /USDT daily chart technical breakdown! 📊 Price action is forming a bullish ascending channel right above a major green demand support zone around 0.040 to 0.045. 📈
• Clean accumulation pattern building up inside the channel structure
• Buyers actively defending the key support block and absorbing sell pressure
• Holding this zone sets up a powerful upward expansion phase
Patience and strict risk management are the keys to catching major moves. 🧠💎
Catch more chart breakdowns and community updates by checking my profile bio and finding me on X: BazaidRaza 🚀
$MAGMA $AGT #AGT #MAGMA #DODOX #play
• Clean accumulation pattern building up inside the channel structure
• Buyers actively defending the key support block and absorbing sell pressure
• Holding this zone sets up a powerful upward expansion phase
Patience and strict risk management are the keys to catching major moves. 🧠💎
Catch more chart breakdowns and community updates by checking my profile bio and finding me on X: BazaidRaza 🚀
$MAGMA $AGT #AGT #MAGMA #DODOX #play
1
354
翻訳参照
$HANA
{future}(HANAUSDT)
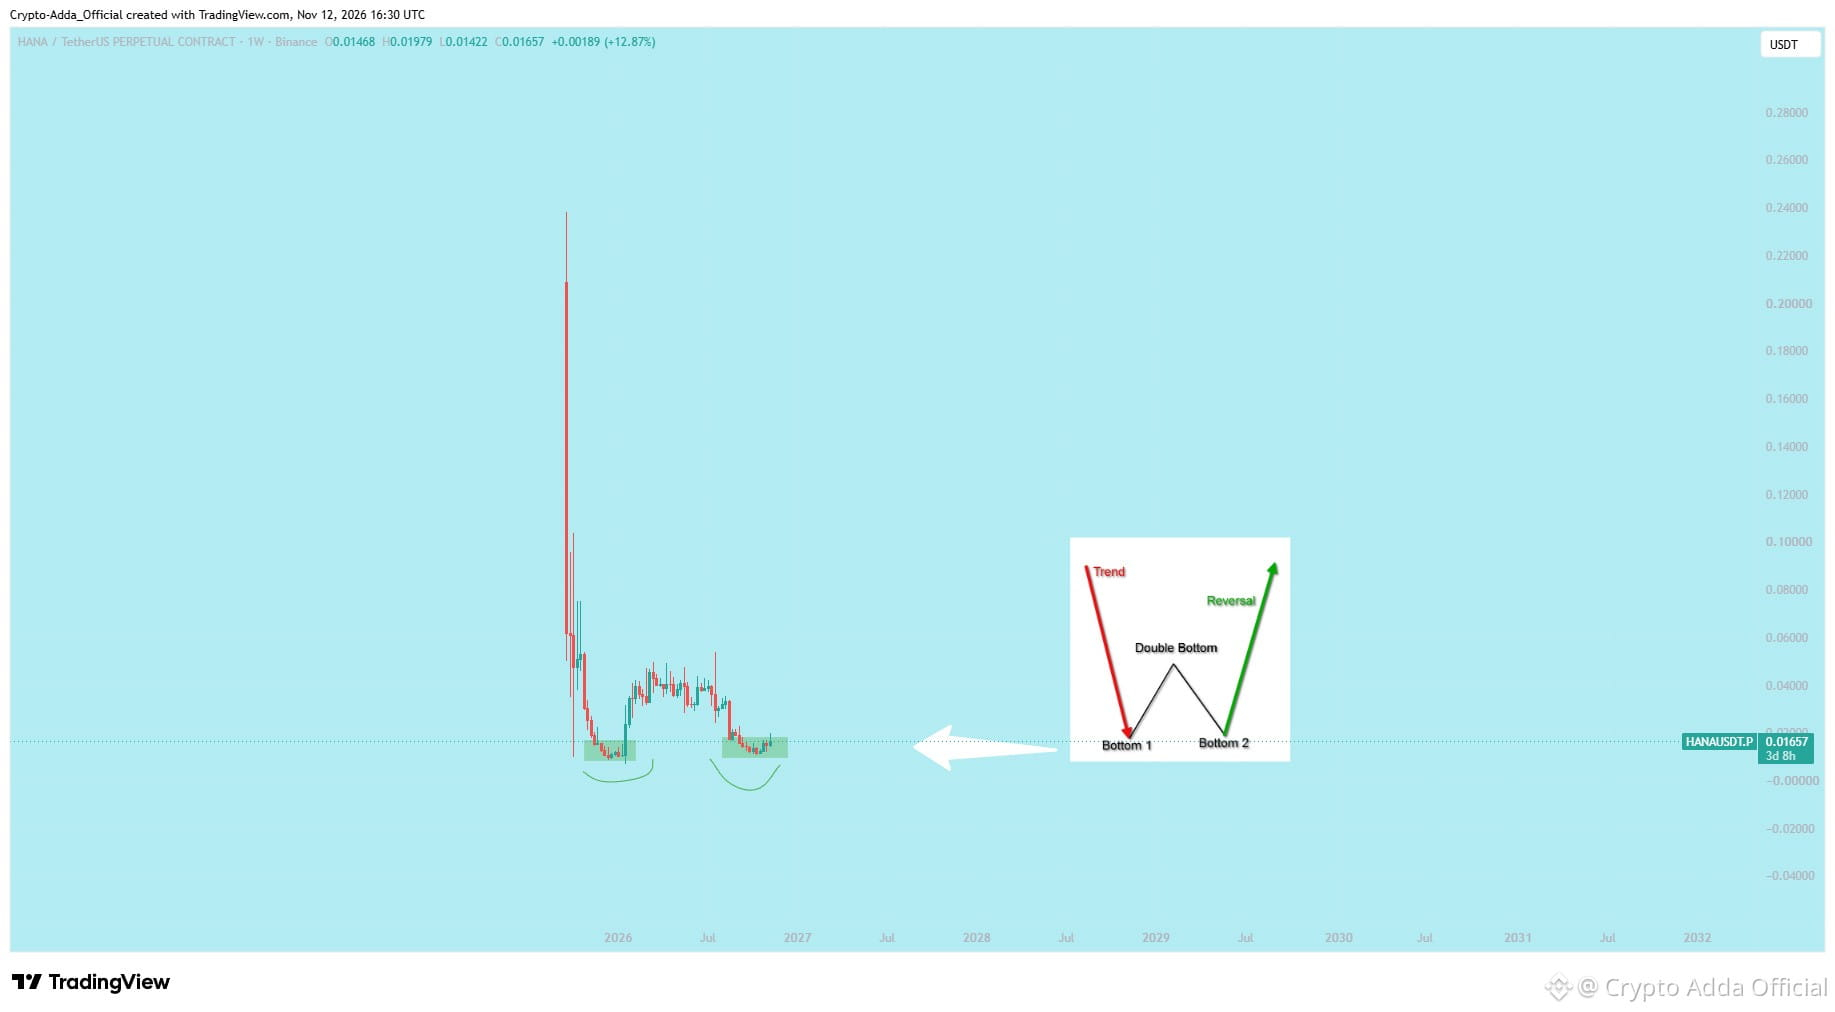
/USDT weekly chart update! 📊 Price is forming a textbook Double Bottom structure right inside a major demand zone at 0.014 to 0.017. 📈
• Two clean reactions at Bottom 1 and Bottom 2 showing solid buyer accumulation
• Higher timeframe momentum signaling potential trend reversal
• Holding this support zone keeps the bullish outlook intact
Patience on weekly charts pays the biggest rewards. Manage your risk properly.
🧠💎 Catch more chart breakdowns and community updates by checking my profile bio and finding me on X: BazaidRaza 🚀
$AGT $MAGMA #play #BTC #Binance
$HANA
/USDT weekly chart update! 📊 Price is forming a textbook Double Bottom structure right inside a major demand zone at 0.014 to 0.017. 📈
• Two clean reactions at Bottom 1 and Bottom 2 showing solid buyer accumulation
• Higher timeframe momentum signaling potential trend reversal
• Holding this support zone keeps the bullish outlook intact
Patience on weekly charts pays the biggest rewards. Manage your risk properly.
🧠💎 Catch more chart breakdowns and community updates by checking my profile bio and finding me on X: BazaidRaza 🚀
$AGT $MAGMA #play #BTC #Binance
/USDT weekly chart update! 📊 Price is forming a textbook Double Bottom structure right inside a major demand zone at 0.014 to 0.017. 📈
• Two clean reactions at Bottom 1 and Bottom 2 showing solid buyer accumulation
• Higher timeframe momentum signaling potential trend reversal
• Holding this support zone keeps the bullish outlook intact
Patience on weekly charts pays the biggest rewards. Manage your risk properly.
🧠💎 Catch more chart breakdowns and community updates by checking my profile bio and finding me on X: BazaidRaza 🚀
$AGT $MAGMA #play #BTC #Binance
1
613
·
--
ブリッシュ
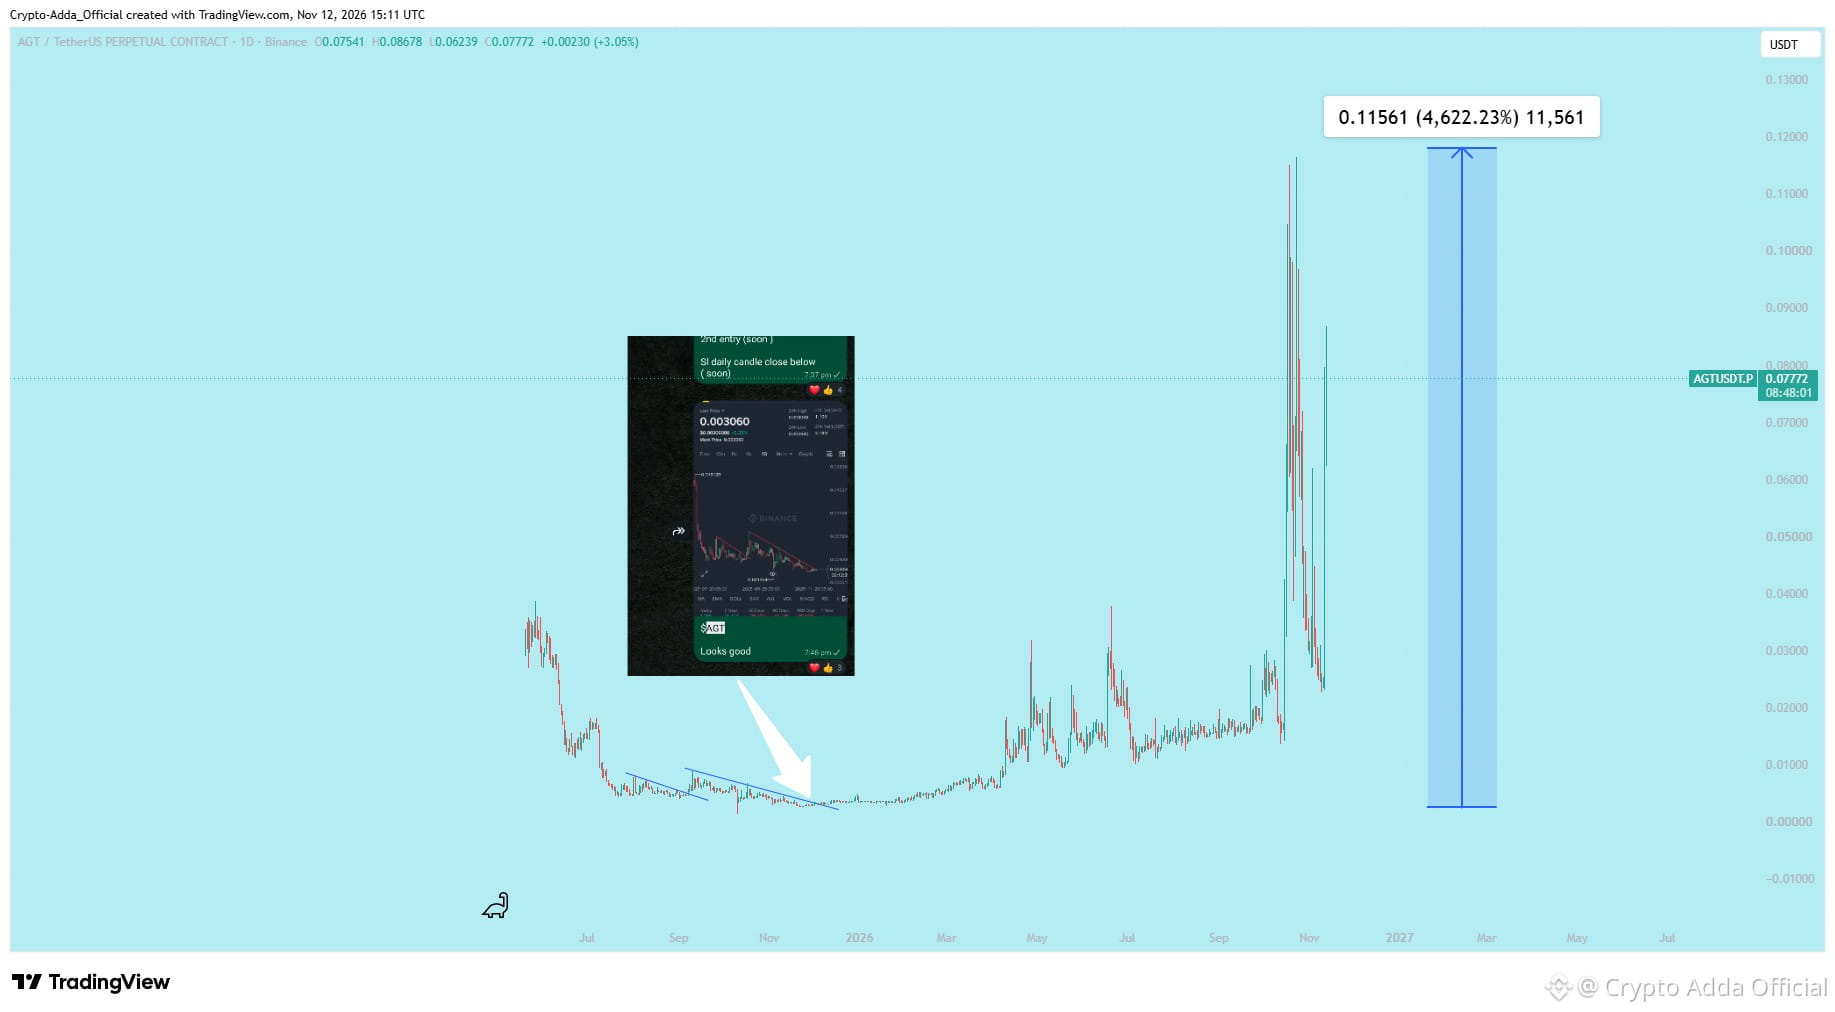
「ただの運だよ。」——それが10回目に起きるまでは。🚨📈
$AGT で+4,622%。すべて私たちのコールゾーンから。運だけでは、こんなに安定して繰り返せません。
ポジションサイジング、資金管理、トレード管理をマスターしましょう。
保有の仕方を知っていれば、たった1回のトレードが人生を変えることもあります。🔥
#AGT #Crypto #CryptoTrading #Altcoins #Binance
「ただの運だよ。」——それが10回目に起きるまでは。🚨📈
$AGT で+4,622%。すべて私たちのコールゾーンから。運だけでは、こんなに安定して繰り返せません。
ポジションサイジング、資金管理、トレード管理をマスターしましょう。
保有の仕方を知っていれば、たった1回のトレードが人生を変えることもあります。🔥
#AGT #Crypto #CryptoTrading #Altcoins #Binance
$AGT で+4,622%。すべて私たちのコールゾーンから。運だけでは、こんなに安定して繰り返せません。
ポジションサイジング、資金管理、トレード管理をマスターしましょう。
保有の仕方を知っていれば、たった1回のトレードが人生を変えることもあります。🔥
#AGT #Crypto #CryptoTrading #Altcoins #Binance
9
4
2.6k
·
--
ブリッシュ
$BTC
{spot}(BTCUSDT)
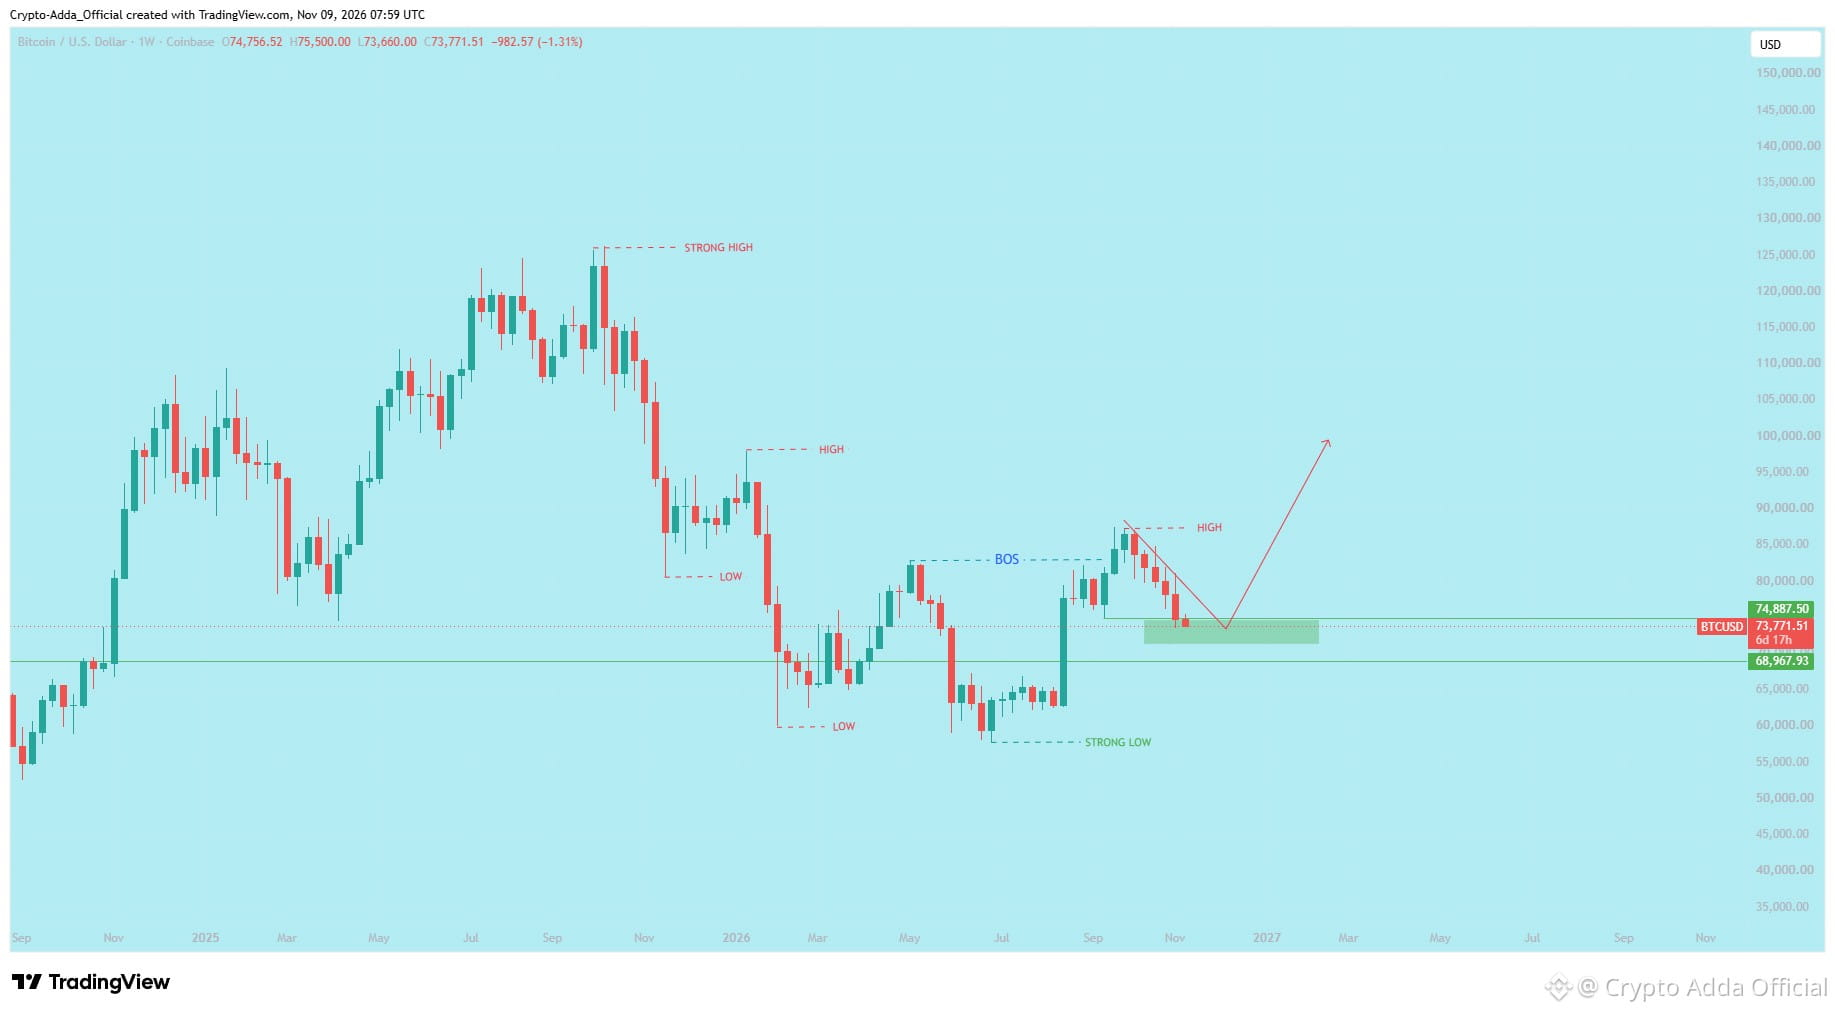
マクロ市場構造アップデート(1W)📊
週足の時間軸で見た、現在の市場構造に関する純粋なテクニカル分析です。
🔹 **強い安値の形成**
• 市場は **58,000~60,000ドル** 付近の重要な需要の基準線を守り、強い機関投資家の吸収に裏付けられた、マクロの「強い安値」が確立されたことを確認しました。
🔹 **構造のブレイク(BOS)**
• 直近の主要なスイング高値(約 **83,000ドル**)を明確に上抜けたことで、教科書的な週足の **構造のブレイク(BOS)** が発生し、より高い高値へ向かう構造的な転換が確立されました。
🔹 **調整リテスト(現在の局面)**
• **88,000ドル** を超える直近高値を付けた後の現在の下落は、衝動的な分配ではなく、制御された調整的な押し戻しを示しています。
• 価格は、かつてのレジスタンスからサポートに転じた水準であり、週足の主要な需要ブロックでもある **70,000~74,800ドル** を積極的に再テストしています。
🔹 **マクロの軌道**
• 現在の構造は、マクロの **高値切り上げ安値(Higher Low)** の形成に向かっています。
• この主要な需要帯(**70,000~74,800ドル**)が週足終値ベースで維持される限り、強気の連続性はテクニカル面で保たれます。次のマクロな拡大に向かう自然な道筋として、**10万ドル超**の心理的節目が意識されます。
*純粋な市場構造の分析——上位時間足の値動きを追跡。* 🧠✨ #bitcoin #eth
$BTC
マクロ市場構造アップデート(1W)📊
週足の時間軸で見た、現在の市場構造に関する純粋なテクニカル分析です。
🔹 **強い安値の形成**
• 市場は **58,000~60,000ドル** 付近の重要な需要の基準線を守り、強い機関投資家の吸収に裏付けられた、マクロの「強い安値」が確立されたことを確認しました。
🔹 **構造のブレイク(BOS)**
• 直近の主要なスイング高値(約 **83,000ドル**)を明確に上抜けたことで、教科書的な週足の **構造のブレイク(BOS)** が発生し、より高い高値へ向かう構造的な転換が確立されました。
🔹 **調整リテスト(現在の局面)**
• **88,000ドル** を超える直近高値を付けた後の現在の下落は、衝動的な分配ではなく、制御された調整的な押し戻しを示しています。
• 価格は、かつてのレジスタンスからサポートに転じた水準であり、週足の主要な需要ブロックでもある **70,000~74,800ドル** を積極的に再テストしています。
🔹 **マクロの軌道**
• 現在の構造は、マクロの **高値切り上げ安値(Higher Low)** の形成に向かっています。
• この主要な需要帯(**70,000~74,800ドル**)が週足終値ベースで維持される限り、強気の連続性はテクニカル面で保たれます。次のマクロな拡大に向かう自然な道筋として、**10万ドル超**の心理的節目が意識されます。
*純粋な市場構造の分析——上位時間足の値動きを追跡。* 🧠✨ #bitcoin #eth
マクロ市場構造アップデート(1W)📊
週足の時間軸で見た、現在の市場構造に関する純粋なテクニカル分析です。
🔹 **強い安値の形成**
• 市場は **58,000~60,000ドル** 付近の重要な需要の基準線を守り、強い機関投資家の吸収に裏付けられた、マクロの「強い安値」が確立されたことを確認しました。
🔹 **構造のブレイク(BOS)**
• 直近の主要なスイング高値(約 **83,000ドル**)を明確に上抜けたことで、教科書的な週足の **構造のブレイク(BOS)** が発生し、より高い高値へ向かう構造的な転換が確立されました。
🔹 **調整リテスト(現在の局面)**
• **88,000ドル** を超える直近高値を付けた後の現在の下落は、衝動的な分配ではなく、制御された調整的な押し戻しを示しています。
• 価格は、かつてのレジスタンスからサポートに転じた水準であり、週足の主要な需要ブロックでもある **70,000~74,800ドル** を積極的に再テストしています。
🔹 **マクロの軌道**
• 現在の構造は、マクロの **高値切り上げ安値(Higher Low)** の形成に向かっています。
• この主要な需要帯(**70,000~74,800ドル**)が週足終値ベースで維持される限り、強気の連続性はテクニカル面で保たれます。次のマクロな拡大に向かう自然な道筋として、**10万ドル超**の心理的節目が意識されます。
*純粋な市場構造の分析——上位時間足の値動きを追跡。* 🧠✨ #bitcoin #eth
61
·
--
ブリッシュ
148
·
--
ブリッシュ
24
1
94
·
--
ブリッシュ

401
·
--
ブリッシュ

359

·
--
ブリッシュ
💰 最大の上場企業のビットコインポートフォリオの状態
グラフは、これらの企業が現在 BTC をどれだけ保有しているか (緑色)、および BTC を購入するためにどれだけの費用を費やしたか (赤色) を示しています。
#crypto2023 #Binance #ETH #cryptocurrency #bitcoin
💰 最大の上場企業のビットコインポートフォリオの状態
グラフは、これらの企業が現在 BTC をどれだけ保有しているか (緑色)、および BTC を購入するためにどれだけの費用を費やしたか (赤色) を示しています。
#crypto2023 #Binance #ETH #cryptocurrency #bitcoin
グラフは、これらの企業が現在 BTC をどれだけ保有しているか (緑色)、および BTC を購入するためにどれだけの費用を費やしたか (赤色) を示しています。
#crypto2023 #Binance #ETH #cryptocurrency #bitcoin

1
49
·
--
ブリッシュ


1
44
·
--
ブリッシュ
デイリーゲインズコインコールは完全に機能します
あなたはたくさんのものを失い、多くのグループに参加し、今は疲れています、それなら私たちに従ってください。
世界最高の暗号通貨グループ #crypto2023 #Binance #ETH #crypto #BTC
デイリーゲインズコインコールは完全に機能します
あなたはたくさんのものを失い、多くのグループに参加し、今は疲れています、それなら私たちに従ってください。
世界最高の暗号通貨グループ #crypto2023 #Binance #ETH #crypto #BTC
あなたはたくさんのものを失い、多くのグループに参加し、今は疲れています、それなら私たちに従ってください。
世界最高の暗号通貨グループ #crypto2023 #Binance #ETH #crypto #BTC


43
·
--
ブリッシュ
$SYS 1 日以内にフォールリング ウェッジを実行中 ブレイクアウトを試みます .. 注目してください
#crypto2023 $BTC #cryptocurrency #bitcoin #Binance #cryptocurrency $SYS
$SYS 1 日以内にフォールリング ウェッジを実行中 ブレイクアウトを試みます .. 注目してください
#crypto2023 $BTC #cryptocurrency #bitcoin #Binance #cryptocurrency $SYS
#crypto2023 $BTC #cryptocurrency #bitcoin #Binance #cryptocurrency $SYS

1
117
·
--
ブリッシュ
$FLOKI が 1D で Descending Triangle を実行しています はい、ここで購入することに興味があります
次の獲得者については、私をフォローしてください
#crypto2023 #Binance #bitcoin #ETH #googleai
$FLOKI が 1D で Descending Triangle を実行しています はい、ここで購入することに興味があります
次の獲得者については、私をフォローしてください
#crypto2023 #Binance #bitcoin #ETH #googleai
次の獲得者については、私をフォローしてください
#crypto2023 #Binance #bitcoin #ETH #googleai

51
·
--
ブリッシュ
📊 MicroStrategy と Bitcoin は、すべての主要な資産クラスを上回るパフォーマンスを続けています。
#crypto2023 #bitcoin #Binance #BTC #crypto
📊 MicroStrategy と Bitcoin は、すべての主要な資産クラスを上回るパフォーマンスを続けています。
#crypto2023 #bitcoin #Binance #BTC #crypto
#crypto2023 #bitcoin #Binance #BTC #crypto

38
ログインして、さらにコンテンツを読む
厳選トピックで世界の暗号資産トレーダーの仲間入り
⚡️ 暗号資産に関する最新かつ有益な情報が見つかります。
💬 世界最大の暗号資産取引所から信頼されています。
👍 認証を受けたクリエイターから、有益なインサイトを得られます。
メール / 電話番号