

ScalpingX TG Channel
4k 投稿

ScalpingX TG Channel
報告
ユーザーをブロック
1 scalper with unconventional mindset, loves big risks with big profits. Don't ask about the leverage I use, it's always maximum!
0 フォロー
11 フォロワー
9 いいね
投稿
翻訳参照
Paper oil cools, but diesel and logistics keep the physical market tight
🛢 Brent ended the week near $104.32/bbl while WTI fell to $92.41, widening the Brent–WTI spread to almost $12/bbl, its widest since May. The divergence shows US crude is facing its own pressure from inventories and diesel export risks, while international barrels still command a higher physical premium.
🤝 US–Iran talks in New York helped remove part of the Hormuz risk premium, but physical flows have not materially improved. Kpler estimated oil movements through the strait at around 33.7 million barrels for the week beginning Sep. 20, broadly unchanged from the previous week.
📉 At the same time, the IEA estimates observed global oil inventories have fallen by roughly 507 million barrels since the conflict began. In the US, distillate stocks stand at just 107.4 million barrels, around 12% below the five-year average, even as commercial crude inventories rose by 3 million barrels.
⛽ The strongest pressure remains in refined products. Southern European diesel cracks moved above $100/bbl, while reports that Washington is considering a 90-day diesel export ban sharply weakened US diesel cracks. If implemented, the policy could ease domestic US supply while tightening Europe further.
🚢 Logistics also remain constrained. Gulf-to-Asia VLCC rates briefly reached around $1.27 million per day, while ship-to-ship transfer capacity off Oman has been heavily utilized. That suggests even a smoother Hormuz transit would not immediately remove the physical bottleneck.
📌 The week therefore cannot be read simply as oil falling on diplomacy. WTI is reflecting US crude availability and domestic diesel risks, while Brent remains supported by falling global inventories, tight refined-product supply and elevated logistics costs.
#EnergyMarkets $CL $NATGAS
Paper oil cools, but diesel and logistics keep the physical market tight
🛢 Brent ended the week near $104.32/bbl while WTI fell to $92.41, widening the Brent–WTI spread to almost $12/bbl, its widest since May. The divergence shows US crude is facing its own pressure from inventories and diesel export risks, while international barrels still command a higher physical premium.
🤝 US–Iran talks in New York helped remove part of the Hormuz risk premium, but physical flows have not materially improved. Kpler estimated oil movements through the strait at around 33.7 million barrels for the week beginning Sep. 20, broadly unchanged from the previous week.
📉 At the same time, the IEA estimates observed global oil inventories have fallen by roughly 507 million barrels since the conflict began. In the US, distillate stocks stand at just 107.4 million barrels, around 12% below the five-year average, even as commercial crude inventories rose by 3 million barrels.
⛽ The strongest pressure remains in refined products. Southern European diesel cracks moved above $100/bbl, while reports that Washington is considering a 90-day diesel export ban sharply weakened US diesel cracks. If implemented, the policy could ease domestic US supply while tightening Europe further.
🚢 Logistics also remain constrained. Gulf-to-Asia VLCC rates briefly reached around $1.27 million per day, while ship-to-ship transfer capacity off Oman has been heavily utilized. That suggests even a smoother Hormuz transit would not immediately remove the physical bottleneck.
📌 The week therefore cannot be read simply as oil falling on diplomacy. WTI is reflecting US crude availability and domestic diesel risks, while Brent remains supported by falling global inventories, tight refined-product supply and elevated logistics costs.
#EnergyMarkets $CL $NATGAS
🛢 Brent ended the week near $104.32/bbl while WTI fell to $92.41, widening the Brent–WTI spread to almost $12/bbl, its widest since May. The divergence shows US crude is facing its own pressure from inventories and diesel export risks, while international barrels still command a higher physical premium.
🤝 US–Iran talks in New York helped remove part of the Hormuz risk premium, but physical flows have not materially improved. Kpler estimated oil movements through the strait at around 33.7 million barrels for the week beginning Sep. 20, broadly unchanged from the previous week.
📉 At the same time, the IEA estimates observed global oil inventories have fallen by roughly 507 million barrels since the conflict began. In the US, distillate stocks stand at just 107.4 million barrels, around 12% below the five-year average, even as commercial crude inventories rose by 3 million barrels.
⛽ The strongest pressure remains in refined products. Southern European diesel cracks moved above $100/bbl, while reports that Washington is considering a 90-day diesel export ban sharply weakened US diesel cracks. If implemented, the policy could ease domestic US supply while tightening Europe further.
🚢 Logistics also remain constrained. Gulf-to-Asia VLCC rates briefly reached around $1.27 million per day, while ship-to-ship transfer capacity off Oman has been heavily utilized. That suggests even a smoother Hormuz transit would not immediately remove the physical bottleneck.
📌 The week therefore cannot be read simply as oil falling on diplomacy. WTI is reflecting US crude availability and domestic diesel risks, while Brent remains supported by falling global inventories, tight refined-product supply and elevated logistics costs.
#EnergyMarkets $CL $NATGAS

翻訳参照
Global stocks hold gains, but market breadth remains narrow
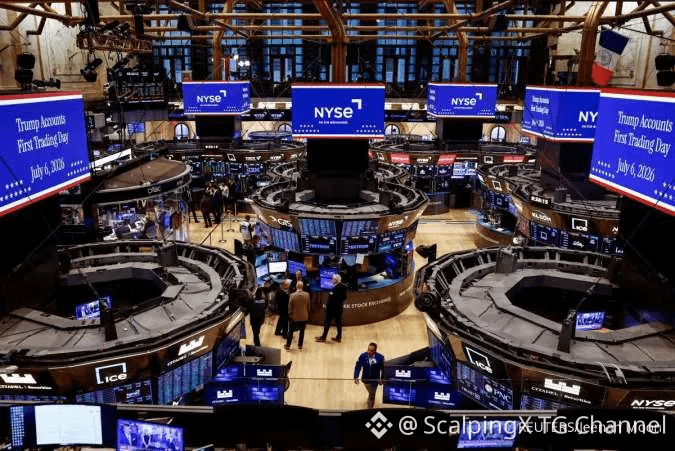
📈 U.S. equities ended the September 21–25 week higher, with the S&P 500 up about 1.2%, the Nasdaq gaining more than 2%, and the Dow rising only around 0.3%. Technology and AI-related names remained the main drivers, helping large-cap indexes advance despite persistent pressure from elevated yields.
📊 The U.S. 10-year Treasury yield briefly moved above 5.2%, while oil stayed near high levels before easing into the end of the week. The pullback in both yields and energy prices on Friday reduced pressure on equities, but it was not enough to produce a broad-based risk-on move.
🔍 Market breadth remains a key point to watch. The Nasdaq and S&P 500 advanced while small caps, value, utilities and several non-tech groups lagged. Capital therefore continues to concentrate in mega-cap and AI infrastructure names rather than spreading evenly across the market.
🌍 Europe recovered modestly after three weeks of declines, while Japan remained supported by technology shares and a weaker yen. Hong Kong and several emerging markets were less constructive, highlighting continued regional divergence.
📌 U.S. PCE data on September 30 will be one of the key catalysts next week. Softer inflation could ease pressure from yields, while persistently high rates would keep testing valuations in growth stocks.
#MarketInsights $NVDA $MU $GOOGL
Global stocks hold gains, but market breadth remains narrow
📈 U.S. equities ended the September 21–25 week higher, with the S&P 500 up about 1.2%, the Nasdaq gaining more than 2%, and the Dow rising only around 0.3%. Technology and AI-related names remained the main drivers, helping large-cap indexes advance despite persistent pressure from elevated yields.
📊 The U.S. 10-year Treasury yield briefly moved above 5.2%, while oil stayed near high levels before easing into the end of the week. The pullback in both yields and energy prices on Friday reduced pressure on equities, but it was not enough to produce a broad-based risk-on move.
🔍 Market breadth remains a key point to watch. The Nasdaq and S&P 500 advanced while small caps, value, utilities and several non-tech groups lagged. Capital therefore continues to concentrate in mega-cap and AI infrastructure names rather than spreading evenly across the market.
🌍 Europe recovered modestly after three weeks of declines, while Japan remained supported by technology shares and a weaker yen. Hong Kong and several emerging markets were less constructive, highlighting continued regional divergence.
📌 U.S. PCE data on September 30 will be one of the key catalysts next week. Softer inflation could ease pressure from yields, while persistently high rates would keep testing valuations in growth stocks.
#MarketInsights $NVDA $MU $GOOGL
📈 U.S. equities ended the September 21–25 week higher, with the S&P 500 up about 1.2%, the Nasdaq gaining more than 2%, and the Dow rising only around 0.3%. Technology and AI-related names remained the main drivers, helping large-cap indexes advance despite persistent pressure from elevated yields.
📊 The U.S. 10-year Treasury yield briefly moved above 5.2%, while oil stayed near high levels before easing into the end of the week. The pullback in both yields and energy prices on Friday reduced pressure on equities, but it was not enough to produce a broad-based risk-on move.
🔍 Market breadth remains a key point to watch. The Nasdaq and S&P 500 advanced while small caps, value, utilities and several non-tech groups lagged. Capital therefore continues to concentrate in mega-cap and AI infrastructure names rather than spreading evenly across the market.
🌍 Europe recovered modestly after three weeks of declines, while Japan remained supported by technology shares and a weaker yen. Hong Kong and several emerging markets were less constructive, highlighting continued regional divergence.
📌 U.S. PCE data on September 30 will be one of the key catalysts next week. Softer inflation could ease pressure from yields, while persistently high rates would keep testing valuations in growth stocks.
#MarketInsights $NVDA $MU $GOOGL
6
翻訳参照
Metals diverge as gold faces yield pressure while copper and zinc remain supported by physical tightness
🟡 Gold fell about 2–2.3% during Sep 21–25 to around $4,280–4,288/oz, while silver lost roughly 4%. The main pressure came from the US 10-year Treasury yield rising above 5% and the DXY holding near 101, increasing the opportunity cost of non-yielding assets despite ongoing Middle East risks.
📉 The move appears more like a repricing of rate expectations than a broad exit from precious metals. Gold speculative positioning remains heavily net long, while GLD holdings only declined modestly on Sep 24.
🔶 Copper moved in the opposite direction. LME 3-month copper held near $14,620–14,630/t, while COMEX briefly reached around $15,060/t. Cash-to-3-month backwardation widened to roughly $125/t, showing that immediately available metal still commands a strong premium despite a firmer dollar.
⚙️ Zinc also remained relatively tight, with backwardation near $106/t. Deeply negative treatment charges in China and Nyrstar’s review of the Budel smelter added further supply concerns. Nickel was weaker as inventories continued to build.
🏗️ Iron ore did not follow copper higher. Prices stayed near CNY 713–715/t on Dalian and $95–96/t on SGX, while Chinese port inventories rose to about 145.45 million tonnes. Pre-Golden Week restocking helped, but weak steel margins and blast-furnace maintenance limited demand.
📌 This was not a uniform risk-off week for metals. Precious metals remain driven mainly by yields and the dollar, while copper and zinc are still supported by physical tightness. US PCE will be key for gold and silver, while China’s post-holiday demand will matter more for copper and iron ore.
#Metals $XAU $XAG $XCU
Metals diverge as gold faces yield pressure while copper and zinc remain supported by physical tightness
🟡 Gold fell about 2–2.3% during Sep 21–25 to around $4,280–4,288/oz, while silver lost roughly 4%. The main pressure came from the US 10-year Treasury yield rising above 5% and the DXY holding near 101, increasing the opportunity cost of non-yielding assets despite ongoing Middle East risks.
📉 The move appears more like a repricing of rate expectations than a broad exit from precious metals. Gold speculative positioning remains heavily net long, while GLD holdings only declined modestly on Sep 24.
🔶 Copper moved in the opposite direction. LME 3-month copper held near $14,620–14,630/t, while COMEX briefly reached around $15,060/t. Cash-to-3-month backwardation widened to roughly $125/t, showing that immediately available metal still commands a strong premium despite a firmer dollar.
⚙️ Zinc also remained relatively tight, with backwardation near $106/t. Deeply negative treatment charges in China and Nyrstar’s review of the Budel smelter added further supply concerns. Nickel was weaker as inventories continued to build.
🏗️ Iron ore did not follow copper higher. Prices stayed near CNY 713–715/t on Dalian and $95–96/t on SGX, while Chinese port inventories rose to about 145.45 million tonnes. Pre-Golden Week restocking helped, but weak steel margins and blast-furnace maintenance limited demand.
📌 This was not a uniform risk-off week for metals. Precious metals remain driven mainly by yields and the dollar, while copper and zinc are still supported by physical tightness. US PCE will be key for gold and silver, while China’s post-holiday demand will matter more for copper and iron ore.
#Metals $XAU $XAG $XCU
🟡 Gold fell about 2–2.3% during Sep 21–25 to around $4,280–4,288/oz, while silver lost roughly 4%. The main pressure came from the US 10-year Treasury yield rising above 5% and the DXY holding near 101, increasing the opportunity cost of non-yielding assets despite ongoing Middle East risks.
📉 The move appears more like a repricing of rate expectations than a broad exit from precious metals. Gold speculative positioning remains heavily net long, while GLD holdings only declined modestly on Sep 24.
🔶 Copper moved in the opposite direction. LME 3-month copper held near $14,620–14,630/t, while COMEX briefly reached around $15,060/t. Cash-to-3-month backwardation widened to roughly $125/t, showing that immediately available metal still commands a strong premium despite a firmer dollar.
⚙️ Zinc also remained relatively tight, with backwardation near $106/t. Deeply negative treatment charges in China and Nyrstar’s review of the Budel smelter added further supply concerns. Nickel was weaker as inventories continued to build.
🏗️ Iron ore did not follow copper higher. Prices stayed near CNY 713–715/t on Dalian and $95–96/t on SGX, while Chinese port inventories rose to about 145.45 million tonnes. Pre-Golden Week restocking helped, but weak steel margins and blast-furnace maintenance limited demand.
📌 This was not a uniform risk-off week for metals. Precious metals remain driven mainly by yields and the dollar, while copper and zinc are still supported by physical tightness. US PCE will be key for gold and silver, while China’s post-holiday demand will matter more for copper and iron ore.
#Metals $XAU $XAG $XCU

31
翻訳参照
USD closes a second consecutive weekly gain as US yields and Fed expectations rise
💵 The USD remained dominant during the September 21–25 week, with DXY rising from around 100.2–100.4 to nearly 101.40, its highest level in roughly two months, before easing back toward 101 by the end of the week. The move was driven mainly by a broader repricing of a more hawkish Fed outlook rather than by a single event.
📈 US flash PMI data for September stood out, with the Composite index rising to 58.4, Services reaching 58.7 and Manufacturing 57.0. Stronger growth alongside higher input costs pushed markets to price in a greater chance of another Fed rate hike in October, while also driving US Treasury yields higher.
🌍 Diverging economic conditions also supported the dollar. Eurozone PMI improved, helping the EUR hold up relatively better, while GBP came under pressure from softer UK data. AUD and CAD also weakened as broad USD strength outweighed support from RBA expectations and oil-price movements.
🇯🇵 JPY was the main late-week exception. USD/JPY approached 159 before falling sharply as signals from Japan reinforced concerns over excessive yen weakness and kept intervention risk in focus. The yen rebound helped DXY cool on Friday but did not change the broader weekly trend.
🛢️ Elevated oil prices and Middle East tensions continued to add to global inflation pressure, reinforcing the case for higher US yields. However, oil’s pullback late in the week also showed that USD gains could face temporary corrections as geopolitical expectations shift.
📅 Attention now turns to the RBA decision on September 29 and US PCE inflation on September 30. If US inflation remains firm, yields and the dollar could stay supported; a softer-than-expected PCE reading would give heavily sold currencies more room for a technical rebound.
#ForexInsights
$BTC
USD closes a second consecutive weekly gain as US yields and Fed expectations rise
💵 The USD remained dominant during the September 21–25 week, with DXY rising from around 100.2–100.4 to nearly 101.40, its highest level in roughly two months, before easing back toward 101 by the end of the week. The move was driven mainly by a broader repricing of a more hawkish Fed outlook rather than by a single event.
📈 US flash PMI data for September stood out, with the Composite index rising to 58.4, Services reaching 58.7 and Manufacturing 57.0. Stronger growth alongside higher input costs pushed markets to price in a greater chance of another Fed rate hike in October, while also driving US Treasury yields higher.
🌍 Diverging economic conditions also supported the dollar. Eurozone PMI improved, helping the EUR hold up relatively better, while GBP came under pressure from softer UK data. AUD and CAD also weakened as broad USD strength outweighed support from RBA expectations and oil-price movements.
🇯🇵 JPY was the main late-week exception. USD/JPY approached 159 before falling sharply as signals from Japan reinforced concerns over excessive yen weakness and kept intervention risk in focus. The yen rebound helped DXY cool on Friday but did not change the broader weekly trend.
🛢️ Elevated oil prices and Middle East tensions continued to add to global inflation pressure, reinforcing the case for higher US yields. However, oil’s pullback late in the week also showed that USD gains could face temporary corrections as geopolitical expectations shift.
📅 Attention now turns to the RBA decision on September 29 and US PCE inflation on September 30. If US inflation remains firm, yields and the dollar could stay supported; a softer-than-expected PCE reading would give heavily sold currencies more room for a technical rebound.
#ForexInsights
$BTC
💵 The USD remained dominant during the September 21–25 week, with DXY rising from around 100.2–100.4 to nearly 101.40, its highest level in roughly two months, before easing back toward 101 by the end of the week. The move was driven mainly by a broader repricing of a more hawkish Fed outlook rather than by a single event.
📈 US flash PMI data for September stood out, with the Composite index rising to 58.4, Services reaching 58.7 and Manufacturing 57.0. Stronger growth alongside higher input costs pushed markets to price in a greater chance of another Fed rate hike in October, while also driving US Treasury yields higher.
🌍 Diverging economic conditions also supported the dollar. Eurozone PMI improved, helping the EUR hold up relatively better, while GBP came under pressure from softer UK data. AUD and CAD also weakened as broad USD strength outweighed support from RBA expectations and oil-price movements.
🇯🇵 JPY was the main late-week exception. USD/JPY approached 159 before falling sharply as signals from Japan reinforced concerns over excessive yen weakness and kept intervention risk in focus. The yen rebound helped DXY cool on Friday but did not change the broader weekly trend.
🛢️ Elevated oil prices and Middle East tensions continued to add to global inflation pressure, reinforcing the case for higher US yields. However, oil’s pullback late in the week also showed that USD gains could face temporary corrections as geopolitical expectations shift.
📅 Attention now turns to the RBA decision on September 29 and US PCE inflation on September 30. If US inflation remains firm, yields and the dollar could stay supported; a softer-than-expected PCE reading would give heavily sold currencies more room for a technical rebound.
#ForexInsights
$BTC
1
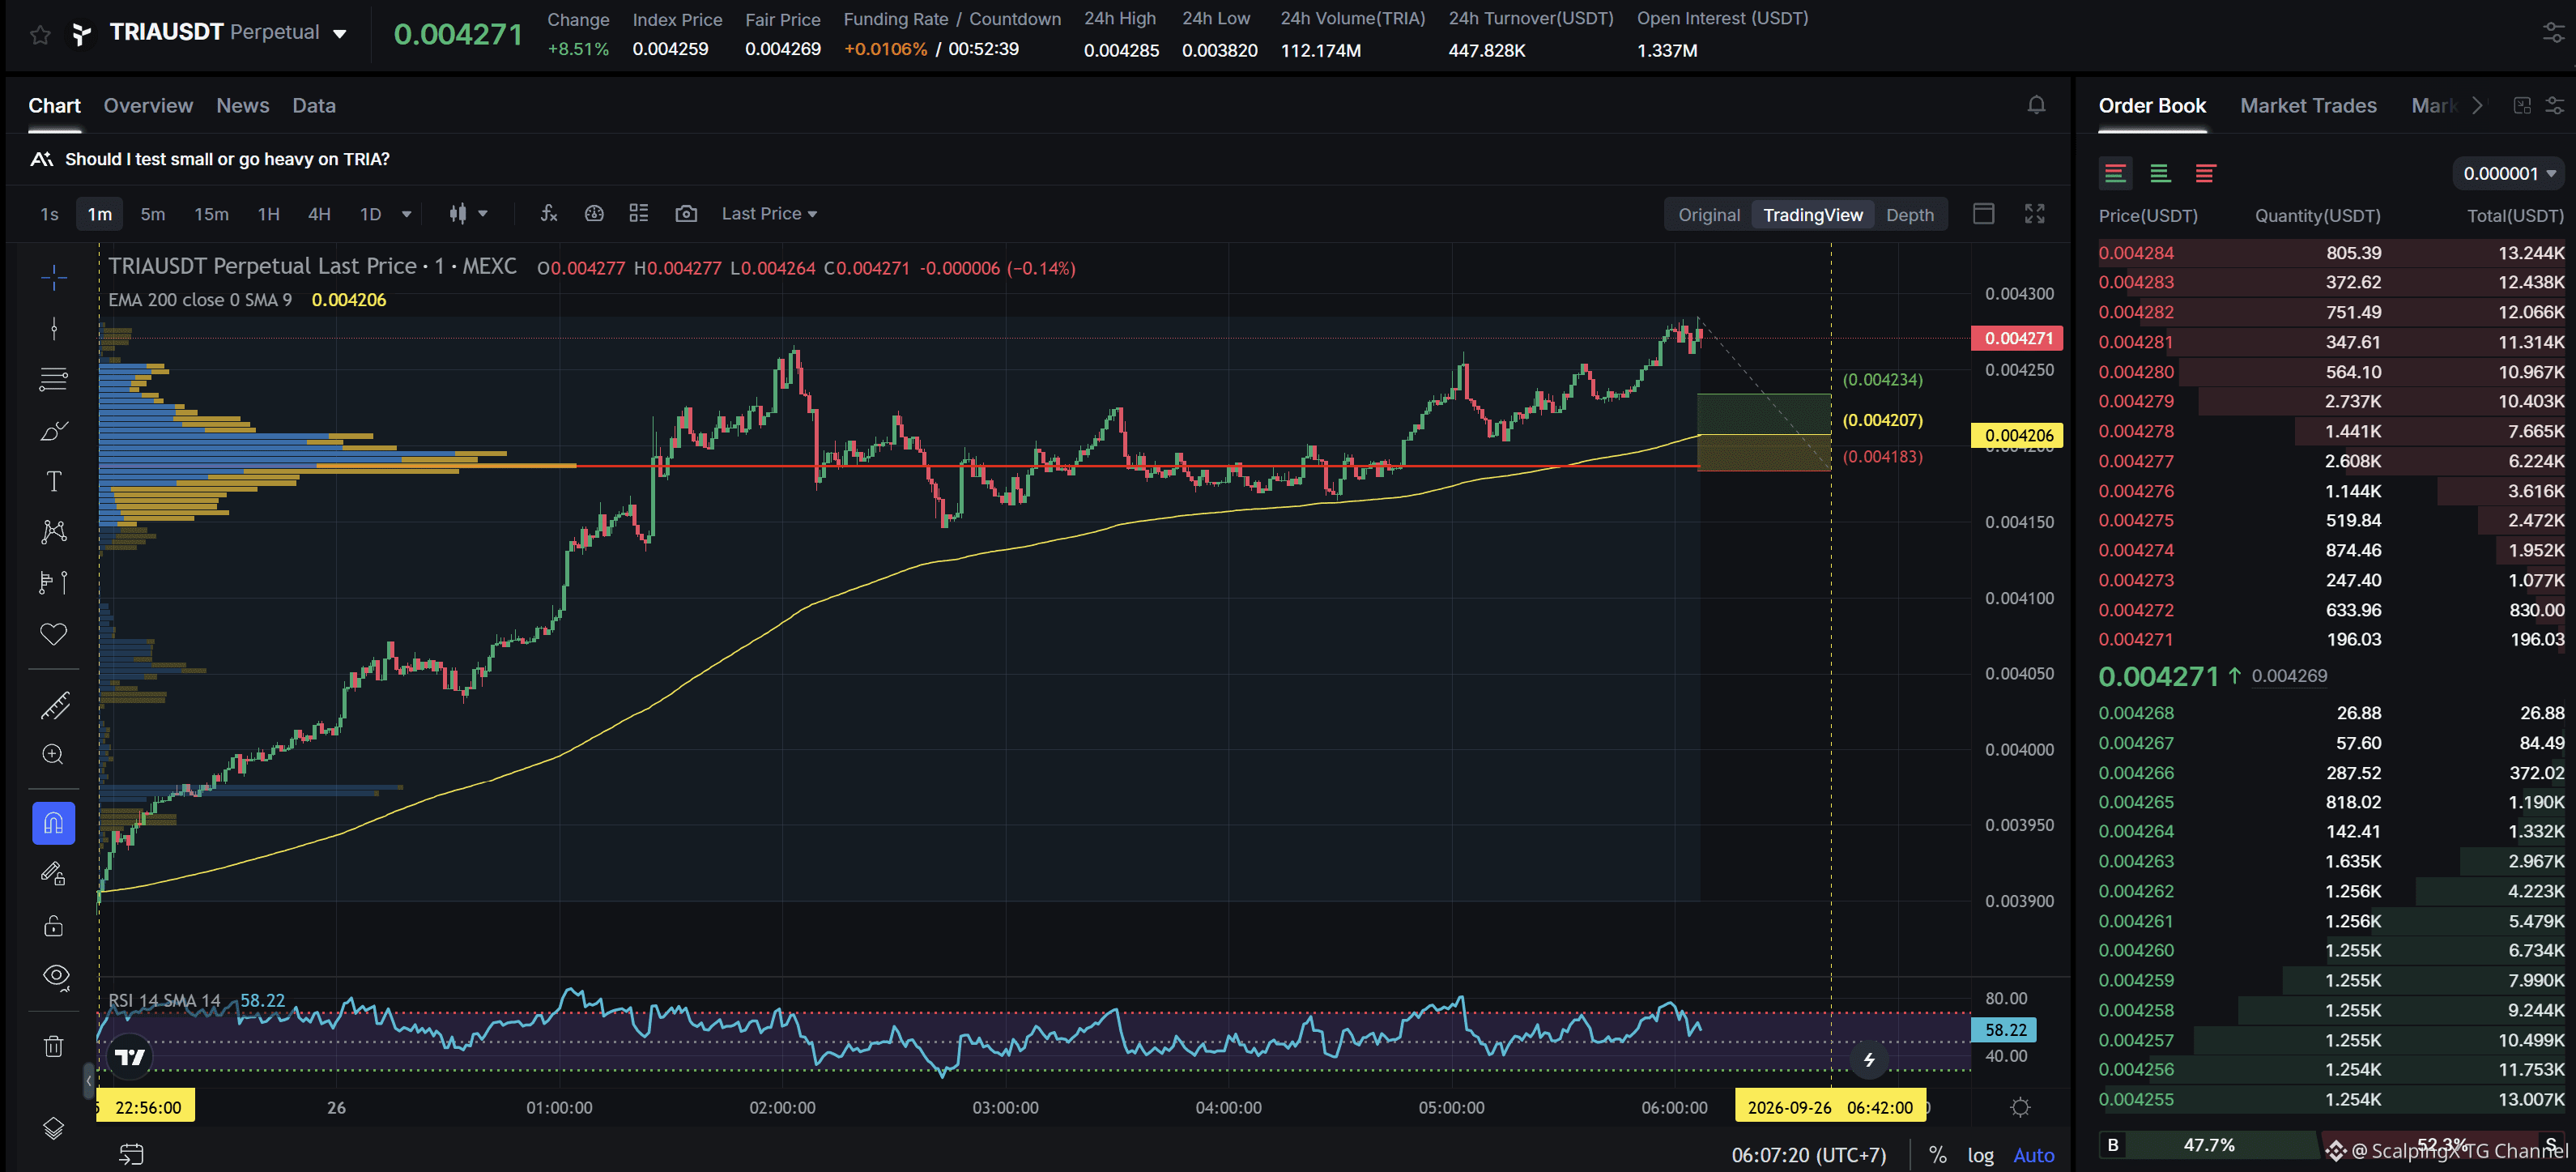
$TRIA - Mcap 9.12M$ - 24時間センチメント -8.00 強気ではない(ベアリッシュ) SC02 M1 - 予約中のロング注文。エントリーにはPOCが含まれており、いかなる弱いゾーンにも影響されません。現在のサポートゾーンの幅は約0.58%です。上昇トレンドは7時間12分続いており、記録された最大の価格上昇は9.70%でした。このサポートゾーンを価格が失うと、トレンドが下方向に反転する可能性が非常に高いです。
$TRIA - Mcap 9.12M$ - 24時間センチメント -8.00 強気ではない(ベアリッシュ) SC02 M1 - 予約中のロング注文。エントリーにはPOCが含まれており、いかなる弱いゾーンにも影響されません。現在のサポートゾーンの幅は約0.58%です。上昇トレンドは7時間12分続いており、記録された最大の価格上昇は9.70%でした。このサポートゾーンを価格が失うと、トレンドが下方向に反転する可能性が非常に高いです。
9
翻訳参照
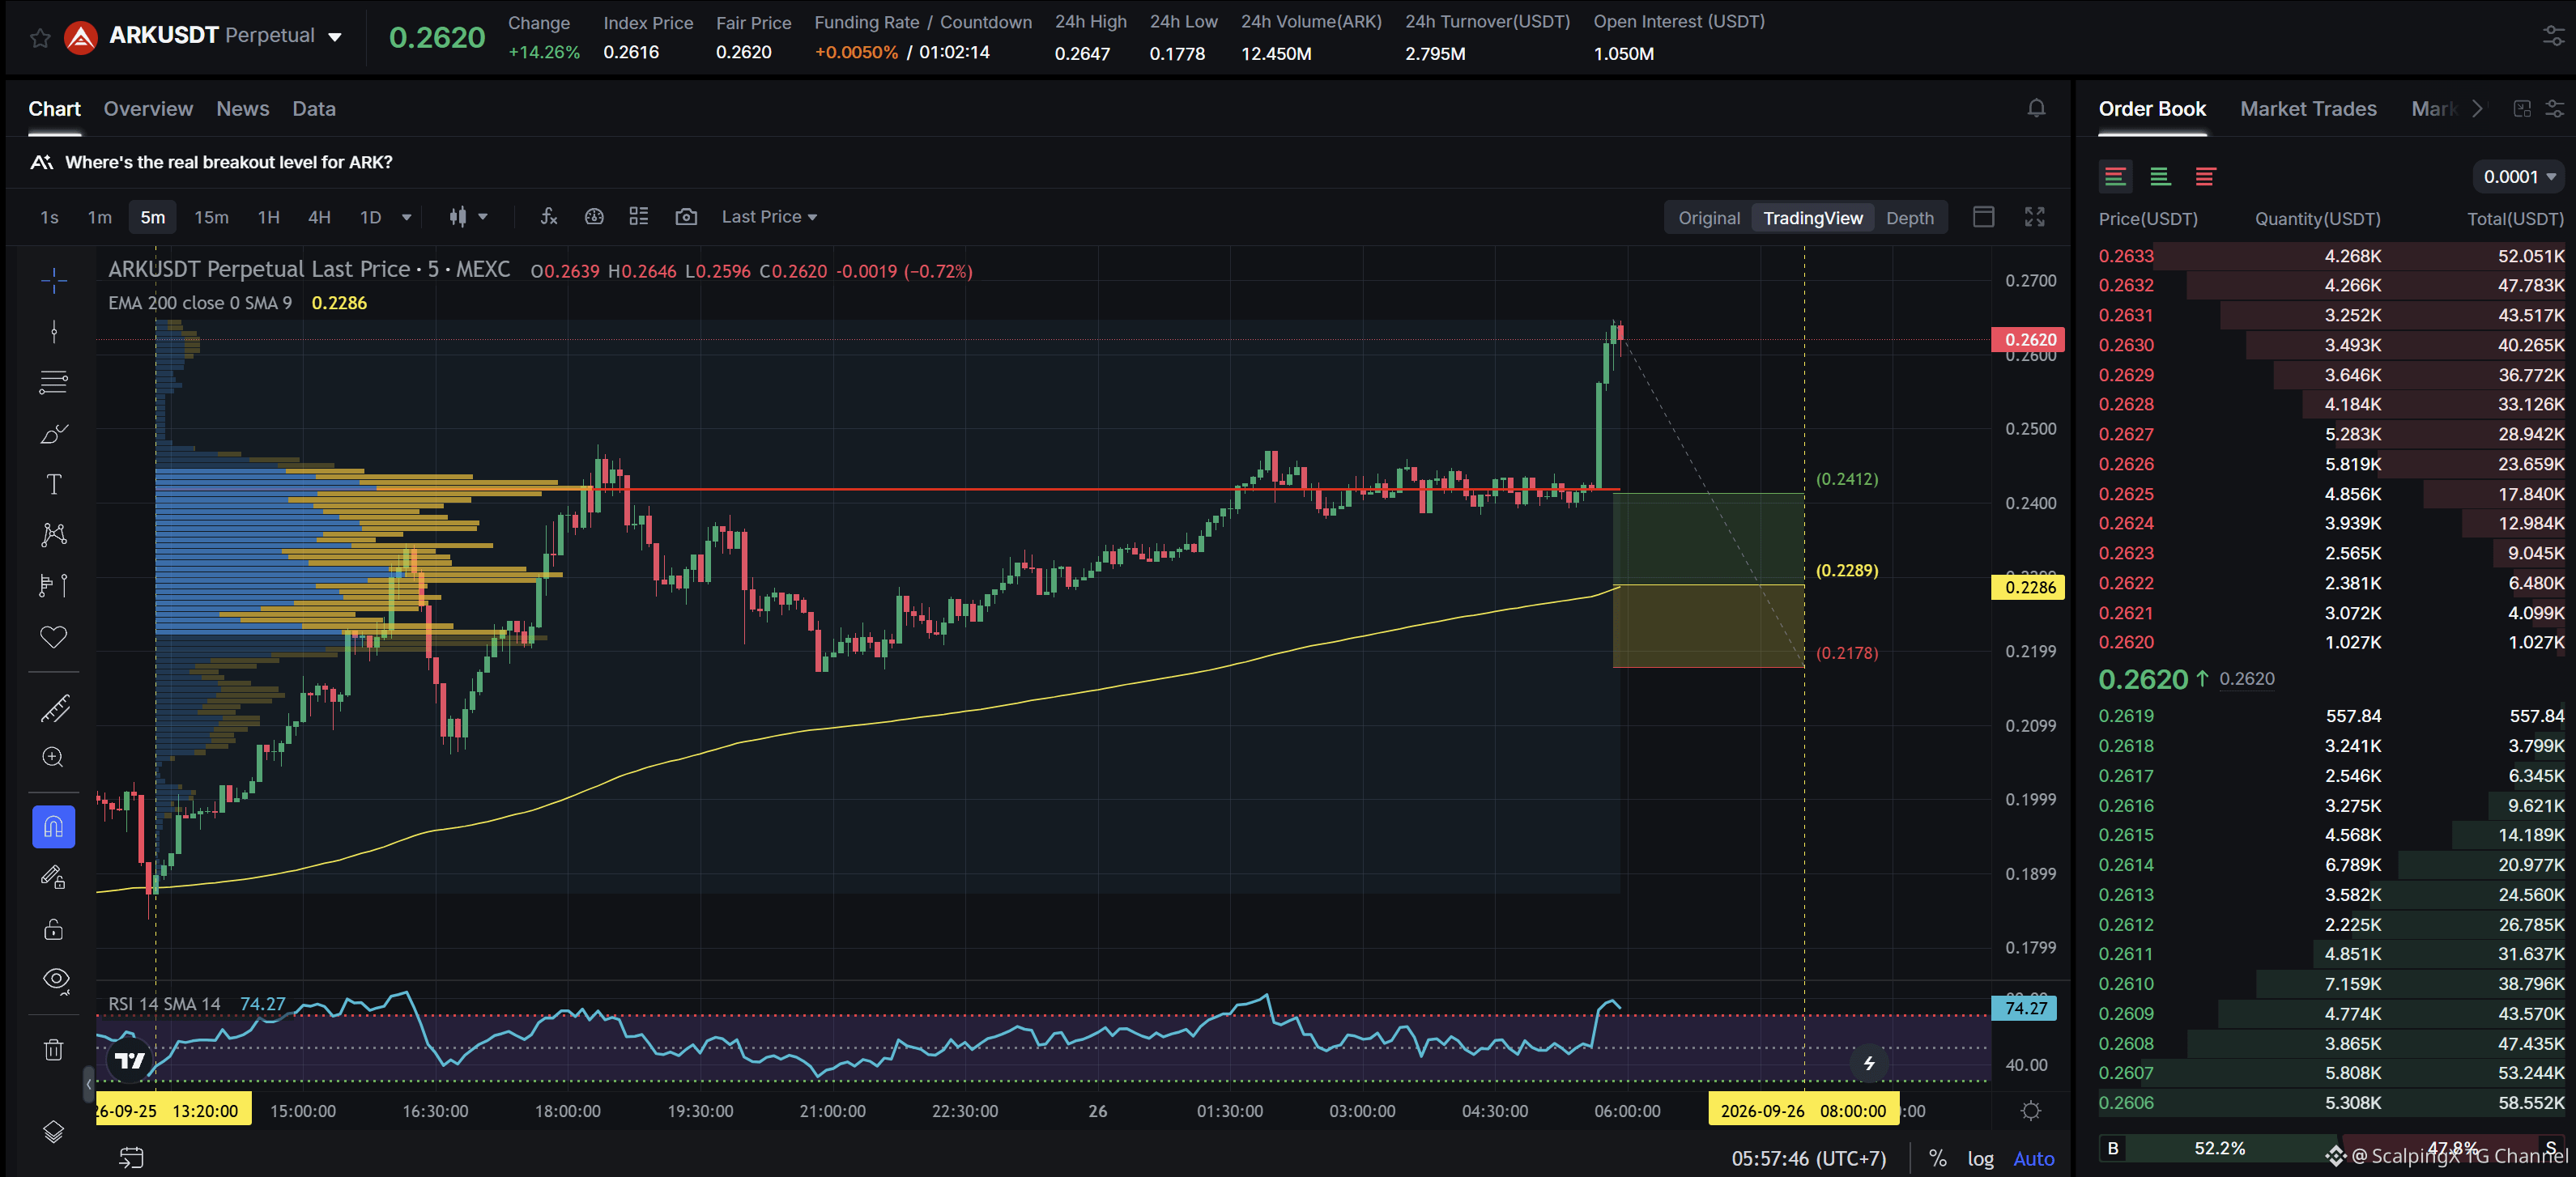
$ARK - Mcap 50.65M$ - 24h Sentiment +6.45 Bullish SC02 M5 - pending Long order. Entry lies within HVN + not affected by any weak zone, the current support zone is approximately 4.92% wide. The uptrend has lasted 16 hours 35 minutes, with a maximum recorded price increase of 40.73%. If price loses this support zone, the trend is highly likely to reverse downward.
$ARK - Mcap 50.65M$ - 24h Sentiment +6.45 Bullish SC02 M5 - pending Long order. Entry lies within HVN + not affected by any weak zone, the current support zone is approximately 4.92% wide. The uptrend has lasted 16 hours 35 minutes, with a maximum recorded price increase of 40.73%. If price loses this support zone, the trend is highly likely to reverse downward.
2
Microsoft、Copilotを統合AIワークプラットフォームへ再構築
🧩 Microsoftは、Copilotを単一アプリとして統合し、3つの主要レイヤー(Home、Code、Autopilot)を中心に据えることで、単なるスタンドアロンのチャットボットから、デジタル業務の中核となるインターフェースへと進化させています。
💻 HomeではChat、Cowork、OfficeをCopilot内に直接取り込み、Codeでは自然言語でアプリ、ダッシュボード、オートメーションを作成できるようにします。Autopilotは、クラウドベースのエージェントに焦点を当て、TeamsまたはOutlookを通じて連携しながら作業を継続できるようにします。
💰 重要な変化は商用モデルです。Microsoftは固定のユーザー単価から、ライセンスと利用(消費)ベースの課金を組み合わせる方向へ移行します。Cowork、Code、Autopilot、フロンティアモデルなどのより重いワークロードは、利用量に応じて課金されます。
📌 多くの機能はまだ段階的に展開中のため、当面の影響は主に戦略面と競争面にとどまります。最終的な売上への寄与は、導入スピードと企業での採用状況次第です。
#Microsoft
$MSFT
Microsoft、Copilotを統合AIワークプラットフォームへ再構築
🧩 Microsoftは、Copilotを単一アプリとして統合し、3つの主要レイヤー(Home、Code、Autopilot)を中心に据えることで、単なるスタンドアロンのチャットボットから、デジタル業務の中核となるインターフェースへと進化させています。
💻 HomeではChat、Cowork、OfficeをCopilot内に直接取り込み、Codeでは自然言語でアプリ、ダッシュボード、オートメーションを作成できるようにします。Autopilotは、クラウドベースのエージェントに焦点を当て、TeamsまたはOutlookを通じて連携しながら作業を継続できるようにします。
💰 重要な変化は商用モデルです。Microsoftは固定のユーザー単価から、ライセンスと利用(消費)ベースの課金を組み合わせる方向へ移行します。Cowork、Code、Autopilot、フロンティアモデルなどのより重いワークロードは、利用量に応じて課金されます。
📌 多くの機能はまだ段階的に展開中のため、当面の影響は主に戦略面と競争面にとどまります。最終的な売上への寄与は、導入スピードと企業での採用状況次第です。
#Microsoft
$MSFT
🧩 Microsoftは、Copilotを単一アプリとして統合し、3つの主要レイヤー(Home、Code、Autopilot)を中心に据えることで、単なるスタンドアロンのチャットボットから、デジタル業務の中核となるインターフェースへと進化させています。
💻 HomeではChat、Cowork、OfficeをCopilot内に直接取り込み、Codeでは自然言語でアプリ、ダッシュボード、オートメーションを作成できるようにします。Autopilotは、クラウドベースのエージェントに焦点を当て、TeamsまたはOutlookを通じて連携しながら作業を継続できるようにします。
💰 重要な変化は商用モデルです。Microsoftは固定のユーザー単価から、ライセンスと利用(消費)ベースの課金を組み合わせる方向へ移行します。Cowork、Code、Autopilot、フロンティアモデルなどのより重いワークロードは、利用量に応じて課金されます。
📌 多くの機能はまだ段階的に展開中のため、当面の影響は主に戦略面と競争面にとどまります。最終的な売上への寄与は、導入スピードと企業での採用状況次第です。
#Microsoft
$MSFT

30
インフレ期待が高止まりする中、米国の消費者センチメントが4カ月ぶりの低水準に下落
📉 ミシガン大学の9月の消費者センチメント指数(確報)は48.1となり、速報の47.8および47.5~47.6程度という予想をわずかに上回ったものの、8月からはなお7%下落した。
🔎 衰弱は見通しに集中しており、期待指数は10.1%下落して46.3となった一方、現状の条件は1.9%しか低下しなかった。これは、消費者が現在の状況よりも今後の数カ月に対してより懸念を抱いていることを示唆している。
🔥 1年先のインフレ期待は4.6%で横ばいだったが、5年先の指標は3.4%へ上昇した。燃料費の上昇や貿易関連の圧力がセンチメントに引き続き重しとなり、物価上昇リスクが残る中で成長懸念も高い状態が続いている。
🏦 最終確報では、新たなマイナス材料となるショックはもたらされなかった。悪化の大半はすでに速報で見えていたためだ。それでも、弱いセンチメントに加えてインフレ期待が高いことが、FRBの利下げ局面の見通しをより複雑にしている。
#USMacro
$ETH
インフレ期待が高止まりする中、米国の消費者センチメントが4カ月ぶりの低水準に下落
📉 ミシガン大学の9月の消費者センチメント指数(確報)は48.1となり、速報の47.8および47.5~47.6程度という予想をわずかに上回ったものの、8月からはなお7%下落した。
🔎 衰弱は見通しに集中しており、期待指数は10.1%下落して46.3となった一方、現状の条件は1.9%しか低下しなかった。これは、消費者が現在の状況よりも今後の数カ月に対してより懸念を抱いていることを示唆している。
🔥 1年先のインフレ期待は4.6%で横ばいだったが、5年先の指標は3.4%へ上昇した。燃料費の上昇や貿易関連の圧力がセンチメントに引き続き重しとなり、物価上昇リスクが残る中で成長懸念も高い状態が続いている。
🏦 最終確報では、新たなマイナス材料となるショックはもたらされなかった。悪化の大半はすでに速報で見えていたためだ。それでも、弱いセンチメントに加えてインフレ期待が高いことが、FRBの利下げ局面の見通しをより複雑にしている。
#USMacro
$ETH
📉 ミシガン大学の9月の消費者センチメント指数(確報)は48.1となり、速報の47.8および47.5~47.6程度という予想をわずかに上回ったものの、8月からはなお7%下落した。
🔎 衰弱は見通しに集中しており、期待指数は10.1%下落して46.3となった一方、現状の条件は1.9%しか低下しなかった。これは、消費者が現在の状況よりも今後の数カ月に対してより懸念を抱いていることを示唆している。
🔥 1年先のインフレ期待は4.6%で横ばいだったが、5年先の指標は3.4%へ上昇した。燃料費の上昇や貿易関連の圧力がセンチメントに引き続き重しとなり、物価上昇リスクが残る中で成長懸念も高い状態が続いている。
🏦 最終確報では、新たなマイナス材料となるショックはもたらされなかった。悪化の大半はすでに速報で見えていたためだ。それでも、弱いセンチメントに加えてインフレ期待が高いことが、FRBの利下げ局面の見通しをより複雑にしている。
#USMacro
$ETH

2
ハンセンが3営業日連続で下落し、約2か月ぶりの安値近辺で引け
📉 ハンセン指数は9月25日に24,510.09で取引を終え、前日比1.01%安。これで3日連続の下落となった。ハンセン・テック指数は1.13%下落して4,311.78。テクノロジーおよび保険株が市場の重しとなり続けている。
📊 HSIは日中に約2%下落し一時24,275.56まで下げたが、その後午後に損失の一部を取り戻した。戻りは、序盤の売り圧力が和らいだことを示唆する一方で、指数は依然として約2か月ぶりの最も低い水準付近で終えている。
💧 市場の売買代金は、株式の相互取引(Stock Connect)が停止され、また連休で中国本土市場も休場だったため、約1,022億香港ドルにとどまった。9月28日の本土市場再開が、現在の売り圧力が継続するかどうかの次の重要な試金石となる。
#MarketInsights
$BNB
ハンセンが3営業日連続で下落し、約2か月ぶりの安値近辺で引け
📉 ハンセン指数は9月25日に24,510.09で取引を終え、前日比1.01%安。これで3日連続の下落となった。ハンセン・テック指数は1.13%下落して4,311.78。テクノロジーおよび保険株が市場の重しとなり続けている。
📊 HSIは日中に約2%下落し一時24,275.56まで下げたが、その後午後に損失の一部を取り戻した。戻りは、序盤の売り圧力が和らいだことを示唆する一方で、指数は依然として約2か月ぶりの最も低い水準付近で終えている。
💧 市場の売買代金は、株式の相互取引(Stock Connect)が停止され、また連休で中国本土市場も休場だったため、約1,022億香港ドルにとどまった。9月28日の本土市場再開が、現在の売り圧力が継続するかどうかの次の重要な試金石となる。
#MarketInsights
$BNB
📉 ハンセン指数は9月25日に24,510.09で取引を終え、前日比1.01%安。これで3日連続の下落となった。ハンセン・テック指数は1.13%下落して4,311.78。テクノロジーおよび保険株が市場の重しとなり続けている。
📊 HSIは日中に約2%下落し一時24,275.56まで下げたが、その後午後に損失の一部を取り戻した。戻りは、序盤の売り圧力が和らいだことを示唆する一方で、指数は依然として約2か月ぶりの最も低い水準付近で終えている。
💧 市場の売買代金は、株式の相互取引(Stock Connect)が停止され、また連休で中国本土市場も休場だったため、約1,022億香港ドルにとどまった。9月28日の本土市場再開が、現在の売り圧力が継続するかどうかの次の重要な試金石となる。
#MarketInsights
$BNB
2
ログインして、さらにコンテンツを読む
厳選トピックで世界の暗号資産トレーダーの仲間入り
⚡️ 暗号資産に関する最新かつ有益な情報が見つかります。
💬 世界最大の暗号資産取引所から信頼されています。
👍 認証を受けたクリエイターから、有益なインサイトを得られます。
メール / 電話番号
トレンドトピック
CircleMints500MUSDCOnSolana
閲覧回数 48,930
1,233人が討論中
$SOL — <a>Circle</a>はソラナでUSDCを5億ドル分、最新のバッチを発行したばかりです。🚨
CircleはUSDCをソラナ上に2回に分けてそれぞれ2.5億ドルずつ、合計5億ドル発行し、ネットワークにもう一段大きな流動性の注入を加えました。報告によれば、トークンは当初すべて、取引に直接投入されるのではなく、Circleが管理するトレジャリー内に留まっていたものの、発行(ミント)手順はチェーン上で確認されています。
これは孤立した動きではありません。
ソラナのステーブルコイン供給総量は過去最高の新たな水準に到達し、173億ドルとなりました。一方、報道によればCircleは8月の1か月だけで、ソラナ上に約110億ドル相当のUSDCを発行したとのことです。
では、これは$SOL にとってなぜ重要なのでしょうか?
ステーブルコインの流動性が増えることは、DEXやDeFi、決済、そしてオンチェーン活動のための燃料が増えることを意味し得ます。
資金はソラナから出ていきません。
その上で、より多くのドルが継続的に鋳造されています。👀
続報をお願いします
$CRCL
#circlemints500musdconsolana #PolymarketBankFailureBetsDrawFDICConcern #BlackRockBuildsTokenizedPortfoliosForOndo #BitwiseFilesToListNEARETFOnNYSEArca #SECCommissionerPeirceToLeaveOct2
Shamika Metting
·いいね:6件
·閲覧回数 5.3k
PolymarketBankFailureBetsDrawFDICConcern
閲覧回数 62,469
1,308人が討論中
BlackRockBuildsTokenizedPortfoliosForOndo
閲覧回数 49,273
908人が討論中