

highly skilled
15 投稿

highly skilled
報告
ユーザーをブロック
baby
取引を発注
28日
0 フォロー
0 フォロワー
1 いいね
投稿
ポートフォリオ
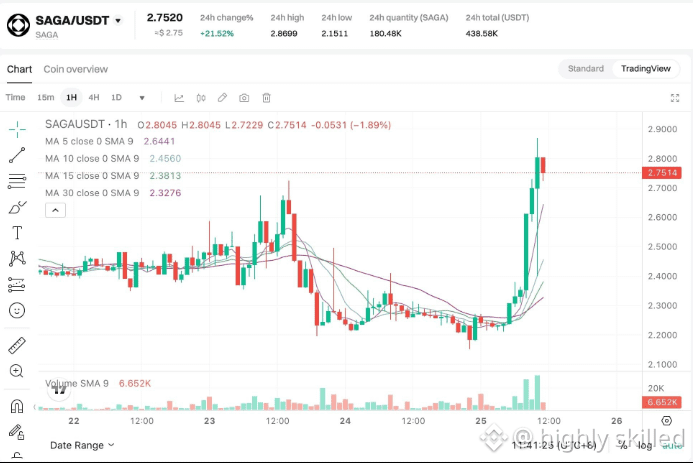
SAGA/USDT — 専門的テクニカル分析
2026年9月26日時点で、SAGAはおおよそ$0.0341〜$0.0348です。重要なのは、このトークンが非常に高いボラティリティ(変動の激しさ)期に入っていることです。9月20日に約$0.025だったものが、9月24日に$0.0753まで上昇し、その後急落して~$0.035となりました。
📊 現在の構造
LevelSAGA/USDT現行レンジ$0.034〜$0.035直近のサポート$0.0315〜$0.0320主要サポート$0.027〜$0.028レジスタンス1$0.040〜$0.041レジスタンス2$0.045〜$0.048主要レジスタンス$0.052〜$0.055直近のスパイク高値$0.0753
本日のバイナンスの過去データでは、$0.0319〜$0.0456のレンジで、出来高が非常に大きく、日中の大きな変動(ボラティリティ)が確認できます。
🔎 私のテクニカル見解
1. トレンド:
短期トレンドは高リスク/調整局面です。9月24〜25の大きなスパイク後の反落を受けています。~$0.075からの拒否反応(跳ね返し)が重要です。
2. 強気の確認:
$0.040〜$0.041を維持して再び上回る動きが(できれば強い出来高を伴って)起これば、短期の構造は改善します。$0.048を上抜けると、より強い確認になります。
3. 弱気の警告:
$0.0315〜$0.0320が決定的に割れた場合、次に重要な領域はおおよそ$0.027〜$0.028です。
4. ファンダメンタル面のリスク:
Bitgetは9月24日、SAGA/USDTを(現物の取引ペアを含めて)公式に上場廃止しました。SagaEVMも9月24日に60日間のサンセット期間に入り、11月23日にシャットダウン予定です。なお、これはメインのSagaネットワークではなく、EVMチェーンレットに適用されます。サポート: ~$0.0320〜$0.0340 レジスタンス: ~$0.0400〜$0.0450 より強いレジスタンス: ~$0.047〜$0.050 24時間のボラティリティは非常に高いです。CoinMarketCapは、24hレンジがおおよそ$0.0279〜$0.0734と報告しています
🎯 取引シナリオ
強気シナリオ:
$0.040 → $0.045 → $0.048 → $0.052
弱気シナリオ:
$0.032 → $0.028 → $0.024
高リスクゾーン:$0.032〜$0.040 — 価格はどちらの方向にも非常に素早く動き得ます。 $SAGA
{spot}(SAGAUSDT)
SAGA/USDT — 専門的テクニカル分析
2026年9月26日時点で、SAGAはおおよそ$0.0341〜$0.0348です。重要なのは、このトークンが非常に高いボラティリティ(変動の激しさ)期に入っていることです。9月20日に約$0.025だったものが、9月24日に$0.0753まで上昇し、その後急落して~$0.035となりました。
📊 現在の構造
LevelSAGA/USDT現行レンジ$0.034〜$0.035直近のサポート$0.0315〜$0.0320主要サポート$0.027〜$0.028レジスタンス1$0.040〜$0.041レジスタンス2$0.045〜$0.048主要レジスタンス$0.052〜$0.055直近のスパイク高値$0.0753
本日のバイナンスの過去データでは、$0.0319〜$0.0456のレンジで、出来高が非常に大きく、日中の大きな変動(ボラティリティ)が確認できます。
🔎 私のテクニカル見解
1. トレンド:
短期トレンドは高リスク/調整局面です。9月24〜25の大きなスパイク後の反落を受けています。~$0.075からの拒否反応(跳ね返し)が重要です。
2. 強気の確認:
$0.040〜$0.041を維持して再び上回る動きが(できれば強い出来高を伴って)起これば、短期の構造は改善します。$0.048を上抜けると、より強い確認になります。
3. 弱気の警告:
$0.0315〜$0.0320が決定的に割れた場合、次に重要な領域はおおよそ$0.027〜$0.028です。
4. ファンダメンタル面のリスク:
Bitgetは9月24日、SAGA/USDTを(現物の取引ペアを含めて)公式に上場廃止しました。SagaEVMも9月24日に60日間のサンセット期間に入り、11月23日にシャットダウン予定です。なお、これはメインのSagaネットワークではなく、EVMチェーンレットに適用されます。サポート: ~$0.0320〜$0.0340 レジスタンス: ~$0.0400〜$0.0450 より強いレジスタンス: ~$0.047〜$0.050 24時間のボラティリティは非常に高いです。CoinMarketCapは、24hレンジがおおよそ$0.0279〜$0.0734と報告しています
🎯 取引シナリオ
強気シナリオ:
$0.040 → $0.045 → $0.048 → $0.052
弱気シナリオ:
$0.032 → $0.028 → $0.024
高リスクゾーン:$0.032〜$0.040 — 価格はどちらの方向にも非常に素早く動き得ます。 $SAGA
2026年9月26日時点で、SAGAはおおよそ$0.0341〜$0.0348です。重要なのは、このトークンが非常に高いボラティリティ(変動の激しさ)期に入っていることです。9月20日に約$0.025だったものが、9月24日に$0.0753まで上昇し、その後急落して~$0.035となりました。
📊 現在の構造
LevelSAGA/USDT現行レンジ$0.034〜$0.035直近のサポート$0.0315〜$0.0320主要サポート$0.027〜$0.028レジスタンス1$0.040〜$0.041レジスタンス2$0.045〜$0.048主要レジスタンス$0.052〜$0.055直近のスパイク高値$0.0753
本日のバイナンスの過去データでは、$0.0319〜$0.0456のレンジで、出来高が非常に大きく、日中の大きな変動(ボラティリティ)が確認できます。
🔎 私のテクニカル見解
1. トレンド:
短期トレンドは高リスク/調整局面です。9月24〜25の大きなスパイク後の反落を受けています。~$0.075からの拒否反応(跳ね返し)が重要です。
2. 強気の確認:
$0.040〜$0.041を維持して再び上回る動きが(できれば強い出来高を伴って)起これば、短期の構造は改善します。$0.048を上抜けると、より強い確認になります。
3. 弱気の警告:
$0.0315〜$0.0320が決定的に割れた場合、次に重要な領域はおおよそ$0.027〜$0.028です。
4. ファンダメンタル面のリスク:
Bitgetは9月24日、SAGA/USDTを(現物の取引ペアを含めて)公式に上場廃止しました。SagaEVMも9月24日に60日間のサンセット期間に入り、11月23日にシャットダウン予定です。なお、これはメインのSagaネットワークではなく、EVMチェーンレットに適用されます。サポート: ~$0.0320〜$0.0340 レジスタンス: ~$0.0400〜$0.0450 より強いレジスタンス: ~$0.047〜$0.050 24時間のボラティリティは非常に高いです。CoinMarketCapは、24hレンジがおおよそ$0.0279〜$0.0734と報告しています
🎯 取引シナリオ
強気シナリオ:
$0.040 → $0.045 → $0.048 → $0.052
弱気シナリオ:
$0.032 → $0.028 → $0.024
高リスクゾーン:$0.032〜$0.040 — 価格はどちらの方向にも非常に素早く動き得ます。 $SAGA
309
🟣$ETH
{spot}(ETHUSDT)
現在の価格:およそ$2,686。ETHは24時間で約+1.1%、7日で約+7.8%上昇しています。
テクニカル見通し:
🟢 見通し:全体的に強気
🟢 サポート:$2,630、その次に$2,560
🔴 レジスタンス:$2,715〜$2,800
🚀 $2,800を上回る強い日足終値は、ブレイクアウトの仕組みを強化するでしょう。
🎯 ブレイクアウトが継続する場合、テクニカル目標はおよそ$3,050とされています。
⚠️ $2,560を下回ると強気の構造は弱まります。より重要な警戒水準は$2,350〜$2,360を下回った場合です。
プロ向け見解:ETHは現在強気の構造にありますが、$2.8K付近に強いレジスタンスがあります。RSIは約63で、まだ過熱しすぎではないものの勢いはプラスです。
これらはテクニカル水準であり、確実な価格予測や金融アドバイスではありません。🟣 ETH — 本日の更新
現在の価格:およそ$2,686。ETHは24時間で約+1.1%、7日で約+7.8%上昇しています。
テクニカル見通し:
🟢 見通し:全体的に強気
🟢 サポート:$2,630、その次に$2,560
🔴 レジスタンス:$2,715〜$2,800
🚀 $2,800を上回る強い日足終値は、ブレイクアウトの仕組みを強化するでしょう。
🟣$ETH
現在の価格:およそ$2,686。ETHは24時間で約+1.1%、7日で約+7.8%上昇しています。
テクニカル見通し:
🟢 見通し:全体的に強気
🟢 サポート:$2,630、その次に$2,560
🔴 レジスタンス:$2,715〜$2,800
🚀 $2,800を上回る強い日足終値は、ブレイクアウトの仕組みを強化するでしょう。
🎯 ブレイクアウトが継続する場合、テクニカル目標はおよそ$3,050とされています。
⚠️ $2,560を下回ると強気の構造は弱まります。より重要な警戒水準は$2,350〜$2,360を下回った場合です。
プロ向け見解:ETHは現在強気の構造にありますが、$2.8K付近に強いレジスタンスがあります。RSIは約63で、まだ過熱しすぎではないものの勢いはプラスです。
これらはテクニカル水準であり、確実な価格予測や金融アドバイスではありません。🟣 ETH — 本日の更新
現在の価格:およそ$2,686。ETHは24時間で約+1.1%、7日で約+7.8%上昇しています。
テクニカル見通し:
🟢 見通し:全体的に強気
🟢 サポート:$2,630、その次に$2,560
🔴 レジスタンス:$2,715〜$2,800
🚀 $2,800を上回る強い日足終値は、ブレイクアウトの仕組みを強化するでしょう。
現在の価格:およそ$2,686。ETHは24時間で約+1.1%、7日で約+7.8%上昇しています。
テクニカル見通し:
🟢 見通し:全体的に強気
🟢 サポート:$2,630、その次に$2,560
🔴 レジスタンス:$2,715〜$2,800
🚀 $2,800を上回る強い日足終値は、ブレイクアウトの仕組みを強化するでしょう。
🎯 ブレイクアウトが継続する場合、テクニカル目標はおよそ$3,050とされています。
⚠️ $2,560を下回ると強気の構造は弱まります。より重要な警戒水準は$2,350〜$2,360を下回った場合です。
プロ向け見解:ETHは現在強気の構造にありますが、$2.8K付近に強いレジスタンスがあります。RSIは約63で、まだ過熱しすぎではないものの勢いはプラスです。
これらはテクニカル水準であり、確実な価格予測や金融アドバイスではありません。🟣 ETH — 本日の更新
現在の価格:およそ$2,686。ETHは24時間で約+1.1%、7日で約+7.8%上昇しています。
テクニカル見通し:
🟢 見通し:全体的に強気
🟢 サポート:$2,630、その次に$2,560
🔴 レジスタンス:$2,715〜$2,800
🚀 $2,800を上回る強い日足終値は、ブレイクアウトの仕組みを強化するでしょう。
2
翻訳参照
$BTC —
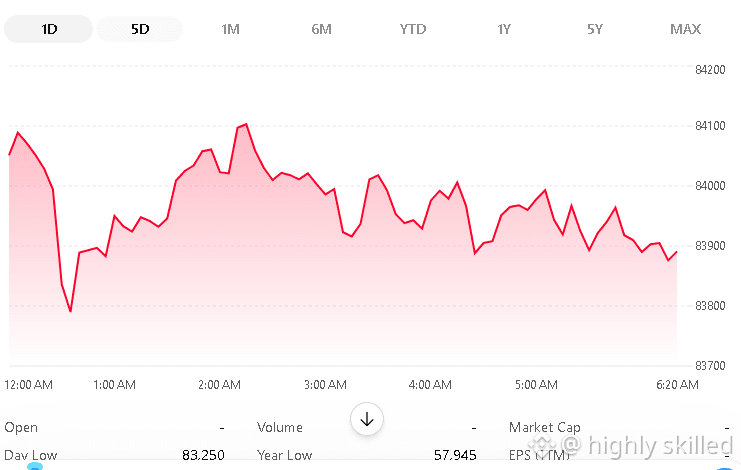
Current zone: ~$84K
Market structure: Bullish on the higher timeframe, but consolidating short-term.
BTC recently rejected around $87K, which is the major near-term resistance.
Daily technical indicators remain broadly positive: BTC is above its 50- and 200-period EMAs, while RSI is around 65, showing strong momentum but approaching an area where a pullback can occur.
U.S. spot BTC ETFs have recently seen strong inflows, supporting demand, although macro pressure from high Treasury yields remains a risk.
Key levels
LevelImportance$87,000🔴 Major resistance$85,000–86,000Resistance / breakout zone$83,000–84,000🟡 Current consolidation$82,600🟢 Important short-term support$79,500–81,000🟢 Stronger support zone
A technical forecast published yesterday identified $82,666 as an important control/support level and $85,044 as the key short-term resistance.
My technical reading
Above $87K: a confirmed breakout would materially improve the short-term structure.
Between $82.6K–$87K: likely range/consolidation; avoid assuming that every move is a breakout.
Below $82.6K: downside pressure increases, with the next areas around $81K and $79.5K becoming important.
So right now, I would describe BTC as bullish overall but not yet confirmed for another breakout. The $87K level is particularly important. $BTC
$BTC —
Current zone: ~$84K
Market structure: Bullish on the higher timeframe, but consolidating short-term.
BTC recently rejected around $87K, which is the major near-term resistance.
Daily technical indicators remain broadly positive: BTC is above its 50- and 200-period EMAs, while RSI is around 65, showing strong momentum but approaching an area where a pullback can occur.
U.S. spot BTC ETFs have recently seen strong inflows, supporting demand, although macro pressure from high Treasury yields remains a risk.
Key levels
LevelImportance$87,000🔴 Major resistance$85,000–86,000Resistance / breakout zone$83,000–84,000🟡 Current consolidation$82,600🟢 Important short-term support$79,500–81,000🟢 Stronger support zone
A technical forecast published yesterday identified $82,666 as an important control/support level and $85,044 as the key short-term resistance.
My technical reading
Above $87K: a confirmed breakout would materially improve the short-term structure.
Between $82.6K–$87K: likely range/consolidation; avoid assuming that every move is a breakout.
Below $82.6K: downside pressure increases, with the next areas around $81K and $79.5K becoming important.
So right now, I would describe BTC as bullish overall but not yet confirmed for another breakout. The $87K level is particularly important. $BTC
Current zone: ~$84K
Market structure: Bullish on the higher timeframe, but consolidating short-term.
BTC recently rejected around $87K, which is the major near-term resistance.
Daily technical indicators remain broadly positive: BTC is above its 50- and 200-period EMAs, while RSI is around 65, showing strong momentum but approaching an area where a pullback can occur.
U.S. spot BTC ETFs have recently seen strong inflows, supporting demand, although macro pressure from high Treasury yields remains a risk.
Key levels
LevelImportance$87,000🔴 Major resistance$85,000–86,000Resistance / breakout zone$83,000–84,000🟡 Current consolidation$82,600🟢 Important short-term support$79,500–81,000🟢 Stronger support zone
A technical forecast published yesterday identified $82,666 as an important control/support level and $85,044 as the key short-term resistance.
My technical reading
Above $87K: a confirmed breakout would materially improve the short-term structure.
Between $82.6K–$87K: likely range/consolidation; avoid assuming that every move is a breakout.
Below $82.6K: downside pressure increases, with the next areas around $81K and $79.5K becoming important.
So right now, I would describe BTC as bullish overall but not yet confirmed for another breakout. The $87K level is particularly important. $BTC
8
ドージコイン(DOGE)
約0.098ドル。DOGEは依然として、センチメント(市場心理)に大きく左右される非常に投機的な暗号資産です。
主な強み:巨大なブランド認知、厚いコミュニティ、高い流動性、そして長い市場履歴。
供給:DOGEには固定の最大供給量がありません。新しいコインが継続的に流通に入ってきます。
最近の動き:大口アドレスが報告ベースで5日間のうちに約2億4000万DOGEを積み上げましたが、ウォレットの動きが必ずしも強気の意図を証明するわけではありません。
ETF需要:米国のDOGE ETFは、相対的に純資金流入が限定的です。CoinDeskによれば、約10か月にわたって3つの追跡対象ファンドで累計流入はちょうど1200万ドル超にとどまり、BitwiseはBWOWファンドを閉鎖する計画を発表しました。
主なリスク:DOGEの評価は市場センチメントと投機的需要に強く影響される一方で、継続的な発行によって追加の供給が生まれます。
注目すべき水準:最近のテクニカル分析では、約0.093〜0.094ドルがサポート、0.10ドルが重要なレジスタンス領域として示されています。
一言で:暗号資産/ミームコインのセンチメントが強まるとDOGEは非常に素早く動く可能性がありますが、そのファンダメンタルズとトークン供給により、BTCやSOLのような資産よりも実質的に投機性が高いです。 $DOGE
{spot}(DOGEUSDT)
ドージコイン(DOGE)
約0.098ドル。DOGEは依然として、センチメント(市場心理)に大きく左右される非常に投機的な暗号資産です。
主な強み:巨大なブランド認知、厚いコミュニティ、高い流動性、そして長い市場履歴。
供給:DOGEには固定の最大供給量がありません。新しいコインが継続的に流通に入ってきます。
最近の動き:大口アドレスが報告ベースで5日間のうちに約2億4000万DOGEを積み上げましたが、ウォレットの動きが必ずしも強気の意図を証明するわけではありません。
ETF需要:米国のDOGE ETFは、相対的に純資金流入が限定的です。CoinDeskによれば、約10か月にわたって3つの追跡対象ファンドで累計流入はちょうど1200万ドル超にとどまり、BitwiseはBWOWファンドを閉鎖する計画を発表しました。
主なリスク:DOGEの評価は市場センチメントと投機的需要に強く影響される一方で、継続的な発行によって追加の供給が生まれます。
注目すべき水準:最近のテクニカル分析では、約0.093〜0.094ドルがサポート、0.10ドルが重要なレジスタンス領域として示されています。
一言で:暗号資産/ミームコインのセンチメントが強まるとDOGEは非常に素早く動く可能性がありますが、そのファンダメンタルズとトークン供給により、BTCやSOLのような資産よりも実質的に投機性が高いです。 $DOGE
約0.098ドル。DOGEは依然として、センチメント(市場心理)に大きく左右される非常に投機的な暗号資産です。
主な強み:巨大なブランド認知、厚いコミュニティ、高い流動性、そして長い市場履歴。
供給:DOGEには固定の最大供給量がありません。新しいコインが継続的に流通に入ってきます。
最近の動き:大口アドレスが報告ベースで5日間のうちに約2億4000万DOGEを積み上げましたが、ウォレットの動きが必ずしも強気の意図を証明するわけではありません。
ETF需要:米国のDOGE ETFは、相対的に純資金流入が限定的です。CoinDeskによれば、約10か月にわたって3つの追跡対象ファンドで累計流入はちょうど1200万ドル超にとどまり、BitwiseはBWOWファンドを閉鎖する計画を発表しました。
主なリスク:DOGEの評価は市場センチメントと投機的需要に強く影響される一方で、継続的な発行によって追加の供給が生まれます。
注目すべき水準:最近のテクニカル分析では、約0.093〜0.094ドルがサポート、0.10ドルが重要なレジスタンス領域として示されています。
一言で:暗号資産/ミームコインのセンチメントが強まるとDOGEは非常に素早く動く可能性がありますが、そのファンダメンタルズとトークン供給により、BTCやSOLのような資産よりも実質的に投機性が高いです。 $DOGE
16
TRON(TRX)— 短い分析
現在の価格:約0.338ドル。
主な強み:TRONは主要なUSDT/ステーブルコインの決済ネットワークになっています。現在、USDTの残高は94Bドル超で、累計のネットワーク取引量は最近30Tドルを超えました。
導入状況:TRONは405M件超の口座と15B件超の取引を有しており、ネットワーク利用が大規模であることを示しています。
機関投資家の追い風:カナリー・ステークドTRX ETF(TRXS)が2026年9月に米国で上場し、TRXへの規制された市場エクスポージャーを提供しています。
リスク:TRXの価値はTRON上のステーブルコイン活動と強く連動していますが、ガバナンスは比較的集中しています。Ethereum、Solana、その他の決済/ステーブルコイン・ネットワークとの競争もリスクです。
トークノミクス:TRXにはバーン(焼却)メカニズムがありますが、最近のTRONSCANデータでは、ここ数日で純供給が増えていることが示されているため、TRXが自動的にデフレ(供給減)になると決めつけない方がよいでしょう。
一文要約:TRXはUSDT送金やステーブルコイン決済を中心に実世界での利用実績が強い一方で、その価格はより広範な暗号資産需要と、継続的なネットワーク導入に依存しています。
TRX vs SOL vs XRPを比較しているなら、簡潔なファンダメンタル比較をお伝えできます。 $TRX
{spot}(TRXUSDT)
TRON(TRX)— 短い分析
現在の価格:約0.338ドル。
主な強み:TRONは主要なUSDT/ステーブルコインの決済ネットワークになっています。現在、USDTの残高は94Bドル超で、累計のネットワーク取引量は最近30Tドルを超えました。
導入状況:TRONは405M件超の口座と15B件超の取引を有しており、ネットワーク利用が大規模であることを示しています。
機関投資家の追い風:カナリー・ステークドTRX ETF(TRXS)が2026年9月に米国で上場し、TRXへの規制された市場エクスポージャーを提供しています。
リスク:TRXの価値はTRON上のステーブルコイン活動と強く連動していますが、ガバナンスは比較的集中しています。Ethereum、Solana、その他の決済/ステーブルコイン・ネットワークとの競争もリスクです。
トークノミクス:TRXにはバーン(焼却)メカニズムがありますが、最近のTRONSCANデータでは、ここ数日で純供給が増えていることが示されているため、TRXが自動的にデフレ(供給減)になると決めつけない方がよいでしょう。
一文要約:TRXはUSDT送金やステーブルコイン決済を中心に実世界での利用実績が強い一方で、その価格はより広範な暗号資産需要と、継続的なネットワーク導入に依存しています。
TRX vs SOL vs XRPを比較しているなら、簡潔なファンダメンタル比較をお伝えできます。 $TRX
現在の価格:約0.338ドル。
主な強み:TRONは主要なUSDT/ステーブルコインの決済ネットワークになっています。現在、USDTの残高は94Bドル超で、累計のネットワーク取引量は最近30Tドルを超えました。
導入状況:TRONは405M件超の口座と15B件超の取引を有しており、ネットワーク利用が大規模であることを示しています。
機関投資家の追い風:カナリー・ステークドTRX ETF(TRXS)が2026年9月に米国で上場し、TRXへの規制された市場エクスポージャーを提供しています。
リスク:TRXの価値はTRON上のステーブルコイン活動と強く連動していますが、ガバナンスは比較的集中しています。Ethereum、Solana、その他の決済/ステーブルコイン・ネットワークとの競争もリスクです。
トークノミクス:TRXにはバーン(焼却)メカニズムがありますが、最近のTRONSCANデータでは、ここ数日で純供給が増えていることが示されているため、TRXが自動的にデフレ(供給減)になると決めつけない方がよいでしょう。
一文要約:TRXはUSDT送金やステーブルコイン決済を中心に実世界での利用実績が強い一方で、その価格はより広範な暗号資産需要と、継続的なネットワーク導入に依存しています。
TRX vs SOL vs XRPを比較しているなら、簡潔なファンダメンタル比較をお伝えできます。 $TRX
7
ソラナ(SOL)—
SOLは高ベータのレイヤー1暗号資産です。USDT/USDCとは異なり、その価値はソラナのネットワーク採用、稼働(アクティビティ)、そして暗号市場全体の需要に大きく左右されます。
現在の価格:2026年9月25〜26日頃で約117ドル。
ネットワーク活動:ソラナは最近、月間オンチェーントランザクションが50億を超えました。これは利用の強さを示しています。
テクノロジー:ソラナは最近、目標スロット時間を300msから250msに短縮し、アップデート/ファイナリティの速度を改善しました。ただし、この変更は取引処理能力を増やすものではありません。
触媒(カタリスト):エコシステムは、決済、ステーブルコイン、トークン化資産、そして機関投資家の採用へさらに踏み込んでいます。
リスク:SOLはステーブルコインに比べてかなり値動きが大きく、暗号市場全体のセンチメントが弱まると価格が急落する可能性があります。
短期のテクニカル見通し:およそ$100〜$106は、最近のテクニカル分析で重要なサポート/レジスタンス領域として挙げられています。これを上回って維持できれば最近の回復構造を保てますが、約$100を割り込むとそのセットアップが弱まります。
結論:SOLは強いネットワーク活動と拡大するエコシステムを持っていますが、高リスク/高ボラティリティな資産であり続けます。基本的にUSDT/USDCとは非常に異なります。あなたが買っているのはドルの代替ではなく、ソラナ・ネットワークの成長と経済性へのエクスポージャーです。
$SOL
{spot}(SOLUSDT)
ソラナ(SOL)—
SOLは高ベータのレイヤー1暗号資産です。USDT/USDCとは異なり、その価値はソラナのネットワーク採用、稼働(アクティビティ)、そして暗号市場全体の需要に大きく左右されます。
現在の価格:2026年9月25〜26日頃で約117ドル。
ネットワーク活動:ソラナは最近、月間オンチェーントランザクションが50億を超えました。これは利用の強さを示しています。
テクノロジー:ソラナは最近、目標スロット時間を300msから250msに短縮し、アップデート/ファイナリティの速度を改善しました。ただし、この変更は取引処理能力を増やすものではありません。
触媒(カタリスト):エコシステムは、決済、ステーブルコイン、トークン化資産、そして機関投資家の採用へさらに踏み込んでいます。
リスク:SOLはステーブルコインに比べてかなり値動きが大きく、暗号市場全体のセンチメントが弱まると価格が急落する可能性があります。
短期のテクニカル見通し:およそ$100〜$106は、最近のテクニカル分析で重要なサポート/レジスタンス領域として挙げられています。これを上回って維持できれば最近の回復構造を保てますが、約$100を割り込むとそのセットアップが弱まります。
結論:SOLは強いネットワーク活動と拡大するエコシステムを持っていますが、高リスク/高ボラティリティな資産であり続けます。基本的にUSDT/USDCとは非常に異なります。あなたが買っているのはドルの代替ではなく、ソラナ・ネットワークの成長と経済性へのエクスポージャーです。
$SOL
SOLは高ベータのレイヤー1暗号資産です。USDT/USDCとは異なり、その価値はソラナのネットワーク採用、稼働(アクティビティ)、そして暗号市場全体の需要に大きく左右されます。
現在の価格:2026年9月25〜26日頃で約117ドル。
ネットワーク活動:ソラナは最近、月間オンチェーントランザクションが50億を超えました。これは利用の強さを示しています。
テクノロジー:ソラナは最近、目標スロット時間を300msから250msに短縮し、アップデート/ファイナリティの速度を改善しました。ただし、この変更は取引処理能力を増やすものではありません。
触媒(カタリスト):エコシステムは、決済、ステーブルコイン、トークン化資産、そして機関投資家の採用へさらに踏み込んでいます。
リスク:SOLはステーブルコインに比べてかなり値動きが大きく、暗号市場全体のセンチメントが弱まると価格が急落する可能性があります。
短期のテクニカル見通し:およそ$100〜$106は、最近のテクニカル分析で重要なサポート/レジスタンス領域として挙げられています。これを上回って維持できれば最近の回復構造を保てますが、約$100を割り込むとそのセットアップが弱まります。
結論:SOLは強いネットワーク活動と拡大するエコシステムを持っていますが、高リスク/高ボラティリティな資産であり続けます。基本的にUSDT/USDCとは非常に異なります。あなたが買っているのはドルの代替ではなく、ソラナ・ネットワークの成長と経済性へのエクスポージャーです。
$SOL
1
USDC(USDコイン)USDCは、Circle Internet Groupが発行する米ドル連動のステーブルコインです。USDTと同様に、価格をだいたい$1前後に保つことを目標としているため、一般的にはUSDCを買って価格の上昇(値上がり)を期待してはいけません。
2026年9月21日時点で、Circleは流通しているUSDCが約746億ドルであると報告しています。
USDCが注目される理由
1. 担保(準備金)構造
Circleによれば、USDCは非常に流動性の高い現金および現金同等物によって100%裏付けられています。準備金の大部分は、Circle Reserve Fund(サークル・リザーブ・ファンド)を通じて保有されています。同ファンドは、短期の米国債、オーバーナイトの国債レポ、現金を保有できる政府系マネーマーケットファンドです。
2. 透明性
Circleは、毎週の準備金開示を提供し、Big Four(大手監査法人)による毎月の第三者保証を受けていると述べています。これは、ステーブルコインのリスクを評価するうえで重要な要素です。
3. 取引・導入の拡大
Circleは、USDCの流通量が2026年Q2末時点で733億ドルに達し、前年同期比19%増となったと報告しました。一方、Q2のオンチェーン取引量は1480億ドル相当ではなく、14.8兆ドルに達し、前年同期比151%増でした。
4. 規制上の位置づけ
米国のGENIUS法(GENIUS Act)により、ステーブルコインのための連邦的な枠組みが整備されました。Circleは、USDCがその枠組みに適合するよう設計されていると述べ、規制された発行と準備金構造を重視しています。
USDCとUSDT
USDCUSDT目標$1$1発行体CircleTether主な用途ドルの流動性/決済ドルの流動性/取引準備金の透明性高高だが構造が異なる米国における規制上の位置づけ強いより複雑より大規模なエコシステム非常に大きい一般的により大きい価格上昇の可能性本質的にない本質的にない主なリスクCircle/規制/バンキングリスクTether/準備金/規制リスク
重要なポイント
$USDC
{spot}(USDCUSDT)
USDC(USDコイン)USDCは、Circle Internet Groupが発行する米ドル連動のステーブルコインです。USDTと同様に、価格をだいたい$1前後に保つことを目標としているため、一般的にはUSDCを買って価格の上昇(値上がり)を期待してはいけません。
2026年9月21日時点で、Circleは流通しているUSDCが約746億ドルであると報告しています。
USDCが注目される理由
1. 担保(準備金)構造
Circleによれば、USDCは非常に流動性の高い現金および現金同等物によって100%裏付けられています。準備金の大部分は、Circle Reserve Fund(サークル・リザーブ・ファンド)を通じて保有されています。同ファンドは、短期の米国債、オーバーナイトの国債レポ、現金を保有できる政府系マネーマーケットファンドです。
2. 透明性
Circleは、毎週の準備金開示を提供し、Big Four(大手監査法人)による毎月の第三者保証を受けていると述べています。これは、ステーブルコインのリスクを評価するうえで重要な要素です。
3. 取引・導入の拡大
Circleは、USDCの流通量が2026年Q2末時点で733億ドルに達し、前年同期比19%増となったと報告しました。一方、Q2のオンチェーン取引量は1480億ドル相当ではなく、14.8兆ドルに達し、前年同期比151%増でした。
4. 規制上の位置づけ
米国のGENIUS法(GENIUS Act)により、ステーブルコインのための連邦的な枠組みが整備されました。Circleは、USDCがその枠組みに適合するよう設計されていると述べ、規制された発行と準備金構造を重視しています。
USDCとUSDT
USDCUSDT目標$1$1発行体CircleTether主な用途ドルの流動性/決済ドルの流動性/取引準備金の透明性高高だが構造が異なる米国における規制上の位置づけ強いより複雑より大規模なエコシステム非常に大きい一般的により大きい価格上昇の可能性本質的にない本質的にない主なリスクCircle/規制/バンキングリスクTether/準備金/規制リスク
重要なポイント
$USDC
2026年9月21日時点で、Circleは流通しているUSDCが約746億ドルであると報告しています。
USDCが注目される理由
1. 担保(準備金)構造
Circleによれば、USDCは非常に流動性の高い現金および現金同等物によって100%裏付けられています。準備金の大部分は、Circle Reserve Fund(サークル・リザーブ・ファンド)を通じて保有されています。同ファンドは、短期の米国債、オーバーナイトの国債レポ、現金を保有できる政府系マネーマーケットファンドです。
2. 透明性
Circleは、毎週の準備金開示を提供し、Big Four(大手監査法人)による毎月の第三者保証を受けていると述べています。これは、ステーブルコインのリスクを評価するうえで重要な要素です。
3. 取引・導入の拡大
Circleは、USDCの流通量が2026年Q2末時点で733億ドルに達し、前年同期比19%増となったと報告しました。一方、Q2のオンチェーン取引量は1480億ドル相当ではなく、14.8兆ドルに達し、前年同期比151%増でした。
4. 規制上の位置づけ
米国のGENIUS法(GENIUS Act)により、ステーブルコインのための連邦的な枠組みが整備されました。Circleは、USDCがその枠組みに適合するよう設計されていると述べ、規制された発行と準備金構造を重視しています。
USDCとUSDT
USDCUSDT目標$1$1発行体CircleTether主な用途ドルの流動性/決済ドルの流動性/取引準備金の透明性高高だが構造が異なる米国における規制上の位置づけ強いより複雑より大規模なエコシステム非常に大きい一般的により大きい価格上昇の可能性本質的にない本質的にない主なリスクCircle/規制/バンキングリスクTether/準備金/規制リスク
重要なポイント
$USDC
翻訳参照
XRP analysis — September 26, 2026
XRP is currently around $1.55–$1.60. Recent trading has been stronger, with XRP testing the $1.60 resistance after recovering from the ~$1.00 area earlier in the year. FXStreet+1
Key levels
$1.50–$1.53: near-term support
$1.60: major immediate resistance
$1.65–$1.70: next resistance / recent high area
$2.00: major psychological resistance
$1.40: important downside level
$1.30–$1.35: deeper support area
A current technical report says XRP remains constructive above roughly $1.53, while another identifies $1.60 as a significant supply/resistance area. CryptoRank+1
What could move XRP
Positive factors
U.S.-listed spot XRP ETFs have recently recorded several consecutive days of inflows; one report put cumulative inflows at about $53M through Sept. 24. FXStreet
XRP's recovery from ~$1 toward $1.60 has restored bullish momentum.
XRP Ledger development and institutional adoption remain important longer-term factors. CoinDesk
Risks
Failure to break $1.60–$1.70 could result in another consolidation/pullback.
Crypto-wide volatility remains high.
There is an important debate about how much Ripple's business growth translates into actual XRP demand; Ripple CEO Brad Garlinghouse recently said stablecoins can be preferable for some payment use cases. 24/7 Wall St.
Simple chart view
Bullish scenario:
$1.53 → $1.60 → $1.70 → $2.00
Bearish scenario:
$1.53 ❌ → $1.40 → $1.30
The most important thing I'd watch right now is whether XRP can establish a daily close above $1.60 and then challenge $1.70. A rejection around $1.60 would make the $1.50/$1.40 levels more important.
If you want, I can also make you a visual XRP chart showing entry/support/resistance + bullish/bearish zones, similar to the picture you asked about earlier. $XRP
{spot}(XRPUSDT)
XRP analysis — September 26, 2026
XRP is currently around $1.55–$1.60. Recent trading has been stronger, with XRP testing the $1.60 resistance after recovering from the ~$1.00 area earlier in the year. FXStreet+1
Key levels
$1.50–$1.53: near-term support
$1.60: major immediate resistance
$1.65–$1.70: next resistance / recent high area
$2.00: major psychological resistance
$1.40: important downside level
$1.30–$1.35: deeper support area
A current technical report says XRP remains constructive above roughly $1.53, while another identifies $1.60 as a significant supply/resistance area. CryptoRank+1
What could move XRP
Positive factors
U.S.-listed spot XRP ETFs have recently recorded several consecutive days of inflows; one report put cumulative inflows at about $53M through Sept. 24. FXStreet
XRP's recovery from ~$1 toward $1.60 has restored bullish momentum.
XRP Ledger development and institutional adoption remain important longer-term factors. CoinDesk
Risks
Failure to break $1.60–$1.70 could result in another consolidation/pullback.
Crypto-wide volatility remains high.
There is an important debate about how much Ripple's business growth translates into actual XRP demand; Ripple CEO Brad Garlinghouse recently said stablecoins can be preferable for some payment use cases. 24/7 Wall St.
Simple chart view
Bullish scenario:
$1.53 → $1.60 → $1.70 → $2.00
Bearish scenario:
$1.53 ❌ → $1.40 → $1.30
The most important thing I'd watch right now is whether XRP can establish a daily close above $1.60 and then challenge $1.70. A rejection around $1.60 would make the $1.50/$1.40 levels more important.
If you want, I can also make you a visual XRP chart showing entry/support/resistance + bullish/bearish zones, similar to the picture you asked about earlier. $XRP
XRP is currently around $1.55–$1.60. Recent trading has been stronger, with XRP testing the $1.60 resistance after recovering from the ~$1.00 area earlier in the year. FXStreet+1
Key levels
$1.50–$1.53: near-term support
$1.60: major immediate resistance
$1.65–$1.70: next resistance / recent high area
$2.00: major psychological resistance
$1.40: important downside level
$1.30–$1.35: deeper support area
A current technical report says XRP remains constructive above roughly $1.53, while another identifies $1.60 as a significant supply/resistance area. CryptoRank+1
What could move XRP
Positive factors
U.S.-listed spot XRP ETFs have recently recorded several consecutive days of inflows; one report put cumulative inflows at about $53M through Sept. 24. FXStreet
XRP's recovery from ~$1 toward $1.60 has restored bullish momentum.
XRP Ledger development and institutional adoption remain important longer-term factors. CoinDesk
Risks
Failure to break $1.60–$1.70 could result in another consolidation/pullback.
Crypto-wide volatility remains high.
There is an important debate about how much Ripple's business growth translates into actual XRP demand; Ripple CEO Brad Garlinghouse recently said stablecoins can be preferable for some payment use cases. 24/7 Wall St.
Simple chart view
Bullish scenario:
$1.53 → $1.60 → $1.70 → $2.00
Bearish scenario:
$1.53 ❌ → $1.40 → $1.30
The most important thing I'd watch right now is whether XRP can establish a daily close above $1.60 and then challenge $1.70. A rejection around $1.60 would make the $1.50/$1.40 levels more important.
If you want, I can also make you a visual XRP chart showing entry/support/resistance + bullish/bearish zones, similar to the picture you asked about earlier. $XRP
2
「トランプ(TRUMP)」のことを指しているなら、Solanaベースのミームコイン:
現在価格:約$2.12
24時間:約+0.9%
7日:約+3.2%
30日:約−18.9%
1年:約−71.6%
史上最高値(ATH):2025年1月19日の$82 — つまりATHから約97.4%下の水準に留まっています。OKX
テクニカル分析
約$2.12の水準では、TRUMPは依然として非常に値動きの大きいミーム資産です。直近の7日間の回復は、はるかに大きい長期の下落と比べると相対的に控えめです。注目ポイントは以下です:
$2.00:重要な心理的サポート
$2.60〜$2.70:短期のレジスタンス帯
$3.00:主要な心理的節目
$3を上回る場合、その上昇をより納得感のあるものにするには、勢いに見合う大幅に強い出来高を伴う必要があります。
最大の論点:トークンのアンロック(放出)
これは特にTRUMPで重要です。トークンは最大供給量10億で、トークンは時間をかけて放出されます。2026年10月18日に予定されているアンロックでは、約2,870万TRUMPの放出(総供給の約2.9%、現在の時価総額の約3.8%)が見込まれています。Tokenomics.com+1
これにより供給圧力がかかる可能性はありますが、アンロックがあっても価格が自動的に下がるとは限りません。
私のシナリオ枠組み
シナリオ|注目するポイント|強気|$2を維持し、出来高の強い状態で$2.60〜$2.70をブレイク|中立|約$2〜約$2.60の範囲で推移|弱気|$2を割り込み、回復できない
TRUMPはBTC/ETHとは本質的に異なります。評価はネットワークのユーティリティではなく、ブランド、政治的な注目、コミュニティのセンチメント、そして投機に強く結び付いています。CoinDeskも、総供給の80%がトランプ関連の事業体に割り当てられ、アンロックのスケジュールに従うことに言及しています。CoinDesk
希望があれば、現在価格、時価総額、サポート/レジスタンス、そして2026年の想定シナリオを、TRUMP vs BTC vs ETH vs BNBで並べた分析もできます。$TRUMP
{spot}(TRUMPUSDT)
「トランプ(TRUMP)」のことを指しているなら、Solanaベースのミームコイン:
現在価格:約$2.12
24時間:約+0.9%
7日:約+3.2%
30日:約−18.9%
1年:約−71.6%
史上最高値(ATH):2025年1月19日の$82 — つまりATHから約97.4%下の水準に留まっています。OKX
テクニカル分析
約$2.12の水準では、TRUMPは依然として非常に値動きの大きいミーム資産です。直近の7日間の回復は、はるかに大きい長期の下落と比べると相対的に控えめです。注目ポイントは以下です:
$2.00:重要な心理的サポート
$2.60〜$2.70:短期のレジスタンス帯
$3.00:主要な心理的節目
$3を上回る場合、その上昇をより納得感のあるものにするには、勢いに見合う大幅に強い出来高を伴う必要があります。
最大の論点:トークンのアンロック(放出)
これは特にTRUMPで重要です。トークンは最大供給量10億で、トークンは時間をかけて放出されます。2026年10月18日に予定されているアンロックでは、約2,870万TRUMPの放出(総供給の約2.9%、現在の時価総額の約3.8%)が見込まれています。Tokenomics.com+1
これにより供給圧力がかかる可能性はありますが、アンロックがあっても価格が自動的に下がるとは限りません。
私のシナリオ枠組み
シナリオ|注目するポイント|強気|$2を維持し、出来高の強い状態で$2.60〜$2.70をブレイク|中立|約$2〜約$2.60の範囲で推移|弱気|$2を割り込み、回復できない
TRUMPはBTC/ETHとは本質的に異なります。評価はネットワークのユーティリティではなく、ブランド、政治的な注目、コミュニティのセンチメント、そして投機に強く結び付いています。CoinDeskも、総供給の80%がトランプ関連の事業体に割り当てられ、アンロックのスケジュールに従うことに言及しています。CoinDesk
希望があれば、現在価格、時価総額、サポート/レジスタンス、そして2026年の想定シナリオを、TRUMP vs BTC vs ETH vs BNBで並べた分析もできます。$TRUMP
現在価格:約$2.12
24時間:約+0.9%
7日:約+3.2%
30日:約−18.9%
1年:約−71.6%
史上最高値(ATH):2025年1月19日の$82 — つまりATHから約97.4%下の水準に留まっています。OKX
テクニカル分析
約$2.12の水準では、TRUMPは依然として非常に値動きの大きいミーム資産です。直近の7日間の回復は、はるかに大きい長期の下落と比べると相対的に控えめです。注目ポイントは以下です:
$2.00:重要な心理的サポート
$2.60〜$2.70:短期のレジスタンス帯
$3.00:主要な心理的節目
$3を上回る場合、その上昇をより納得感のあるものにするには、勢いに見合う大幅に強い出来高を伴う必要があります。
最大の論点:トークンのアンロック(放出)
これは特にTRUMPで重要です。トークンは最大供給量10億で、トークンは時間をかけて放出されます。2026年10月18日に予定されているアンロックでは、約2,870万TRUMPの放出(総供給の約2.9%、現在の時価総額の約3.8%)が見込まれています。Tokenomics.com+1
これにより供給圧力がかかる可能性はありますが、アンロックがあっても価格が自動的に下がるとは限りません。
私のシナリオ枠組み
シナリオ|注目するポイント|強気|$2を維持し、出来高の強い状態で$2.60〜$2.70をブレイク|中立|約$2〜約$2.60の範囲で推移|弱気|$2を割り込み、回復できない
TRUMPはBTC/ETHとは本質的に異なります。評価はネットワークのユーティリティではなく、ブランド、政治的な注目、コミュニティのセンチメント、そして投機に強く結び付いています。CoinDeskも、総供給の80%がトランプ関連の事業体に割り当てられ、アンロックのスケジュールに従うことに言及しています。CoinDesk
希望があれば、現在価格、時価総額、サポート/レジスタンス、そして2026年の想定シナリオを、TRUMP vs BTC vs ETH vs BNBで並べた分析もできます。$TRUMP
281
2026年9月26日時点のBTC、ETH、BNB。取引所によって価格がわずかに異なります。CoinMarketCapでは現在、BTCは約83,988ドル、ETHは約2,690ドル、BNBは約774.5ドルと表示されています。CoinMarketCap
現在の価格:BTC、ETH、BNB
2026年9月26日時点のCoinMarketCapに基づく概算のUSD価格。
BTCETHBNB
価格
BTC — ビットコイン
価格:約83,988ドル
7日:+3.47% CoinMarketCap
BTCは引き続き主要な市場の牽引役です。ビットコイン・ドミナンスはおよそ58.6%で、暗号資産の資金の大きな割合が依然としてBTCに集中しています。CoinMarketCap
直近で80,000ドルを上回った動きは前向きですが、BTCは過去の売りが出てくる可能性がある水準にも近づいています。
注目すべき重要ゾーン:心理的/サポートとしておおむね80,000ドル、すぐ上の上昇エリアとして85,000〜86,000ドル。
直近の高値を上回る状態が維持されれば、上方向の構造が強まります。80,000ドルを失うと、短期チャートはより脆弱になります。
ETH — イーサリアム
価格:約2,690ドル
7日:+2.53% CoinMarketCap
ETHには特に興味深いセットアップがあります。
ロイターによると、ETHは8月下旬の大きな上昇の後、約2,661.52ドル付近のテクニカル・レジスタンスを突破しました。彼らのテクニカル分析では、中間ゾーンとして約2,775〜2,825ドル、潜在的なテクニカル・ターゲットとして3,050ドルが示されており、さらに約2,560〜2,565ドルを下回るとセットアップが弱まると指摘しています。Reuters
そこで注目点は以下です:
2,560〜2,565ドル:重要な下値水準
2,775〜2,825ドル:次の主要なレジスタンス・エリア
約3,050ドル:モメンタムが続くなら、より大きなテクニカル目標
ETHは最近、より広範な暗号資産のリスクオン・ラリーにも強く参加しており、9月18日の動きでは約7.3%上昇しました。CoinDesk
BNB — BNB
価格:約774.5ドル
7日:+1.76% CoinMarketCap
BNBはETH/BTCとはやや異なる動きをしています:
依然として700ドルを上回っており、比較的よく踏みとどまっています。
7日間の上昇幅はBTCやETHより小さく、短期モメンタムがやや弱いことを示唆します。
サポートとして注目したいのは750〜760ドルです。
800ドルは明確な心理的レジスタンス水準です。 $BNB
{spot}(BNBUSDT)
$BTC
{spot}(BTCUSDT)
$ETH
{spot}(ETHUSDT)
2026年9月26日時点のBTC、ETH、BNB。取引所によって価格がわずかに異なります。CoinMarketCapでは現在、BTCは約83,988ドル、ETHは約2,690ドル、BNBは約774.5ドルと表示されています。CoinMarketCap
現在の価格:BTC、ETH、BNB
2026年9月26日時点のCoinMarketCapに基づく概算のUSD価格。
BTCETHBNB
価格
BTC — ビットコイン
価格:約83,988ドル
7日:+3.47% CoinMarketCap
BTCは引き続き主要な市場の牽引役です。ビットコイン・ドミナンスはおよそ58.6%で、暗号資産の資金の大きな割合が依然としてBTCに集中しています。CoinMarketCap
直近で80,000ドルを上回った動きは前向きですが、BTCは過去の売りが出てくる可能性がある水準にも近づいています。
注目すべき重要ゾーン:心理的/サポートとしておおむね80,000ドル、すぐ上の上昇エリアとして85,000〜86,000ドル。
直近の高値を上回る状態が維持されれば、上方向の構造が強まります。80,000ドルを失うと、短期チャートはより脆弱になります。
ETH — イーサリアム
価格:約2,690ドル
7日:+2.53% CoinMarketCap
ETHには特に興味深いセットアップがあります。
ロイターによると、ETHは8月下旬の大きな上昇の後、約2,661.52ドル付近のテクニカル・レジスタンスを突破しました。彼らのテクニカル分析では、中間ゾーンとして約2,775〜2,825ドル、潜在的なテクニカル・ターゲットとして3,050ドルが示されており、さらに約2,560〜2,565ドルを下回るとセットアップが弱まると指摘しています。Reuters
そこで注目点は以下です:
2,560〜2,565ドル:重要な下値水準
2,775〜2,825ドル:次の主要なレジスタンス・エリア
約3,050ドル:モメンタムが続くなら、より大きなテクニカル目標
ETHは最近、より広範な暗号資産のリスクオン・ラリーにも強く参加しており、9月18日の動きでは約7.3%上昇しました。CoinDesk
BNB — BNB
価格:約774.5ドル
7日:+1.76% CoinMarketCap
BNBはETH/BTCとはやや異なる動きをしています:
依然として700ドルを上回っており、比較的よく踏みとどまっています。
7日間の上昇幅はBTCやETHより小さく、短期モメンタムがやや弱いことを示唆します。
サポートとして注目したいのは750〜760ドルです。
800ドルは明確な心理的レジスタンス水準です。 $BNB
$BTC
$ETH
現在の価格:BTC、ETH、BNB
2026年9月26日時点のCoinMarketCapに基づく概算のUSD価格。
BTCETHBNB
価格
BTC — ビットコイン
価格:約83,988ドル
7日:+3.47% CoinMarketCap
BTCは引き続き主要な市場の牽引役です。ビットコイン・ドミナンスはおよそ58.6%で、暗号資産の資金の大きな割合が依然としてBTCに集中しています。CoinMarketCap
直近で80,000ドルを上回った動きは前向きですが、BTCは過去の売りが出てくる可能性がある水準にも近づいています。
注目すべき重要ゾーン:心理的/サポートとしておおむね80,000ドル、すぐ上の上昇エリアとして85,000〜86,000ドル。
直近の高値を上回る状態が維持されれば、上方向の構造が強まります。80,000ドルを失うと、短期チャートはより脆弱になります。
ETH — イーサリアム
価格:約2,690ドル
7日:+2.53% CoinMarketCap
ETHには特に興味深いセットアップがあります。
ロイターによると、ETHは8月下旬の大きな上昇の後、約2,661.52ドル付近のテクニカル・レジスタンスを突破しました。彼らのテクニカル分析では、中間ゾーンとして約2,775〜2,825ドル、潜在的なテクニカル・ターゲットとして3,050ドルが示されており、さらに約2,560〜2,565ドルを下回るとセットアップが弱まると指摘しています。Reuters
そこで注目点は以下です:
2,560〜2,565ドル:重要な下値水準
2,775〜2,825ドル:次の主要なレジスタンス・エリア
約3,050ドル:モメンタムが続くなら、より大きなテクニカル目標
ETHは最近、より広範な暗号資産のリスクオン・ラリーにも強く参加しており、9月18日の動きでは約7.3%上昇しました。CoinDesk
BNB — BNB
価格:約774.5ドル
7日:+1.76% CoinMarketCap
BNBはETH/BTCとはやや異なる動きをしています:
依然として700ドルを上回っており、比較的よく踏みとどまっています。
7日間の上昇幅はBTCやETHより小さく、短期モメンタムがやや弱いことを示唆します。
サポートとして注目したいのは750〜760ドルです。
800ドルは明確な心理的レジスタンス水準です。 $BNB
$BTC
$ETH
40
$BTC mid-autumn festival 彼女の家に行っていいの?ドアに入れる???
原文を見る
取引シェア リーダーボード · 1位
B
BTCUSDT
先物
10X
クローズ
実現損益(USDT)
+3,088,671.39
+169.40%
#PolymarketBankFailureBetsDrawFDICConcern #BlackRockBuildsTokenizedPortfoliosForOndo #BitwiseFilesToListNEARETFOnNYSEArca
$BTC mid-autumn festival 彼女の家に行っていいの?ドアに入れる???
原文を見る
取引シェア リーダーボード · 1位
B
BTCUSDT
先物
10X
クローズ
実現損益(USDT)
+3,088,671.39
+169.40%
#PolymarketBankFailureBetsDrawFDICConcern #BlackRockBuildsTokenizedPortfoliosForOndo #BitwiseFilesToListNEARETFOnNYSEArca
原文を見る
取引シェア リーダーボード · 1位
B
BTCUSDT
先物
10X
クローズ
実現損益(USDT)
+3,088,671.39
+169.40%
#PolymarketBankFailureBetsDrawFDICConcern #BlackRockBuildsTokenizedPortfoliosForOndo #BitwiseFilesToListNEARETFOnNYSEArca
1
1
252
$BNB
BNBは9月の高値付近の$807から下落した後、現在は$772〜$776あたりで取引されています。最近のデータでは、BNBは9月初めの約$683から強く上昇したものの、ここ数セッションで勢いが鈍化しています。OKX+1
抵抗線:$800〜$807
近いサポート:$760〜$770
より強いサポート:約$735〜$740
市場構造:依然として9月初旬の水準を上回っていますが、短期的なモメンタムは弱まっています。
重要なカタリスト:バイナンスのエコシステム活動は引き続き注目材料です。バイナンスは9月22日にCircleへの1億ドル投資を発表したとも伝えられています。ロイター
リスク:規制当局の監視が要因として残っており、ロイターは、バイナンスによる制裁違反の可能性をめぐって米国で調査が行われていると報じています。バイナンスは、制裁違反に対してゼロ・トレランスの方針だと述べています。ロイター
結論:BNBは現在、押し目/レンジ(調整)局面にあります。$760近辺を維持できれば直近の構造が保たれますが、$807を上回る持続的な動きがあれば、重要なテクニカル上の進展を示すことになります。これは市場分析であり、投資助言ではありません。
#BNB金铲子挖矿 #QNTRises39%
#BNBToken
$BNB
BNBは9月の高値付近の$807から下落した後、現在は$772〜$776あたりで取引されています。最近のデータでは、BNBは9月初めの約$683から強く上昇したものの、ここ数セッションで勢いが鈍化しています。OKX+1
抵抗線:$800〜$807
近いサポート:$760〜$770
より強いサポート:約$735〜$740
市場構造:依然として9月初旬の水準を上回っていますが、短期的なモメンタムは弱まっています。
重要なカタリスト:バイナンスのエコシステム活動は引き続き注目材料です。バイナンスは9月22日にCircleへの1億ドル投資を発表したとも伝えられています。ロイター
リスク:規制当局の監視が要因として残っており、ロイターは、バイナンスによる制裁違反の可能性をめぐって米国で調査が行われていると報じています。バイナンスは、制裁違反に対してゼロ・トレランスの方針だと述べています。ロイター
結論:BNBは現在、押し目/レンジ(調整)局面にあります。$760近辺を維持できれば直近の構造が保たれますが、$807を上回る持続的な動きがあれば、重要なテクニカル上の進展を示すことになります。これは市場分析であり、投資助言ではありません。
#BNB金铲子挖矿 #QNTRises39%
#BNBToken
BNBは9月の高値付近の$807から下落した後、現在は$772〜$776あたりで取引されています。最近のデータでは、BNBは9月初めの約$683から強く上昇したものの、ここ数セッションで勢いが鈍化しています。OKX+1
抵抗線:$800〜$807
近いサポート:$760〜$770
より強いサポート:約$735〜$740
市場構造:依然として9月初旬の水準を上回っていますが、短期的なモメンタムは弱まっています。
重要なカタリスト:バイナンスのエコシステム活動は引き続き注目材料です。バイナンスは9月22日にCircleへの1億ドル投資を発表したとも伝えられています。ロイター
リスク:規制当局の監視が要因として残っており、ロイターは、バイナンスによる制裁違反の可能性をめぐって米国で調査が行われていると報じています。バイナンスは、制裁違反に対してゼロ・トレランスの方針だと述べています。ロイター
結論:BNBは現在、押し目/レンジ(調整)局面にあります。$760近辺を維持できれば直近の構造が保たれますが、$807を上回る持続的な動きがあれば、重要なテクニカル上の進展を示すことになります。これは市場分析であり、投資助言ではありません。
#BNB金铲子挖矿 #QNTRises39%
#BNBToken
1
253
$ETH
$ETH は約2,690ドルで取引されており、24時間で約0.3%上昇、日次出来高は約148億ドルです。CoinMarketCap
トレンド: 短期的なモメンタムは良好です。Reutersによると、ETHは2,661ドルのレジスタンス帯を上抜け、テクニカル目標は約3,050ドル、モメンタムが続けば3,395~3,445ドルの可能性もあります。Reuters
主要サポート: 約2,626ドル、次いで約2,545ドルです。これらの水準を継続的に下回ると、現在のセットアップは弱まります。CoinMarketCap
レジスタンス: 2,775~2,825ドルが次の重要なゾーンです。これを超えると、3,050ドルがm
{spot}(ETHUSDT)
主要なテクニカル目標になります。
機関投資家の需要: 米国の現物ETH ETFは最近強い資金流入を記録しており、9月21日に2.7億ドル、9月22日に1.622億ドルが含まれます。farside.co.uk+1
要点: 現在のチャートは良好な構造を示していますが、2,775~2,825ドルは重要な試しどころです。約2,626ドルを上回っていれば、最近の強気構成は維持されます。その水準を失うと、下落リスクが高まります。
これは市場分析であり、予測や投資推奨ではありません。
$ETH #CoinMarketCapCompletesCoinglassAcquisition #SECSaysBuybacksUpgradesDontMakeTokenSecurity #CircleTetherFreezeBitgetHackerWallet
$ETH
$ETH は約2,690ドルで取引されており、24時間で約0.3%上昇、日次出来高は約148億ドルです。CoinMarketCap
トレンド: 短期的なモメンタムは良好です。Reutersによると、ETHは2,661ドルのレジスタンス帯を上抜け、テクニカル目標は約3,050ドル、モメンタムが続けば3,395~3,445ドルの可能性もあります。Reuters
主要サポート: 約2,626ドル、次いで約2,545ドルです。これらの水準を継続的に下回ると、現在のセットアップは弱まります。CoinMarketCap
レジスタンス: 2,775~2,825ドルが次の重要なゾーンです。これを超えると、3,050ドルがm
主要なテクニカル目標になります。
機関投資家の需要: 米国の現物ETH ETFは最近強い資金流入を記録しており、9月21日に2.7億ドル、9月22日に1.622億ドルが含まれます。farside.co.uk+1
要点: 現在のチャートは良好な構造を示していますが、2,775~2,825ドルは重要な試しどころです。約2,626ドルを上回っていれば、最近の強気構成は維持されます。その水準を失うと、下落リスクが高まります。
これは市場分析であり、予測や投資推奨ではありません。
$ETH #CoinMarketCapCompletesCoinglassAcquisition #SECSaysBuybacksUpgradesDontMakeTokenSecurity #CircleTetherFreezeBitgetHackerWallet
$ETH は約2,690ドルで取引されており、24時間で約0.3%上昇、日次出来高は約148億ドルです。CoinMarketCap
トレンド: 短期的なモメンタムは良好です。Reutersによると、ETHは2,661ドルのレジスタンス帯を上抜け、テクニカル目標は約3,050ドル、モメンタムが続けば3,395~3,445ドルの可能性もあります。Reuters
主要サポート: 約2,626ドル、次いで約2,545ドルです。これらの水準を継続的に下回ると、現在のセットアップは弱まります。CoinMarketCap
レジスタンス: 2,775~2,825ドルが次の重要なゾーンです。これを超えると、3,050ドルがm
主要なテクニカル目標になります。
機関投資家の需要: 米国の現物ETH ETFは最近強い資金流入を記録しており、9月21日に2.7億ドル、9月22日に1.622億ドルが含まれます。farside.co.uk+1
要点: 現在のチャートは良好な構造を示していますが、2,775~2,825ドルは重要な試しどころです。約2,626ドルを上回っていれば、最近の強気構成は維持されます。その水準を失うと、下落リスクが高まります。
これは市場分析であり、予測や投資推奨ではありません。
$ETH #CoinMarketCapCompletesCoinglassAcquisition #SECSaysBuybacksUpgradesDontMakeTokenSecurity #CircleTetherFreezeBitgetHackerWallet
106
ログインして、さらにコンテンツを読む
厳選トピックで世界の暗号資産トレーダーの仲間入り
⚡️ 暗号資産に関する最新かつ有益な情報が見つかります。
💬 世界最大の暗号資産取引所から信頼されています。
👍 認証を受けたクリエイターから、有益なインサイトを得られます。
メール / 電話番号
トレンドトピック
CircleMints500MUSDCOnSolana
閲覧回数 101,151
2,200人が討論中
#circlemints500musdconsolana
🚨 ソラナ上でUSDCが5億MINT!💵🔥
Circleのトレジャリーがソラナ上で5億USDCを新規発行し、全世界の総供給量を752億ドルまで押し上げました!📈✨
💡 すぐに現実を確認:
🔹 ミント=新しい在庫(フレッシュな供給)の作成(即時の購買力ではありません!🛒
🔹 真の引き金=DeFi・取引所・各種プールへの資本投入!🌐🚀
🎯 注目コイン:
⚡ $SOL — ネットワーク活動が活況で、フレッシュな流動性がエコシステムの成長をさらに後押ししています!
💎 $RARE — 高ボラティリティなアルトコインで、新しい市場の流動性やセンチメントに素早く反応します!🪐
💥 あなたは今積み増し中ですか?それとも資本投入が完了するのを待っていますか?下にあなたの考えをコメントしてください!👇✨
#CircleMints500MUSDCOnSolana
#PolymarketBankFailureBetsDrawFDICConcern
#BlackRockBuildsTokenizedPortfoliosForOndo
#BitwiseFilesToListNEARETFOnNYSEArca
Hifza Rubab
·いいね:4件
·閲覧回数 4.6k
PolymarketBankFailureBetsDrawFDICConcern
閲覧回数 98,973
1,923人が討論中
BlackRockBuildsTokenizedPortfoliosForOndo
閲覧回数 92,976
1,371人が討論中