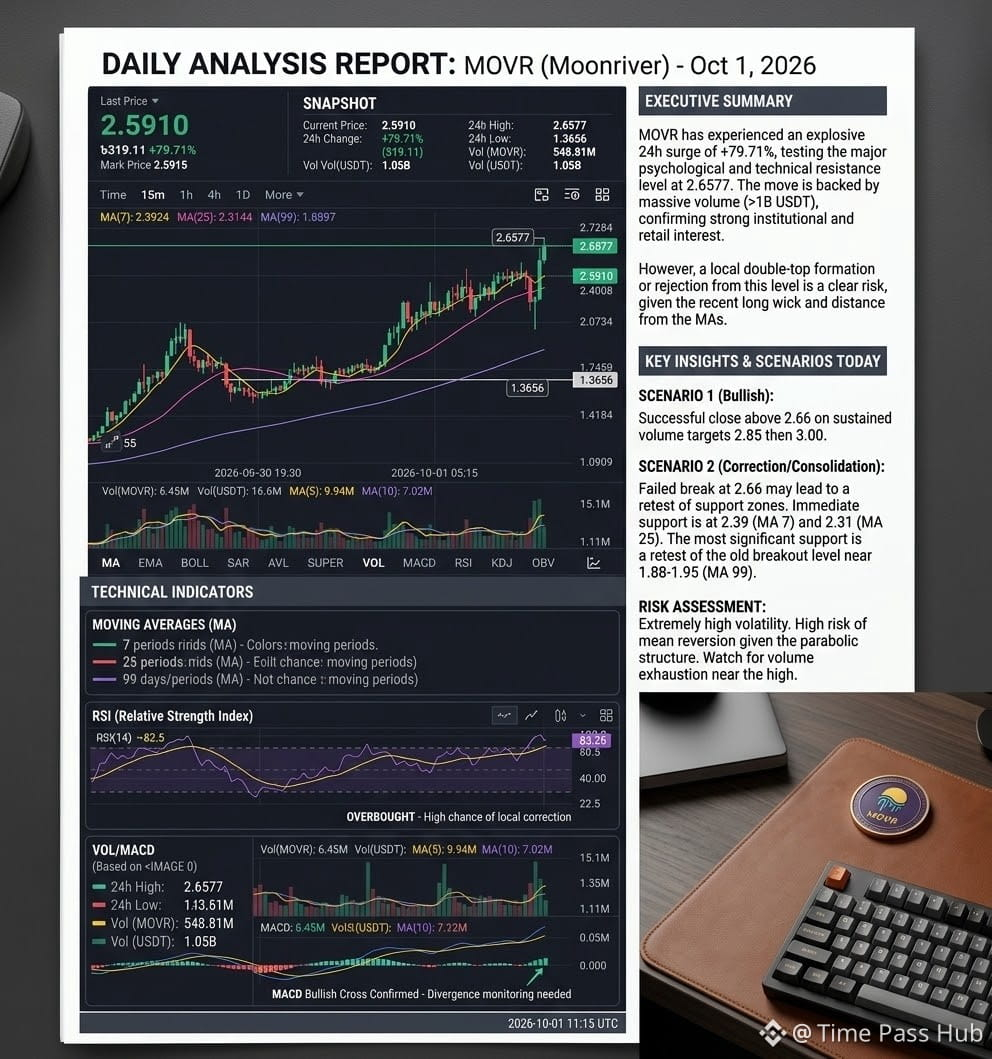
$MOVR /USDT is currently in a strong bullish impulse on the 15-minute timeframe, but it is showing signs of high volatility near its local peak.
1. Key Technical Indicators (from Chart)
* Current Price: $2.5910 (+79.71% in 24 hours).
* 24-Hour High / Low: High of $2.6577 and Low of $1.3656.
* Moving Averages (MA):
* MA(7) - Yellow: $2.3924 — acts as immediate dynamic short-term support.
* MA(25) - Pink: $2.3144 — provides secondary medium-term support.
* MA(99) - Purple: $1.8897 — confirms a strong underlying macro uptrend.$MOVR
* Volume: Spike in 24h volume (1.05B USDT / 548.81M MOVR), confirming intense market participation and volatile price expansion.
2. Market Structure & Trend Breakdown
* Bullish Alignment: Price is trading above MA(7), MA(25), and MA(99), reflecting a clear short-term uptrend on smaller timeframes.
* Rejection at Highs: The price reached a peak at $2.6577 before facing minor rejection, creating potential overhead resistance in the $2.60–$2.66 zone.
* Volatile Pullbacks: Notice the sharp lower wick near the right edge down toward $2.0734. This indicates massive liquidity grabbing and fast-buying response from dip-buyers.
3. Actionable Scenarios
* Bullish Continuation (Breakout):
* Trigger: A candle closure above $2.6577 on elevated volume.
* Target: Next liquidity pools toward $2.85 – $3.00.
* Pullback / Retest (Buying Zone):
* Ideal Entry Area: Waiting for a retest near $2.31 – $2.39 (MA(7) and MA(25) convergence) reduces risk compared to buying directly at the peak.
* Invalidation / Stop Loss: A breakdown below $2.07 signals weakness and potential trend reversal toward $1.88 (MA 99).
#movr #Binance #analysis #MarketAnalysis #Write2Earn $MOVR
1. Key Technical Indicators (from Chart)
* Current Price: $2.5910 (+79.71% in 24 hours).
* 24-Hour High / Low: High of $2.6577 and Low of $1.3656.
* Moving Averages (MA):
* MA(7) - Yellow: $2.3924 — acts as immediate dynamic short-term support.
* MA(25) - Pink: $2.3144 — provides secondary medium-term support.
* MA(99) - Purple: $1.8897 — confirms a strong underlying macro uptrend.$MOVR
* Volume: Spike in 24h volume (1.05B USDT / 548.81M MOVR), confirming intense market participation and volatile price expansion.
2. Market Structure & Trend Breakdown
* Bullish Alignment: Price is trading above MA(7), MA(25), and MA(99), reflecting a clear short-term uptrend on smaller timeframes.
* Rejection at Highs: The price reached a peak at $2.6577 before facing minor rejection, creating potential overhead resistance in the $2.60–$2.66 zone.
* Volatile Pullbacks: Notice the sharp lower wick near the right edge down toward $2.0734. This indicates massive liquidity grabbing and fast-buying response from dip-buyers.
3. Actionable Scenarios
* Bullish Continuation (Breakout):
* Trigger: A candle closure above $2.6577 on elevated volume.
* Target: Next liquidity pools toward $2.85 – $3.00.
* Pullback / Retest (Buying Zone):
* Ideal Entry Area: Waiting for a retest near $2.31 – $2.39 (MA(7) and MA(25) convergence) reduces risk compared to buying directly at the peak.
* Invalidation / Stop Loss: A breakdown below $2.07 signals weakness and potential trend reversal toward $1.88 (MA 99).
#movr #Binance #analysis #MarketAnalysis #Write2Earn $MOVR