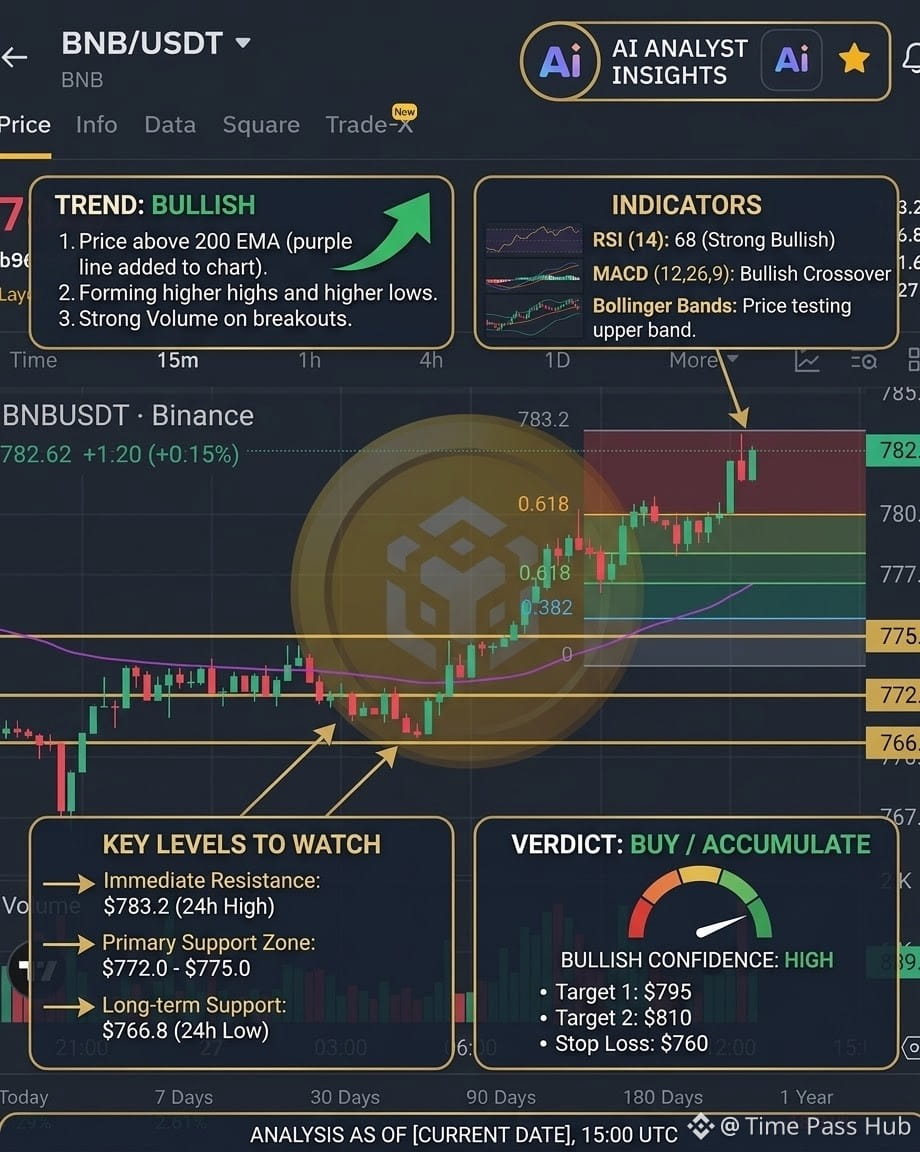
$BNB is showing a strong bullish continuation pattern on the short-term timeframe.
Here is a detailed breakdown based on the provided $BNB /USDT 15-minute chart and market performance:
1. Price Action & Trend
* Current Price: $782.61 (Up +1.11% in the last 24 hours).
* Structure: Highs and lows are steadily sloping upward, indicating clear bullish momentum over the 15m period.
* Breakout Attempt: BNB recently broke out above its previous local consolidation range ($780.00) and peaked near the 24h high of $783.20.
2. Key Support & Resistance Levels
| Type | Price Level | Significance |
|---|---|---|
| Immediate Resistance | $783.20 – $785.00 | Today's 24h peak; clearing this zone opens room toward $790+. |
| Immediate Support | $780.00 | Former resistance turned support during the recent breakout. |
| Key Support Zone | $772.00 – $775.00 | Major demand area where buyers repeatedly stepped in earlier. |
| 24-Hour Low | $766.80 | Critical safety zone for long positions. |
3. Volume Analysis
* The recent upward push to $783 was accompanied by a noticeable volume spike (green volume bar), confirming active buying pressure.
* The slight pullback candle near $782.60 shows moderate profit-taking, but overall buying volume remains solid.
4. Trading Outlook
* Bullish Scenario: A sustained 15-minute candle close above $783.50 with high volume could push the price toward $790.00 – $795.00.
* Pullback Scenario: If resistance holds at $783, look for a retest around $778.00 – $780.00 for potential entry opportunities if support holds.
* Invalidation: A breakdown below $772.00 invalidates the immediate bullish structure and opens downside risk to $766.80.
#bnb #BNBAnalysis #analysis #MarketAnalysis #TradingSignal
$BNB
Here is a detailed breakdown based on the provided $BNB /USDT 15-minute chart and market performance:
1. Price Action & Trend
* Current Price: $782.61 (Up +1.11% in the last 24 hours).
* Structure: Highs and lows are steadily sloping upward, indicating clear bullish momentum over the 15m period.
* Breakout Attempt: BNB recently broke out above its previous local consolidation range ($780.00) and peaked near the 24h high of $783.20.
2. Key Support & Resistance Levels
| Type | Price Level | Significance |
|---|---|---|
| Immediate Resistance | $783.20 – $785.00 | Today's 24h peak; clearing this zone opens room toward $790+. |
| Immediate Support | $780.00 | Former resistance turned support during the recent breakout. |
| Key Support Zone | $772.00 – $775.00 | Major demand area where buyers repeatedly stepped in earlier. |
| 24-Hour Low | $766.80 | Critical safety zone for long positions. |
3. Volume Analysis
* The recent upward push to $783 was accompanied by a noticeable volume spike (green volume bar), confirming active buying pressure.
* The slight pullback candle near $782.60 shows moderate profit-taking, but overall buying volume remains solid.
4. Trading Outlook
* Bullish Scenario: A sustained 15-minute candle close above $783.50 with high volume could push the price toward $790.00 – $795.00.
* Pullback Scenario: If resistance holds at $783, look for a retest around $778.00 – $780.00 for potential entry opportunities if support holds.
* Invalidation: A breakdown below $772.00 invalidates the immediate bullish structure and opens downside risk to $766.80.
#bnb #BNBAnalysis #analysis #MarketAnalysis #TradingSignal
$BNB