
#liquidationmap
liquidationmap
閲覧回数 397,305
815人が討論中
注目
最新

🚨 ビットコイン(BTC)清算マップの更新
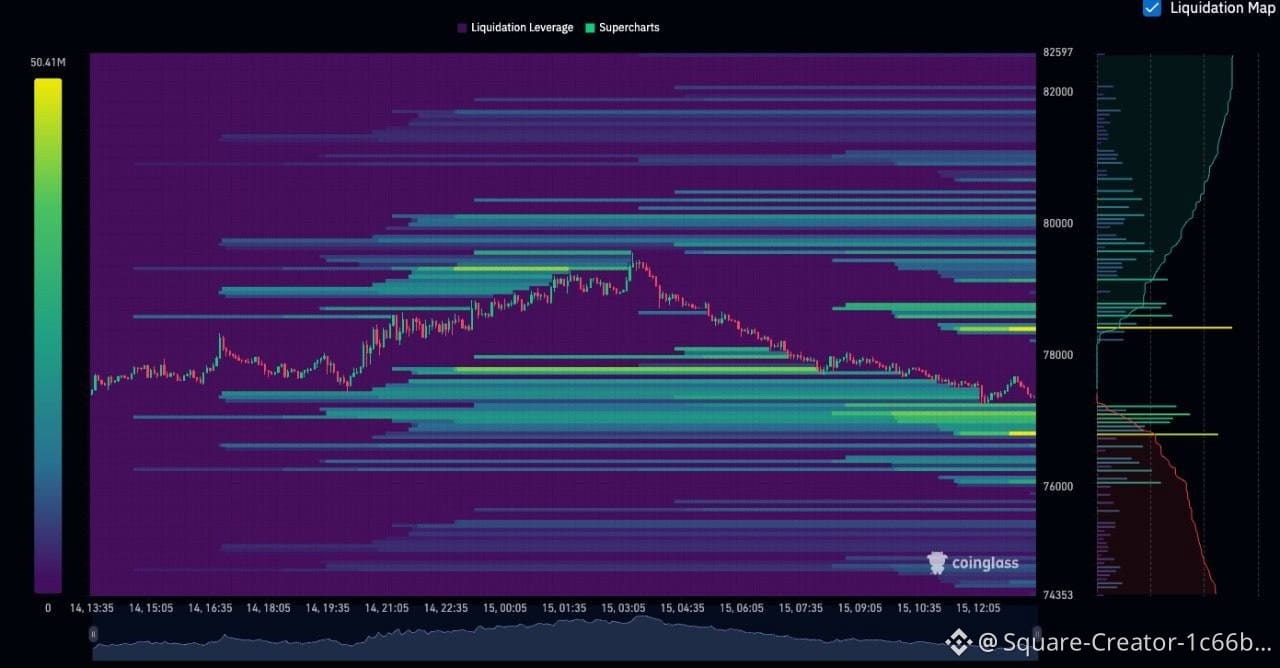
ビットコインは現在、77,000ドル付近で取引されており、価格の両側に流動性が明確に集中しています。
🔼 上昇方向の流動性 • 78,800 – 79,500ドル:強い流動性の塊
• 80,000ドルを上回ると:さらに高い価格帯の追加流動性
🔽 下落方向の流動性 • 76,500 – 77,000ドル:近くて重要な流動性ゾーン
• 75,000 – 76,000ドル:より深い流動性ゾーン
📌 軸となる水準:BTCは上側の流動性へ向かう可能性のある動きを支えるために、78,000ドルの水準を取り戻す必要があります。もし76,500ドルが割れれば、価格が次の下側の流動性エリアをテストしに向かう可能性が高まるかもしれません。
⚠️ 清算マップは、価格の方向性を保証するものではなく、流動性が集まる可能性のある領域を示しています。いかなる判断をする前に、出来高、モメンタム、そして市場全体の動きを確認してください。
$BTC
{future}(BTCUSDT)
#BTC #Bitcoin #LiquidationMap #Crypto #CryptoTrading #تحليل_فني #ビットコイン #デジタル資産 #トレード #暗号資産市場
🚨 ビットコイン(BTC)清算マップの更新
ビットコインは現在、77,000ドル付近で取引されており、価格の両側に流動性が明確に集中しています。
🔼 上昇方向の流動性 • 78,800 – 79,500ドル:強い流動性の塊
• 80,000ドルを上回ると:さらに高い価格帯の追加流動性
🔽 下落方向の流動性 • 76,500 – 77,000ドル:近くて重要な流動性ゾーン
• 75,000 – 76,000ドル:より深い流動性ゾーン
📌 軸となる水準:BTCは上側の流動性へ向かう可能性のある動きを支えるために、78,000ドルの水準を取り戻す必要があります。もし76,500ドルが割れれば、価格が次の下側の流動性エリアをテストしに向かう可能性が高まるかもしれません。
⚠️ 清算マップは、価格の方向性を保証するものではなく、流動性が集まる可能性のある領域を示しています。いかなる判断をする前に、出来高、モメンタム、そして市場全体の動きを確認してください。
$BTC
#BTC #Bitcoin #LiquidationMap #Crypto #CryptoTrading #تحليل_فني #ビットコイン #デジタル資産 #トレード #暗号資産市場
ビットコインは現在、77,000ドル付近で取引されており、価格の両側に流動性が明確に集中しています。
🔼 上昇方向の流動性 • 78,800 – 79,500ドル:強い流動性の塊
• 80,000ドルを上回ると:さらに高い価格帯の追加流動性
🔽 下落方向の流動性 • 76,500 – 77,000ドル:近くて重要な流動性ゾーン
• 75,000 – 76,000ドル:より深い流動性ゾーン
📌 軸となる水準:BTCは上側の流動性へ向かう可能性のある動きを支えるために、78,000ドルの水準を取り戻す必要があります。もし76,500ドルが割れれば、価格が次の下側の流動性エリアをテストしに向かう可能性が高まるかもしれません。
⚠️ 清算マップは、価格の方向性を保証するものではなく、流動性が集まる可能性のある領域を示しています。いかなる判断をする前に、出来高、モメンタム、そして市場全体の動きを確認してください。
$BTC
#BTC #Bitcoin #LiquidationMap #Crypto #CryptoTrading #تحليل_فني #ビットコイン #デジタル資産 #トレード #暗号資産市場
93

·
--
ブリッシュ
翻訳参照
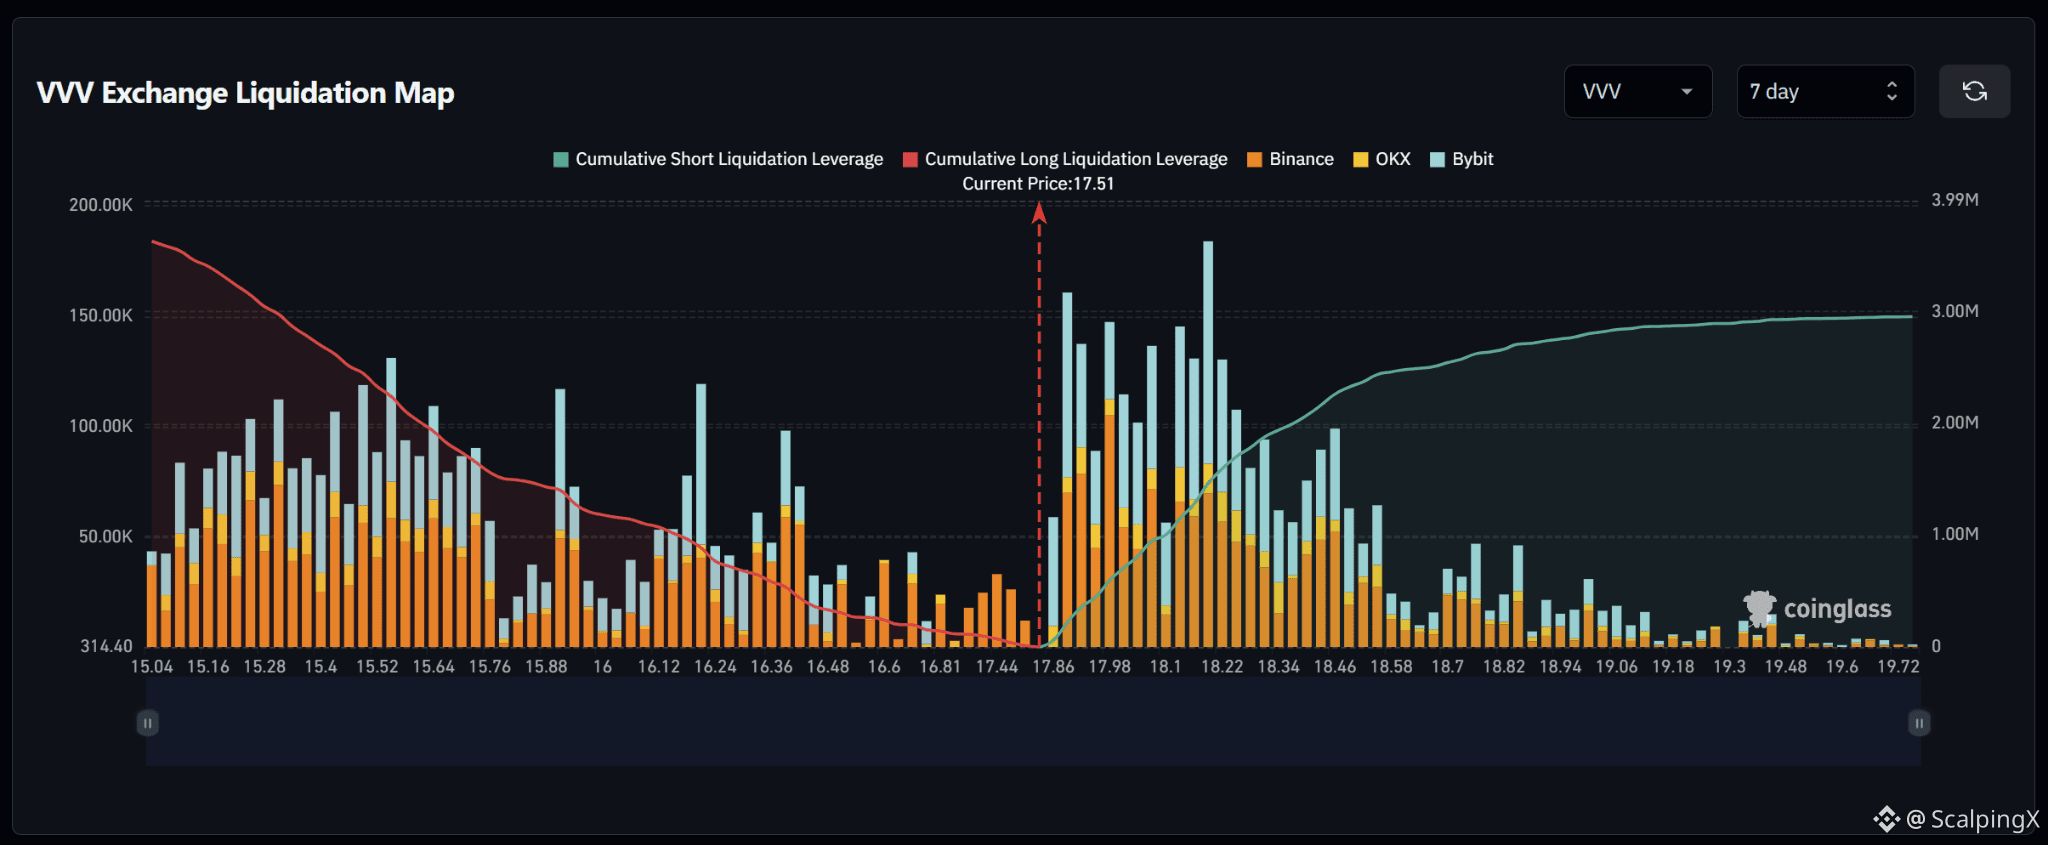
$VVV – Liquidation Map (7 Days) – Current Price 17.51
🔎 The 7-day liquidation map shows roughly $3.6 million in long liquidations below the current price, exceeding approximately $3.0 million in short liquidations above. The liquidity structure is therefore fairly balanced but modestly tilted to the downside, with around 1.2 times more cumulative liquidity below the market.
📉 Below the market, nearby long-liquidation liquidity remains relatively thin around 17.44–16.81 before increasing across 16.60–16.24. Notable clusters appear around 16.36 and 16.24, while liquidity becomes much denser further down across 15.88–15.28. Losing 17.44 would shift attention toward 16.81–16.60.
📈 Above the market, short-liquidation liquidity begins rising sharply from 17.86 and becomes dense across 17.98–18.34. The strongest cluster sits around 18.18–18.22, where the liquidation bar approaches $185,000, while 17.86–18.10 and 18.34–18.46 also contain notable liquidity.
🧭 The broader setup modestly favors the downside because long-liquidation exposure below is larger. Losing 17.44 would increase the probability of a sweep toward 16.81–16.60, while breaking above 17.86 would shift attention toward 17.98–18.22.
#LiquidationMap
$VVV – Liquidation Map (7 Days) – Current Price 17.51
🔎 The 7-day liquidation map shows roughly $3.6 million in long liquidations below the current price, exceeding approximately $3.0 million in short liquidations above. The liquidity structure is therefore fairly balanced but modestly tilted to the downside, with around 1.2 times more cumulative liquidity below the market.
📉 Below the market, nearby long-liquidation liquidity remains relatively thin around 17.44–16.81 before increasing across 16.60–16.24. Notable clusters appear around 16.36 and 16.24, while liquidity becomes much denser further down across 15.88–15.28. Losing 17.44 would shift attention toward 16.81–16.60.
📈 Above the market, short-liquidation liquidity begins rising sharply from 17.86 and becomes dense across 17.98–18.34. The strongest cluster sits around 18.18–18.22, where the liquidation bar approaches $185,000, while 17.86–18.10 and 18.34–18.46 also contain notable liquidity.
🧭 The broader setup modestly favors the downside because long-liquidation exposure below is larger. Losing 17.44 would increase the probability of a sweep toward 16.81–16.60, while breaking above 17.86 would shift attention toward 17.98–18.22.
#LiquidationMap
🔎 The 7-day liquidation map shows roughly $3.6 million in long liquidations below the current price, exceeding approximately $3.0 million in short liquidations above. The liquidity structure is therefore fairly balanced but modestly tilted to the downside, with around 1.2 times more cumulative liquidity below the market.
📉 Below the market, nearby long-liquidation liquidity remains relatively thin around 17.44–16.81 before increasing across 16.60–16.24. Notable clusters appear around 16.36 and 16.24, while liquidity becomes much denser further down across 15.88–15.28. Losing 17.44 would shift attention toward 16.81–16.60.
📈 Above the market, short-liquidation liquidity begins rising sharply from 17.86 and becomes dense across 17.98–18.34. The strongest cluster sits around 18.18–18.22, where the liquidation bar approaches $185,000, while 17.86–18.10 and 18.34–18.46 also contain notable liquidity.
🧭 The broader setup modestly favors the downside because long-liquidation exposure below is larger. Losing 17.44 would increase the probability of a sweep toward 16.81–16.60, while breaking above 17.86 would shift attention toward 17.98–18.22.
#LiquidationMap
88
·
--
ブリッシュ
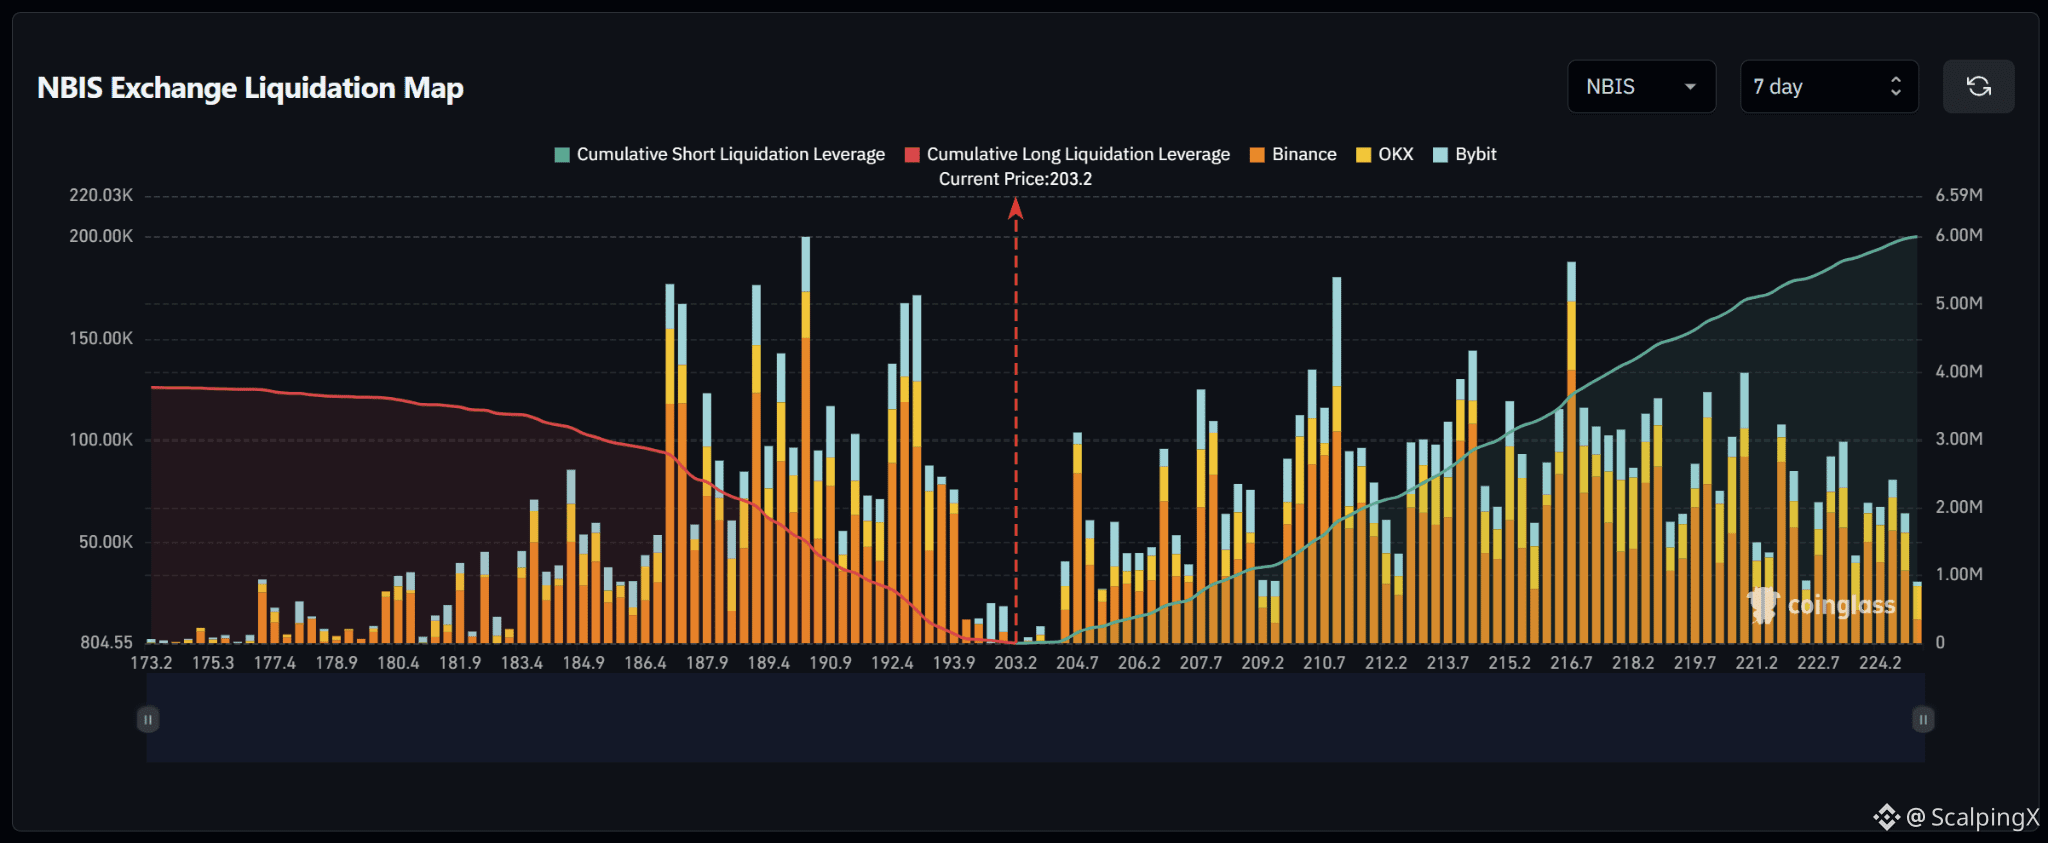
$NBIS – 清算マップ(7日)– 現在価格 203.2
🔎 7日間の清算マップは、現在価格を上回る領域で約600万ドルのショート清算を示しており、下回るロング清算は約400万ドルを超えています。したがって流動性構造は上方向に有利で、市場より上の累積流動性はおよそ1.5倍です。
📉 市場の下では、193.9〜192.4付近の近距離ロング清算の流動性は比較的薄く、その後190.9〜186.4で急激に増加します。最も強いクラスターは190と187付近にあり、いくつかのバーはおよそ15万〜20万ドルに達しています。193.9を失うと、注目は192.4〜190.9へ移ります。
📈 市場の上では、ショート清算の流動性が204.7から構築され始め、207.7〜212.2にかけて増加します。特筆すべきクラスターは210.7付近で、ほぼ18万ドルに到達しています。さらに外側では、213.7〜218.2の範囲で流動性が密で、216.7の領域が約19万ドル付近で目立ちます。
🧭 より広い状況では、上方向が有利です。上側にあるショート清算エクスポージャーはおよそ1.5倍と大きいためです。204.7をブレイクすれば、207.7〜212.2に向けたスイープの確率が高まります。一方で193.9を失うと、注目は192.4〜190.9へ移ります。
#LiquidationMap
$NBIS – 清算マップ(7日)– 現在価格 203.2
🔎 7日間の清算マップは、現在価格を上回る領域で約600万ドルのショート清算を示しており、下回るロング清算は約400万ドルを超えています。したがって流動性構造は上方向に有利で、市場より上の累積流動性はおよそ1.5倍です。
📉 市場の下では、193.9〜192.4付近の近距離ロング清算の流動性は比較的薄く、その後190.9〜186.4で急激に増加します。最も強いクラスターは190と187付近にあり、いくつかのバーはおよそ15万〜20万ドルに達しています。193.9を失うと、注目は192.4〜190.9へ移ります。
📈 市場の上では、ショート清算の流動性が204.7から構築され始め、207.7〜212.2にかけて増加します。特筆すべきクラスターは210.7付近で、ほぼ18万ドルに到達しています。さらに外側では、213.7〜218.2の範囲で流動性が密で、216.7の領域が約19万ドル付近で目立ちます。
🧭 より広い状況では、上方向が有利です。上側にあるショート清算エクスポージャーはおよそ1.5倍と大きいためです。204.7をブレイクすれば、207.7〜212.2に向けたスイープの確率が高まります。一方で193.9を失うと、注目は192.4〜190.9へ移ります。
#LiquidationMap
🔎 7日間の清算マップは、現在価格を上回る領域で約600万ドルのショート清算を示しており、下回るロング清算は約400万ドルを超えています。したがって流動性構造は上方向に有利で、市場より上の累積流動性はおよそ1.5倍です。
📉 市場の下では、193.9〜192.4付近の近距離ロング清算の流動性は比較的薄く、その後190.9〜186.4で急激に増加します。最も強いクラスターは190と187付近にあり、いくつかのバーはおよそ15万〜20万ドルに達しています。193.9を失うと、注目は192.4〜190.9へ移ります。
📈 市場の上では、ショート清算の流動性が204.7から構築され始め、207.7〜212.2にかけて増加します。特筆すべきクラスターは210.7付近で、ほぼ18万ドルに到達しています。さらに外側では、213.7〜218.2の範囲で流動性が密で、216.7の領域が約19万ドル付近で目立ちます。
🧭 より広い状況では、上方向が有利です。上側にあるショート清算エクスポージャーはおよそ1.5倍と大きいためです。204.7をブレイクすれば、207.7〜212.2に向けたスイープの確率が高まります。一方で193.9を失うと、注目は192.4〜190.9へ移ります。
#LiquidationMap
19
·
--
ブリッシュ
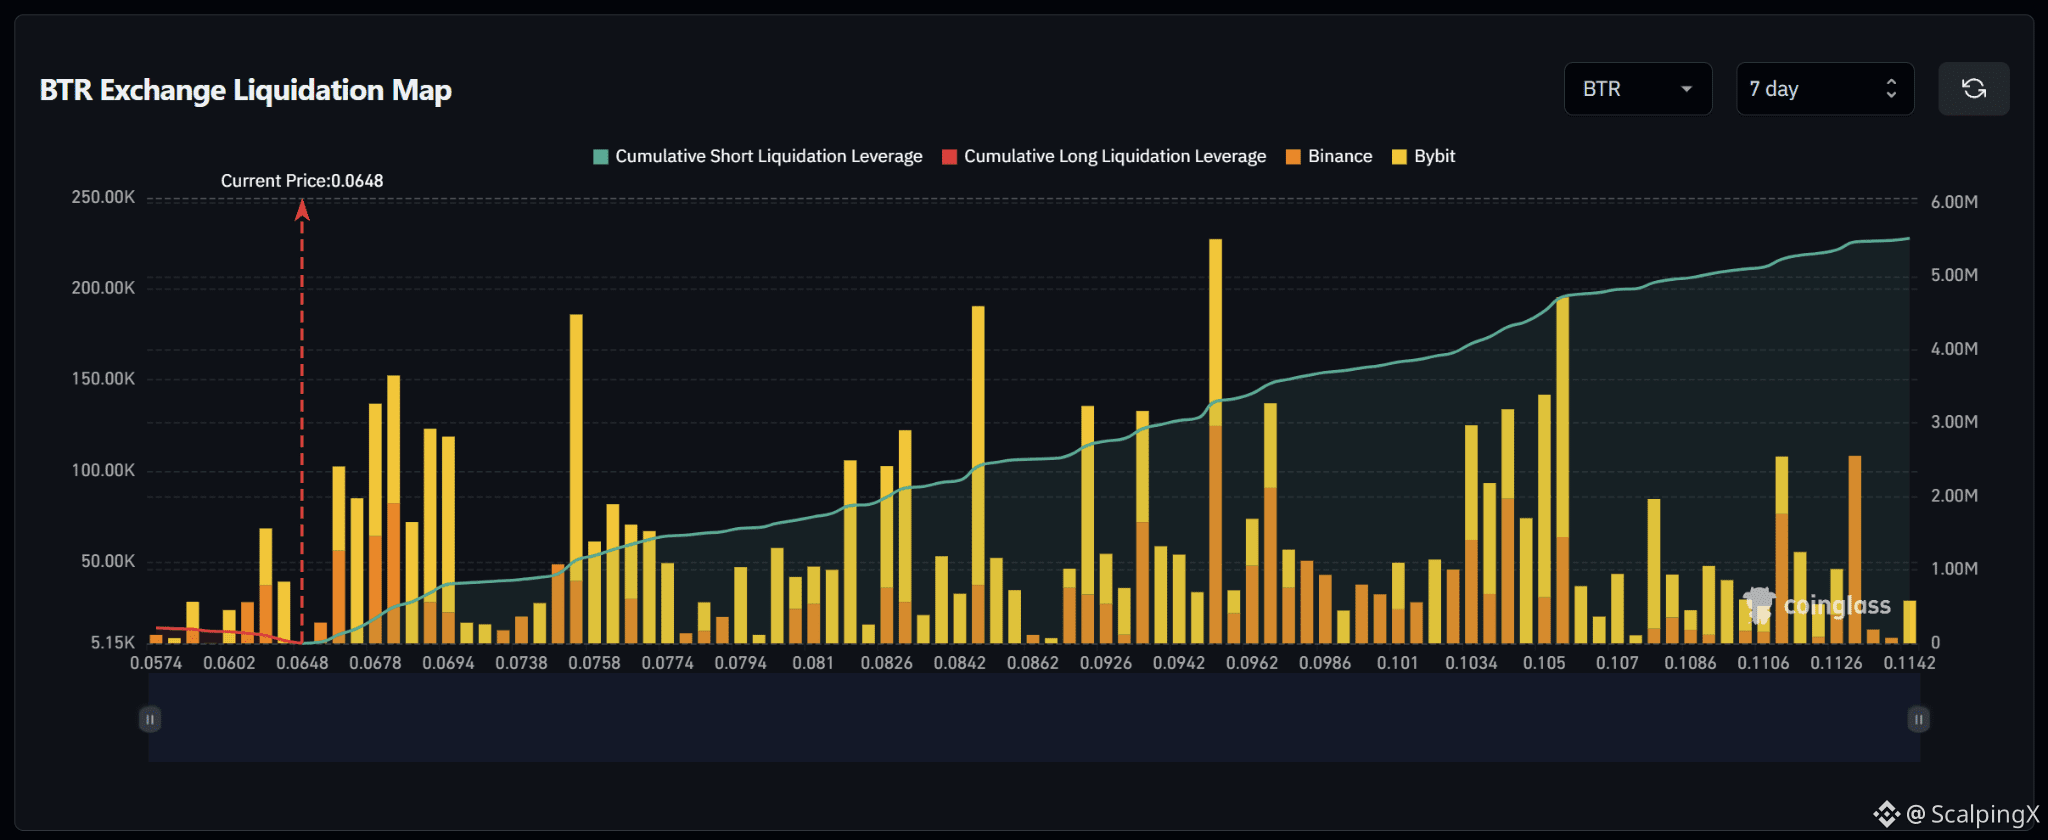
$BTR – 清算マップ(7日間) – 現在価格 0.0648
🔎 7日間の清算マップでは、現在価格の上方に約540万~550万ドル相当のショート清算があり、一方で価格が表示範囲の下端付近にあるため、下方のロング清算エクスポージャーはほぼ無視できる水準です。したがって、流動性構造は明確に上昇方向を有利にしています。
📉 マーケット下では、残っているロング清算流動性は比較的薄く、主に0.0602~0.0574付近にあります。現在価格のすぐ下に大きな清算クラスターはなく、表示範囲内での下方向の流動性への引力は限定的であることを示唆しています。
📈 マーケット上では、ショート清算流動性が0.0678~0.0694付近からすぐに積み上がり始め、その後0.0758、0.0842、特に0.094~0.096付近にいくつかの大きなクラスターが続きます。さらに上では、0.1034~0.105が約14万~19.5万ドルのバーで目立ち、0.1126にも注目すべきクラスターがあります。
🧭 より広い構図では、重要な清算流動性のほぼすべてが市場の上方に位置しているため、上昇方向が強く有利です。0.0678を上抜けると、0.0694~0.0758へのスイープ確率が高まり、勢いが続けば0.0842と0.094~0.096が次の注目すべき流動性ゾーンになります。
#LiquidationMap
$BTR – 清算マップ(7日間) – 現在価格 0.0648
🔎 7日間の清算マップでは、現在価格の上方に約540万~550万ドル相当のショート清算があり、一方で価格が表示範囲の下端付近にあるため、下方のロング清算エクスポージャーはほぼ無視できる水準です。したがって、流動性構造は明確に上昇方向を有利にしています。
📉 マーケット下では、残っているロング清算流動性は比較的薄く、主に0.0602~0.0574付近にあります。現在価格のすぐ下に大きな清算クラスターはなく、表示範囲内での下方向の流動性への引力は限定的であることを示唆しています。
📈 マーケット上では、ショート清算流動性が0.0678~0.0694付近からすぐに積み上がり始め、その後0.0758、0.0842、特に0.094~0.096付近にいくつかの大きなクラスターが続きます。さらに上では、0.1034~0.105が約14万~19.5万ドルのバーで目立ち、0.1126にも注目すべきクラスターがあります。
🧭 より広い構図では、重要な清算流動性のほぼすべてが市場の上方に位置しているため、上昇方向が強く有利です。0.0678を上抜けると、0.0694~0.0758へのスイープ確率が高まり、勢いが続けば0.0842と0.094~0.096が次の注目すべき流動性ゾーンになります。
#LiquidationMap
🔎 7日間の清算マップでは、現在価格の上方に約540万~550万ドル相当のショート清算があり、一方で価格が表示範囲の下端付近にあるため、下方のロング清算エクスポージャーはほぼ無視できる水準です。したがって、流動性構造は明確に上昇方向を有利にしています。
📉 マーケット下では、残っているロング清算流動性は比較的薄く、主に0.0602~0.0574付近にあります。現在価格のすぐ下に大きな清算クラスターはなく、表示範囲内での下方向の流動性への引力は限定的であることを示唆しています。
📈 マーケット上では、ショート清算流動性が0.0678~0.0694付近からすぐに積み上がり始め、その後0.0758、0.0842、特に0.094~0.096付近にいくつかの大きなクラスターが続きます。さらに上では、0.1034~0.105が約14万~19.5万ドルのバーで目立ち、0.1126にも注目すべきクラスターがあります。
🧭 より広い構図では、重要な清算流動性のほぼすべてが市場の上方に位置しているため、上昇方向が強く有利です。0.0678を上抜けると、0.0694~0.0758へのスイープ確率が高まり、勢いが続けば0.0842と0.094~0.096が次の注目すべき流動性ゾーンになります。
#LiquidationMap
41
·
--
ブリッシュ
翻訳参照
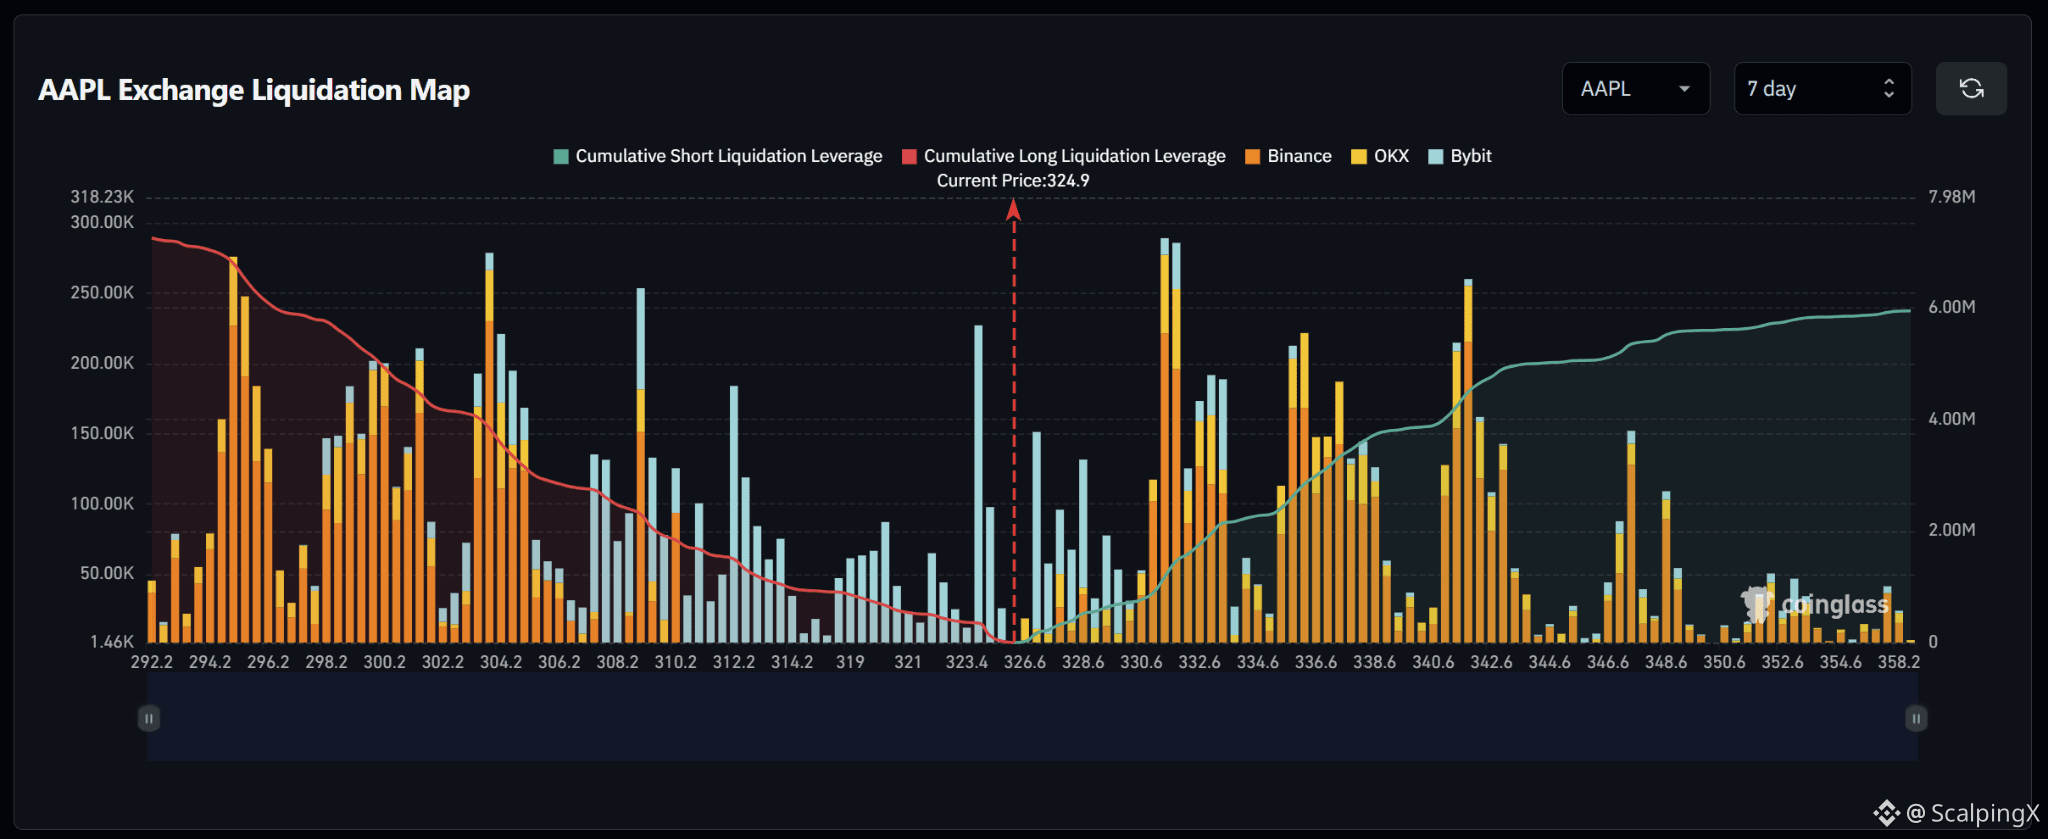
$AAPL – Liquidation Map (7 Days) – Current Price 324.9
🔎 The 7-day liquidation map shows roughly $7 million in long liquidations below the current price, exceeding approximately $6 million in short liquidations above. The overall structure is therefore fairly balanced but modestly tilted to the downside.
📉 Below the market, nearby long-liquidation liquidity is concentrated around 323.4–321.0, with a notable bar near 323.4 exceeding $200,000. Further down, larger clusters appear around 308.2–304.2 and 296.2–294.2, where several bars reach roughly $200,000–280,000. Losing 323.4 would shift attention toward 321.0–319.0.
📈 Above the market, short-liquidation liquidity begins building from around 326.6 and becomes much denser across 330.6–332.6. The strongest cluster near 331–332 approaches $290,000. Further out, 336.6 and 340.6–342.6 also contain notable liquidity.
🧭 The broader setup modestly favors the downside because long-liquidation exposure below is larger. Losing 323.4 would increase the probability of a sweep toward 321.0–319.0, while breaking above 326.6 would shift attention toward 330.6–332.6.
#LiquidationMap
$AAPL – Liquidation Map (7 Days) – Current Price 324.9
🔎 The 7-day liquidation map shows roughly $7 million in long liquidations below the current price, exceeding approximately $6 million in short liquidations above. The overall structure is therefore fairly balanced but modestly tilted to the downside.
📉 Below the market, nearby long-liquidation liquidity is concentrated around 323.4–321.0, with a notable bar near 323.4 exceeding $200,000. Further down, larger clusters appear around 308.2–304.2 and 296.2–294.2, where several bars reach roughly $200,000–280,000. Losing 323.4 would shift attention toward 321.0–319.0.
📈 Above the market, short-liquidation liquidity begins building from around 326.6 and becomes much denser across 330.6–332.6. The strongest cluster near 331–332 approaches $290,000. Further out, 336.6 and 340.6–342.6 also contain notable liquidity.
🧭 The broader setup modestly favors the downside because long-liquidation exposure below is larger. Losing 323.4 would increase the probability of a sweep toward 321.0–319.0, while breaking above 326.6 would shift attention toward 330.6–332.6.
#LiquidationMap
🔎 The 7-day liquidation map shows roughly $7 million in long liquidations below the current price, exceeding approximately $6 million in short liquidations above. The overall structure is therefore fairly balanced but modestly tilted to the downside.
📉 Below the market, nearby long-liquidation liquidity is concentrated around 323.4–321.0, with a notable bar near 323.4 exceeding $200,000. Further down, larger clusters appear around 308.2–304.2 and 296.2–294.2, where several bars reach roughly $200,000–280,000. Losing 323.4 would shift attention toward 321.0–319.0.
📈 Above the market, short-liquidation liquidity begins building from around 326.6 and becomes much denser across 330.6–332.6. The strongest cluster near 331–332 approaches $290,000. Further out, 336.6 and 340.6–342.6 also contain notable liquidity.
🧭 The broader setup modestly favors the downside because long-liquidation exposure below is larger. Losing 323.4 would increase the probability of a sweep toward 321.0–319.0, while breaking above 326.6 would shift attention toward 330.6–332.6.
#LiquidationMap
1
16
·
--
ブリッシュ
翻訳参照
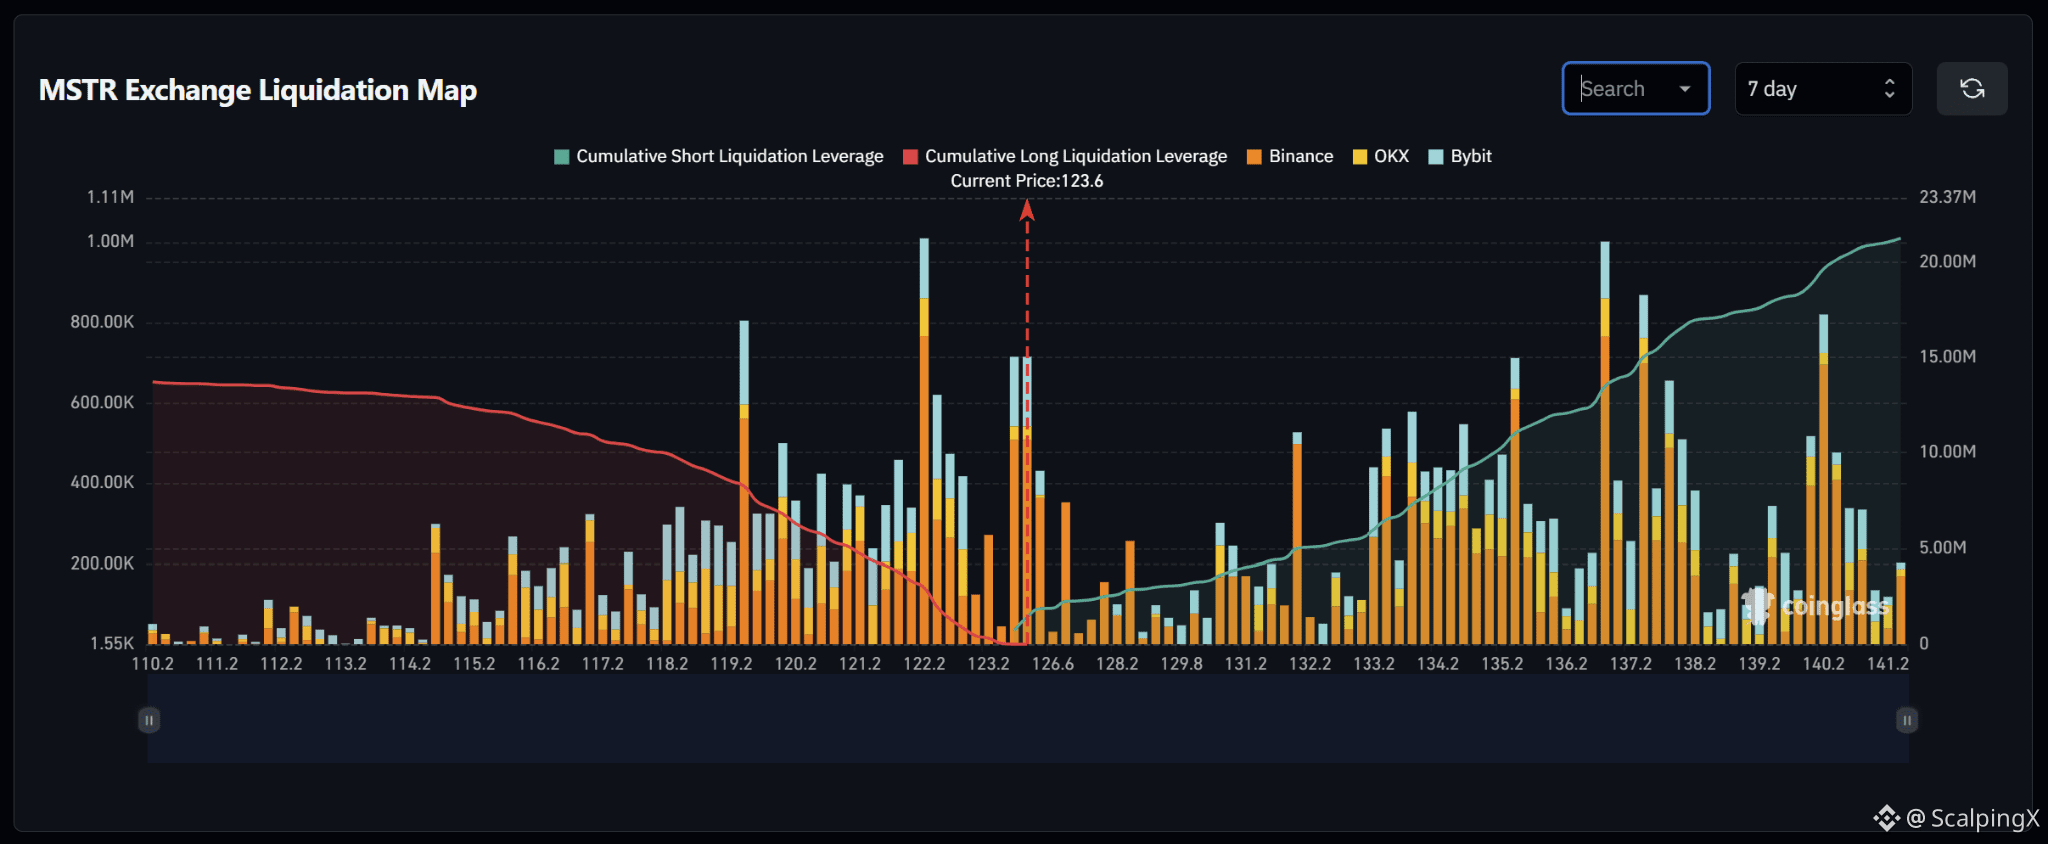
$MSTR – Liquidation Map (7 Days) – Current Price 123.6
🔎 The 7-day liquidation map shows roughly $20–21 million in short liquidations above the current price, exceeding approximately 13–14 million in long liquidations below. The liquidity structure therefore favors the upside, with roughly 1.5 times more cumulative liquidity above the market.
📉 Below the market, nearby long-liquidation liquidity is concentrated around 123.2–122.2. The strongest cluster sits near 122.2, where the liquidation bar reaches roughly 1 million, while 119.2 also contains a large cluster near $800,000. Losing 123.2 would increase the probability of a sweep toward 122.2.
📈 Above the market, short-liquidation liquidity begins building around 124–126.6 before increasing sharply across 133.2–137.2. The 136.2–137.2 area stands out with liquidation bars around $850,000–1 million. Further out, the 140.2 area also contains a large cluster above $800,000.
🧭 The broader setup favors the upside because short-liquidation exposure above is roughly 1.5 times larger. Breaking through 124–126.6 would increase the probability of a move toward 133.2–137.2, while losing 123.2 would shift attention toward 122.2.
#LiquidationMap
$MSTR – Liquidation Map (7 Days) – Current Price 123.6
🔎 The 7-day liquidation map shows roughly $20–21 million in short liquidations above the current price, exceeding approximately 13–14 million in long liquidations below. The liquidity structure therefore favors the upside, with roughly 1.5 times more cumulative liquidity above the market.
📉 Below the market, nearby long-liquidation liquidity is concentrated around 123.2–122.2. The strongest cluster sits near 122.2, where the liquidation bar reaches roughly 1 million, while 119.2 also contains a large cluster near $800,000. Losing 123.2 would increase the probability of a sweep toward 122.2.
📈 Above the market, short-liquidation liquidity begins building around 124–126.6 before increasing sharply across 133.2–137.2. The 136.2–137.2 area stands out with liquidation bars around $850,000–1 million. Further out, the 140.2 area also contains a large cluster above $800,000.
🧭 The broader setup favors the upside because short-liquidation exposure above is roughly 1.5 times larger. Breaking through 124–126.6 would increase the probability of a move toward 133.2–137.2, while losing 123.2 would shift attention toward 122.2.
#LiquidationMap
🔎 The 7-day liquidation map shows roughly $20–21 million in short liquidations above the current price, exceeding approximately 13–14 million in long liquidations below. The liquidity structure therefore favors the upside, with roughly 1.5 times more cumulative liquidity above the market.
📉 Below the market, nearby long-liquidation liquidity is concentrated around 123.2–122.2. The strongest cluster sits near 122.2, where the liquidation bar reaches roughly 1 million, while 119.2 also contains a large cluster near $800,000. Losing 123.2 would increase the probability of a sweep toward 122.2.
📈 Above the market, short-liquidation liquidity begins building around 124–126.6 before increasing sharply across 133.2–137.2. The 136.2–137.2 area stands out with liquidation bars around $850,000–1 million. Further out, the 140.2 area also contains a large cluster above $800,000.
🧭 The broader setup favors the upside because short-liquidation exposure above is roughly 1.5 times larger. Breaking through 124–126.6 would increase the probability of a move toward 133.2–137.2, while losing 123.2 would shift attention toward 122.2.
#LiquidationMap
11
·
--
翻訳参照
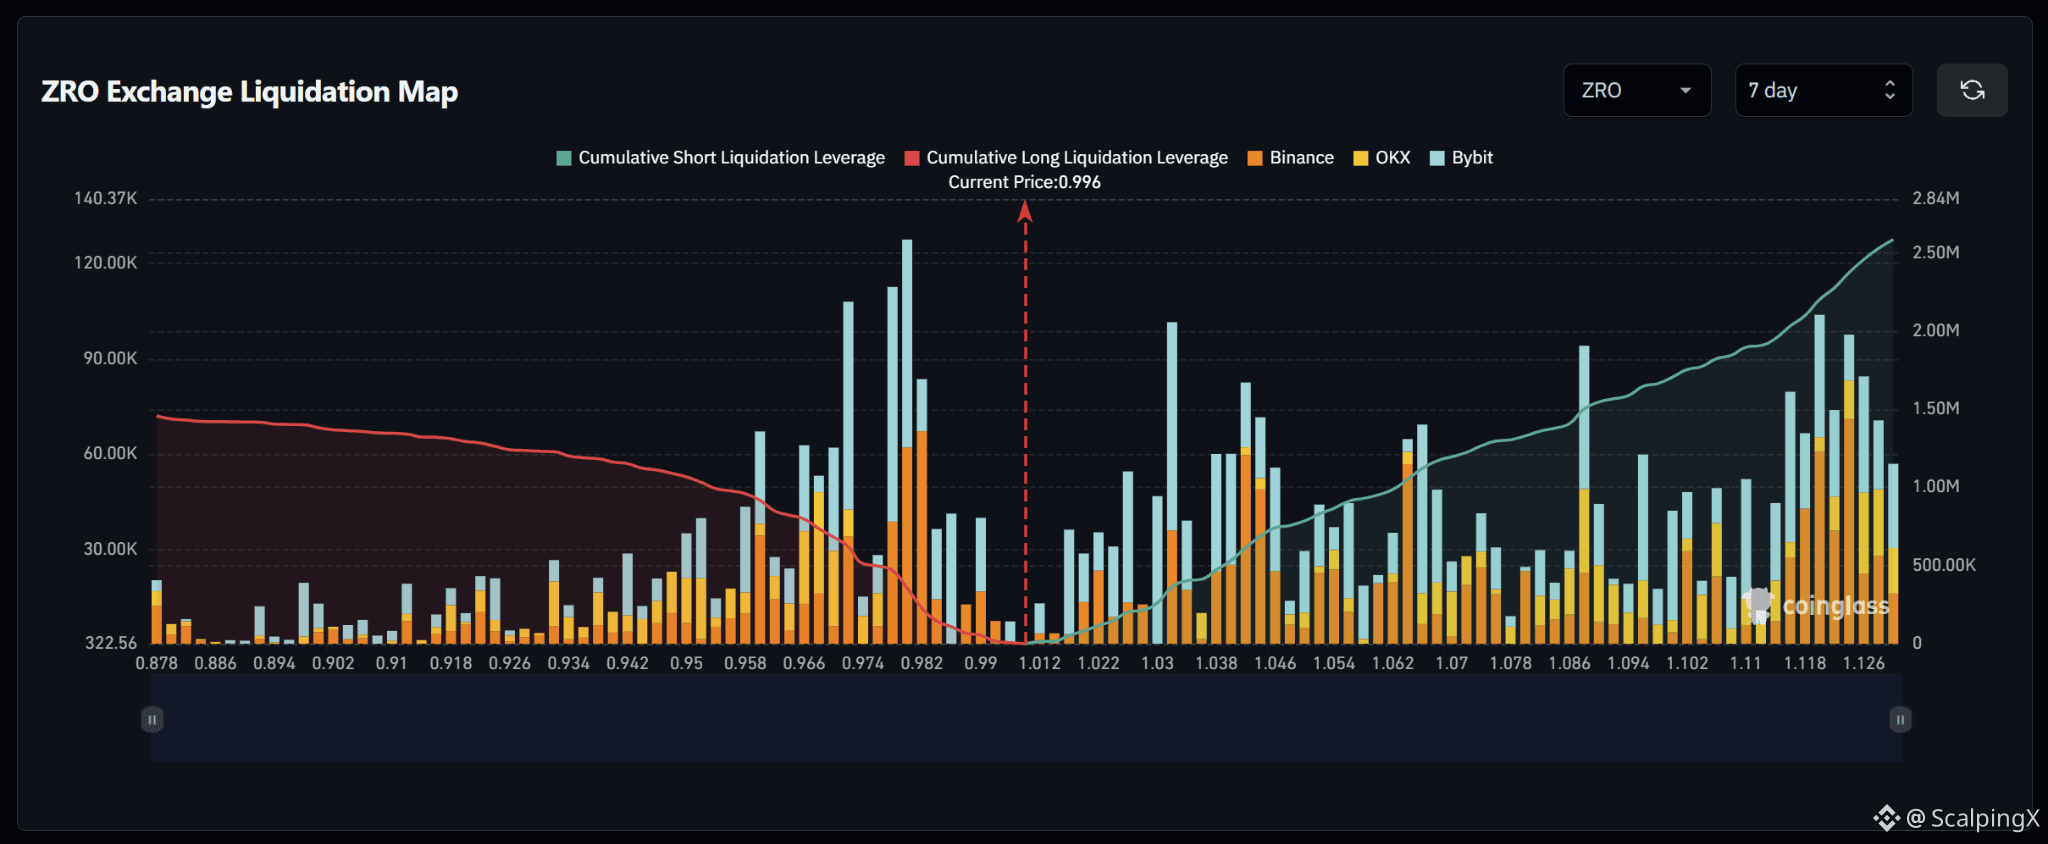
$ZRO – Liquidation Map (7 Days) – Current Price 0.996
🔎 The 7-day liquidation map shows roughly $2.5 million in short liquidations above the current price, exceeding approximately $1.5 million in long liquidations below. The liquidity structure therefore favors the upside, with roughly 1.6–1.7 times more cumulative liquidity above the market.
📉 Below the market, nearby long-liquidation liquidity is concentrated around 0.982–0.966. The strongest cluster sits near 0.978–0.982, where liquidation bars reach roughly $110,000–130,000, while 0.966–0.974 also contains notable liquidity. Losing 0.982 would shift attention toward 0.974–0.966.
📈 Above the market, short-liquidation liquidity begins building from around 1.012 and increases across 1.030–1.046. Further out, the 1.086 and especially 1.118–1.126 areas stand out, with several bars around $90,000–105,000. These form some of the more notable upside liquidity zones.
🧭 The broader setup favors the upside because short-liquidation exposure above is roughly 1.6–1.7 times larger. Breaking 1.012 would increase the probability of a sweep toward 1.030–1.046, while losing 0.982 would shift attention toward 0.974–0.966.
#LiquidationMap
$ZRO – Liquidation Map (7 Days) – Current Price 0.996
🔎 The 7-day liquidation map shows roughly $2.5 million in short liquidations above the current price, exceeding approximately $1.5 million in long liquidations below. The liquidity structure therefore favors the upside, with roughly 1.6–1.7 times more cumulative liquidity above the market.
📉 Below the market, nearby long-liquidation liquidity is concentrated around 0.982–0.966. The strongest cluster sits near 0.978–0.982, where liquidation bars reach roughly $110,000–130,000, while 0.966–0.974 also contains notable liquidity. Losing 0.982 would shift attention toward 0.974–0.966.
📈 Above the market, short-liquidation liquidity begins building from around 1.012 and increases across 1.030–1.046. Further out, the 1.086 and especially 1.118–1.126 areas stand out, with several bars around $90,000–105,000. These form some of the more notable upside liquidity zones.
🧭 The broader setup favors the upside because short-liquidation exposure above is roughly 1.6–1.7 times larger. Breaking 1.012 would increase the probability of a sweep toward 1.030–1.046, while losing 0.982 would shift attention toward 0.974–0.966.
#LiquidationMap
🔎 The 7-day liquidation map shows roughly $2.5 million in short liquidations above the current price, exceeding approximately $1.5 million in long liquidations below. The liquidity structure therefore favors the upside, with roughly 1.6–1.7 times more cumulative liquidity above the market.
📉 Below the market, nearby long-liquidation liquidity is concentrated around 0.982–0.966. The strongest cluster sits near 0.978–0.982, where liquidation bars reach roughly $110,000–130,000, while 0.966–0.974 also contains notable liquidity. Losing 0.982 would shift attention toward 0.974–0.966.
📈 Above the market, short-liquidation liquidity begins building from around 1.012 and increases across 1.030–1.046. Further out, the 1.086 and especially 1.118–1.126 areas stand out, with several bars around $90,000–105,000. These form some of the more notable upside liquidity zones.
🧭 The broader setup favors the upside because short-liquidation exposure above is roughly 1.6–1.7 times larger. Breaking 1.012 would increase the probability of a sweep toward 1.030–1.046, while losing 0.982 would shift attention toward 0.974–0.966.
#LiquidationMap
76
·
--
ブリッシュ
翻訳参照
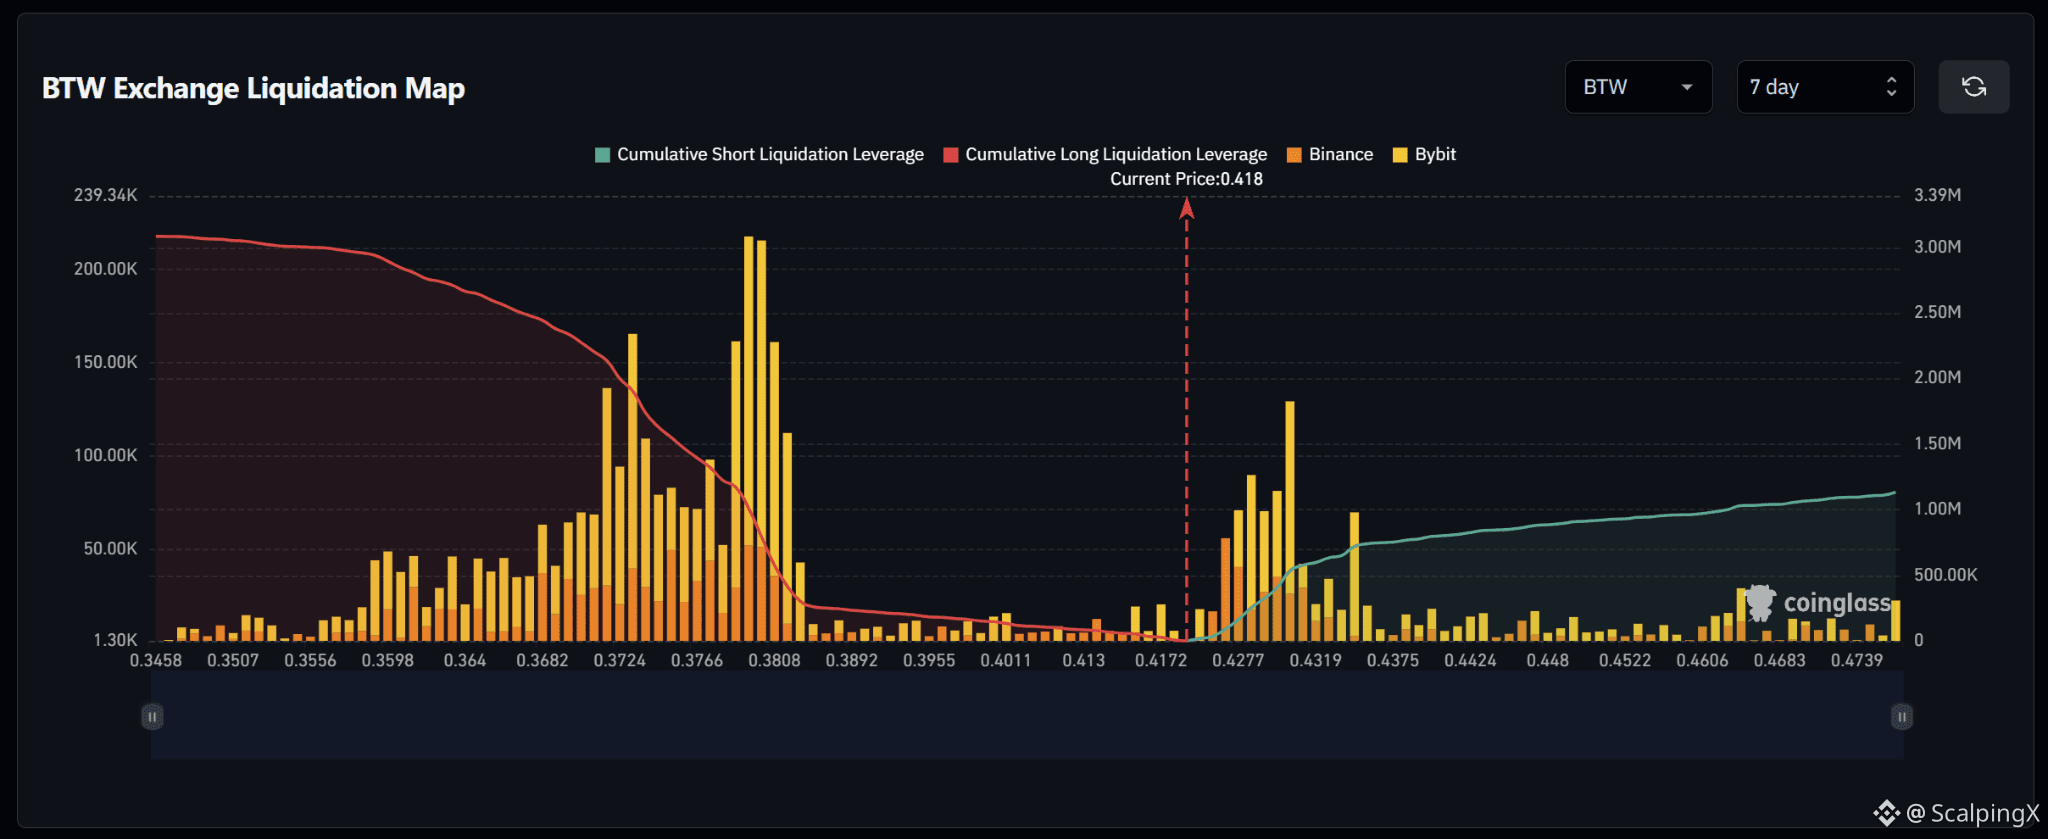
$BTW – Liquidation Map (7 Days) – Current Price 0.418
🔎 The 7-day liquidation map shows roughly $3.1 million in long liquidations below the current price, nearly three times the approximately $1.1 million in short liquidations above. The liquidity structure therefore clearly favors the downside.
📉 Below the market, nearby long-liquidation liquidity remains relatively thin around 0.413–0.401 before increasing sharply across 0.389–0.372. The strongest cluster sits around 0.378–0.381, where liquidation bars exceed $200,000, while 0.372–0.377 also contains substantial liquidity. Losing 0.413 would gradually shift attention toward 0.401–0.389.
📈 Above the market, short-liquidation liquidity begins building clearly from 0.4277 and increases across 0.4319–0.4375. The strongest cluster sits near 0.4319, where the liquidation bar reaches roughly $130,000, while 0.4277–0.4319 forms the nearest notable upside liquidity zone.
🧭 The broader setup favors the downside because long-liquidation exposure below is nearly three times larger. Losing 0.413 would increase the probability of a sweep toward 0.401–0.389, while breaking above 0.4277 would shift attention toward 0.4319–0.4375.
#LiquidationMap
$BTW – Liquidation Map (7 Days) – Current Price 0.418
🔎 The 7-day liquidation map shows roughly $3.1 million in long liquidations below the current price, nearly three times the approximately $1.1 million in short liquidations above. The liquidity structure therefore clearly favors the downside.
📉 Below the market, nearby long-liquidation liquidity remains relatively thin around 0.413–0.401 before increasing sharply across 0.389–0.372. The strongest cluster sits around 0.378–0.381, where liquidation bars exceed $200,000, while 0.372–0.377 also contains substantial liquidity. Losing 0.413 would gradually shift attention toward 0.401–0.389.
📈 Above the market, short-liquidation liquidity begins building clearly from 0.4277 and increases across 0.4319–0.4375. The strongest cluster sits near 0.4319, where the liquidation bar reaches roughly $130,000, while 0.4277–0.4319 forms the nearest notable upside liquidity zone.
🧭 The broader setup favors the downside because long-liquidation exposure below is nearly three times larger. Losing 0.413 would increase the probability of a sweep toward 0.401–0.389, while breaking above 0.4277 would shift attention toward 0.4319–0.4375.
#LiquidationMap
🔎 The 7-day liquidation map shows roughly $3.1 million in long liquidations below the current price, nearly three times the approximately $1.1 million in short liquidations above. The liquidity structure therefore clearly favors the downside.
📉 Below the market, nearby long-liquidation liquidity remains relatively thin around 0.413–0.401 before increasing sharply across 0.389–0.372. The strongest cluster sits around 0.378–0.381, where liquidation bars exceed $200,000, while 0.372–0.377 also contains substantial liquidity. Losing 0.413 would gradually shift attention toward 0.401–0.389.
📈 Above the market, short-liquidation liquidity begins building clearly from 0.4277 and increases across 0.4319–0.4375. The strongest cluster sits near 0.4319, where the liquidation bar reaches roughly $130,000, while 0.4277–0.4319 forms the nearest notable upside liquidity zone.
🧭 The broader setup favors the downside because long-liquidation exposure below is nearly three times larger. Losing 0.413 would increase the probability of a sweep toward 0.401–0.389, while breaking above 0.4277 would shift attention toward 0.4319–0.4375.
#LiquidationMap
9
·
--
ブリッシュ
翻訳参照
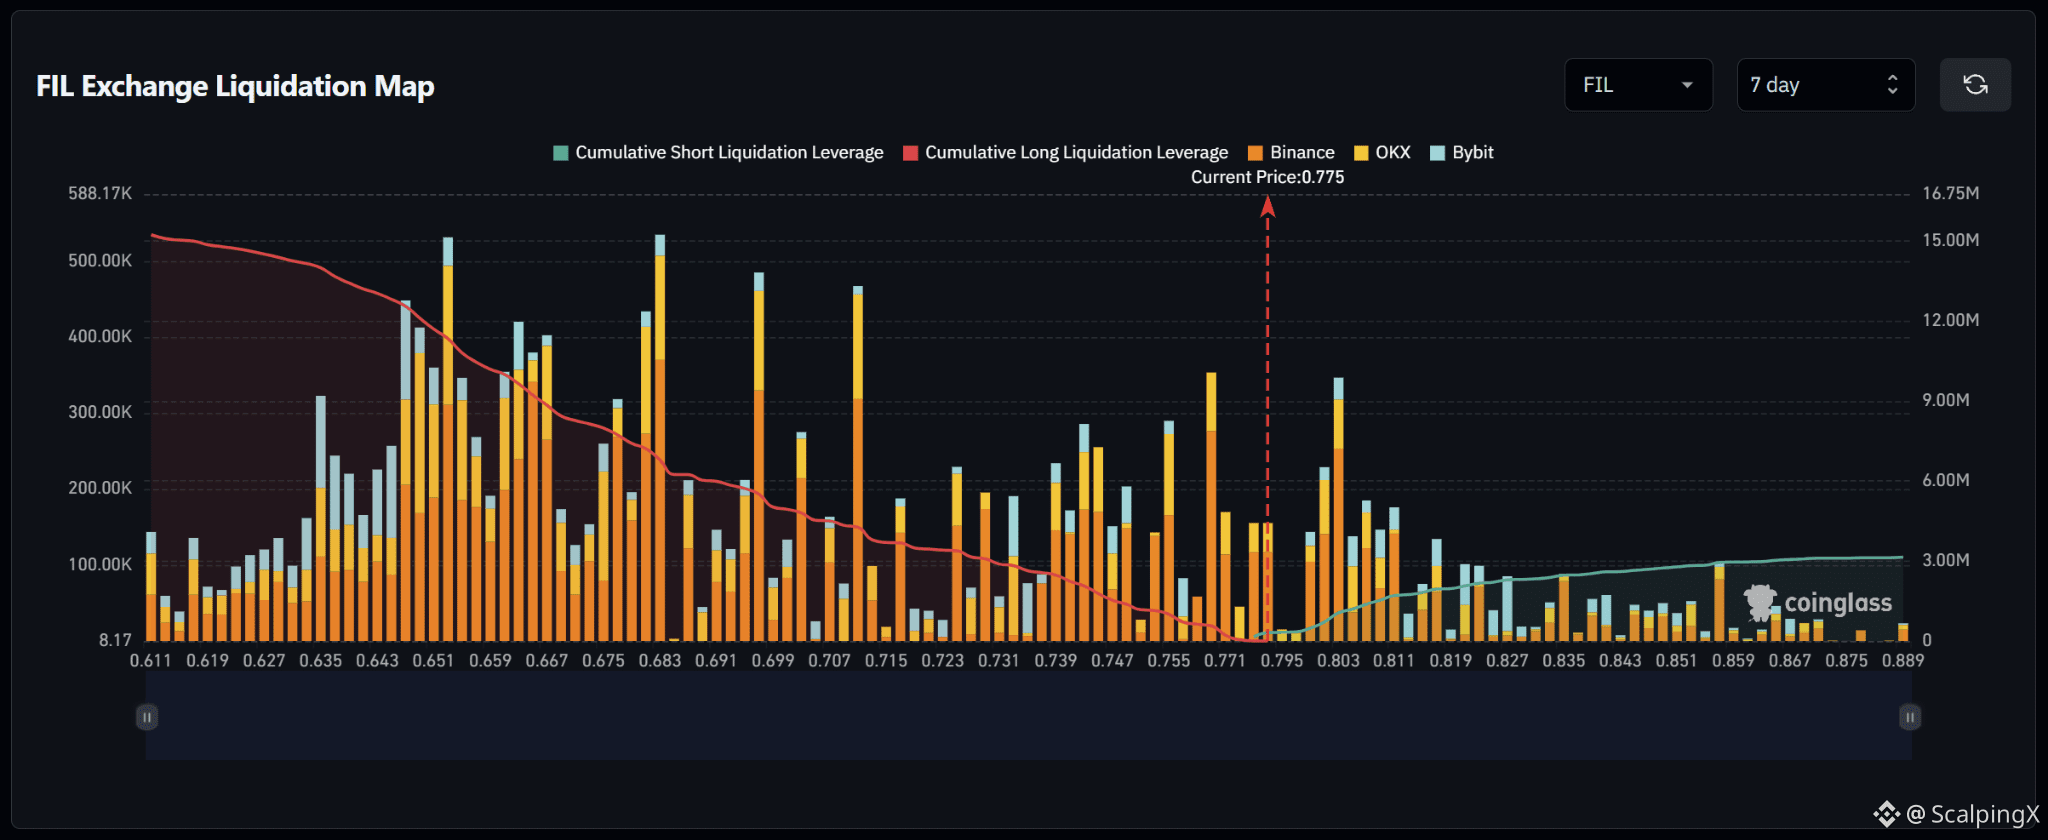
$FIL – Liquidation Map (7 Days) – Current Price 0.775
🔎 The 7-day liquidation map shows roughly $15 million in long liquidations below the current price, around five times the approximately $3 million in short liquidations above. The liquidity structure therefore strongly favors the downside.
📉 Below the market, nearby long-liquidation liquidity is concentrated around 0.771–0.747, with notable clusters near 0.755 and 0.747. Further down, liquidity increases sharply across 0.707–0.683, while 0.667–0.643 contains several large bars around $300,000–530,000. Losing 0.771 would increase the probability of a sweep toward 0.755–0.747.
📈 Above the market, short-liquidation liquidity remains relatively sparse near the current price and becomes more visible from around 0.795. The strongest nearby cluster sits near 0.803, where the liquidation bar reaches roughly $340,000, followed by 0.811–0.819. Further out, upside liquidity becomes significantly lighter.
🧭 The broader setup strongly favors the downside because long-liquidation exposure below is roughly five times larger. Losing 0.771 would increase the probability of a sweep toward 0.755–0.747, while breaking above 0.795 would shift attention toward 0.803–0.811.
#LiquidationMap
$FIL – Liquidation Map (7 Days) – Current Price 0.775
🔎 The 7-day liquidation map shows roughly $15 million in long liquidations below the current price, around five times the approximately $3 million in short liquidations above. The liquidity structure therefore strongly favors the downside.
📉 Below the market, nearby long-liquidation liquidity is concentrated around 0.771–0.747, with notable clusters near 0.755 and 0.747. Further down, liquidity increases sharply across 0.707–0.683, while 0.667–0.643 contains several large bars around $300,000–530,000. Losing 0.771 would increase the probability of a sweep toward 0.755–0.747.
📈 Above the market, short-liquidation liquidity remains relatively sparse near the current price and becomes more visible from around 0.795. The strongest nearby cluster sits near 0.803, where the liquidation bar reaches roughly $340,000, followed by 0.811–0.819. Further out, upside liquidity becomes significantly lighter.
🧭 The broader setup strongly favors the downside because long-liquidation exposure below is roughly five times larger. Losing 0.771 would increase the probability of a sweep toward 0.755–0.747, while breaking above 0.795 would shift attention toward 0.803–0.811.
#LiquidationMap
🔎 The 7-day liquidation map shows roughly $15 million in long liquidations below the current price, around five times the approximately $3 million in short liquidations above. The liquidity structure therefore strongly favors the downside.
📉 Below the market, nearby long-liquidation liquidity is concentrated around 0.771–0.747, with notable clusters near 0.755 and 0.747. Further down, liquidity increases sharply across 0.707–0.683, while 0.667–0.643 contains several large bars around $300,000–530,000. Losing 0.771 would increase the probability of a sweep toward 0.755–0.747.
📈 Above the market, short-liquidation liquidity remains relatively sparse near the current price and becomes more visible from around 0.795. The strongest nearby cluster sits near 0.803, where the liquidation bar reaches roughly $340,000, followed by 0.811–0.819. Further out, upside liquidity becomes significantly lighter.
🧭 The broader setup strongly favors the downside because long-liquidation exposure below is roughly five times larger. Losing 0.771 would increase the probability of a sweep toward 0.755–0.747, while breaking above 0.795 would shift attention toward 0.803–0.811.
#LiquidationMap
30
·
--
ブリッシュ
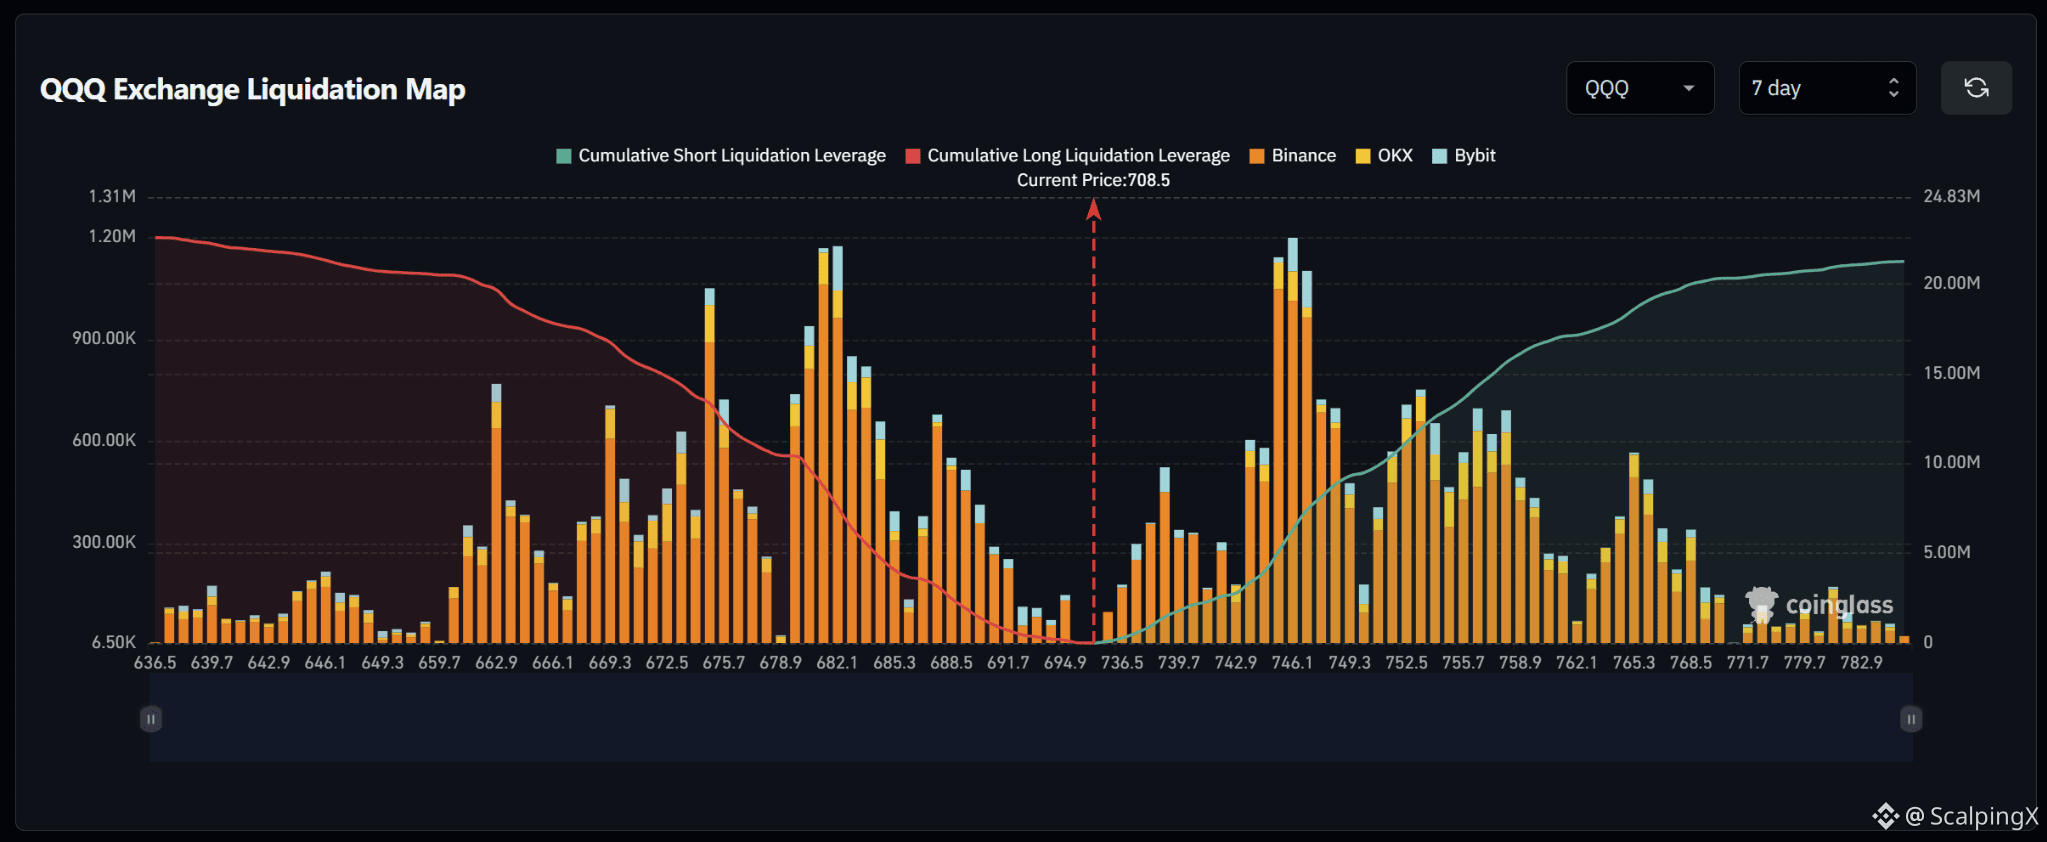
$QQQ – 清算マップ(7日間)– 現在価格 708.5
🔎 7日間の清算マップでは、現在価格を下回る領域でのロング清算が約2,200万ドルと概算されており、現在価格を上回る領域でのショート清算(約2,100万ドル)をわずかに上回っています。全体の構造は比較的バランスが取れていますが、下方向にやや傾いています。
📉 市場より下では、ロング清算の流動性が688.5〜675.7に強く集中しています。最も強い塊は682.1付近で、清算バーが約120万ドルに近づいています。さらに675.7および662.9にも、約70万ドル〜100万ドル規模の大きなクラスターが含まれています。694.9を失うと、注目は688.5〜682.1へ移るでしょう。
📈 市場より上では、736.5あたりから意味のあるショート清算の流動性がより見え始め、742.9〜749.3にかけて急速に増加します。最も強い塊は746.1付近で、清算バーが約120万ドルに近づいています。さらに外側の752.5〜758.9にも、50万ドル〜75万ドルのクラスターがいくつか存在します。
🧭 全体としてのセッティングは比較的バランスしていますが、下方向がわずかに有利です。694.9を失うと、688.5〜682.1へのスイープ(一掃)の確率が高まり、736.5を上回る動きがあれば、注目は742.9〜749.3へ移ります。
#LiquidationMap
$QQQ – 清算マップ(7日間)– 現在価格 708.5
🔎 7日間の清算マップでは、現在価格を下回る領域でのロング清算が約2,200万ドルと概算されており、現在価格を上回る領域でのショート清算(約2,100万ドル)をわずかに上回っています。全体の構造は比較的バランスが取れていますが、下方向にやや傾いています。
📉 市場より下では、ロング清算の流動性が688.5〜675.7に強く集中しています。最も強い塊は682.1付近で、清算バーが約120万ドルに近づいています。さらに675.7および662.9にも、約70万ドル〜100万ドル規模の大きなクラスターが含まれています。694.9を失うと、注目は688.5〜682.1へ移るでしょう。
📈 市場より上では、736.5あたりから意味のあるショート清算の流動性がより見え始め、742.9〜749.3にかけて急速に増加します。最も強い塊は746.1付近で、清算バーが約120万ドルに近づいています。さらに外側の752.5〜758.9にも、50万ドル〜75万ドルのクラスターがいくつか存在します。
🧭 全体としてのセッティングは比較的バランスしていますが、下方向がわずかに有利です。694.9を失うと、688.5〜682.1へのスイープ(一掃)の確率が高まり、736.5を上回る動きがあれば、注目は742.9〜749.3へ移ります。
#LiquidationMap
🔎 7日間の清算マップでは、現在価格を下回る領域でのロング清算が約2,200万ドルと概算されており、現在価格を上回る領域でのショート清算(約2,100万ドル)をわずかに上回っています。全体の構造は比較的バランスが取れていますが、下方向にやや傾いています。
📉 市場より下では、ロング清算の流動性が688.5〜675.7に強く集中しています。最も強い塊は682.1付近で、清算バーが約120万ドルに近づいています。さらに675.7および662.9にも、約70万ドル〜100万ドル規模の大きなクラスターが含まれています。694.9を失うと、注目は688.5〜682.1へ移るでしょう。
📈 市場より上では、736.5あたりから意味のあるショート清算の流動性がより見え始め、742.9〜749.3にかけて急速に増加します。最も強い塊は746.1付近で、清算バーが約120万ドルに近づいています。さらに外側の752.5〜758.9にも、50万ドル〜75万ドルのクラスターがいくつか存在します。
🧭 全体としてのセッティングは比較的バランスしていますが、下方向がわずかに有利です。694.9を失うと、688.5〜682.1へのスイープ(一掃)の確率が高まり、736.5を上回る動きがあれば、注目は742.9〜749.3へ移ります。
#LiquidationMap
14
·
--
ブリッシュ
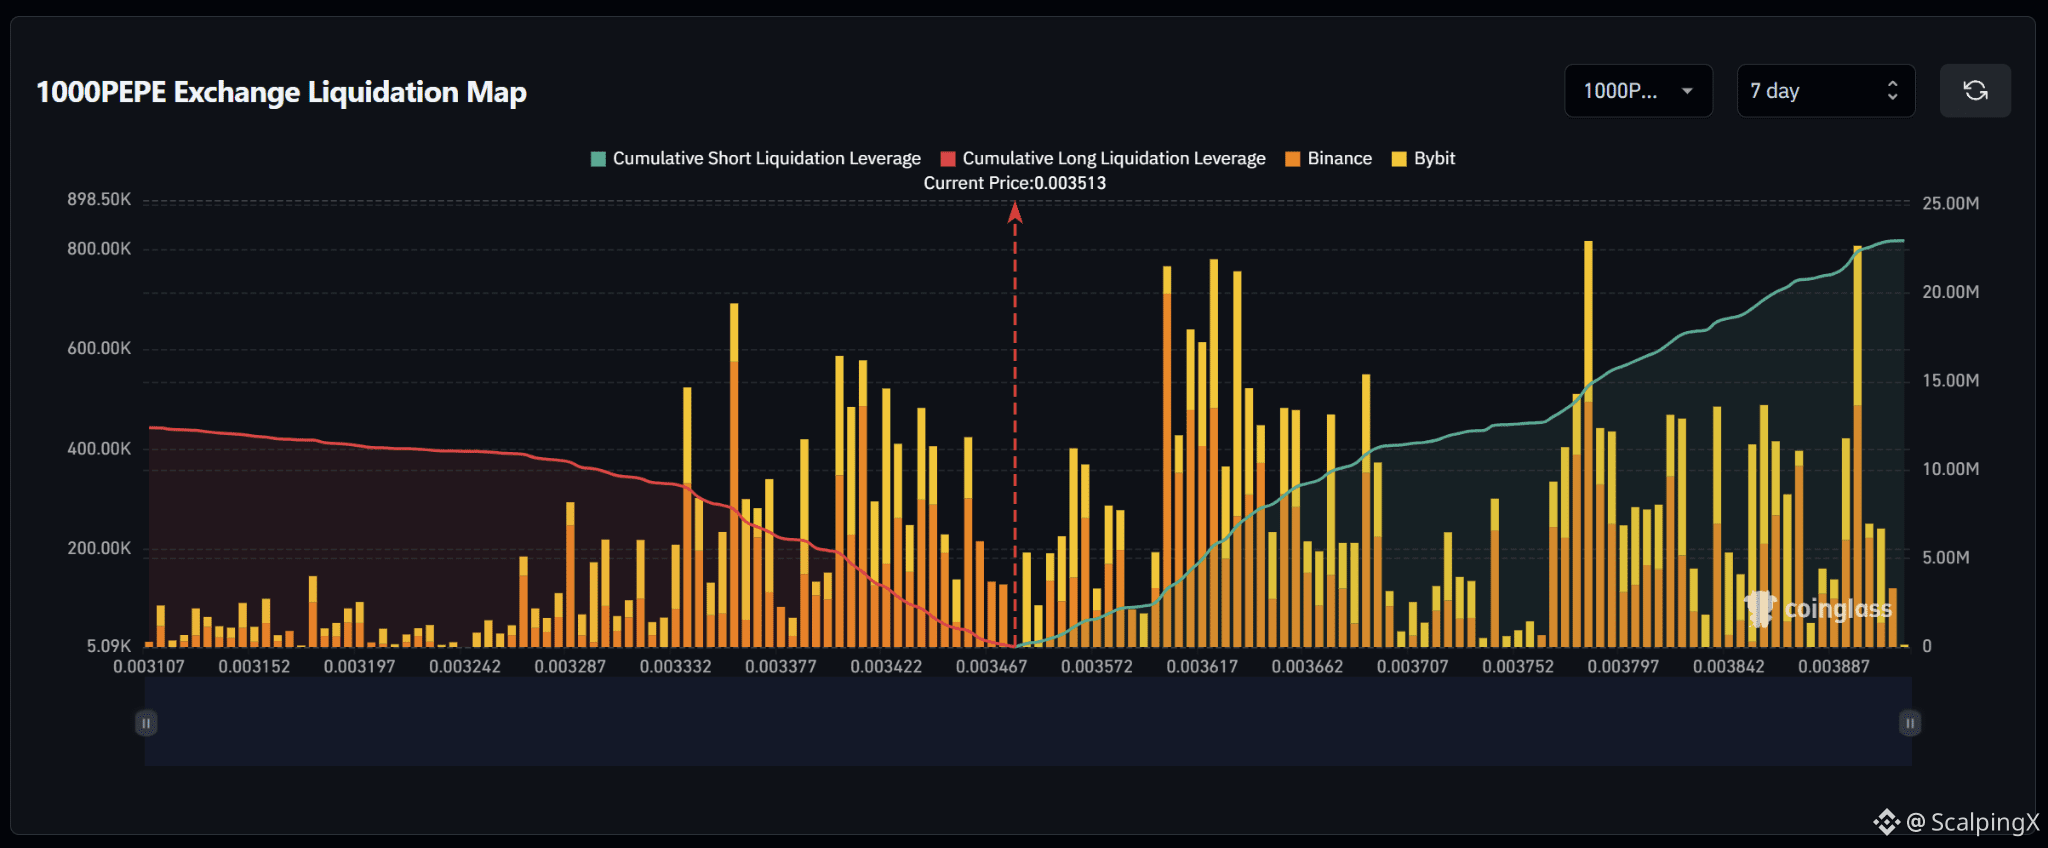
$PEPE – 清算マップ(7日間) – 現在価格 0.003513
🔎 7日間の清算マップでは、現在価格を上回る水準で約2,200万〜2,300万ドルのショート清算が示されています。これは、現在価格を下回る約1,200万ドルのロング清算のほぼ2倍です。したがって、流動性構造は明確に上方向を支持しており、市場上方の累積流動性が概ね1.8〜1.9倍となっています。
📉 市場下方では、近いロング清算の流動性が0.003467〜0.003377付近に集中しています。注目すべきクラスターは0.003422〜0.003377に見られ、いくつかの清算バーはおよそ40万〜60万ドルに達しています。さらに下では、0.003332のあたりにも約50万ドル近辺の大きなクラスターがあります。0.003467を割り込むと、注目が0.003422〜0.003377へ移るでしょう。
📈 市場上方では、ショート清算の流動性が0.003572前後から構築され始め、0.00360〜0.00366にかけて急激に増加します。この範囲では複数のバーがおよそ60万〜78万ドルに達しています。さらに離れた位置では、0.003797と0.003887が際立っており、バーが約80万ドル近くとなっていて、最大級の上昇側クラスターの一部を形成しています。
🧭 より広い見立てでは上方向が優勢です。なぜなら、上方のショート清算エクスポージャーはほぼ2倍の規模だからです。0.003572をブレイクすれば、0.00360〜0.00366へのスイープ(清算の連鎖)が起きる確率が高まります。一方で、0.003467を失うと、注目は0.003422〜0.003377へ移ります。
#LiquidationMap
$PEPE – 清算マップ(7日間) – 現在価格 0.003513
🔎 7日間の清算マップでは、現在価格を上回る水準で約2,200万〜2,300万ドルのショート清算が示されています。これは、現在価格を下回る約1,200万ドルのロング清算のほぼ2倍です。したがって、流動性構造は明確に上方向を支持しており、市場上方の累積流動性が概ね1.8〜1.9倍となっています。
📉 市場下方では、近いロング清算の流動性が0.003467〜0.003377付近に集中しています。注目すべきクラスターは0.003422〜0.003377に見られ、いくつかの清算バーはおよそ40万〜60万ドルに達しています。さらに下では、0.003332のあたりにも約50万ドル近辺の大きなクラスターがあります。0.003467を割り込むと、注目が0.003422〜0.003377へ移るでしょう。
📈 市場上方では、ショート清算の流動性が0.003572前後から構築され始め、0.00360〜0.00366にかけて急激に増加します。この範囲では複数のバーがおよそ60万〜78万ドルに達しています。さらに離れた位置では、0.003797と0.003887が際立っており、バーが約80万ドル近くとなっていて、最大級の上昇側クラスターの一部を形成しています。
🧭 より広い見立てでは上方向が優勢です。なぜなら、上方のショート清算エクスポージャーはほぼ2倍の規模だからです。0.003572をブレイクすれば、0.00360〜0.00366へのスイープ(清算の連鎖)が起きる確率が高まります。一方で、0.003467を失うと、注目は0.003422〜0.003377へ移ります。
#LiquidationMap
🔎 7日間の清算マップでは、現在価格を上回る水準で約2,200万〜2,300万ドルのショート清算が示されています。これは、現在価格を下回る約1,200万ドルのロング清算のほぼ2倍です。したがって、流動性構造は明確に上方向を支持しており、市場上方の累積流動性が概ね1.8〜1.9倍となっています。
📉 市場下方では、近いロング清算の流動性が0.003467〜0.003377付近に集中しています。注目すべきクラスターは0.003422〜0.003377に見られ、いくつかの清算バーはおよそ40万〜60万ドルに達しています。さらに下では、0.003332のあたりにも約50万ドル近辺の大きなクラスターがあります。0.003467を割り込むと、注目が0.003422〜0.003377へ移るでしょう。
📈 市場上方では、ショート清算の流動性が0.003572前後から構築され始め、0.00360〜0.00366にかけて急激に増加します。この範囲では複数のバーがおよそ60万〜78万ドルに達しています。さらに離れた位置では、0.003797と0.003887が際立っており、バーが約80万ドル近くとなっていて、最大級の上昇側クラスターの一部を形成しています。
🧭 より広い見立てでは上方向が優勢です。なぜなら、上方のショート清算エクスポージャーはほぼ2倍の規模だからです。0.003572をブレイクすれば、0.00360〜0.00366へのスイープ(清算の連鎖)が起きる確率が高まります。一方で、0.003467を失うと、注目は0.003422〜0.003377へ移ります。
#LiquidationMap
1
23
·
--
ブリッシュ
翻訳参照
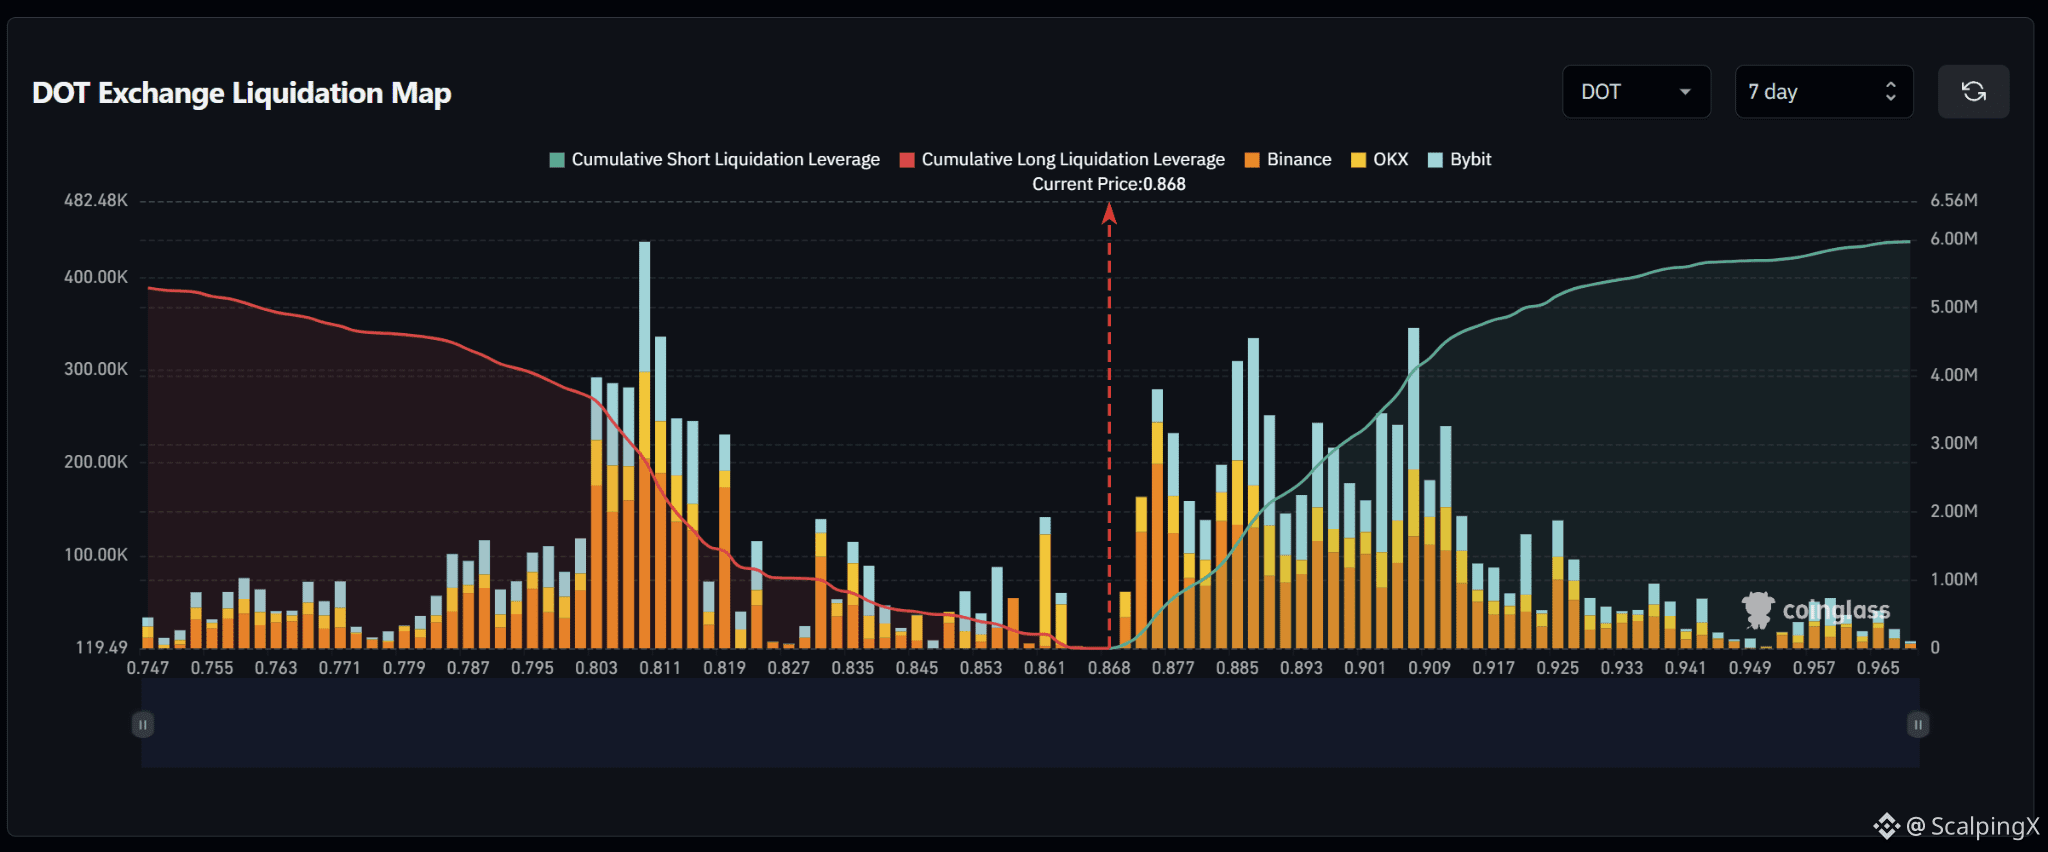
$DOT – Liquidation Map (7 Days) – Current Price 0.868
🔎 The 7-day liquidation map shows roughly $6 million in short liquidations above the current price, slightly exceeding approximately $5.3 million in long liquidations below. The overall structure is therefore fairly balanced but modestly tilted to the upside.
📉 Below the market, nearby long-liquidation liquidity remains relatively thin around 0.861–0.845 before increasing across 0.835–0.803. The strongest cluster sits near 0.811, where the liquidation bar exceeds $400,000, while 0.803–0.819 also contains several $200,000–300,000 clusters. Losing 0.861 would shift attention toward 0.853–0.835.
📈 Above the market, short-liquidation liquidity begins building around 0.877 and becomes much denser across 0.885–0.909. The strongest clusters near 0.885 and 0.909 reach roughly $300,000–350,000. Further out, 0.917–0.925 also contains notable liquidity.
🧭 The broader setup modestly favors the upside because short-liquidation exposure above is larger. Breaking 0.877 would increase the probability of a sweep toward 0.885–0.909, while losing 0.861 would shift attention toward 0.853–0.835.
#LiquidationMap
$DOT – Liquidation Map (7 Days) – Current Price 0.868
🔎 The 7-day liquidation map shows roughly $6 million in short liquidations above the current price, slightly exceeding approximately $5.3 million in long liquidations below. The overall structure is therefore fairly balanced but modestly tilted to the upside.
📉 Below the market, nearby long-liquidation liquidity remains relatively thin around 0.861–0.845 before increasing across 0.835–0.803. The strongest cluster sits near 0.811, where the liquidation bar exceeds $400,000, while 0.803–0.819 also contains several $200,000–300,000 clusters. Losing 0.861 would shift attention toward 0.853–0.835.
📈 Above the market, short-liquidation liquidity begins building around 0.877 and becomes much denser across 0.885–0.909. The strongest clusters near 0.885 and 0.909 reach roughly $300,000–350,000. Further out, 0.917–0.925 also contains notable liquidity.
🧭 The broader setup modestly favors the upside because short-liquidation exposure above is larger. Breaking 0.877 would increase the probability of a sweep toward 0.885–0.909, while losing 0.861 would shift attention toward 0.853–0.835.
#LiquidationMap
🔎 The 7-day liquidation map shows roughly $6 million in short liquidations above the current price, slightly exceeding approximately $5.3 million in long liquidations below. The overall structure is therefore fairly balanced but modestly tilted to the upside.
📉 Below the market, nearby long-liquidation liquidity remains relatively thin around 0.861–0.845 before increasing across 0.835–0.803. The strongest cluster sits near 0.811, where the liquidation bar exceeds $400,000, while 0.803–0.819 also contains several $200,000–300,000 clusters. Losing 0.861 would shift attention toward 0.853–0.835.
📈 Above the market, short-liquidation liquidity begins building around 0.877 and becomes much denser across 0.885–0.909. The strongest clusters near 0.885 and 0.909 reach roughly $300,000–350,000. Further out, 0.917–0.925 also contains notable liquidity.
🧭 The broader setup modestly favors the upside because short-liquidation exposure above is larger. Breaking 0.877 would increase the probability of a sweep toward 0.885–0.909, while losing 0.861 would shift attention toward 0.853–0.835.
#LiquidationMap
37
·
--
ブリッシュ
翻訳参照
$XLM – Liquidation Map (7 Days) – Current Price 0.1779
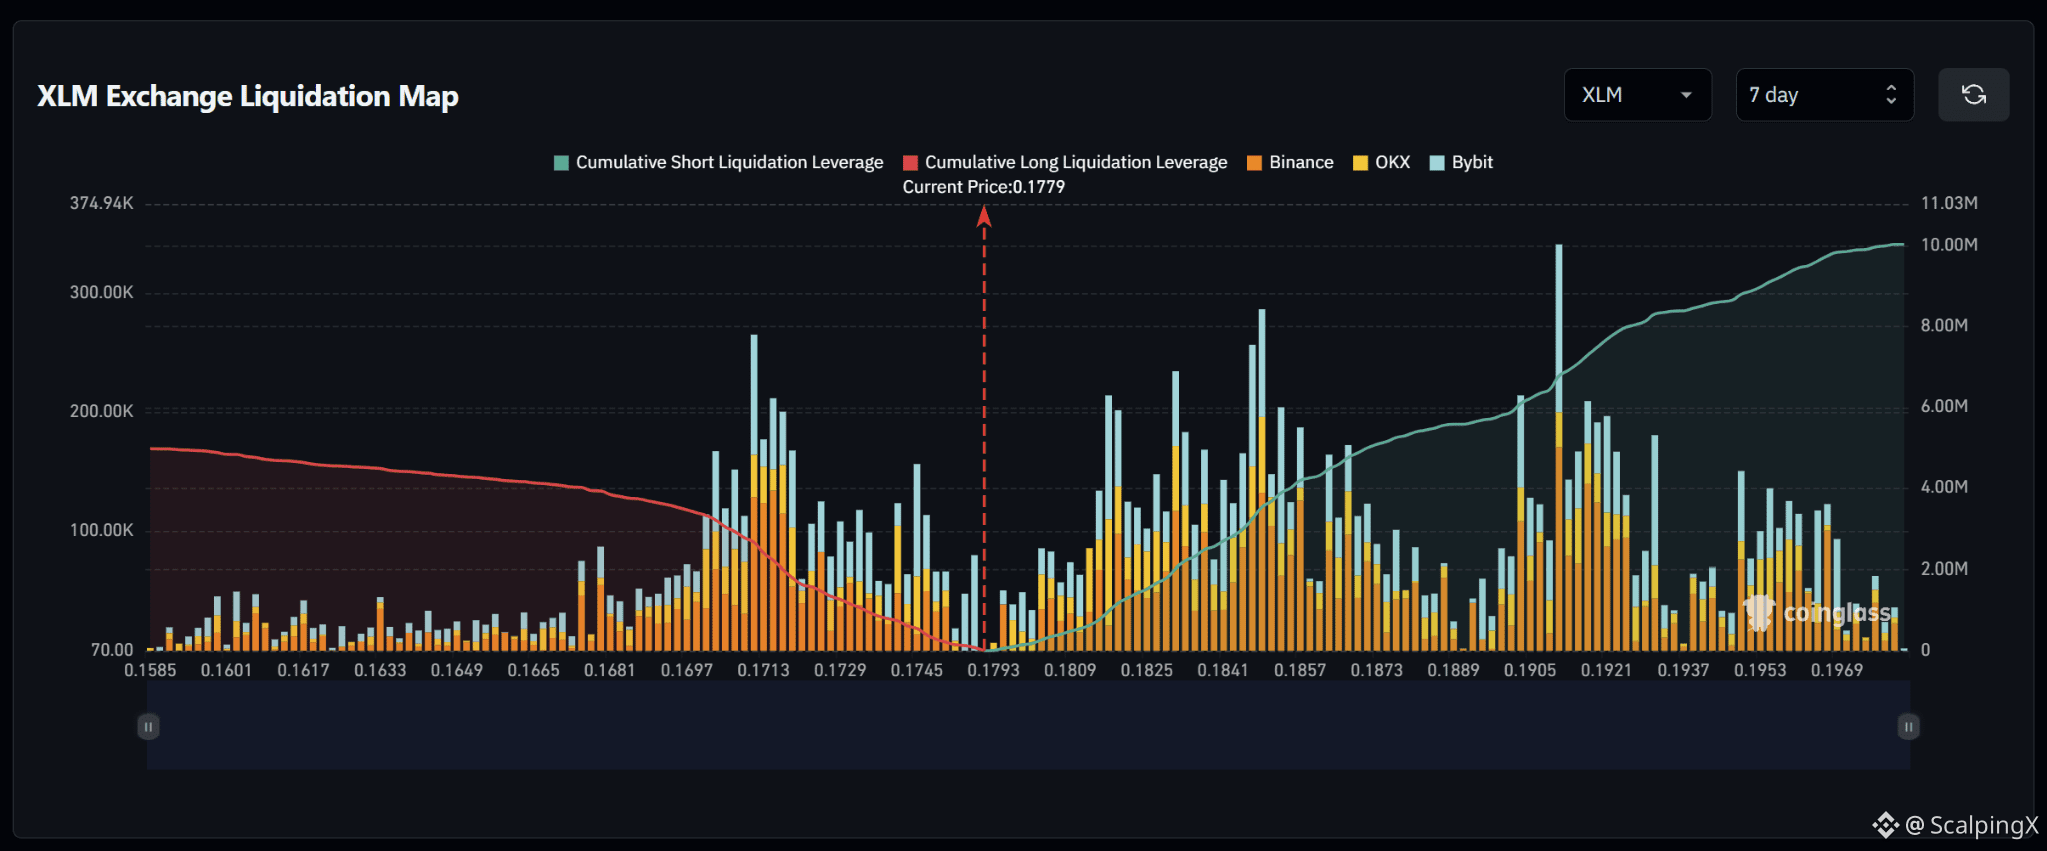
🔎 The 7-day liquidation map shows roughly $10 million in short liquidations above the current price, nearly double the approximately $5 million in long liquidations below. The liquidity structure therefore clearly favors the upside.
📉 Below the market, nearby long-liquidation liquidity is concentrated around 0.1745–0.1713. The strongest cluster sits near 0.1713, where the liquidation bar reaches roughly $250,000–270,000, while 0.1697–0.1681 also contains notable liquidity. Losing 0.1745 would increase the probability of a sweep toward 0.1729–0.1713.
📈 Above the market, short-liquidation liquidity begins building around 0.1809 and becomes denser across 0.1825–0.1857. Further out, 0.1905–0.1921 stands out more clearly, with the largest bar near 0.1905 exceeding $300,000. A break above 0.1809 would bring 0.1825–0.1857 into focus first.
🧭 The broader setup favors the upside because short-liquidation exposure above is nearly twice as large. Breaking 0.1809 would increase the probability of a sweep toward 0.1825–0.1857, while losing 0.1745 would shift attention toward 0.1729–0.1713.
#LiquidationMap
$XLM – Liquidation Map (7 Days) – Current Price 0.1779
🔎 The 7-day liquidation map shows roughly $10 million in short liquidations above the current price, nearly double the approximately $5 million in long liquidations below. The liquidity structure therefore clearly favors the upside.
📉 Below the market, nearby long-liquidation liquidity is concentrated around 0.1745–0.1713. The strongest cluster sits near 0.1713, where the liquidation bar reaches roughly $250,000–270,000, while 0.1697–0.1681 also contains notable liquidity. Losing 0.1745 would increase the probability of a sweep toward 0.1729–0.1713.
📈 Above the market, short-liquidation liquidity begins building around 0.1809 and becomes denser across 0.1825–0.1857. Further out, 0.1905–0.1921 stands out more clearly, with the largest bar near 0.1905 exceeding $300,000. A break above 0.1809 would bring 0.1825–0.1857 into focus first.
🧭 The broader setup favors the upside because short-liquidation exposure above is nearly twice as large. Breaking 0.1809 would increase the probability of a sweep toward 0.1825–0.1857, while losing 0.1745 would shift attention toward 0.1729–0.1713.
#LiquidationMap
🔎 The 7-day liquidation map shows roughly $10 million in short liquidations above the current price, nearly double the approximately $5 million in long liquidations below. The liquidity structure therefore clearly favors the upside.
📉 Below the market, nearby long-liquidation liquidity is concentrated around 0.1745–0.1713. The strongest cluster sits near 0.1713, where the liquidation bar reaches roughly $250,000–270,000, while 0.1697–0.1681 also contains notable liquidity. Losing 0.1745 would increase the probability of a sweep toward 0.1729–0.1713.
📈 Above the market, short-liquidation liquidity begins building around 0.1809 and becomes denser across 0.1825–0.1857. Further out, 0.1905–0.1921 stands out more clearly, with the largest bar near 0.1905 exceeding $300,000. A break above 0.1809 would bring 0.1825–0.1857 into focus first.
🧭 The broader setup favors the upside because short-liquidation exposure above is nearly twice as large. Breaking 0.1809 would increase the probability of a sweep toward 0.1825–0.1857, while losing 0.1745 would shift attention toward 0.1729–0.1713.
#LiquidationMap
19
·
--
ブリッシュ
$CRCL – 清算マップ(7日間)– 現在価格 94.9
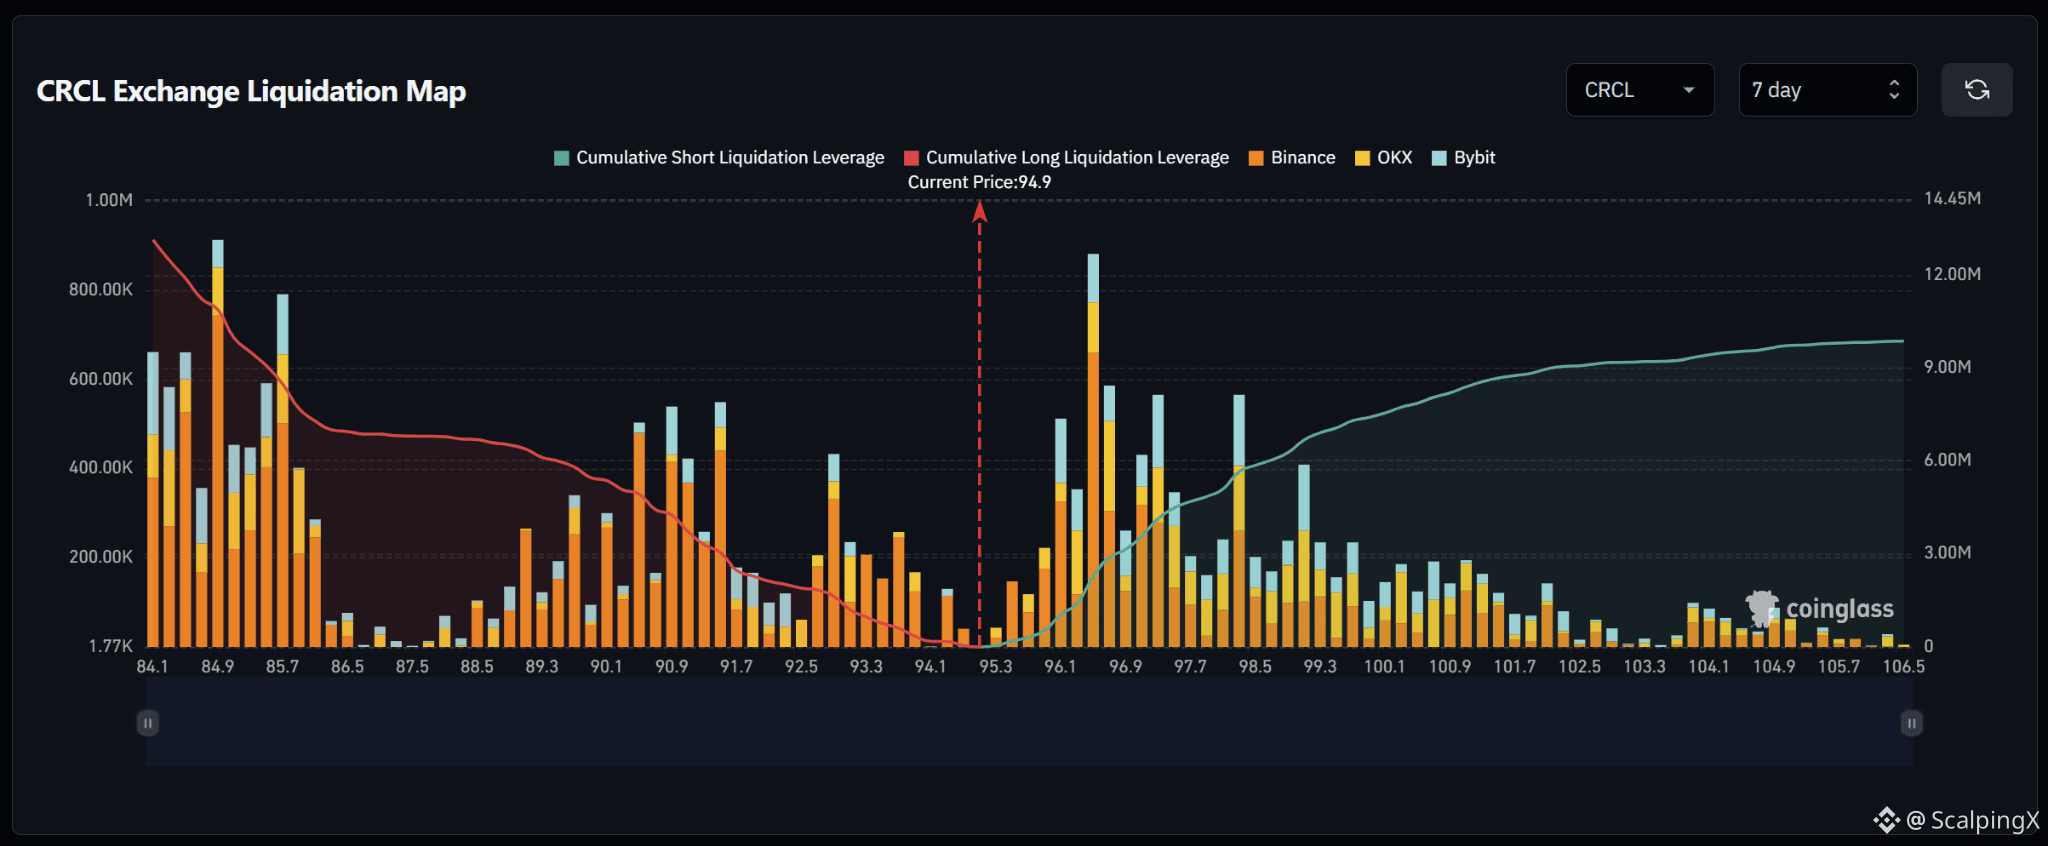
🔎 7日間の清算マップでは、現在価格の下に約1,300万ドルのロング清算が存在し、現在価格の上には約900万~1,000万ドルのショート清算が上回っています。したがって、流動性構造は下方向に有利で、市場の下に累積流動性が約1.3~1.4倍多く滞留しています。
📉 市場下では、94.1付近のロング清算の近距離流動性が比較的薄い状態ですが、その後93.3~92.5にかけて増加します。さらに下では91.7~90.1にかけて、30万~55万ドル規模の複数クラスターが含まれています。94.1を失うと、93.3~92.5へ向けたスイープ(清算の連鎖)の確率が高まります。
📈 市場上では、ショート清算の流動性が95.3~96.1付近から形成され始め、96.1~96.9にかけて急速に増加します。最も強い近距離クラスターは96.5付近で、清算バーカは約90万ドルに接近しています。さらに外側では97.7~99.3にも注目すべき流動性があります。95.3を上抜けると、まず96.1~96.9が焦点になります。
🧭 全体のセットアップはやや下方向に有利です。下側のロング清算エクスポージャーが、概ね1.3~1.4倍大きいためです。94.1を失えば93.3~92.5へ向けたスイープの確率が高まり、95.3を上抜ければ注意は96.1~96.9へ移ります。
#LiquidationMap
$CRCL – 清算マップ(7日間)– 現在価格 94.9
🔎 7日間の清算マップでは、現在価格の下に約1,300万ドルのロング清算が存在し、現在価格の上には約900万~1,000万ドルのショート清算が上回っています。したがって、流動性構造は下方向に有利で、市場の下に累積流動性が約1.3~1.4倍多く滞留しています。
📉 市場下では、94.1付近のロング清算の近距離流動性が比較的薄い状態ですが、その後93.3~92.5にかけて増加します。さらに下では91.7~90.1にかけて、30万~55万ドル規模の複数クラスターが含まれています。94.1を失うと、93.3~92.5へ向けたスイープ(清算の連鎖)の確率が高まります。
📈 市場上では、ショート清算の流動性が95.3~96.1付近から形成され始め、96.1~96.9にかけて急速に増加します。最も強い近距離クラスターは96.5付近で、清算バーカは約90万ドルに接近しています。さらに外側では97.7~99.3にも注目すべき流動性があります。95.3を上抜けると、まず96.1~96.9が焦点になります。
🧭 全体のセットアップはやや下方向に有利です。下側のロング清算エクスポージャーが、概ね1.3~1.4倍大きいためです。94.1を失えば93.3~92.5へ向けたスイープの確率が高まり、95.3を上抜ければ注意は96.1~96.9へ移ります。
#LiquidationMap
🔎 7日間の清算マップでは、現在価格の下に約1,300万ドルのロング清算が存在し、現在価格の上には約900万~1,000万ドルのショート清算が上回っています。したがって、流動性構造は下方向に有利で、市場の下に累積流動性が約1.3~1.4倍多く滞留しています。
📉 市場下では、94.1付近のロング清算の近距離流動性が比較的薄い状態ですが、その後93.3~92.5にかけて増加します。さらに下では91.7~90.1にかけて、30万~55万ドル規模の複数クラスターが含まれています。94.1を失うと、93.3~92.5へ向けたスイープ(清算の連鎖)の確率が高まります。
📈 市場上では、ショート清算の流動性が95.3~96.1付近から形成され始め、96.1~96.9にかけて急速に増加します。最も強い近距離クラスターは96.5付近で、清算バーカは約90万ドルに接近しています。さらに外側では97.7~99.3にも注目すべき流動性があります。95.3を上抜けると、まず96.1~96.9が焦点になります。
🧭 全体のセットアップはやや下方向に有利です。下側のロング清算エクスポージャーが、概ね1.3~1.4倍大きいためです。94.1を失えば93.3~92.5へ向けたスイープの確率が高まり、95.3を上抜ければ注意は96.1~96.9へ移ります。
#LiquidationMap
23
·
--
ブリッシュ
$DRAM – 清算マップ(7日間)– 現在価格 56.5
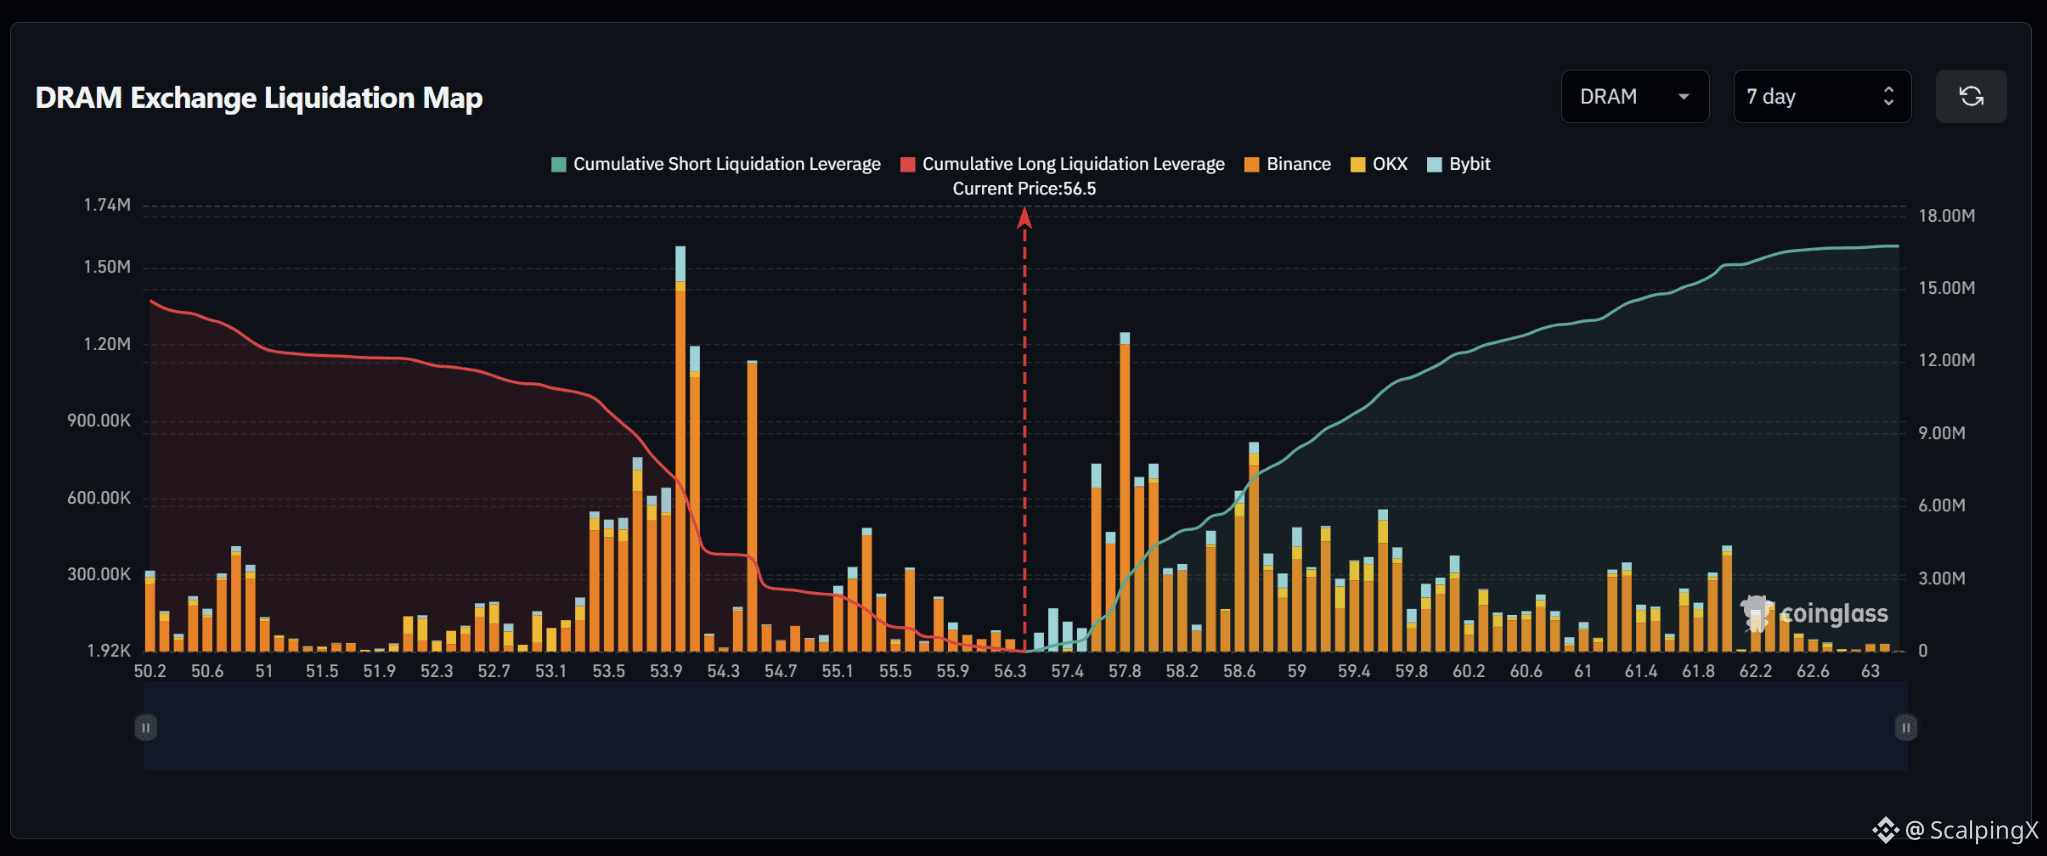
🔎 7日間の清算マップでは、現在価格より上で約1,600万ドルのショート清算が発生しており、現在価格より下でのロング清算(約1,400万〜1,500万ドル)をわずかに上回っています。全体の構造はおおむね均衡していますが、やや上方向に傾いています。
📉 市場の下側では、直近のロング清算の流動性が55.9〜55.1付近に集中しており、その後は54.7〜53.5にかけてはるかに密になります。最も強いクラスターは53.9〜54.3にあり、最大の清算バーは約160万ドルに達します。55.9を割り込むと、より大きな下方向のクラスターが視野に入る前に、55.1〜54.7へ向けたスイープの確率が高まります。
📈 市場の上側では、ショート清算の流動性が57.4付近から形成され始め、57.8〜58.6にかけて急激に増加します。57.8のクラスターが、清算バーが120万ドル超の水準で目立っており、58.6にも注目すべき流動性が含まれています。さらに外側の59.0〜59.8でも、比較的密度の高い流動性が維持されています。
🧭 より広い全体像としては、上方向がやや有利です。というのも、上側のショート清算エクスポージャーの方が大きいためです。57.4をブレイクすると57.8〜58.6へ向けたスイープの確率が高まり、55.9を失うと55.1〜54.7へ注意が移ります。
#LiquidationMap
$DRAM – 清算マップ(7日間)– 現在価格 56.5
🔎 7日間の清算マップでは、現在価格より上で約1,600万ドルのショート清算が発生しており、現在価格より下でのロング清算(約1,400万〜1,500万ドル)をわずかに上回っています。全体の構造はおおむね均衡していますが、やや上方向に傾いています。
📉 市場の下側では、直近のロング清算の流動性が55.9〜55.1付近に集中しており、その後は54.7〜53.5にかけてはるかに密になります。最も強いクラスターは53.9〜54.3にあり、最大の清算バーは約160万ドルに達します。55.9を割り込むと、より大きな下方向のクラスターが視野に入る前に、55.1〜54.7へ向けたスイープの確率が高まります。
📈 市場の上側では、ショート清算の流動性が57.4付近から形成され始め、57.8〜58.6にかけて急激に増加します。57.8のクラスターが、清算バーが120万ドル超の水準で目立っており、58.6にも注目すべき流動性が含まれています。さらに外側の59.0〜59.8でも、比較的密度の高い流動性が維持されています。
🧭 より広い全体像としては、上方向がやや有利です。というのも、上側のショート清算エクスポージャーの方が大きいためです。57.4をブレイクすると57.8〜58.6へ向けたスイープの確率が高まり、55.9を失うと55.1〜54.7へ注意が移ります。
#LiquidationMap
🔎 7日間の清算マップでは、現在価格より上で約1,600万ドルのショート清算が発生しており、現在価格より下でのロング清算(約1,400万〜1,500万ドル)をわずかに上回っています。全体の構造はおおむね均衡していますが、やや上方向に傾いています。
📉 市場の下側では、直近のロング清算の流動性が55.9〜55.1付近に集中しており、その後は54.7〜53.5にかけてはるかに密になります。最も強いクラスターは53.9〜54.3にあり、最大の清算バーは約160万ドルに達します。55.9を割り込むと、より大きな下方向のクラスターが視野に入る前に、55.1〜54.7へ向けたスイープの確率が高まります。
📈 市場の上側では、ショート清算の流動性が57.4付近から形成され始め、57.8〜58.6にかけて急激に増加します。57.8のクラスターが、清算バーが120万ドル超の水準で目立っており、58.6にも注目すべき流動性が含まれています。さらに外側の59.0〜59.8でも、比較的密度の高い流動性が維持されています。
🧭 より広い全体像としては、上方向がやや有利です。というのも、上側のショート清算エクスポージャーの方が大きいためです。57.4をブレイクすると57.8〜58.6へ向けたスイープの確率が高まり、55.9を失うと55.1〜54.7へ注意が移ります。
#LiquidationMap
65
·
--
ブリッシュ
翻訳参照
$PAXG – Liquidation Map (7 Days) – Current Price 4,445.5
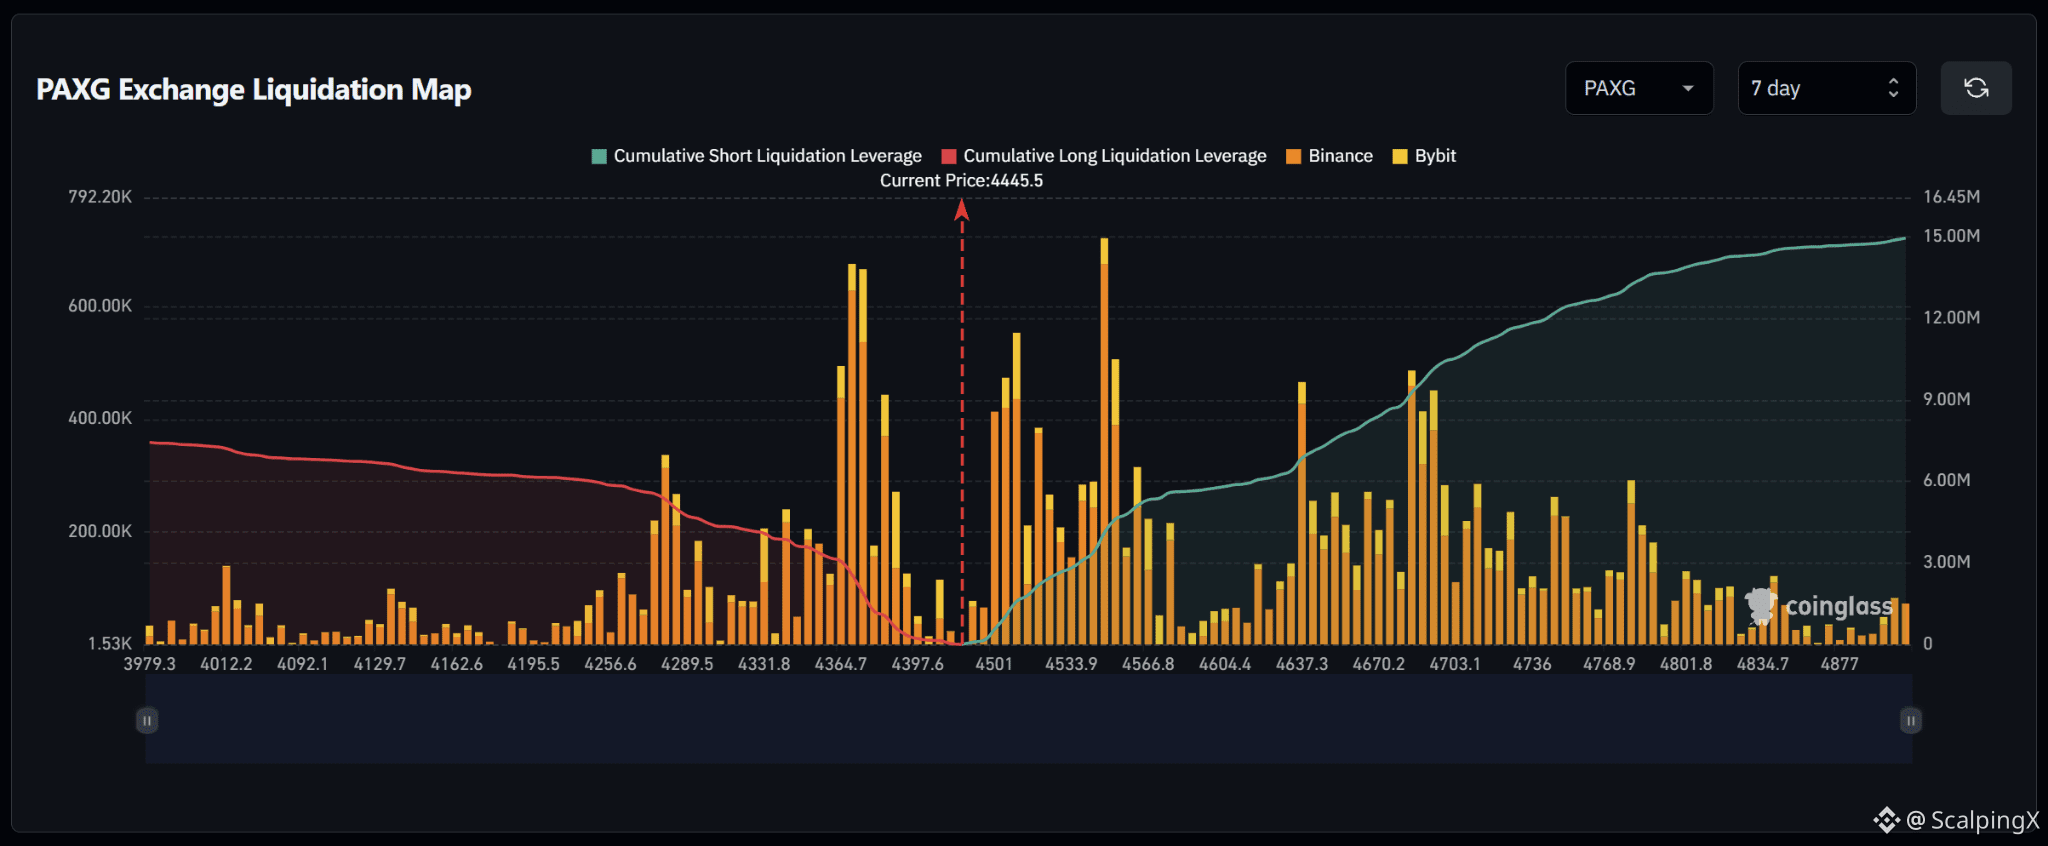
🔎 The 7-day liquidation map shows roughly $15 million in short liquidations above the current price, significantly exceeding approximately $6.5–7 million in long liquidations below. The liquidity structure therefore clearly favors the upside, with roughly 2.2 times more cumulative liquidity sitting above the market.
📉 Below the market, long-liquidation liquidity is concentrated heavily around 4,397.6–4,364.7. The strongest cluster sits near 4,364.7, where liquidation bars reach roughly $650,000–700,000, while 4,331.8–4,289.5 also contains notable liquidity. Losing 4,397.6 would increase the probability of a sweep toward 4,364.7–4,331.8.
📈 Above the market, short-liquidation liquidity begins building from 4,501 and increases sharply across 4,533.9–4,566.8. The strongest cluster sits around 4,550, where the liquidation bar exceeds $700,000. Further out, 4,637.3–4,703.1 also contains substantial liquidity. A break above 4,501 would bring 4,533.9–4,566.8 into focus next.
🧭 The broader setup favors the upside because short-liquidation exposure above is roughly 2.2 times larger. Breaking 4,501 would increase the probability of a sweep toward 4,533.9–4,566.8, while losing 4,397.6 would shift attention toward 4,364.7–4,331.8.
#LiquidationMap
$PAXG – Liquidation Map (7 Days) – Current Price 4,445.5
🔎 The 7-day liquidation map shows roughly $15 million in short liquidations above the current price, significantly exceeding approximately $6.5–7 million in long liquidations below. The liquidity structure therefore clearly favors the upside, with roughly 2.2 times more cumulative liquidity sitting above the market.
📉 Below the market, long-liquidation liquidity is concentrated heavily around 4,397.6–4,364.7. The strongest cluster sits near 4,364.7, where liquidation bars reach roughly $650,000–700,000, while 4,331.8–4,289.5 also contains notable liquidity. Losing 4,397.6 would increase the probability of a sweep toward 4,364.7–4,331.8.
📈 Above the market, short-liquidation liquidity begins building from 4,501 and increases sharply across 4,533.9–4,566.8. The strongest cluster sits around 4,550, where the liquidation bar exceeds $700,000. Further out, 4,637.3–4,703.1 also contains substantial liquidity. A break above 4,501 would bring 4,533.9–4,566.8 into focus next.
🧭 The broader setup favors the upside because short-liquidation exposure above is roughly 2.2 times larger. Breaking 4,501 would increase the probability of a sweep toward 4,533.9–4,566.8, while losing 4,397.6 would shift attention toward 4,364.7–4,331.8.
#LiquidationMap
🔎 The 7-day liquidation map shows roughly $15 million in short liquidations above the current price, significantly exceeding approximately $6.5–7 million in long liquidations below. The liquidity structure therefore clearly favors the upside, with roughly 2.2 times more cumulative liquidity sitting above the market.
📉 Below the market, long-liquidation liquidity is concentrated heavily around 4,397.6–4,364.7. The strongest cluster sits near 4,364.7, where liquidation bars reach roughly $650,000–700,000, while 4,331.8–4,289.5 also contains notable liquidity. Losing 4,397.6 would increase the probability of a sweep toward 4,364.7–4,331.8.
📈 Above the market, short-liquidation liquidity begins building from 4,501 and increases sharply across 4,533.9–4,566.8. The strongest cluster sits around 4,550, where the liquidation bar exceeds $700,000. Further out, 4,637.3–4,703.1 also contains substantial liquidity. A break above 4,501 would bring 4,533.9–4,566.8 into focus next.
🧭 The broader setup favors the upside because short-liquidation exposure above is roughly 2.2 times larger. Breaking 4,501 would increase the probability of a sweep toward 4,533.9–4,566.8, while losing 4,397.6 would shift attention toward 4,364.7–4,331.8.
#LiquidationMap
21
·
--
ブリッシュ
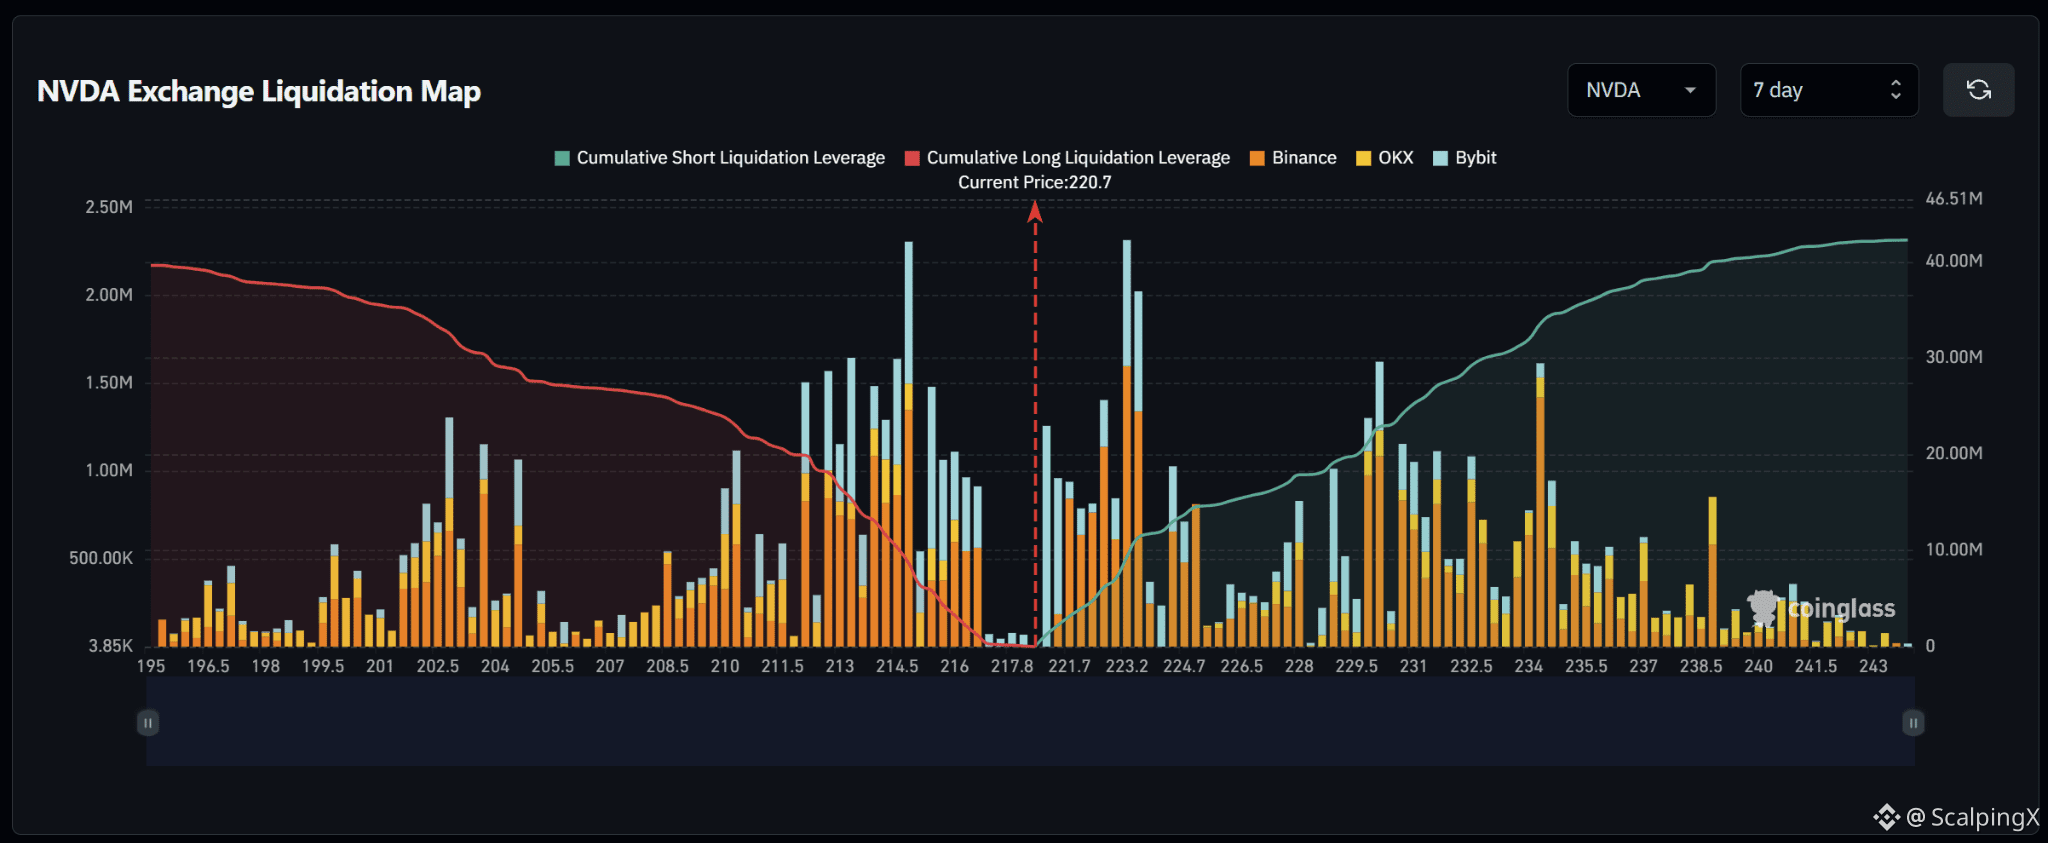
$NVDA – 清算マップ(7日)– 現在価格 220.7
🔎 7日間の清算マップは、現在価格を上回る位置でおよそ4200万のショート清算が発生しており、下回る位置でのロング清算(約4000万ドル)をわずかに上回っています。全体の構造は比較的バランスが取れていますが、やや上方向に傾いています。
📉 市場の下側では、近いロング清算の流動性が
217.8〜214.5に集中しています。最も強いクラスターは214.5付近で、清算バーが220万ドル超となっており、さらに213.0〜216.0にもかなりの流動性があります。217.8を失うと、216.0〜214.5に向けたスイープ(踏み上げ)の確率が高まります。
📈 市場の上側では、ショート清算の流動性が221.7あたりから形成され始め、223.2〜224.7にかけて急激に増加します。223.2付近のクラスターが目立っており、清算バーは220万ドル超です。さらに遠い229.5〜234.0にも、いくつかの大きなクラスターがあります。221.7を上抜けると、まず223.2〜224.7が注目されます。
🧭 全体の仕掛けは比較的バランスしていますが、やや上方向に有利です。221.7をブレイクすれば、223.2〜224.7へ向けたショート清算のスイープの確率が高まり、217.8を失えば、216.0〜214.5に注意が移ります。
#LiquidationMap
$NVDA – 清算マップ(7日)– 現在価格 220.7
🔎 7日間の清算マップは、現在価格を上回る位置でおよそ4200万のショート清算が発生しており、下回る位置でのロング清算(約4000万ドル)をわずかに上回っています。全体の構造は比較的バランスが取れていますが、やや上方向に傾いています。
📉 市場の下側では、近いロング清算の流動性が
217.8〜214.5に集中しています。最も強いクラスターは214.5付近で、清算バーが220万ドル超となっており、さらに213.0〜216.0にもかなりの流動性があります。217.8を失うと、216.0〜214.5に向けたスイープ(踏み上げ)の確率が高まります。
📈 市場の上側では、ショート清算の流動性が221.7あたりから形成され始め、223.2〜224.7にかけて急激に増加します。223.2付近のクラスターが目立っており、清算バーは220万ドル超です。さらに遠い229.5〜234.0にも、いくつかの大きなクラスターがあります。221.7を上抜けると、まず223.2〜224.7が注目されます。
🧭 全体の仕掛けは比較的バランスしていますが、やや上方向に有利です。221.7をブレイクすれば、223.2〜224.7へ向けたショート清算のスイープの確率が高まり、217.8を失えば、216.0〜214.5に注意が移ります。
#LiquidationMap
🔎 7日間の清算マップは、現在価格を上回る位置でおよそ4200万のショート清算が発生しており、下回る位置でのロング清算(約4000万ドル)をわずかに上回っています。全体の構造は比較的バランスが取れていますが、やや上方向に傾いています。
📉 市場の下側では、近いロング清算の流動性が
217.8〜214.5に集中しています。最も強いクラスターは214.5付近で、清算バーが220万ドル超となっており、さらに213.0〜216.0にもかなりの流動性があります。217.8を失うと、216.0〜214.5に向けたスイープ(踏み上げ)の確率が高まります。
📈 市場の上側では、ショート清算の流動性が221.7あたりから形成され始め、223.2〜224.7にかけて急激に増加します。223.2付近のクラスターが目立っており、清算バーは220万ドル超です。さらに遠い229.5〜234.0にも、いくつかの大きなクラスターがあります。221.7を上抜けると、まず223.2〜224.7が注目されます。
🧭 全体の仕掛けは比較的バランスしていますが、やや上方向に有利です。221.7をブレイクすれば、223.2〜224.7へ向けたショート清算のスイープの確率が高まり、217.8を失えば、216.0〜214.5に注意が移ります。
#LiquidationMap
19
·
--
ブリッシュ
翻訳参照
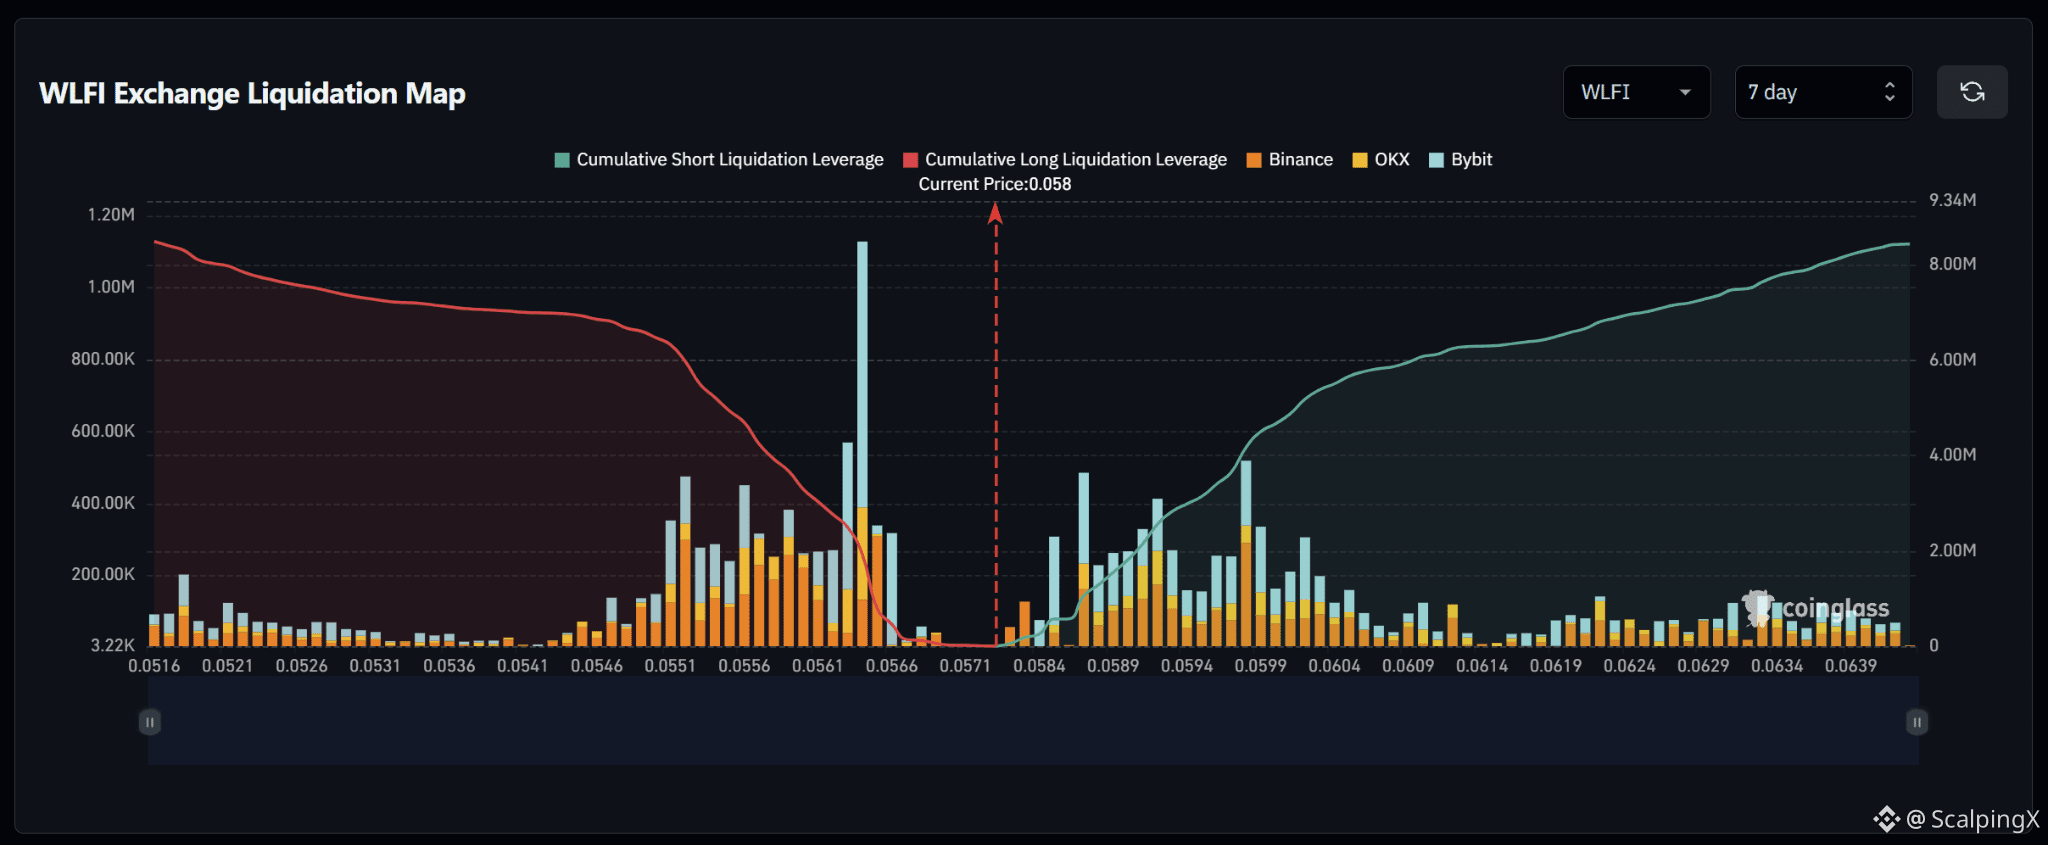
$WLFI – Liquidation Map (7 Days) – Current Price 0.0580
🔎 The 7-day liquidation map shows a fairly balanced liquidity structure, with both long liquidations below and short liquidations above sitting around $8–9 million. The overall setup is therefore close to neutral, without a strong directional imbalance.
📉 Below the market, long-liquidation liquidity is concentrated heavily around 0.0566–0.0551. The strongest cluster sits near 0.0563, where the liquidation bar exceeds 1 million, while 0.0556–0.0551 also contains substantial liquidity. Losing 0.0566 would increase the probability of a sweep toward 0.0561–0.0556.
📈 Above the market, short-liquidation liquidity begins building around 0.0584 and becomes denser across 0.0589–0.0604. The strongest nearby clusters sit around 0.0589 and 0.0599, with liquidation bars reaching roughly $400,000–500,000. A break above 0.0584 would bring 0.0589–0.0599 into focus first.
🧭 The broader setup remains relatively balanced. Breaking 0.0584 would increase the probability of a short-liquidation sweep toward 0.0589–0.0599, while losing 0.0566 would shift attention toward 0.0561–0.0556.
#LiquidationMap
$WLFI – Liquidation Map (7 Days) – Current Price 0.0580
🔎 The 7-day liquidation map shows a fairly balanced liquidity structure, with both long liquidations below and short liquidations above sitting around $8–9 million. The overall setup is therefore close to neutral, without a strong directional imbalance.
📉 Below the market, long-liquidation liquidity is concentrated heavily around 0.0566–0.0551. The strongest cluster sits near 0.0563, where the liquidation bar exceeds 1 million, while 0.0556–0.0551 also contains substantial liquidity. Losing 0.0566 would increase the probability of a sweep toward 0.0561–0.0556.
📈 Above the market, short-liquidation liquidity begins building around 0.0584 and becomes denser across 0.0589–0.0604. The strongest nearby clusters sit around 0.0589 and 0.0599, with liquidation bars reaching roughly $400,000–500,000. A break above 0.0584 would bring 0.0589–0.0599 into focus first.
🧭 The broader setup remains relatively balanced. Breaking 0.0584 would increase the probability of a short-liquidation sweep toward 0.0589–0.0599, while losing 0.0566 would shift attention toward 0.0561–0.0556.
#LiquidationMap
🔎 The 7-day liquidation map shows a fairly balanced liquidity structure, with both long liquidations below and short liquidations above sitting around $8–9 million. The overall setup is therefore close to neutral, without a strong directional imbalance.
📉 Below the market, long-liquidation liquidity is concentrated heavily around 0.0566–0.0551. The strongest cluster sits near 0.0563, where the liquidation bar exceeds 1 million, while 0.0556–0.0551 also contains substantial liquidity. Losing 0.0566 would increase the probability of a sweep toward 0.0561–0.0556.
📈 Above the market, short-liquidation liquidity begins building around 0.0584 and becomes denser across 0.0589–0.0604. The strongest nearby clusters sit around 0.0589 and 0.0599, with liquidation bars reaching roughly $400,000–500,000. A break above 0.0584 would bring 0.0589–0.0599 into focus first.
🧭 The broader setup remains relatively balanced. Breaking 0.0584 would increase the probability of a short-liquidation sweep toward 0.0589–0.0599, while losing 0.0566 would shift attention toward 0.0561–0.0556.
#LiquidationMap
8
·
--
ブリッシュ
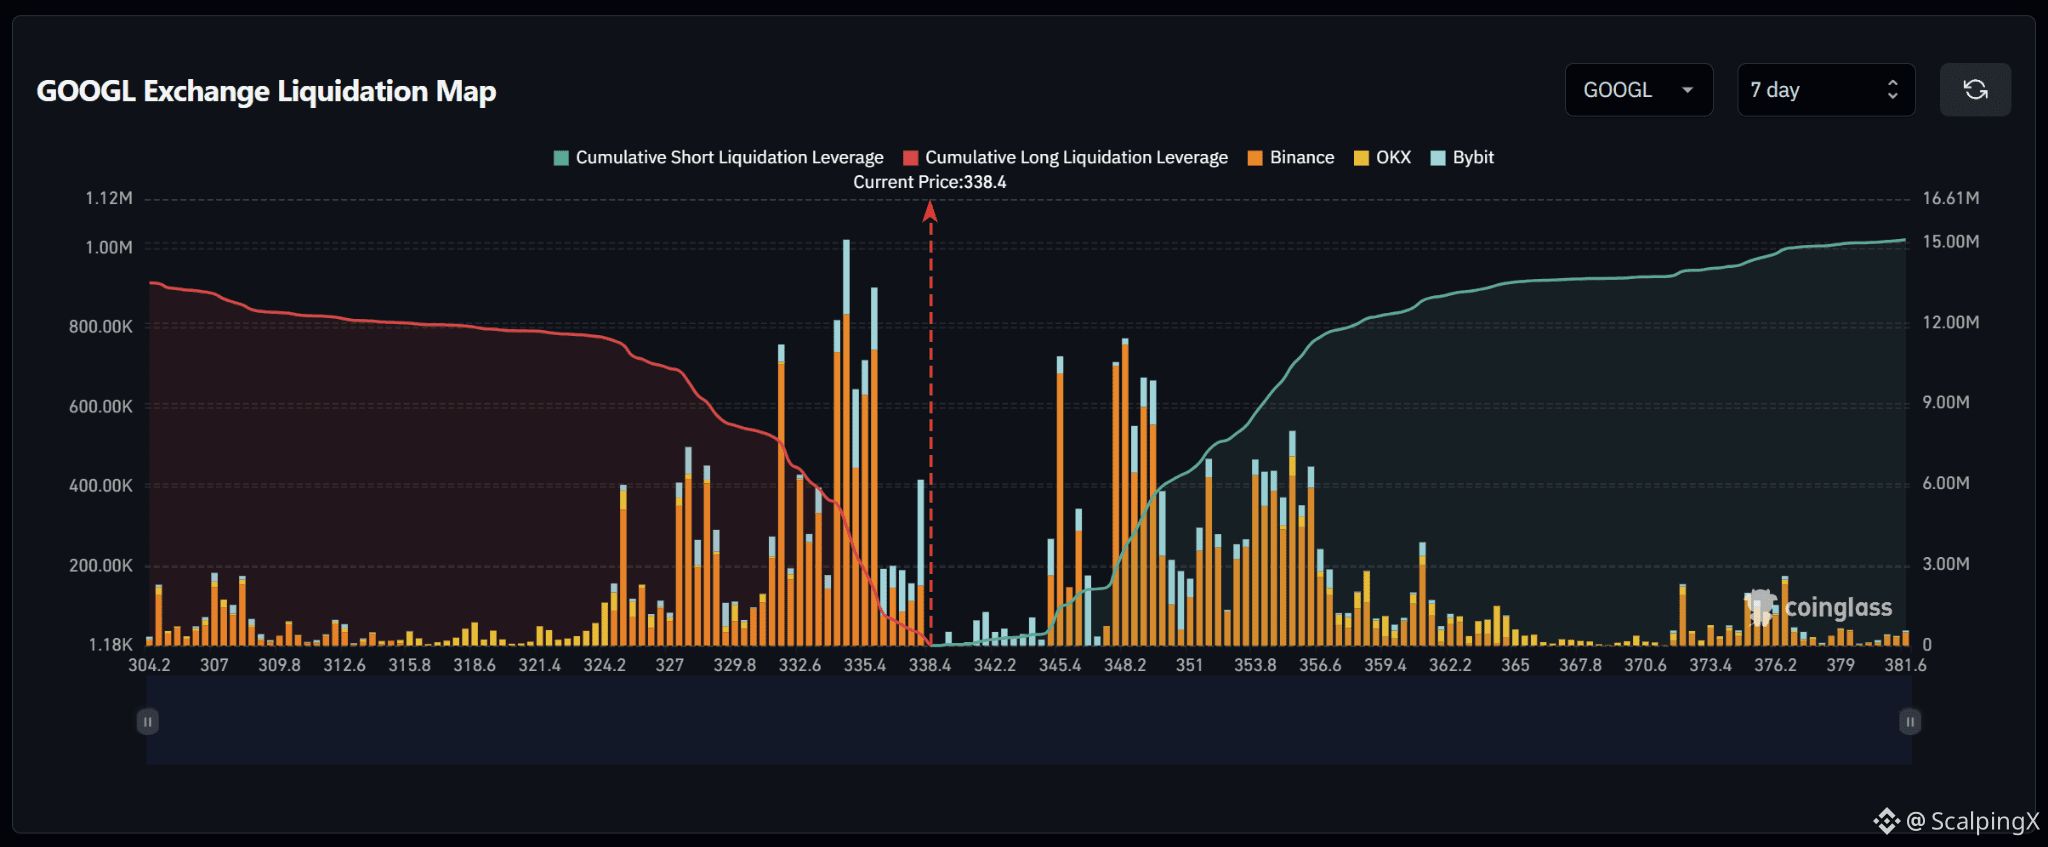
$GOOGL – 清算マップ(7日間)– 現在価格 338.4
🔎 7日間の清算マップは、現在価格を上回るところで約1,500万ドルのショート清算が発生していることを示しており、下回るロング清算は約1,300万ドル程度です。全体としてはかなりバランスが取れていますが、わずかに上方向(強気側)に傾いており、市場より上の累積流動性が約1.15倍あります。
📉 市場下では、ロング清算の流動性が 335.4〜332.6 付近に強く集中しています。最も強いクラスターは 335.4 と 334.0 の近くにあり、清算バーは約90万〜100万ドルに接近しています。一方で 332.6 も注目すべき流動性を含んでいます。335.4を失うと、334.0〜332.6 へ向けたスイープ(巻き込み)の確率が高まります。
📈 市場上では、338.4〜342.2 の間は流動性が比較的薄いままですが、ショート清算側のエクスポージャーは 345.4 から急激に増加します。強いクラスターは 345.4 と 348.2〜351.0 のあたりに見られ、複数のバーが約60万〜80万ドルに達しています。342.2 を上抜けると、次に 345.4〜348.2 が焦点になります。
🧭 より広い仕掛け(セットアップ)は、上方向をやや支持します。上側のショート清算エクスポージャーのほうが大きいためです。342.2 をブレイクすれば 345.4〜348.2 へスイープする確率が高まり、335.4 を失えば注意が 334.0〜332.6 へ移ります。
#LiquidationMap
$GOOGL – 清算マップ(7日間)– 現在価格 338.4
🔎 7日間の清算マップは、現在価格を上回るところで約1,500万ドルのショート清算が発生していることを示しており、下回るロング清算は約1,300万ドル程度です。全体としてはかなりバランスが取れていますが、わずかに上方向(強気側)に傾いており、市場より上の累積流動性が約1.15倍あります。
📉 市場下では、ロング清算の流動性が 335.4〜332.6 付近に強く集中しています。最も強いクラスターは 335.4 と 334.0 の近くにあり、清算バーは約90万〜100万ドルに接近しています。一方で 332.6 も注目すべき流動性を含んでいます。335.4を失うと、334.0〜332.6 へ向けたスイープ(巻き込み)の確率が高まります。
📈 市場上では、338.4〜342.2 の間は流動性が比較的薄いままですが、ショート清算側のエクスポージャーは 345.4 から急激に増加します。強いクラスターは 345.4 と 348.2〜351.0 のあたりに見られ、複数のバーが約60万〜80万ドルに達しています。342.2 を上抜けると、次に 345.4〜348.2 が焦点になります。
🧭 より広い仕掛け(セットアップ)は、上方向をやや支持します。上側のショート清算エクスポージャーのほうが大きいためです。342.2 をブレイクすれば 345.4〜348.2 へスイープする確率が高まり、335.4 を失えば注意が 334.0〜332.6 へ移ります。
#LiquidationMap
🔎 7日間の清算マップは、現在価格を上回るところで約1,500万ドルのショート清算が発生していることを示しており、下回るロング清算は約1,300万ドル程度です。全体としてはかなりバランスが取れていますが、わずかに上方向(強気側)に傾いており、市場より上の累積流動性が約1.15倍あります。
📉 市場下では、ロング清算の流動性が 335.4〜332.6 付近に強く集中しています。最も強いクラスターは 335.4 と 334.0 の近くにあり、清算バーは約90万〜100万ドルに接近しています。一方で 332.6 も注目すべき流動性を含んでいます。335.4を失うと、334.0〜332.6 へ向けたスイープ(巻き込み)の確率が高まります。
📈 市場上では、338.4〜342.2 の間は流動性が比較的薄いままですが、ショート清算側のエクスポージャーは 345.4 から急激に増加します。強いクラスターは 345.4 と 348.2〜351.0 のあたりに見られ、複数のバーが約60万〜80万ドルに達しています。342.2 を上抜けると、次に 345.4〜348.2 が焦点になります。
🧭 より広い仕掛け(セットアップ)は、上方向をやや支持します。上側のショート清算エクスポージャーのほうが大きいためです。342.2 をブレイクすれば 345.4〜348.2 へスイープする確率が高まり、335.4 を失えば注意が 334.0〜332.6 へ移ります。
#LiquidationMap
23
·
--
ブリッシュ
翻訳参照
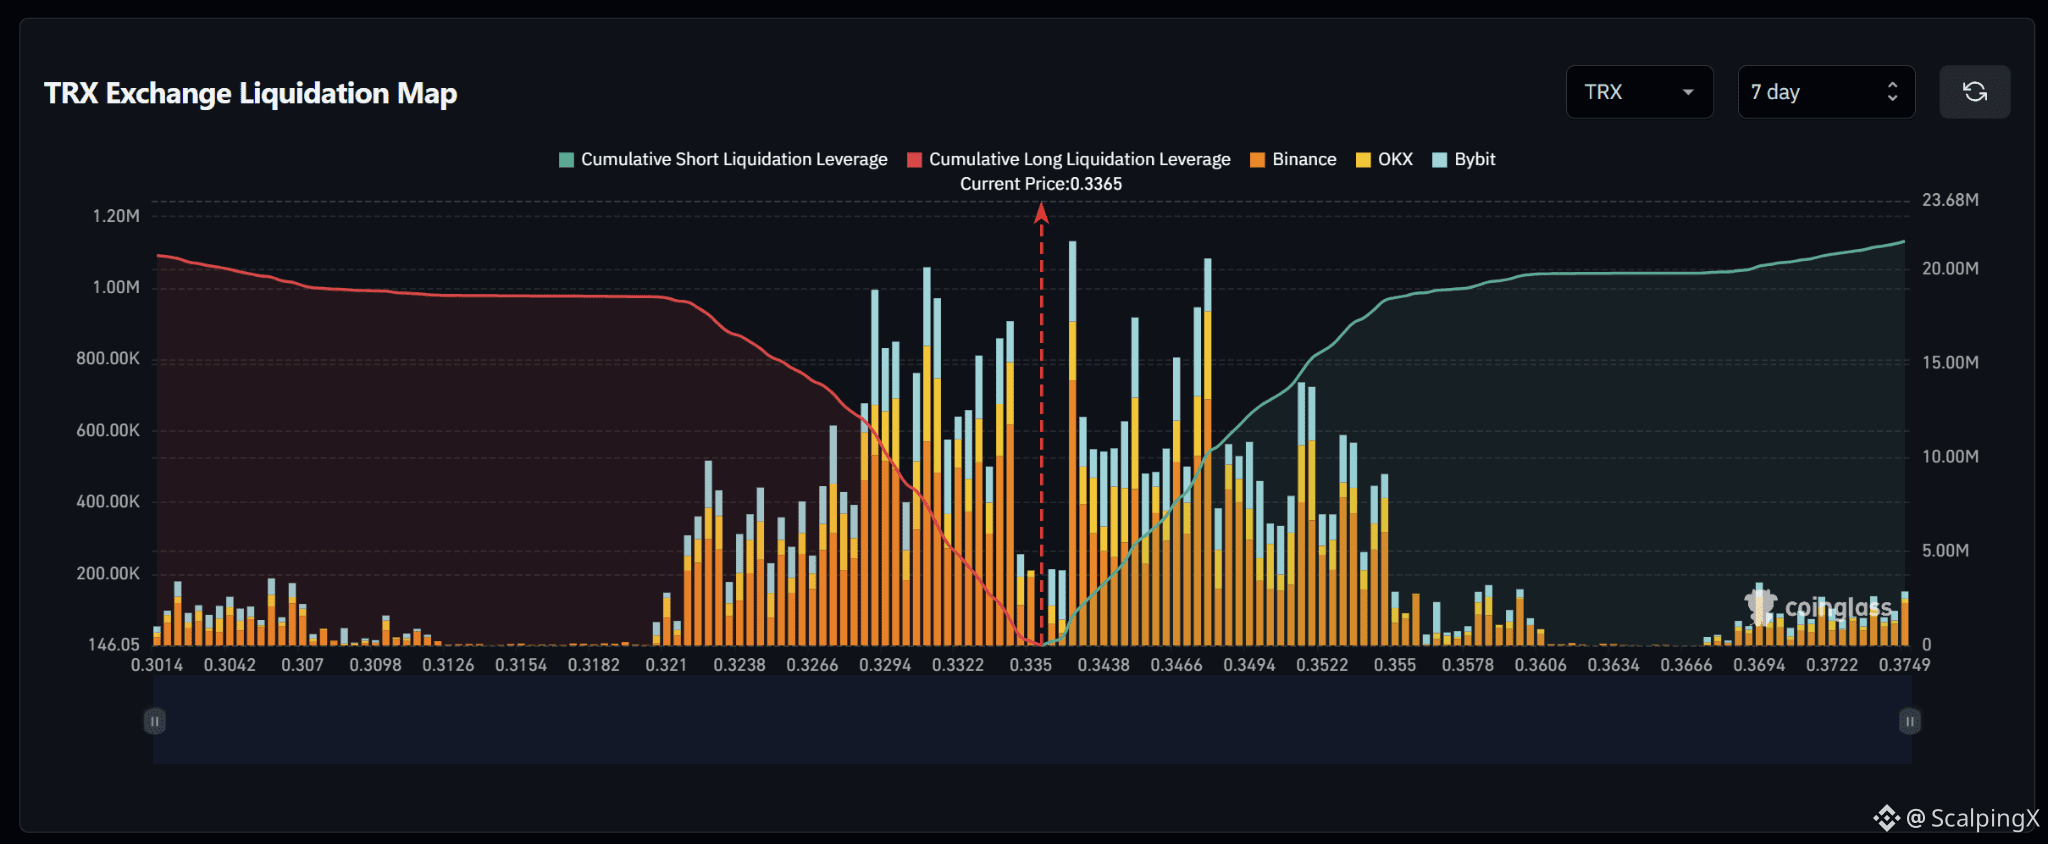
$TRX – Liquidation Map (7 Days) – Current Price 0.3365
🔎 The 7-day liquidation map shows a fairly balanced liquidity structure, with roughly $21–22 million in short liquidations above the current price and around $21 million in long liquidations below. The overall setup is therefore close to neutral but modestly tilted to the upside.
📉 Below the market, nearby long-liquidation liquidity is concentrated heavily around 0.3332–0.3294. Several liquidation bars in this zone reach roughly $800,000–1 million, while 0.3266–0.3238 also contains notable liquidity. Losing 0.3350 would increase the probability of a sweep toward 0.3332–0.3294.
📈 Above the market, short-liquidation liquidity begins building sharply around 0.3438–0.3494. The strongest clusters sit near 0.3438 and 0.3466–0.3494, with several bars exceeding 1 million. Further out, 0.3522–0.3550 also contains notable liquidity.
🧭 The broader setup is relatively balanced but modestly favors the upside. Breaking 0.3438 would increase the probability of a sweep toward 0.3466–0.3494, while losing 0.3350 would shift attention toward 0.3332–0.3294.
#LiquidationMap
$TRX – Liquidation Map (7 Days) – Current Price 0.3365
🔎 The 7-day liquidation map shows a fairly balanced liquidity structure, with roughly $21–22 million in short liquidations above the current price and around $21 million in long liquidations below. The overall setup is therefore close to neutral but modestly tilted to the upside.
📉 Below the market, nearby long-liquidation liquidity is concentrated heavily around 0.3332–0.3294. Several liquidation bars in this zone reach roughly $800,000–1 million, while 0.3266–0.3238 also contains notable liquidity. Losing 0.3350 would increase the probability of a sweep toward 0.3332–0.3294.
📈 Above the market, short-liquidation liquidity begins building sharply around 0.3438–0.3494. The strongest clusters sit near 0.3438 and 0.3466–0.3494, with several bars exceeding 1 million. Further out, 0.3522–0.3550 also contains notable liquidity.
🧭 The broader setup is relatively balanced but modestly favors the upside. Breaking 0.3438 would increase the probability of a sweep toward 0.3466–0.3494, while losing 0.3350 would shift attention toward 0.3332–0.3294.
#LiquidationMap
🔎 The 7-day liquidation map shows a fairly balanced liquidity structure, with roughly $21–22 million in short liquidations above the current price and around $21 million in long liquidations below. The overall setup is therefore close to neutral but modestly tilted to the upside.
📉 Below the market, nearby long-liquidation liquidity is concentrated heavily around 0.3332–0.3294. Several liquidation bars in this zone reach roughly $800,000–1 million, while 0.3266–0.3238 also contains notable liquidity. Losing 0.3350 would increase the probability of a sweep toward 0.3332–0.3294.
📈 Above the market, short-liquidation liquidity begins building sharply around 0.3438–0.3494. The strongest clusters sit near 0.3438 and 0.3466–0.3494, with several bars exceeding 1 million. Further out, 0.3522–0.3550 also contains notable liquidity.
🧭 The broader setup is relatively balanced but modestly favors the upside. Breaking 0.3438 would increase the probability of a sweep toward 0.3466–0.3494, while losing 0.3350 would shift attention toward 0.3332–0.3294.
#LiquidationMap
18
ログインして、さらにコンテンツを読む
厳選トピックで世界の暗号資産トレーダーの仲間入り
⚡️ 暗号資産に関する最新かつ有益な情報が見つかります。
💬 世界最大の暗号資産取引所から信頼されています。
👍 認証を受けたクリエイターから、有益なインサイトを得られます。
メール / 電話番号
トレンドトピック
1
#OstiumLoanDisputeHearingSetInNYFederalCourt
閲覧回数 386
49人が討論中
2
#SKPoliceRefer18PolymarketUsersToProsecutors
閲覧回数 2,091
115人が討論中
3
#FedSEPProjects2026RateAt4.1%
閲覧回数 5,162
176人が討論中
4
#USHouseAdvancesBitcoinReserveBill
閲覧回数 4,028
146人が討論中
5
#AmazonGetsWarrantsToBuyGeneracStock
閲覧回数 4,748
158人が討論中
6
#DotPlotSignalsOneMoreHikeIn2026
閲覧回数 25,498
533人が討論中
7
#RobinhoodToSupportCircleArcNetwork
閲覧回数 7,686
184人が討論中
8
#FedHikes25BpsUSStocksClose
閲覧回数 37,239
448人が討論中
9
#AaveToLaunchRWAMarketOnAvalanche
閲覧回数 8,579
195人が討論中
10
#CryptoVCFundingRebounds$5.6BInQ2
閲覧回数 8,956
48人が討論中