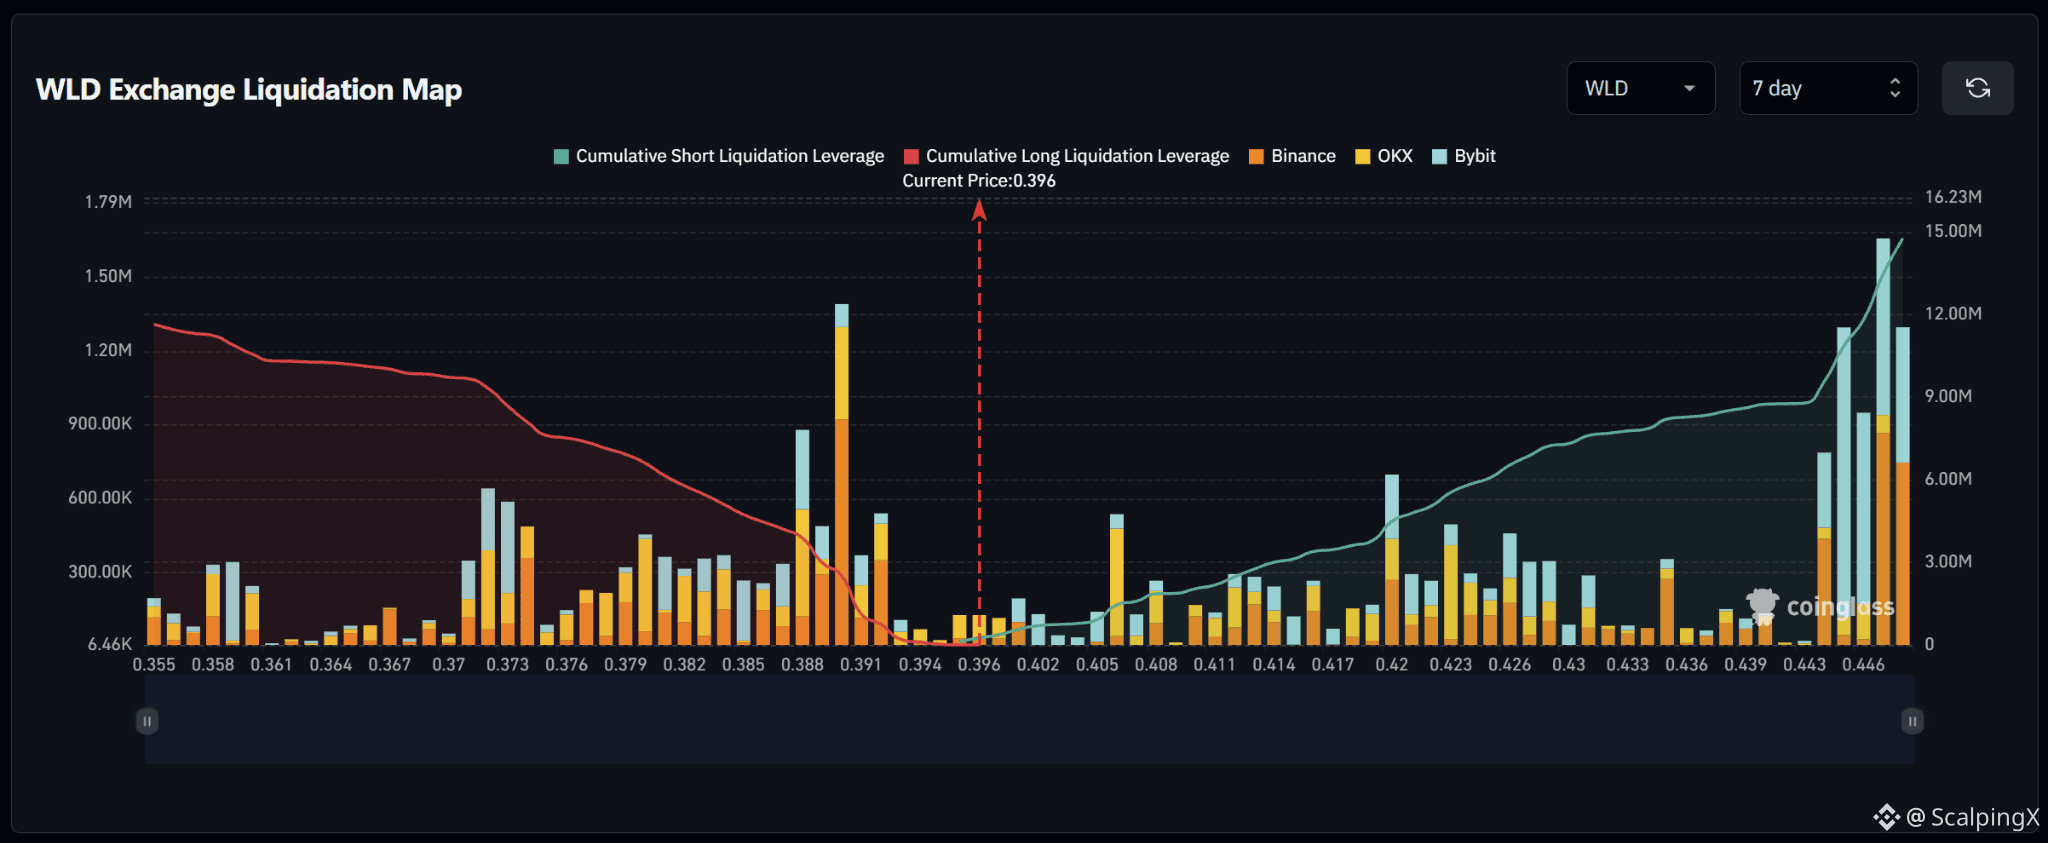
$WLD – Liquidation Map (7 days) – Index ~0.396
🧭 The preferred scenario is a downside long sweep first. The nearby 0.388–0.392 band has prominent liquidation density. Cumulative short exposure is larger across the displayed range, but a substantial portion sits farther away at 0.444–0.448.
🔻 Losing 0.394 without a reclaim shifts attention to 0.388–0.392, particularly near 0.390. Long liquidations there could amplify the decline; the reaction after the sweep will help assess continuation.
🎯 A further break below 0.388 brings 0.379–0.385, then 0.371–0.374, into focus. Conversely, sweeping the long cluster and quickly reclaiming 0.392 would weaken the case for further declines.
⚖️ A break and hold above 0.402 shifts priority to short clusters at 0.406–0.408, followed by 0.420–0.423 if momentum persists. The large 0.444–0.448 band remains a farther target, with relatively thin density through 0.431–0.443.
#LiquidationMap
🧭 The preferred scenario is a downside long sweep first. The nearby 0.388–0.392 band has prominent liquidation density. Cumulative short exposure is larger across the displayed range, but a substantial portion sits farther away at 0.444–0.448.
🔻 Losing 0.394 without a reclaim shifts attention to 0.388–0.392, particularly near 0.390. Long liquidations there could amplify the decline; the reaction after the sweep will help assess continuation.
🎯 A further break below 0.388 brings 0.379–0.385, then 0.371–0.374, into focus. Conversely, sweeping the long cluster and quickly reclaiming 0.392 would weaken the case for further declines.
⚖️ A break and hold above 0.402 shifts priority to short clusters at 0.406–0.408, followed by 0.420–0.423 if momentum persists. The large 0.444–0.448 band remains a farther target, with relatively thin density through 0.431–0.443.
#LiquidationMap