
#nvdab
nvdab
閲覧回数 74,490
1,902人が討論中
注目
最新

·
--
本人確認中
$NVDAB 先週、黄仁勲が辞任したときに悪材料は出尽くしたと思い
安値で買い増せると思いました
160ドルでエヌビディア株を20株買いました$NVDAB
今はすでに155ドルまで下がっています
決算は良いはずだと思って
ずっと持ち続けています
ここ数日を見ると
悪いニュースが次々と出てきています
このまま持ち続けて
明日の決算を待つべきでしょうか?
#NVDAB
$NVDAB 先週、黄仁勲が辞任したときに悪材料は出尽くしたと思い
安値で買い増せると思いました
160ドルでエヌビディア株を20株買いました$NVDAB
今はすでに155ドルまで下がっています
決算は良いはずだと思って
ずっと持ち続けています
ここ数日を見ると
悪いニュースが次々と出てきています
このまま持ち続けて
明日の決算を待つべきでしょうか?
#NVDAB
安値で買い増せると思いました
160ドルでエヌビディア株を20株買いました$NVDAB
今はすでに155ドルまで下がっています
決算は良いはずだと思って
ずっと持ち続けています
ここ数日を見ると
悪いニュースが次々と出てきています
このまま持ち続けて
明日の決算を待つべきでしょうか?
#NVDAB
EJMS2710:
viste amigo 🚀🚀🚀
5
3
2.5k

·
--
一部該当
🔔 緊急:Nvidia($NVDA)、第3四半期に売上高1,558億4,000万ドルを記録し、予想を上回る
📰 Nvidia($NVDA)は、第3四半期(Q3)の決算を発表し、売上高は1,558億4,000万ドルとなりました。
❌ これらの結果は、アナリストや市場の予測を上回りました。
⬅️ 市場への影響:Nvidiaの第3四半期売上高が予想を上回ったことで、投資家の信頼が高まり、NVDA株やテクノロジーセクターにプラスの影響を与えます。
$NVDAB
{spot}(NVDABUSDT)
#Square #NVDAB #اخبار_الكريبتو_العاجلة
🔔 緊急:Nvidia($NVDA)、第3四半期に売上高1,558億4,000万ドルを記録し、予想を上回る
📰 Nvidia($NVDA)は、第3四半期(Q3)の決算を発表し、売上高は1,558億4,000万ドルとなりました。
❌ これらの結果は、アナリストや市場の予測を上回りました。
⬅️ 市場への影響:Nvidiaの第3四半期売上高が予想を上回ったことで、投資家の信頼が高まり、NVDA株やテクノロジーセクターにプラスの影響を与えます。
$NVDAB
#Square #NVDAB #اخبار_الكريبتو_العاجلة
📰 Nvidia($NVDA)は、第3四半期(Q3)の決算を発表し、売上高は1,558億4,000万ドルとなりました。
❌ これらの結果は、アナリストや市場の予測を上回りました。
⬅️ 市場への影響:Nvidiaの第3四半期売上高が予想を上回ったことで、投資家の信頼が高まり、NVDA株やテクノロジーセクターにプラスの影響を与えます。
$NVDAB
#Square #NVDAB #اخبار_الكريبتو_العاجلة
Mohamed Alamin777:
لا لا هادي مش اشاعة كلام صحيح 😄 حتى انا حققت ارادات فاقت التوقعات في الربع الثالث بس ثلاث ارباعها طار في الربع الرابع وقريب طيرني من المنصة 😂
4
8
2.3k


本人確認中
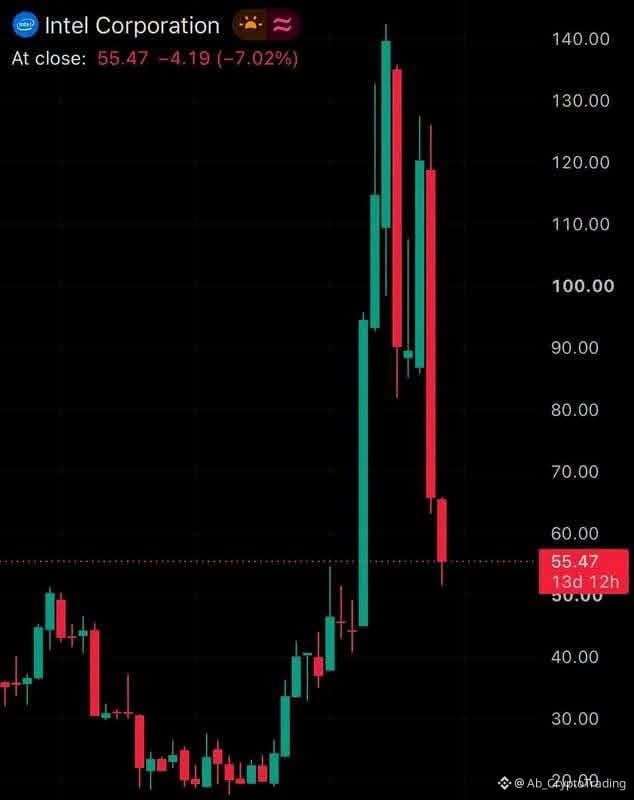
🚨 $NVDAB が$INTC.US に関するメッセージを送信しました。
世界有数の半導体メーカーの一つが、インテル株を5,370万株売却し、保有株式の約25%を減らしました。
報道によると、保有額にして約64億ドルの削減です。
さらに注目すべき点があります。
インテル株は9月末以降、53%以上下落しています。
しかし、ここで考えるべきなのは株価だけではありません。
$NVDAB のような企業が大規模な保有株を減らし始めたとき、それは単に利益を確定して資金を再配分しているのでしょうか。それとも、今後の投資機会に対する見方が変わったことを示しているのでしょうか。
本当の論点はここです。
インテルは割安な長期的再建投資の機会になりつつあるのでしょうか。それとも、市場は同社の競争力に自信を失いつつあるのでしょうか。
そして、おそらくもっと重要なのは……
あなたなら今の水準でINTCを買いますか?それとも様子見しますか?
#NVDAB #NvidiaEarningsTonight:AIStocks’NextMove? #NvidiaBoardNotConsideringHuang’sReturnasCEO
🚨 $NVDAB が$INTC.US に関するメッセージを送信しました。
世界有数の半導体メーカーの一つが、インテル株を5,370万株売却し、保有株式の約25%を減らしました。
報道によると、保有額にして約64億ドルの削減です。
さらに注目すべき点があります。
インテル株は9月末以降、53%以上下落しています。
しかし、ここで考えるべきなのは株価だけではありません。
$NVDAB のような企業が大規模な保有株を減らし始めたとき、それは単に利益を確定して資金を再配分しているのでしょうか。それとも、今後の投資機会に対する見方が変わったことを示しているのでしょうか。
本当の論点はここです。
インテルは割安な長期的再建投資の機会になりつつあるのでしょうか。それとも、市場は同社の競争力に自信を失いつつあるのでしょうか。
そして、おそらくもっと重要なのは……
あなたなら今の水準でINTCを買いますか?それとも様子見しますか?
#NVDAB #NvidiaEarningsTonight:AIStocks’NextMove? #NvidiaBoardNotConsideringHuang’sReturnasCEO
世界有数の半導体メーカーの一つが、インテル株を5,370万株売却し、保有株式の約25%を減らしました。
報道によると、保有額にして約64億ドルの削減です。
さらに注目すべき点があります。
インテル株は9月末以降、53%以上下落しています。
しかし、ここで考えるべきなのは株価だけではありません。
$NVDAB のような企業が大規模な保有株を減らし始めたとき、それは単に利益を確定して資金を再配分しているのでしょうか。それとも、今後の投資機会に対する見方が変わったことを示しているのでしょうか。
本当の論点はここです。
インテルは割安な長期的再建投資の機会になりつつあるのでしょうか。それとも、市場は同社の競争力に自信を失いつつあるのでしょうか。
そして、おそらくもっと重要なのは……
あなたなら今の水準でINTCを買いますか?それとも様子見しますか?
#NVDAB #NvidiaEarningsTonight:AIStocks’NextMove? #NvidiaBoardNotConsideringHuang’sReturnasCEO
steamerr:
雪上加霜真是半山腰了这下!
1
2
944

·
--
翻訳参照
$NVDAB volume is struggling despite a 1.77% gain to $160.39.
Current quote volume at $125.57M accompanies a low hourly participation rate of 0.09x the 23-hour average. This suggests the recent move lacks significant institutional conviction.
A bullish scenario requires a clean breakout above the $163.83 range high on rising volume to prove sustained interest. Conversely, failing to hold the $150.45 range low could invalidate current momentum.
If volume remains this stagnant, is the current price appreciation a sign of exhaustion or merely consolidation before a larger move?
Tap $NVDAB for the live chart. #NVDAB #BinanceSquare
$NVDAB volume is struggling despite a 1.77% gain to $160.39.
Current quote volume at $125.57M accompanies a low hourly participation rate of 0.09x the 23-hour average. This suggests the recent move lacks significant institutional conviction.
A bullish scenario requires a clean breakout above the $163.83 range high on rising volume to prove sustained interest. Conversely, failing to hold the $150.45 range low could invalidate current momentum.
If volume remains this stagnant, is the current price appreciation a sign of exhaustion or merely consolidation before a larger move?
Tap $NVDAB for the live chart. #NVDAB #BinanceSquare
Current quote volume at $125.57M accompanies a low hourly participation rate of 0.09x the 23-hour average. This suggests the recent move lacks significant institutional conviction.
A bullish scenario requires a clean breakout above the $163.83 range high on rising volume to prove sustained interest. Conversely, failing to hold the $150.45 range low could invalidate current momentum.
If volume remains this stagnant, is the current price appreciation a sign of exhaustion or merely consolidation before a larger move?
Tap $NVDAB for the live chart. #NVDAB #BinanceSquare
1


·
--
NVIDIA、第3四半期売上高1,158億ドル:黄仁勳氏は復帰せず、NVDABは157で買えるかNVIDIAは第3四半期に「記録ずくめ」の業績を達成した。売上高は1,158億ドルで、前年同期比103%増。市場予想の1,093億ドルを5.6%上回った。調整後EPSは2.68ドル。データセンター部門の売上高は1,076億ドルで、総売上高の約93%を占めた。取締役会は黄仁勳氏の辞任を全会一致で受け入れ、同氏を復帰させる意向はないと表明。Colette Kress氏が引き続き暫定CEOを務める(Cointelegraph、Decrypt、11月18日)。
次の株価を左右する本当の要因は業績見通しだ。同社は第4四半期の売上高を1,300億ドル±3%と予想。市場予想の1,253億ドルを上回る。この見通しは通常より1週間長い期間を対象とし、中国のデータセンター向けコンピューティング収入をゼロと仮定している。決算発表後、元株は時間外取引で反発したが、情報源によって上昇率は約2%と約4%に分かれているため、この記事ではこの差異のある数値を採用しない。
NVIDIA、第3四半期売上高1,158億ドル:黄仁勳氏は復帰せず、NVDABは157で買えるか
NVIDIAは第3四半期に「記録ずくめ」の業績を達成した。売上高は1,158億ドルで、前年同期比103%増。市場予想の1,093億ドルを5.6%上回った。調整後EPSは2.68ドル。データセンター部門の売上高は1,076億ドルで、総売上高の約93%を占めた。取締役会は黄仁勳氏の辞任を全会一致で受け入れ、同氏を復帰させる意向はないと表明。Colette Kress氏が引き続き暫定CEOを務める(Cointelegraph、Decrypt、11月18日)。
次の株価を左右する本当の要因は業績見通しだ。同社は第4四半期の売上高を1,300億ドル±3%と予想。市場予想の1,253億ドルを上回る。この見通しは通常より1週間長い期間を対象とし、中国のデータセンター向けコンピューティング収入をゼロと仮定している。決算発表後、元株は時間外取引で反発したが、情報源によって上昇率は約2%と約4%に分かれているため、この記事ではこの差異のある数値を採用しない。
次の株価を左右する本当の要因は業績見通しだ。同社は第4四半期の売上高を1,300億ドル±3%と予想。市場予想の1,253億ドルを上回る。この見通しは通常より1週間長い期間を対象とし、中国のデータセンター向けコンピューティング収入をゼロと仮定している。決算発表後、元株は時間外取引で反発したが、情報源によって上昇率は約2%と約4%に分かれているため、この記事ではこの差異のある数値を採用しない。
119

·
--
翻訳参照
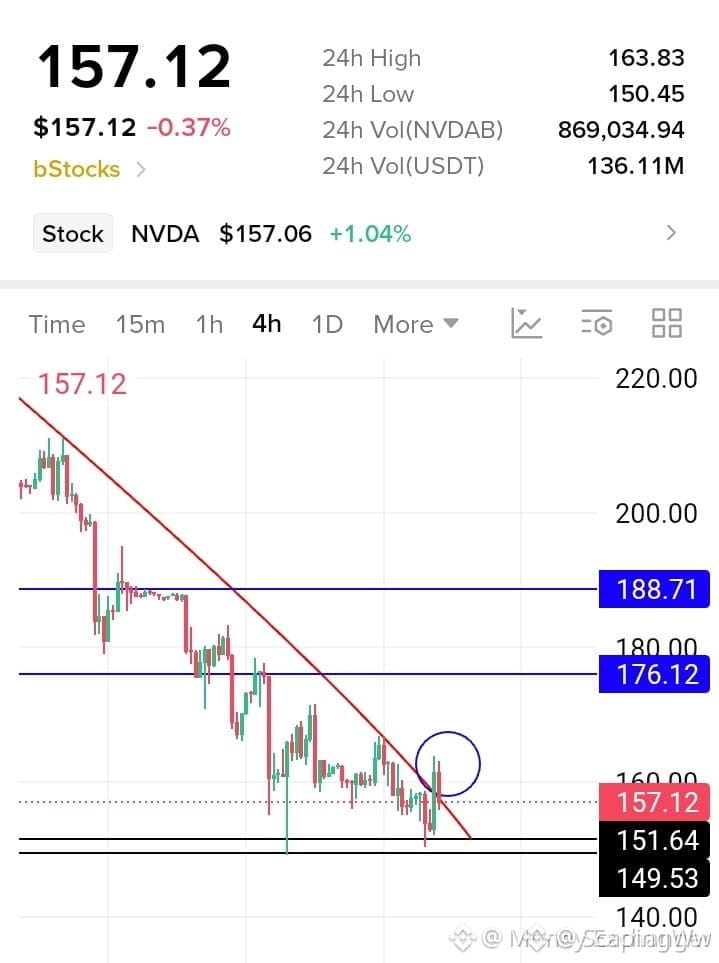
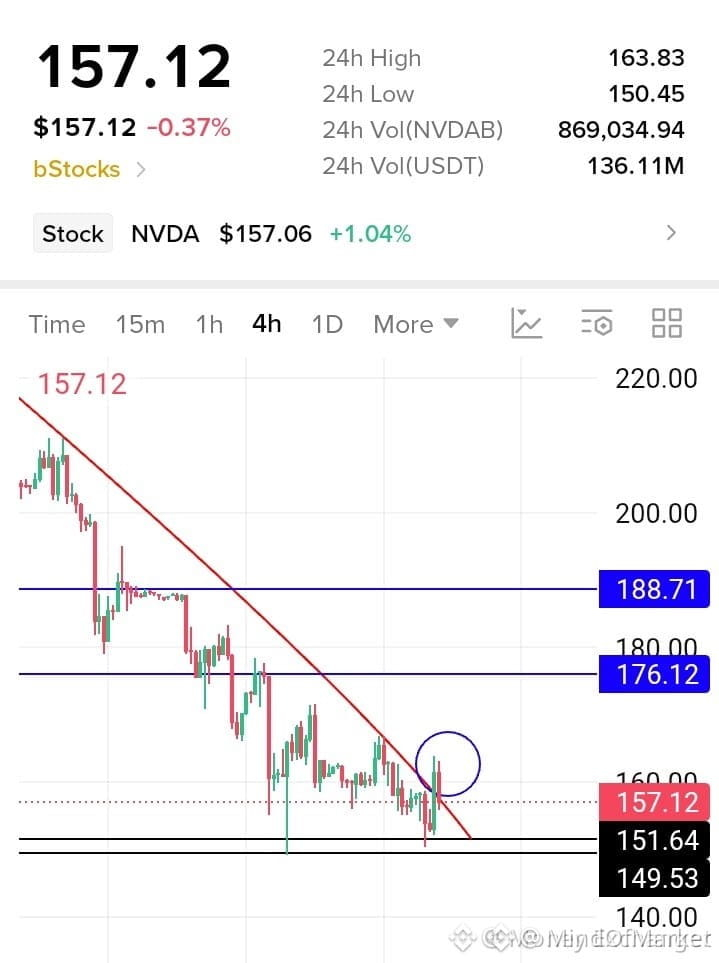
🚨 $NVDAB IS COILING UP FOR A MASSIVE BREAKOUT TOWARDS 181! 💥
Entry: 157 ⚡
Target: 181.45 🚀
Stop Loss: 151.18 ⚠️
Buyers are fiercely defending the local demand cluster while momentum indicators flash early signs of trend continuation. Volume profile shows seller exhaustion near the current base, setting the stage for an aggressive sweep toward higher resistance bands. 📊 ⚡
The order book alignment suggests institutional accumulation is quietly ramping up right below current market price. 🌊 Are you positioning ahead of the breakout or waiting for confirmation above mid-range? 💬
⚠️ Not financial advice. Always manage your risk. 🛡️
🏷️ #NVDAB #Breakout #Crypto #LongSetup #Momentum
🔥 💎
🚨 $NVDAB IS COILING UP FOR A MASSIVE BREAKOUT TOWARDS 181! 💥
Entry: 157 ⚡
Target: 181.45 🚀
Stop Loss: 151.18 ⚠️
Buyers are fiercely defending the local demand cluster while momentum indicators flash early signs of trend continuation. Volume profile shows seller exhaustion near the current base, setting the stage for an aggressive sweep toward higher resistance bands. 📊 ⚡
The order book alignment suggests institutional accumulation is quietly ramping up right below current market price. 🌊 Are you positioning ahead of the breakout or waiting for confirmation above mid-range? 💬
⚠️ Not financial advice. Always manage your risk. 🛡️
🏷️ #NVDAB #Breakout #Crypto #LongSetup #Momentum
🔥 💎
Entry: 157 ⚡
Target: 181.45 🚀
Stop Loss: 151.18 ⚠️
Buyers are fiercely defending the local demand cluster while momentum indicators flash early signs of trend continuation. Volume profile shows seller exhaustion near the current base, setting the stage for an aggressive sweep toward higher resistance bands. 📊 ⚡
The order book alignment suggests institutional accumulation is quietly ramping up right below current market price. 🌊 Are you positioning ahead of the breakout or waiting for confirmation above mid-range? 💬
⚠️ Not financial advice. Always manage your risk. 🛡️
🏷️ #NVDAB #Breakout #Crypto #LongSetup #Momentum
🔥 💎
1
5

·
--
翻訳参照
🚨 $NVDAB STRUCTURAL EXPANSION INCOMING AS SMART MONEY TESTS KEY LIQUIDITY ZONES! 💥
Entry: 157$ ⚡
Target: 180$ 🚀
Stop Loss: 151.18$ 🛑
Institutional footprint is printing a pristine demand sweep right above local support, establishing the structural foundation for an aggressive markup phase. 📊 Order flow dynamics reveal heavy institutional absorption soaking up floating supply while clearing internal liquidity pools toward upper targets. ⚡
With multiple expansion levels mapped out across the order book, this setup offers an exceptional risk-to-reward ratio for disciplined swing positioning. 🌊 Are you positioning alongside institutional accumulation here or waiting for a higher timeframe breakout confirmation? 💬
⚠️ Not financial advice. Always manage your risk. 🛡️
🏷️ #NVDAB #SmartMoney #PriceAction #Crypto #Breakout
🔥 💎
🚨 $NVDAB STRUCTURAL EXPANSION INCOMING AS SMART MONEY TESTS KEY LIQUIDITY ZONES! 💥
Entry: 157$ ⚡
Target: 180$ 🚀
Stop Loss: 151.18$ 🛑
Institutional footprint is printing a pristine demand sweep right above local support, establishing the structural foundation for an aggressive markup phase. 📊 Order flow dynamics reveal heavy institutional absorption soaking up floating supply while clearing internal liquidity pools toward upper targets. ⚡
With multiple expansion levels mapped out across the order book, this setup offers an exceptional risk-to-reward ratio for disciplined swing positioning. 🌊 Are you positioning alongside institutional accumulation here or waiting for a higher timeframe breakout confirmation? 💬
⚠️ Not financial advice. Always manage your risk. 🛡️
🏷️ #NVDAB #SmartMoney #PriceAction #Crypto #Breakout
🔥 💎
Entry: 157$ ⚡
Target: 180$ 🚀
Stop Loss: 151.18$ 🛑
Institutional footprint is printing a pristine demand sweep right above local support, establishing the structural foundation for an aggressive markup phase. 📊 Order flow dynamics reveal heavy institutional absorption soaking up floating supply while clearing internal liquidity pools toward upper targets. ⚡
With multiple expansion levels mapped out across the order book, this setup offers an exceptional risk-to-reward ratio for disciplined swing positioning. 🌊 Are you positioning alongside institutional accumulation here or waiting for a higher timeframe breakout confirmation? 💬
⚠️ Not financial advice. Always manage your risk. 🛡️
🏷️ #NVDAB #SmartMoney #PriceAction #Crypto #Breakout
🔥 💎
2

·
--
$NVDAB 、今日はなかなか動きがあるね。現在価格は $161.70、24時間で +3.2%上昇、取引高も一気に $141M 📈 出来高が明らかに増えていて、24時間の値幅は6.1%。この価格帯で強気派と弱気派が本気でぶつかり合ったってことだね。
RSI(14)は現在61で、まだ過熱圏には入っていない。上昇トレンドはかなり安定しているよ。出来高を伴う上昇については、資金流入のサインという見方もあれば、短期的なセンチメントで急騰しただけという見方もある 👀 いずれにしても、こういう局面ではメンタルが試されるよね——追いかけると高値づかみが怖いし、見送ると乗り遅れそう。なんだか見覚えのある状況じゃない?
結局のところ、重要なのは出来高と価格の連動。上昇率だけ見ていると熱くなりやすいからね。この上昇が続くかどうかは、今後も出来高がついてくるか次第 💡
今回の出来高を伴う上昇、どう見る?上昇の始まり、それとも買いを誘う動き?コメントで話そう👇
$NVDAB #NVDAB #暗号資産
$NVDAB 、今日はなかなか動きがあるね。現在価格は $161.70、24時間で +3.2%上昇、取引高も一気に $141M 📈 出来高が明らかに増えていて、24時間の値幅は6.1%。この価格帯で強気派と弱気派が本気でぶつかり合ったってことだね。
RSI(14)は現在61で、まだ過熱圏には入っていない。上昇トレンドはかなり安定しているよ。出来高を伴う上昇については、資金流入のサインという見方もあれば、短期的なセンチメントで急騰しただけという見方もある 👀 いずれにしても、こういう局面ではメンタルが試されるよね——追いかけると高値づかみが怖いし、見送ると乗り遅れそう。なんだか見覚えのある状況じゃない?
結局のところ、重要なのは出来高と価格の連動。上昇率だけ見ていると熱くなりやすいからね。この上昇が続くかどうかは、今後も出来高がついてくるか次第 💡
今回の出来高を伴う上昇、どう見る?上昇の始まり、それとも買いを誘う動き?コメントで話そう👇
$NVDAB #NVDAB #暗号資産
RSI(14)は現在61で、まだ過熱圏には入っていない。上昇トレンドはかなり安定しているよ。出来高を伴う上昇については、資金流入のサインという見方もあれば、短期的なセンチメントで急騰しただけという見方もある 👀 いずれにしても、こういう局面ではメンタルが試されるよね——追いかけると高値づかみが怖いし、見送ると乗り遅れそう。なんだか見覚えのある状況じゃない?
結局のところ、重要なのは出来高と価格の連動。上昇率だけ見ていると熱くなりやすいからね。この上昇が続くかどうかは、今後も出来高がついてくるか次第 💡
今回の出来高を伴う上昇、どう見る?上昇の始まり、それとも買いを誘う動き?コメントで話そう👇
$NVDAB #NVDAB #暗号資産
61

翻訳参照
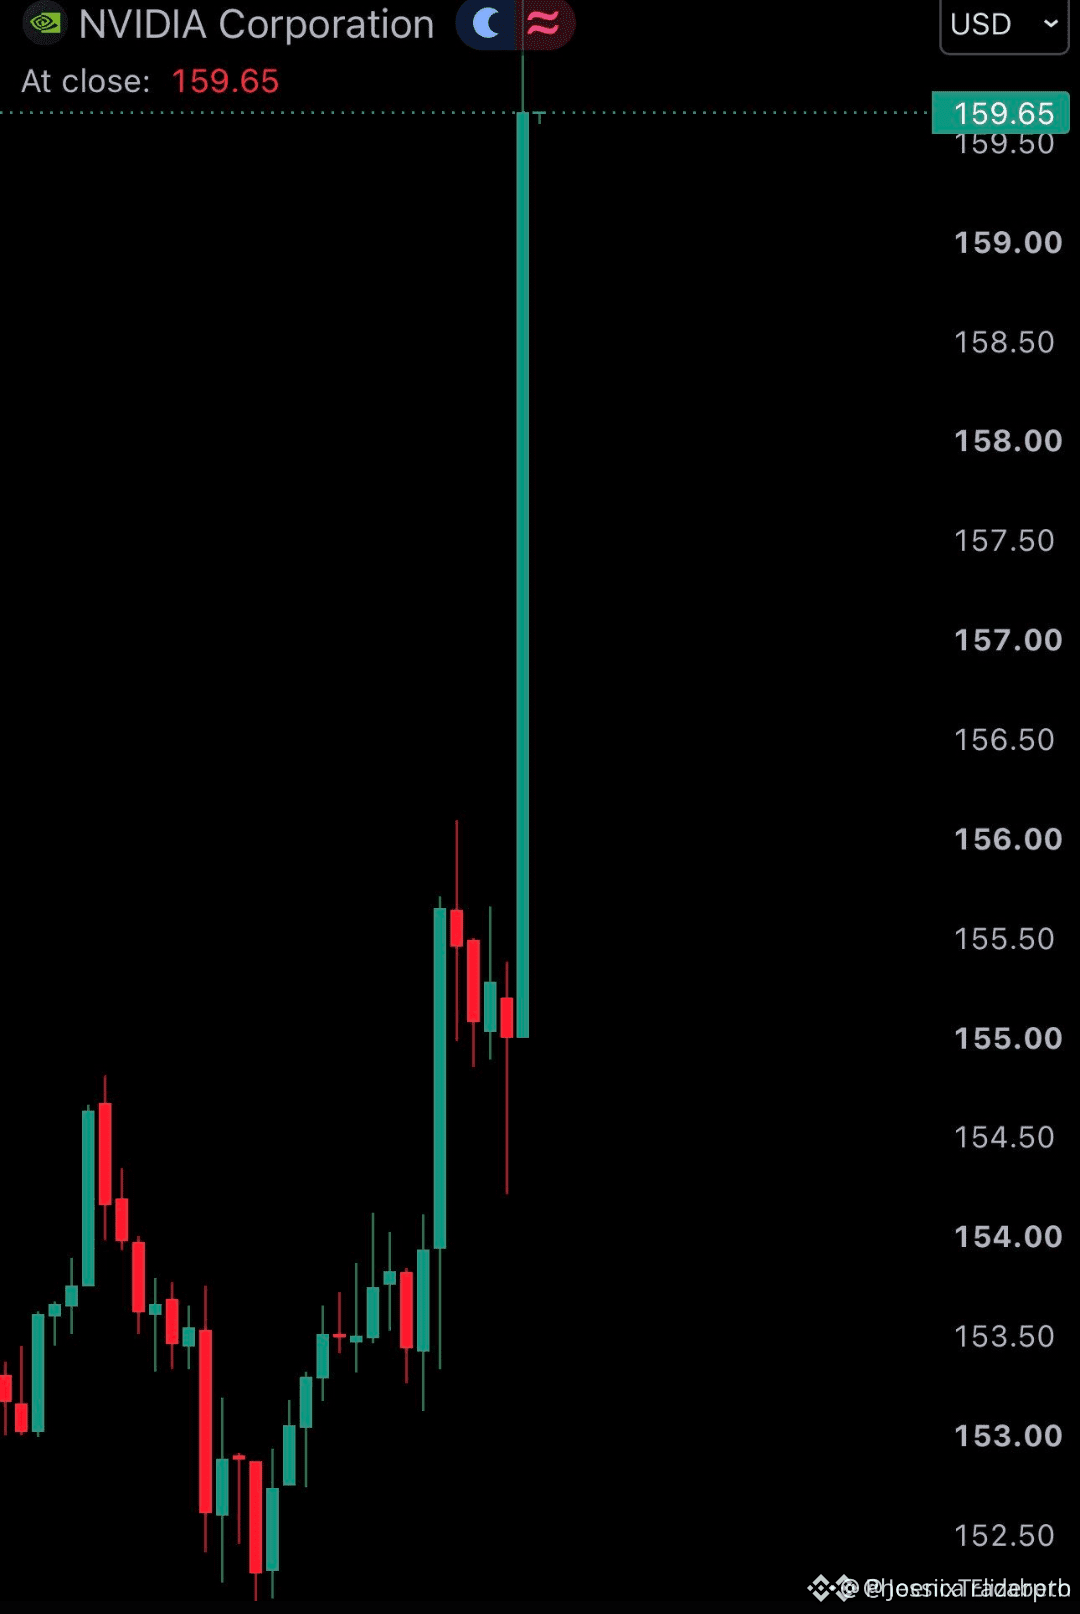
🚨 $NVDAB CRUSHES Q3 ESTIMATES WITH A STAGGERING 115 BILLION PRINT! 💥
The tech giant just threw down a masterclass in execution, printing a massive 115.84 billion in quarterly revenue and leaving consensus forecasts in the dust. 📊 This fundamental powerhouse immediately translated into a sharp 5% momentum surge as buyers stepped in to clear overhead resistance blocks. ⚡
When earnings drop this heavy, liquidity cascades quickly across correlated order books and tokenized markets. 🌊 Are you riding this momentum wave or waiting for a cleaner retest before building your exposure? 🤔
⚠️ Not financial advice. Always manage your risk. 🛡️
🏷️ #NVDAB #Momentum #Earnings #Breakout #Crypto
🔥 💎
🚨 $NVDAB CRUSHES Q3 ESTIMATES WITH A STAGGERING 115 BILLION PRINT! 💥
The tech giant just threw down a masterclass in execution, printing a massive 115.84 billion in quarterly revenue and leaving consensus forecasts in the dust. 📊 This fundamental powerhouse immediately translated into a sharp 5% momentum surge as buyers stepped in to clear overhead resistance blocks. ⚡
When earnings drop this heavy, liquidity cascades quickly across correlated order books and tokenized markets. 🌊 Are you riding this momentum wave or waiting for a cleaner retest before building your exposure? 🤔
⚠️ Not financial advice. Always manage your risk. 🛡️
🏷️ #NVDAB #Momentum #Earnings #Breakout #Crypto
🔥 💎
The tech giant just threw down a masterclass in execution, printing a massive 115.84 billion in quarterly revenue and leaving consensus forecasts in the dust. 📊 This fundamental powerhouse immediately translated into a sharp 5% momentum surge as buyers stepped in to clear overhead resistance blocks. ⚡
When earnings drop this heavy, liquidity cascades quickly across correlated order books and tokenized markets. 🌊 Are you riding this momentum wave or waiting for a cleaner retest before building your exposure? 🤔
⚠️ Not financial advice. Always manage your risk. 🛡️
🏷️ #NVDAB #Momentum #Earnings #Breakout #Crypto
🔥 💎
2

翻訳参照
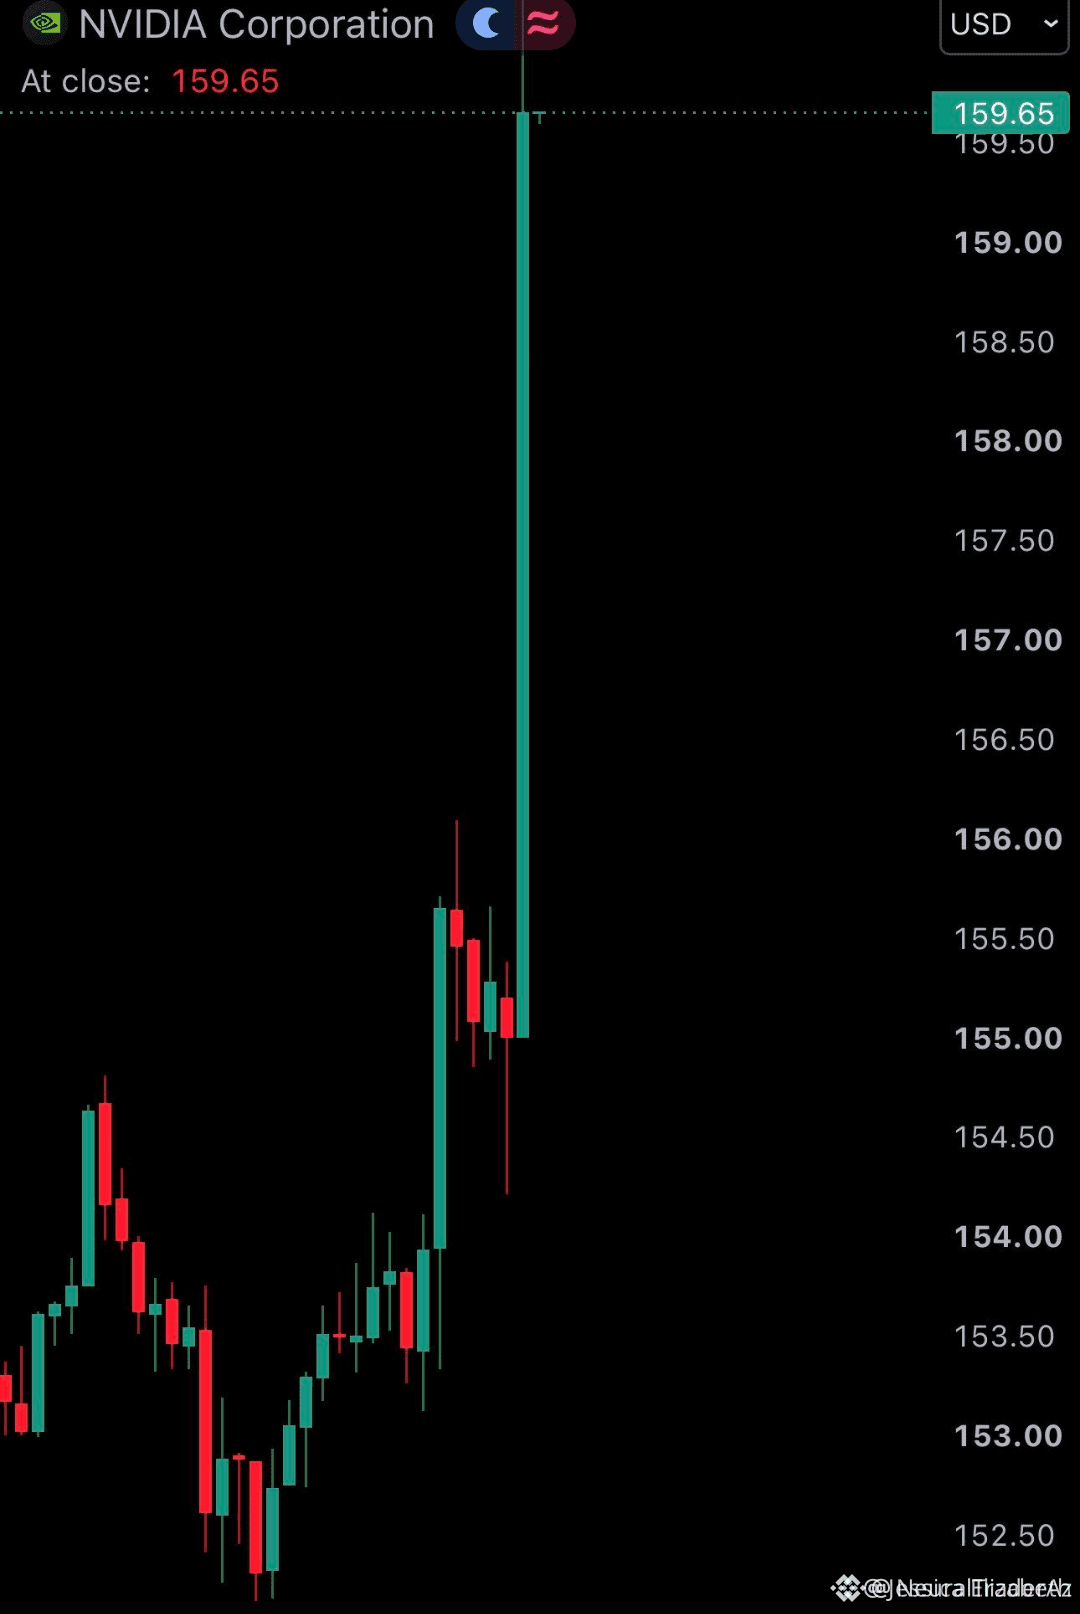
🚨 $NVDAB SMASHES Q3 EXPECTATIONS WITH 115.84 BILLION REVENUE AND A 5 PERCENT SURGE! 💥
Institutional capital is rotating aggressively as $NVDAB prints a massive 115.84 billion dollar revenue milestone for Q3. 📊 This earnings blowout validates strong underlying demand and confirms smart money positioning ahead of the broader market expansion. ⚡
Momentum is clearly favoring continuation as buyers absorb overhead liquidity with precision. 💡 Are you scaling into this structural strength or waiting for a minor retracement to key support? 👇
⚠️ Not financial advice. Always manage your risk. 🛡️
🏷️ #NVDAB #Earnings #SmartMoney #Crypto #TechTokens
🔥 💎
🚨 $NVDAB SMASHES Q3 EXPECTATIONS WITH 115.84 BILLION REVENUE AND A 5 PERCENT SURGE! 💥
Institutional capital is rotating aggressively as $NVDAB prints a massive 115.84 billion dollar revenue milestone for Q3. 📊 This earnings blowout validates strong underlying demand and confirms smart money positioning ahead of the broader market expansion. ⚡
Momentum is clearly favoring continuation as buyers absorb overhead liquidity with precision. 💡 Are you scaling into this structural strength or waiting for a minor retracement to key support? 👇
⚠️ Not financial advice. Always manage your risk. 🛡️
🏷️ #NVDAB #Earnings #SmartMoney #Crypto #TechTokens
🔥 💎
Institutional capital is rotating aggressively as $NVDAB prints a massive 115.84 billion dollar revenue milestone for Q3. 📊 This earnings blowout validates strong underlying demand and confirms smart money positioning ahead of the broader market expansion. ⚡
Momentum is clearly favoring continuation as buyers absorb overhead liquidity with precision. 💡 Are you scaling into this structural strength or waiting for a minor retracement to key support? 👇
⚠️ Not financial advice. Always manage your risk. 🛡️
🏷️ #NVDAB #Earnings #SmartMoney #Crypto #TechTokens
🔥 💎
15

翻訳参照
$NVDAB: Turnover and Relative Volume Answer Different Questions
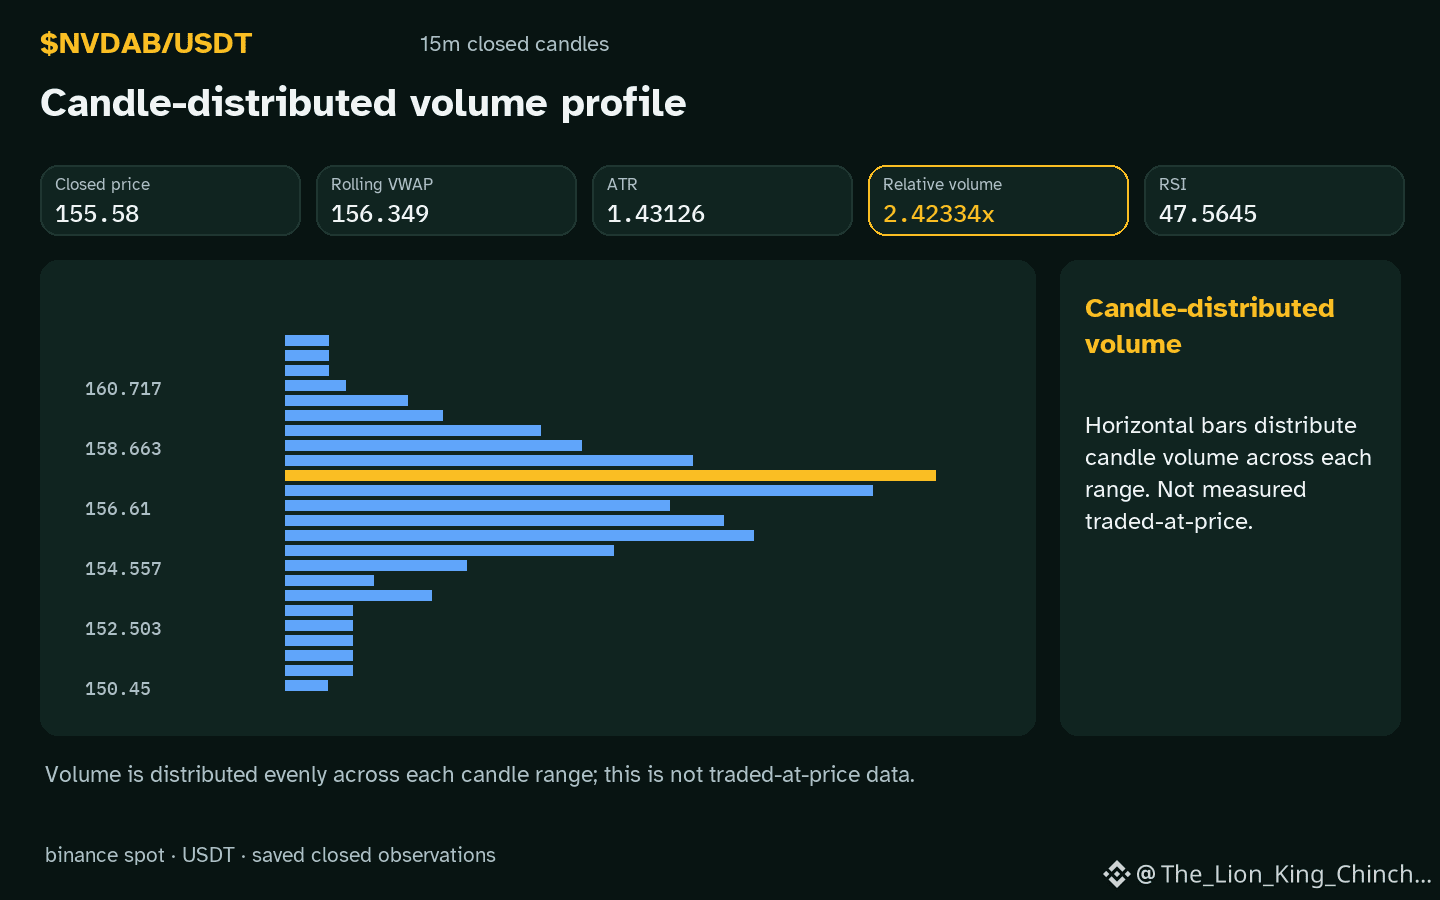
Does $NVDAB show macro liquidity or micro bursts? Supply chain data lacks fuel; internal inventory gains show. Relative volume 2.42x baseline helps. A surge aids turnover. Alternate: burst fades to noise. Weakness: weak daily change -2.04621% refutes. Check if next hourly change 0.640404% aligns with volume. Treat as hypothetical: sustained flow needs continuity. Limit: volume alone confirms no motives. Counterexample: high volume with flat RSI 47.6 is incomplete. Self-check: ensure RSI supports or contradicts the burst. Price sits above EMA 155.902 but below EMA 156.611, showing tension. A clean close or retest defines evidence. Hypothesis: micro bursts precede macro shifts. Observation: volume is above baseline direction up. Testing requires actual candle data, not inference. This framework isolates participation. It distinguishes signal from noise. Future closed candles must verify continuity. If volume drops without price change, the interpretation weakens. The mechanism remains hypothetical until proven. Simplify: is the flow real or temporary? Use these facts to gauge likelihood. No conclusion is certain yet. Wait for confirmation. The data provides clues, not proofs. Analyze carefully to avoid bias. Focus on consistency across timeframes. Compare current readings to historical patterns safely. This draft explores that specific tension without overstepping bounds.
Probabilistic market research, not a recommendation or guaranteed return.
A useful cross-check: $ETH has hourly direction down and volume above its baseline; $INJ has hourly direction down and volume not above its baseline. This alone does not establish correlation.
#NVDAB #ETH #INJ #MarketAnalysis #CryptoLearning
$NVDAB : Turnover and Relative Volume Answer Different Questions
Does $NVDAB show macro liquidity or micro bursts? Supply chain data lacks fuel; internal inventory gains show. Relative volume 2.42x baseline helps. A surge aids turnover. Alternate: burst fades to noise. Weakness: weak daily change -2.04621% refutes. Check if next hourly change 0.640404% aligns with volume. Treat as hypothetical: sustained flow needs continuity. Limit: volume alone confirms no motives. Counterexample: high volume with flat RSI 47.6 is incomplete. Self-check: ensure RSI supports or contradicts the burst. Price sits above EMA 155.902 but below EMA 156.611, showing tension. A clean close or retest defines evidence. Hypothesis: micro bursts precede macro shifts. Observation: volume is above baseline direction up. Testing requires actual candle data, not inference. This framework isolates participation. It distinguishes signal from noise. Future closed candles must verify continuity. If volume drops without price change, the interpretation weakens. The mechanism remains hypothetical until proven. Simplify: is the flow real or temporary? Use these facts to gauge likelihood. No conclusion is certain yet. Wait for confirmation. The data provides clues, not proofs. Analyze carefully to avoid bias. Focus on consistency across timeframes. Compare current readings to historical patterns safely. This draft explores that specific tension without overstepping bounds.
Probabilistic market research, not a recommendation or guaranteed return.
A useful cross-check: $ETH has hourly direction down and volume above its baseline; $INJ has hourly direction down and volume not above its baseline. This alone does not establish correlation.
#NVDAB #ETH #INJ #MarketAnalysis #CryptoLearning
Does $NVDAB show macro liquidity or micro bursts? Supply chain data lacks fuel; internal inventory gains show. Relative volume 2.42x baseline helps. A surge aids turnover. Alternate: burst fades to noise. Weakness: weak daily change -2.04621% refutes. Check if next hourly change 0.640404% aligns with volume. Treat as hypothetical: sustained flow needs continuity. Limit: volume alone confirms no motives. Counterexample: high volume with flat RSI 47.6 is incomplete. Self-check: ensure RSI supports or contradicts the burst. Price sits above EMA 155.902 but below EMA 156.611, showing tension. A clean close or retest defines evidence. Hypothesis: micro bursts precede macro shifts. Observation: volume is above baseline direction up. Testing requires actual candle data, not inference. This framework isolates participation. It distinguishes signal from noise. Future closed candles must verify continuity. If volume drops without price change, the interpretation weakens. The mechanism remains hypothetical until proven. Simplify: is the flow real or temporary? Use these facts to gauge likelihood. No conclusion is certain yet. Wait for confirmation. The data provides clues, not proofs. Analyze carefully to avoid bias. Focus on consistency across timeframes. Compare current readings to historical patterns safely. This draft explores that specific tension without overstepping bounds.
Probabilistic market research, not a recommendation or guaranteed return.
A useful cross-check: $ETH has hourly direction down and volume above its baseline; $INJ has hourly direction down and volume not above its baseline. This alone does not establish correlation.
#NVDAB #ETH #INJ #MarketAnalysis #CryptoLearning
21

·
--
翻訳参照
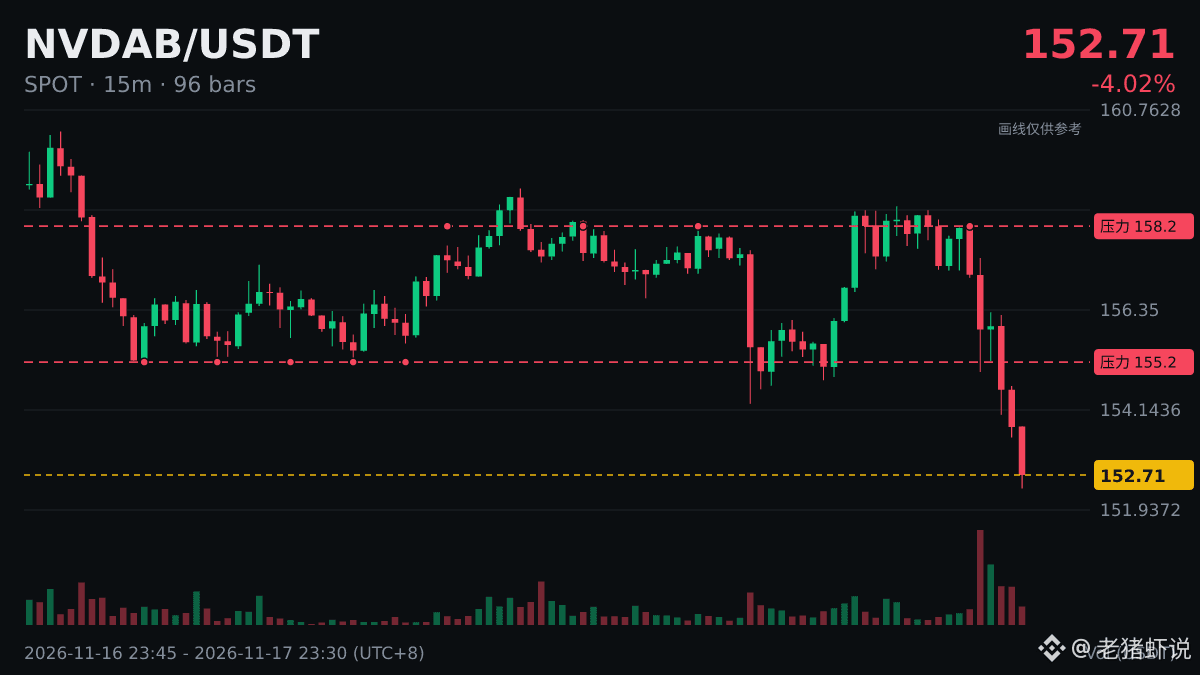
$NVDAB 24小时新低确认。
24h -4.29%,现价 152.55,前一个低点 154.28。
从结构看,新低代表多头防线失守,反抽先看能否收回前低;收不回就弱势延续,站回则可能形成假跌破。你们会信哪个信号?
#NVDAB
$NVDAB 24小时新低确认。
24h -4.29%,现价 152.55,前一个低点 154.28。
从结构看,新低代表多头防线失守,反抽先看能否收回前低;收不回就弱势延续,站回则可能形成假跌破。你们会信哪个信号?
#NVDAB
24h -4.29%,现价 152.55,前一个低点 154.28。
从结构看,新低代表多头防线失守,反抽先看能否收回前低;收不回就弱势延续,站回则可能形成假跌破。你们会信哪个信号?
#NVDAB
91

·
--
数日前までは安定していると思っていた人も、今日はかなりつらいでしょう。$NVDAB は1日で3.72%下落し、154.09で取引を終えました。RSIはすでに22.1まで低下しています。
簡単に言うと、今日いきなり急落したわけではなく、ここ2週間で215.46からじわじわ下げてきて、今や14日間の安値149.23まであと一歩です。下げ足が速く、頻繁に売られていて、短期的には確かに売られすぎです。でも、売られすぎだからといって下げ止まったとは限らず、下にはもうあまり余地がありません。
私の見方は間違っているかもしれません。この水準で底値を拾うのは、投資家心理が持ち直すことに賭けることになります。でも、RSI 22.1に救われた人もいれば、痛い目に遭った人もいます。間違っていたら認めます。重要な水準は149.23。ここを割ったら割ったということです。つまり、これは売られすぎではなく、本当に下落基調だということです。
NVDABのRSIはすでに22.1。みなさんは反発を信じますか、それともトレンドを信じますか?
$NVDAB
#行情分析 #NVDAB
数日前までは安定していると思っていた人も、今日はかなりつらいでしょう。$NVDAB は1日で3.72%下落し、154.09で取引を終えました。RSIはすでに22.1まで低下しています。
簡単に言うと、今日いきなり急落したわけではなく、ここ2週間で215.46からじわじわ下げてきて、今や14日間の安値149.23まであと一歩です。下げ足が速く、頻繁に売られていて、短期的には確かに売られすぎです。でも、売られすぎだからといって下げ止まったとは限らず、下にはもうあまり余地がありません。
私の見方は間違っているかもしれません。この水準で底値を拾うのは、投資家心理が持ち直すことに賭けることになります。でも、RSI 22.1に救われた人もいれば、痛い目に遭った人もいます。間違っていたら認めます。重要な水準は149.23。ここを割ったら割ったということです。つまり、これは売られすぎではなく、本当に下落基調だということです。
NVDABのRSIはすでに22.1。みなさんは反発を信じますか、それともトレンドを信じますか?
$NVDAB
#行情分析 #NVDAB
簡単に言うと、今日いきなり急落したわけではなく、ここ2週間で215.46からじわじわ下げてきて、今や14日間の安値149.23まであと一歩です。下げ足が速く、頻繁に売られていて、短期的には確かに売られすぎです。でも、売られすぎだからといって下げ止まったとは限らず、下にはもうあまり余地がありません。
私の見方は間違っているかもしれません。この水準で底値を拾うのは、投資家心理が持ち直すことに賭けることになります。でも、RSI 22.1に救われた人もいれば、痛い目に遭った人もいます。間違っていたら認めます。重要な水準は149.23。ここを割ったら割ったということです。つまり、これは売られすぎではなく、本当に下落基調だということです。
NVDABのRSIはすでに22.1。みなさんは反発を信じますか、それともトレンドを信じますか?
$NVDAB
#行情分析 #NVDAB
9

·
--
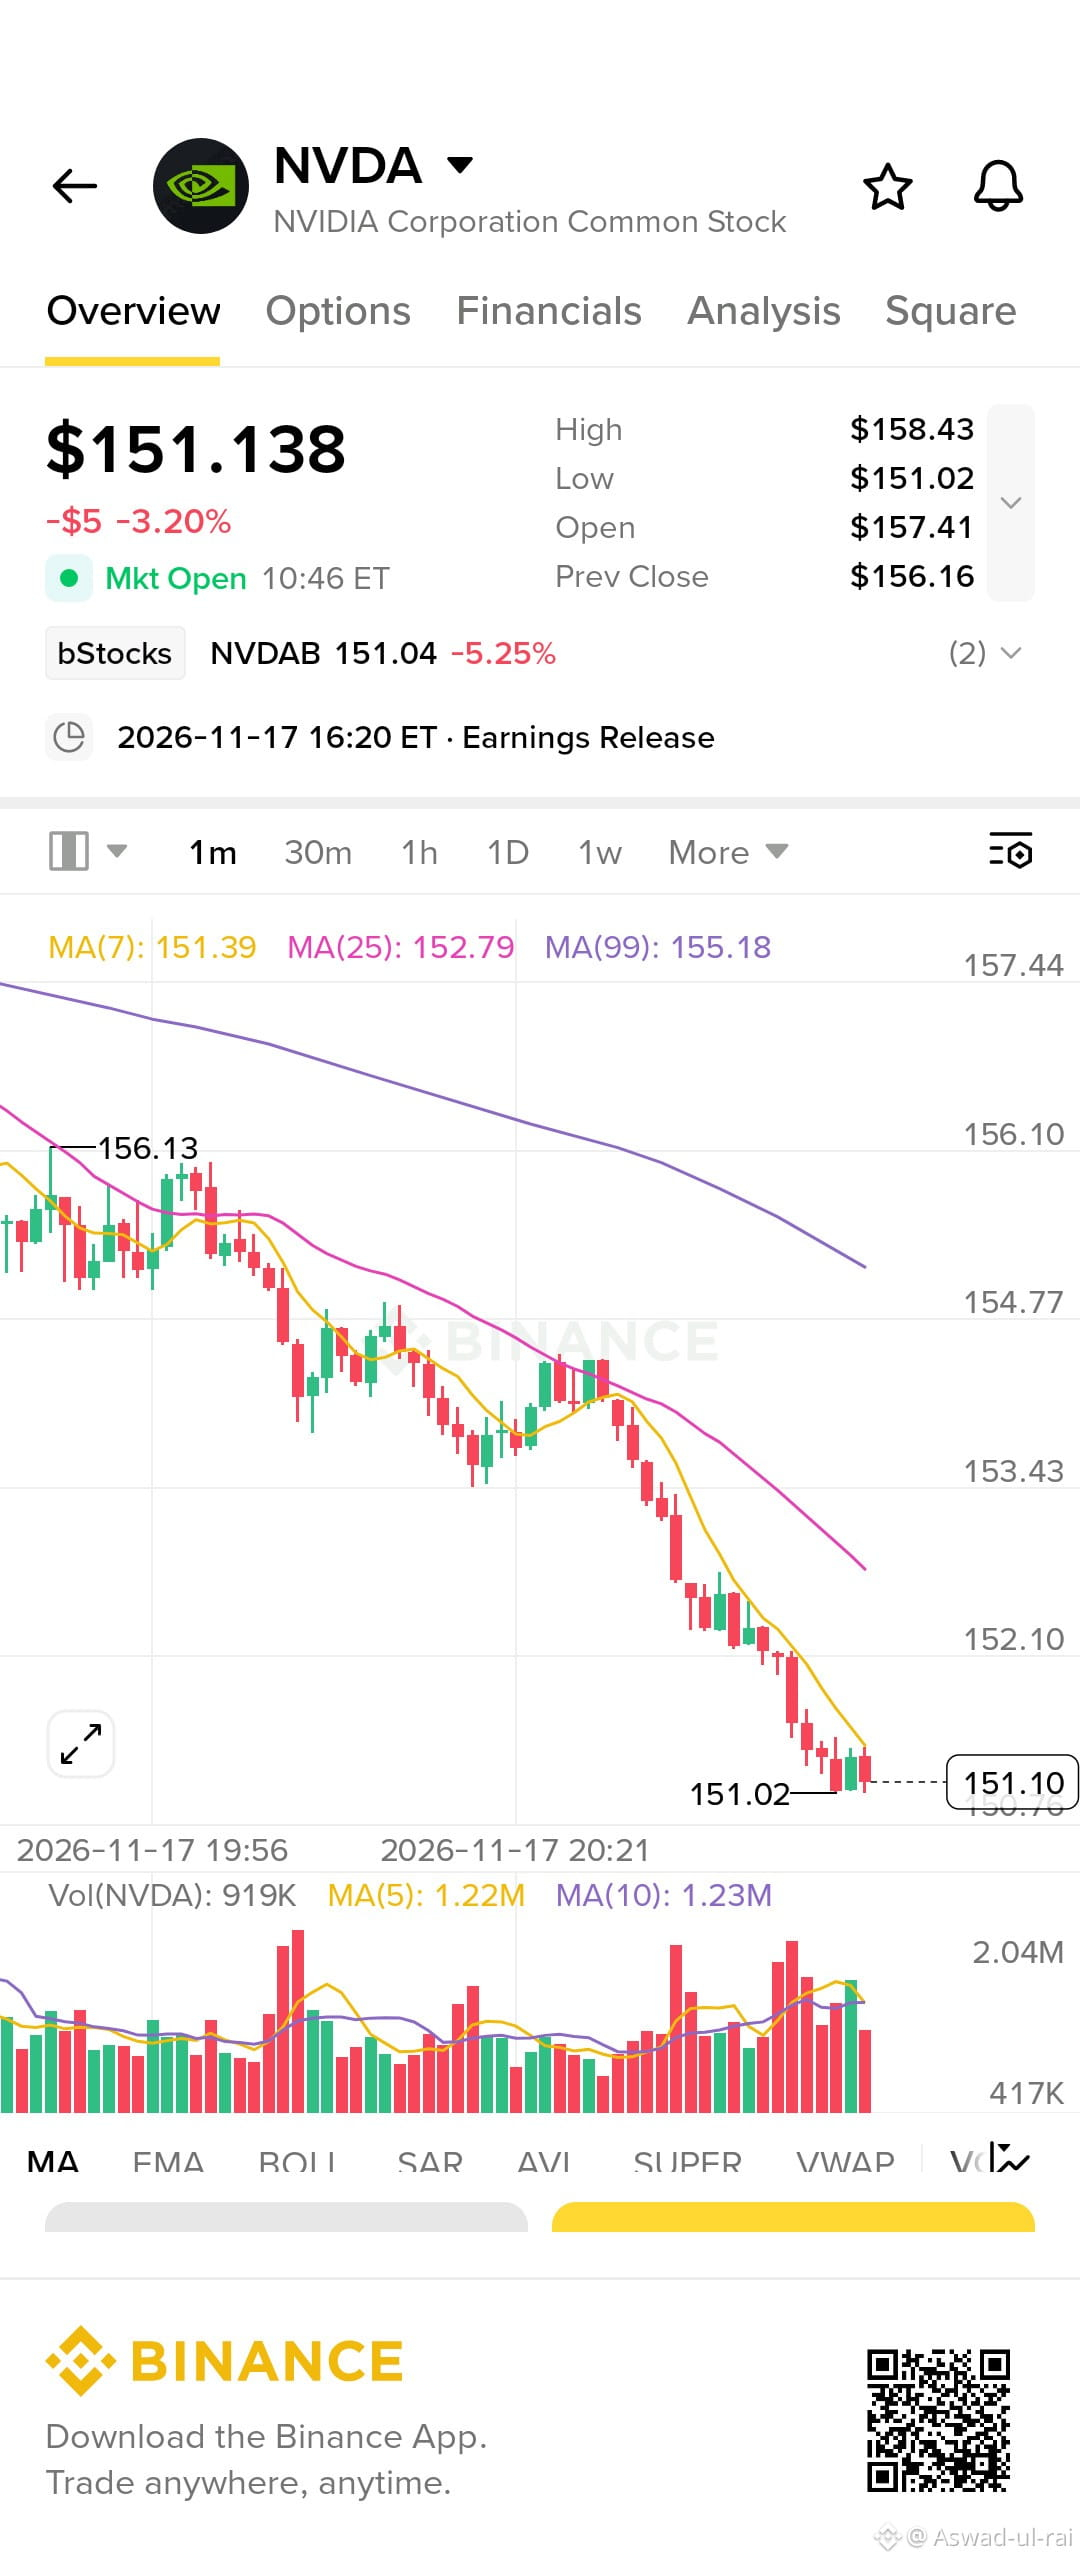
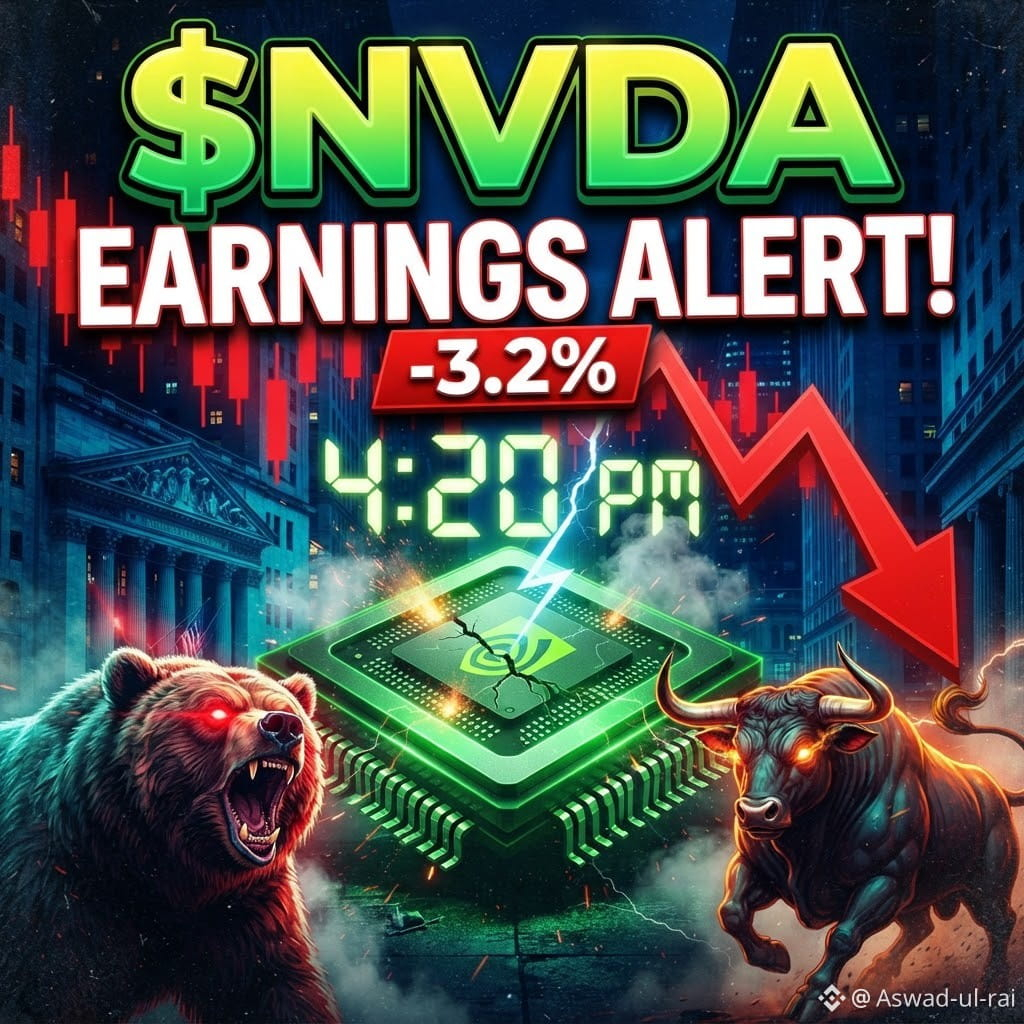
🚨 決算発表を前にNVIDIA急落! $NVDA 📉😱
NVDAは151.14ドル、今日は-3.20%下落! 始値は157.41ドルで、取引時間中ずっと下落しています。🔻
⚠️ 決算発表は本日16:20(米東部時間)です!
BinanceのNVDAB(bStocks)トークンはさらに下落し、-5.25%。価格はMA7、MA25、MA99を下回っています。😱 決算をきっかけに反発する? それともさらに下落する? 🤯
🔺 レジスタンス:156~158ドル
🔻 サポート:151.02ドル
発表後、大きく動く可能性があります。⚡
👇 あなたはこの押し目で買う? それとも決算待ち?
投資助言ではありません。リスク管理を忘れずに。
#NVDA #NVIDIA #Earnings #bStocks #NVDAB #Binance #crypto
{stock_us}(NVDA.US)
🚨 決算発表を前にNVIDIA急落! $NVDA 📉😱
NVDAは151.14ドル、今日は-3.20%下落! 始値は157.41ドルで、取引時間中ずっと下落しています。🔻
⚠️ 決算発表は本日16:20(米東部時間)です!
BinanceのNVDAB(bStocks)トークンはさらに下落し、-5.25%。価格はMA7、MA25、MA99を下回っています。😱 決算をきっかけに反発する? それともさらに下落する? 🤯
🔺 レジスタンス:156~158ドル
🔻 サポート:151.02ドル
発表後、大きく動く可能性があります。⚡
👇 あなたはこの押し目で買う? それとも決算待ち?
投資助言ではありません。リスク管理を忘れずに。
#NVDA #NVIDIA #Earnings #bStocks #NVDAB #Binance #crypto
NVDAは151.14ドル、今日は-3.20%下落! 始値は157.41ドルで、取引時間中ずっと下落しています。🔻
⚠️ 決算発表は本日16:20(米東部時間)です!
BinanceのNVDAB(bStocks)トークンはさらに下落し、-5.25%。価格はMA7、MA25、MA99を下回っています。😱 決算をきっかけに反発する? それともさらに下落する? 🤯
🔺 レジスタンス:156~158ドル
🔻 サポート:151.02ドル
発表後、大きく動く可能性があります。⚡
👇 あなたはこの押し目で買う? それとも決算待ち?
投資助言ではありません。リスク管理を忘れずに。
#NVDA #NVIDIA #Earnings #bStocks #NVDAB #Binance #crypto
2.4k
翻訳参照
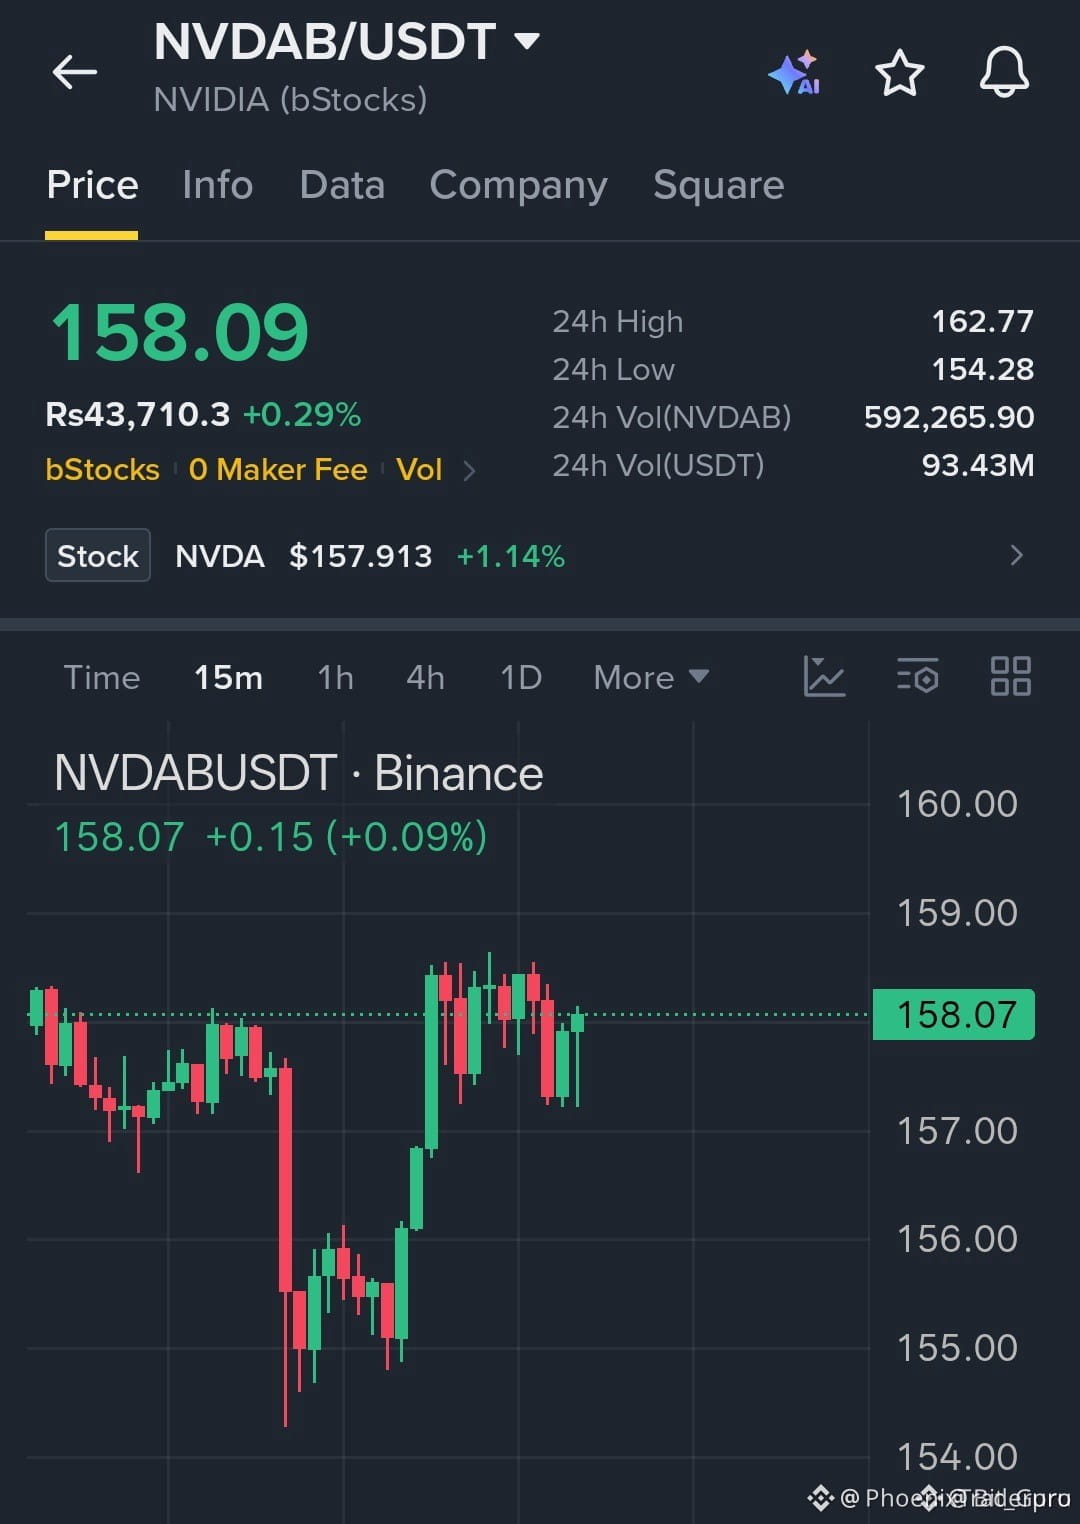
🚨 $NVDAB IS IGNITING A FRESH BULLISH REBOUND STRAIGHT TO KEY RESISTANCE! 💥
Entry: 157.70 - 158.10 ⚡
Target: 159.00 🚀
Stop Loss: 156.90 ⚠️
Bulls are stepping in with aggressive order flow right off the demand shelf, absorbing every lingering seller in sight. 📊 Momentum indicators on the lower timeframes are curling upward as volume expands across the order book. ⚡
This tight consolidation above support sets up a clean push toward our objective without excessive drawdown risk. 💡 Are you locking in early entries here or waiting for a confirmed break above 158.60 first? 👇
⚠️ Not financial advice. Always manage your risk. 🛡️
🏷️ #NVDAB #LongSetup #Momentum #Breakout #Crypto
🔥 💎
🚨 $NVDAB IS IGNITING A FRESH BULLISH REBOUND STRAIGHT TO KEY RESISTANCE! 💥
Entry: 157.70 - 158.10 ⚡
Target: 159.00 🚀
Stop Loss: 156.90 ⚠️
Bulls are stepping in with aggressive order flow right off the demand shelf, absorbing every lingering seller in sight. 📊 Momentum indicators on the lower timeframes are curling upward as volume expands across the order book. ⚡
This tight consolidation above support sets up a clean push toward our objective without excessive drawdown risk. 💡 Are you locking in early entries here or waiting for a confirmed break above 158.60 first? 👇
⚠️ Not financial advice. Always manage your risk. 🛡️
🏷️ #NVDAB #LongSetup #Momentum #Breakout #Crypto
🔥 💎
Entry: 157.70 - 158.10 ⚡
Target: 159.00 🚀
Stop Loss: 156.90 ⚠️
Bulls are stepping in with aggressive order flow right off the demand shelf, absorbing every lingering seller in sight. 📊 Momentum indicators on the lower timeframes are curling upward as volume expands across the order book. ⚡
This tight consolidation above support sets up a clean push toward our objective without excessive drawdown risk. 💡 Are you locking in early entries here or waiting for a confirmed break above 158.60 first? 👇
⚠️ Not financial advice. Always manage your risk. 🛡️
🏷️ #NVDAB #LongSetup #Momentum #Breakout #Crypto
🔥 💎
1

·
--
翻訳参照
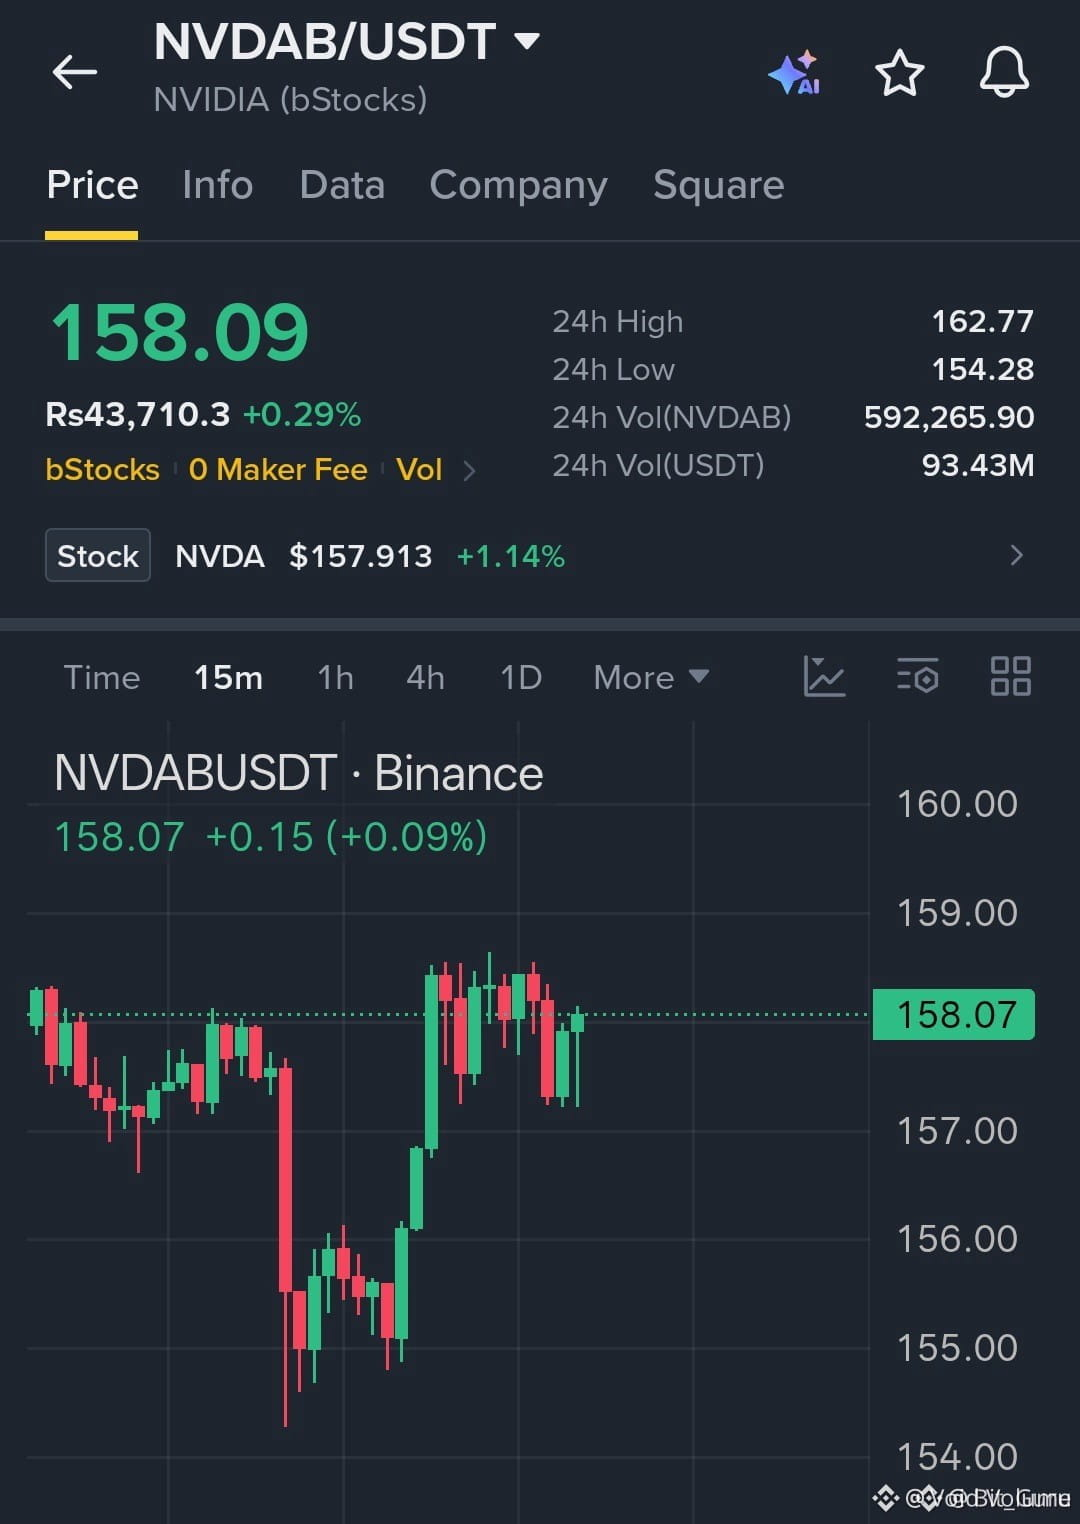
🚨 $NVDAB SWEEPS LOCAL LIQUIDITY AS SMART MONEY DEFENDS THE 157 RANGE ⚡
Entry: 157.70 - 158.10 ⚡
Target: 159.00 🚀
Stop Loss: 156.90 ⚠️
Institutional order flow reveals a clean absorption pattern right inside this demand zone as resting sell-side liquidity gets cleared. 📊 Sellers tried to force a breakdown below 157, but aggressive bid walls stepped in to reclaim the local micro-structure.
The inefficiency left behind on the chart points toward a swift rotation back toward the 159 handle. 💡 Risk parameters are tightly defined beneath the structural pivot, offering a pristine structural setup. 💬 Are you positioning for this continuation or waiting for a deeper retest? 👇
⚠️ Not financial advice. Always manage your risk. 🛡️
🏷️ #NVDAB #LongSetup #OrderFlow #MarketStructure #Crypto
🔥 💎
🚨 $NVDAB SWEEPS LOCAL LIQUIDITY AS SMART MONEY DEFENDS THE 157 RANGE ⚡
Entry: 157.70 - 158.10 ⚡
Target: 159.00 🚀
Stop Loss: 156.90 ⚠️
Institutional order flow reveals a clean absorption pattern right inside this demand zone as resting sell-side liquidity gets cleared. 📊 Sellers tried to force a breakdown below 157, but aggressive bid walls stepped in to reclaim the local micro-structure.
The inefficiency left behind on the chart points toward a swift rotation back toward the 159 handle. 💡 Risk parameters are tightly defined beneath the structural pivot, offering a pristine structural setup. 💬 Are you positioning for this continuation or waiting for a deeper retest? 👇
⚠️ Not financial advice. Always manage your risk. 🛡️
🏷️ #NVDAB #LongSetup #OrderFlow #MarketStructure #Crypto
🔥 💎
Entry: 157.70 - 158.10 ⚡
Target: 159.00 🚀
Stop Loss: 156.90 ⚠️
Institutional order flow reveals a clean absorption pattern right inside this demand zone as resting sell-side liquidity gets cleared. 📊 Sellers tried to force a breakdown below 157, but aggressive bid walls stepped in to reclaim the local micro-structure.
The inefficiency left behind on the chart points toward a swift rotation back toward the 159 handle. 💡 Risk parameters are tightly defined beneath the structural pivot, offering a pristine structural setup. 💬 Are you positioning for this continuation or waiting for a deeper retest? 👇
⚠️ Not financial advice. Always manage your risk. 🛡️
🏷️ #NVDAB #LongSetup #OrderFlow #MarketStructure #Crypto
🔥 💎
10
翻訳参照
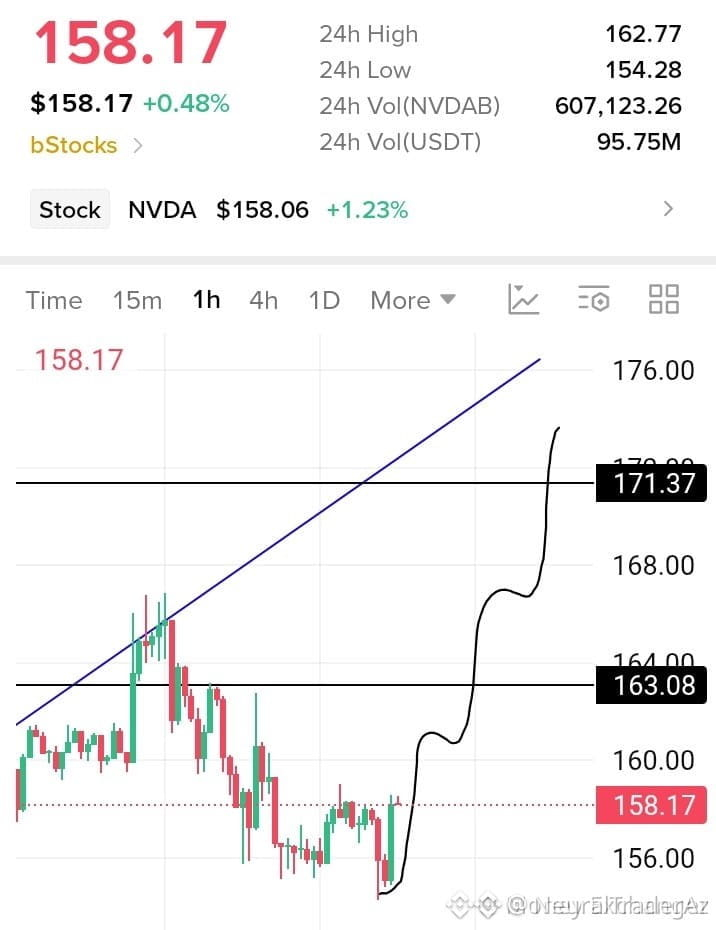
🚨 $NVDAB APPROACHING KEY LIQUIDITY ZONE AS THE OPENING BELL NEARS! 💥
Entry: 158.00 ⚡
Target: 171.30 🚀
Stop Loss: 152.98 ⚠️
Institutional order flow on $NVDAB is showing signs of aggressive accumulation right ahead of the upcoming market session. Price action is currently consolidating near the 158.00 level, absorbing residual supply and setting up a clean expansion phase toward higher liquidity pools. 📊
The structural imbalance left on the lower timeframes suggests smart money is positioning for a swift rotation upward. With risk neatly defined below the 152.98 pivot, the asymmetry favors continuation toward our primary targets. 💡
Are you scaling in ahead of the opening bell or waiting for a structural confirmation candle? 🤔
⚠️ Not financial advice. Always manage your risk. 🛡️
🏷️ #NVDAB #SmartMoney #Breakout #TradingSetup
🦈 💎
🚨 $NVDAB APPROACHING KEY LIQUIDITY ZONE AS THE OPENING BELL NEARS! 💥
Entry: 158.00 ⚡
Target: 171.30 🚀
Stop Loss: 152.98 ⚠️
Institutional order flow on $NVDAB is showing signs of aggressive accumulation right ahead of the upcoming market session. Price action is currently consolidating near the 158.00 level, absorbing residual supply and setting up a clean expansion phase toward higher liquidity pools. 📊
The structural imbalance left on the lower timeframes suggests smart money is positioning for a swift rotation upward. With risk neatly defined below the 152.98 pivot, the asymmetry favors continuation toward our primary targets. 💡
Are you scaling in ahead of the opening bell or waiting for a structural confirmation candle? 🤔
⚠️ Not financial advice. Always manage your risk. 🛡️
🏷️ #NVDAB #SmartMoney #Breakout #TradingSetup
🦈 💎
Entry: 158.00 ⚡
Target: 171.30 🚀
Stop Loss: 152.98 ⚠️
Institutional order flow on $NVDAB is showing signs of aggressive accumulation right ahead of the upcoming market session. Price action is currently consolidating near the 158.00 level, absorbing residual supply and setting up a clean expansion phase toward higher liquidity pools. 📊
The structural imbalance left on the lower timeframes suggests smart money is positioning for a swift rotation upward. With risk neatly defined below the 152.98 pivot, the asymmetry favors continuation toward our primary targets. 💡
Are you scaling in ahead of the opening bell or waiting for a structural confirmation candle? 🤔
⚠️ Not financial advice. Always manage your risk. 🛡️
🏷️ #NVDAB #SmartMoney #Breakout #TradingSetup
🦈 💎
6
·
--
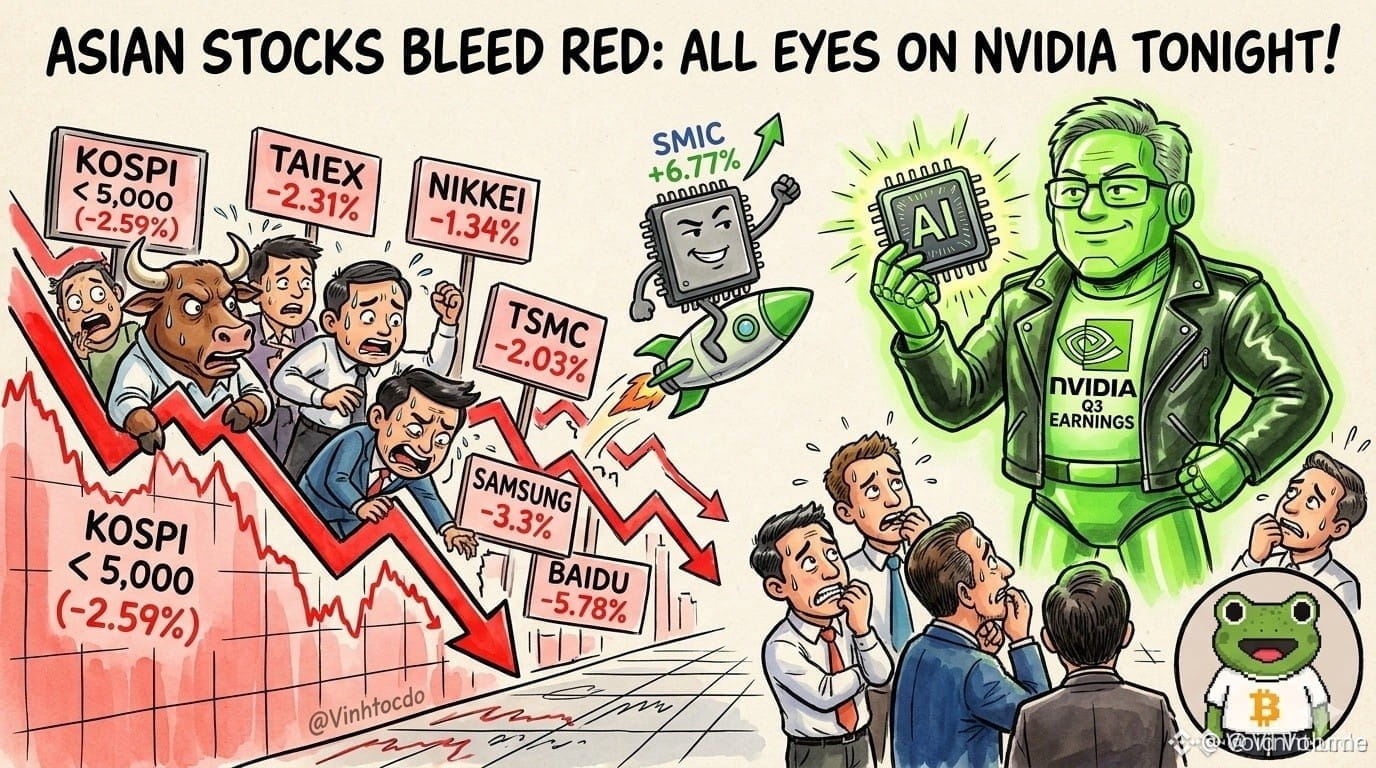
🚨 $NVDAB の決算発表を前に流動性が蒸発し、アジア市場が急落 📉
本日、アジア株は深刻なリスク回避姿勢を示し、域内の株価指数が重要な構造的サポートを割り込む一方、主要テクノロジー銘柄では機関投資家による大規模な売りが進みました。📊 目前に迫った決算発表は大きなボラティリティの引き金となり、規制面の逆風に備えて、機関投資家は資金配分を見直し、リスクを防御的に管理せざるを得なくなっています。⚡
国境を越えた流動性が逼迫し、世界の株価指数全体で注文の流れが不安定になるなか、今は高いレバレッジが危険な罠となっています。市場がこのマクロな流動性の急変を消化する間、手元資金を温存することが最大の強みです。💡 ボラティリティの拡大が始まる前に現金を確保しますか? それとも押し目買いの機会を探しますか? 🤔
⚠️ これは金融アドバイスではありません。常にリスクを管理してください。🛡️
🏷️ #NVDAB #StockMarket #MarketStructure #Liquidity
🔥 💎
🚨 $NVDAB の決算発表を前に流動性が蒸発し、アジア市場が急落 📉
本日、アジア株は深刻なリスク回避姿勢を示し、域内の株価指数が重要な構造的サポートを割り込む一方、主要テクノロジー銘柄では機関投資家による大規模な売りが進みました。📊 目前に迫った決算発表は大きなボラティリティの引き金となり、規制面の逆風に備えて、機関投資家は資金配分を見直し、リスクを防御的に管理せざるを得なくなっています。⚡
国境を越えた流動性が逼迫し、世界の株価指数全体で注文の流れが不安定になるなか、今は高いレバレッジが危険な罠となっています。市場がこのマクロな流動性の急変を消化する間、手元資金を温存することが最大の強みです。💡 ボラティリティの拡大が始まる前に現金を確保しますか? それとも押し目買いの機会を探しますか? 🤔
⚠️ これは金融アドバイスではありません。常にリスクを管理してください。🛡️
🏷️ #NVDAB #StockMarket #MarketStructure #Liquidity
🔥 💎
本日、アジア株は深刻なリスク回避姿勢を示し、域内の株価指数が重要な構造的サポートを割り込む一方、主要テクノロジー銘柄では機関投資家による大規模な売りが進みました。📊 目前に迫った決算発表は大きなボラティリティの引き金となり、規制面の逆風に備えて、機関投資家は資金配分を見直し、リスクを防御的に管理せざるを得なくなっています。⚡
国境を越えた流動性が逼迫し、世界の株価指数全体で注文の流れが不安定になるなか、今は高いレバレッジが危険な罠となっています。市場がこのマクロな流動性の急変を消化する間、手元資金を温存することが最大の強みです。💡 ボラティリティの拡大が始まる前に現金を確保しますか? それとも押し目買いの機会を探しますか? 🤔
⚠️ これは金融アドバイスではありません。常にリスクを管理してください。🛡️
🏷️ #NVDAB #StockMarket #MarketStructure #Liquidity
🔥 💎
4

ログインして、さらにコンテンツを読む
厳選トピックで世界の暗号資産トレーダーの仲間入り
⚡️ 暗号資産に関する最新かつ有益な情報が見つかります。
💬 世界最大の暗号資産取引所から信頼されています。
👍 認証を受けたクリエイターから、有益なインサイトを得られます。
メール / 電話番号
トレンドトピック
1
#NvidiaBeatsEstimatesWith$130BQ4Outlook
閲覧回数 8,443
137人が討論中
2
#AnthropicIPOPriceCouldExceed$80
閲覧回数 14,500
126人が討論中
3
#CanNvidia’sDataCenterGrowthContinue?
閲覧回数 43,399
598人が討論中
4
#CanadaAndUSLaunchOperationNiagaraAgainstApprovalPhishing
閲覧回数 832
19人が討論中
5
#BankOfEnglandUnveilsClearingHousePathwayCoveringDLTFirms
閲覧回数 1,411
36人が討論中
6
#DBSAndCirclePartnerToExpandAsianInstitutionsUSDCAccess
閲覧回数 2,871
51人が討論中
7
#LedgerHardwareImplantReportsExtendToDubai
閲覧回数 11,872
215人が討論中
8
#NvidiaBoardNotConsideringHuang’sReturnasCEO
閲覧回数 205,785
1,481人が討論中
9
#KOSPIFalls2.59%ToLowestCloseSinceFebruary
閲覧回数 58,978
675人が討論中
10
#AnthropicClearedToListOnNasdaqAsANT
閲覧回数 52,733
551人が討論中