
NómadaCripto
6.7k Posts
NómadaCripto
 Square Verified+
Trader with a proprietary methodology, specialized in short opportunities across multiple assets.
Open Trade

BNB Holder
High-Frequency Trader
8.7 Years
229 Following
51.4K+ Followers
41.5K+ Liked
Posts
Portfolio
All
Quotes
Videos
Live
PINNED

·
--
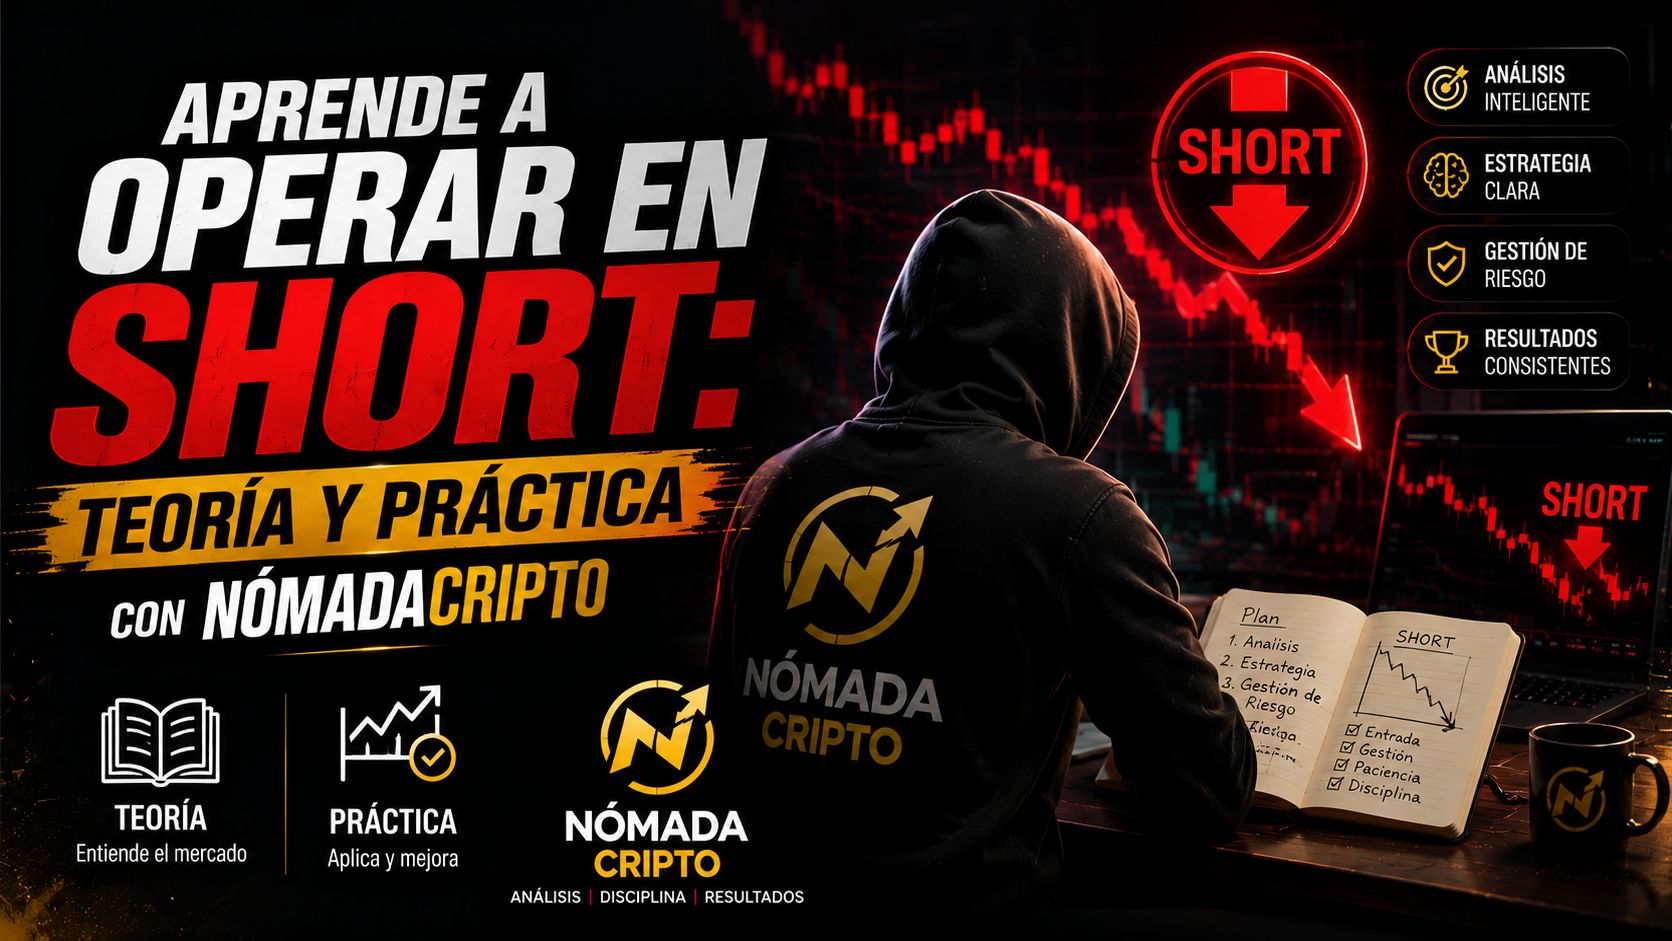
🎙️ Learn to trade in SHORT: Theory and Practice
End
48 m 18 s
295

BTWUSDT
Perp
Position
+6.32
1
Verified
#dusk $DUSK @Dusk
As a trader, when I see that a project wants to bring financial assets on-chain, I first ask myself whether the technology can do it. But as I investigated the collaboration between Dusk and NPEX, another question came up: is the technical capability enough to connect that infrastructure with a regulated market?
Dusk provides infrastructure for issuance, trading, and settlement, while NPEX participates as a regulated European venue with experience operating financial markets.
That changed part of my analysis. One thing is that the technology can support an activity, and another is that there is an authorized actor to carry out specific functions within that market.
Now, when I analyze projects that aim to bring traditional finance on-chain, I don’t just want to look at what the blockchain can do. I also want to identify who connects that technical capability with the institutional functions the market requires.
For me, that distinction helps separate a technological promise from an infrastructure that is trying to integrate with real actors in the financial system.
The wording deliberately keeps NPEX as the regulated participant and does not transfer its authorizations to Dusk. Current sources also support that the collaboration works around issuance, trading, and settlement of regulated markets.$DUSK
As a trader, when I see that a project wants to bring financial assets on-chain, I first ask myself whether the technology can do it. But as I investigated the collaboration between Dusk and NPEX, another question came up: is the technical capability enough to connect that infrastructure with a regulated market?
Dusk provides infrastructure for issuance, trading, and settlement, while NPEX participates as a regulated European venue with experience operating financial markets.
That changed part of my analysis. One thing is that the technology can support an activity, and another is that there is an authorized actor to carry out specific functions within that market.
Now, when I analyze projects that aim to bring traditional finance on-chain, I don’t just want to look at what the blockchain can do. I also want to identify who connects that technical capability with the institutional functions the market requires.
For me, that distinction helps separate a technological promise from an infrastructure that is trying to integrate with real actors in the financial system.
The wording deliberately keeps NPEX as the regulated participant and does not transfer its authorizations to Dusk. Current sources also support that the collaboration works around issuance, trading, and settlement of regulated markets.$DUSK
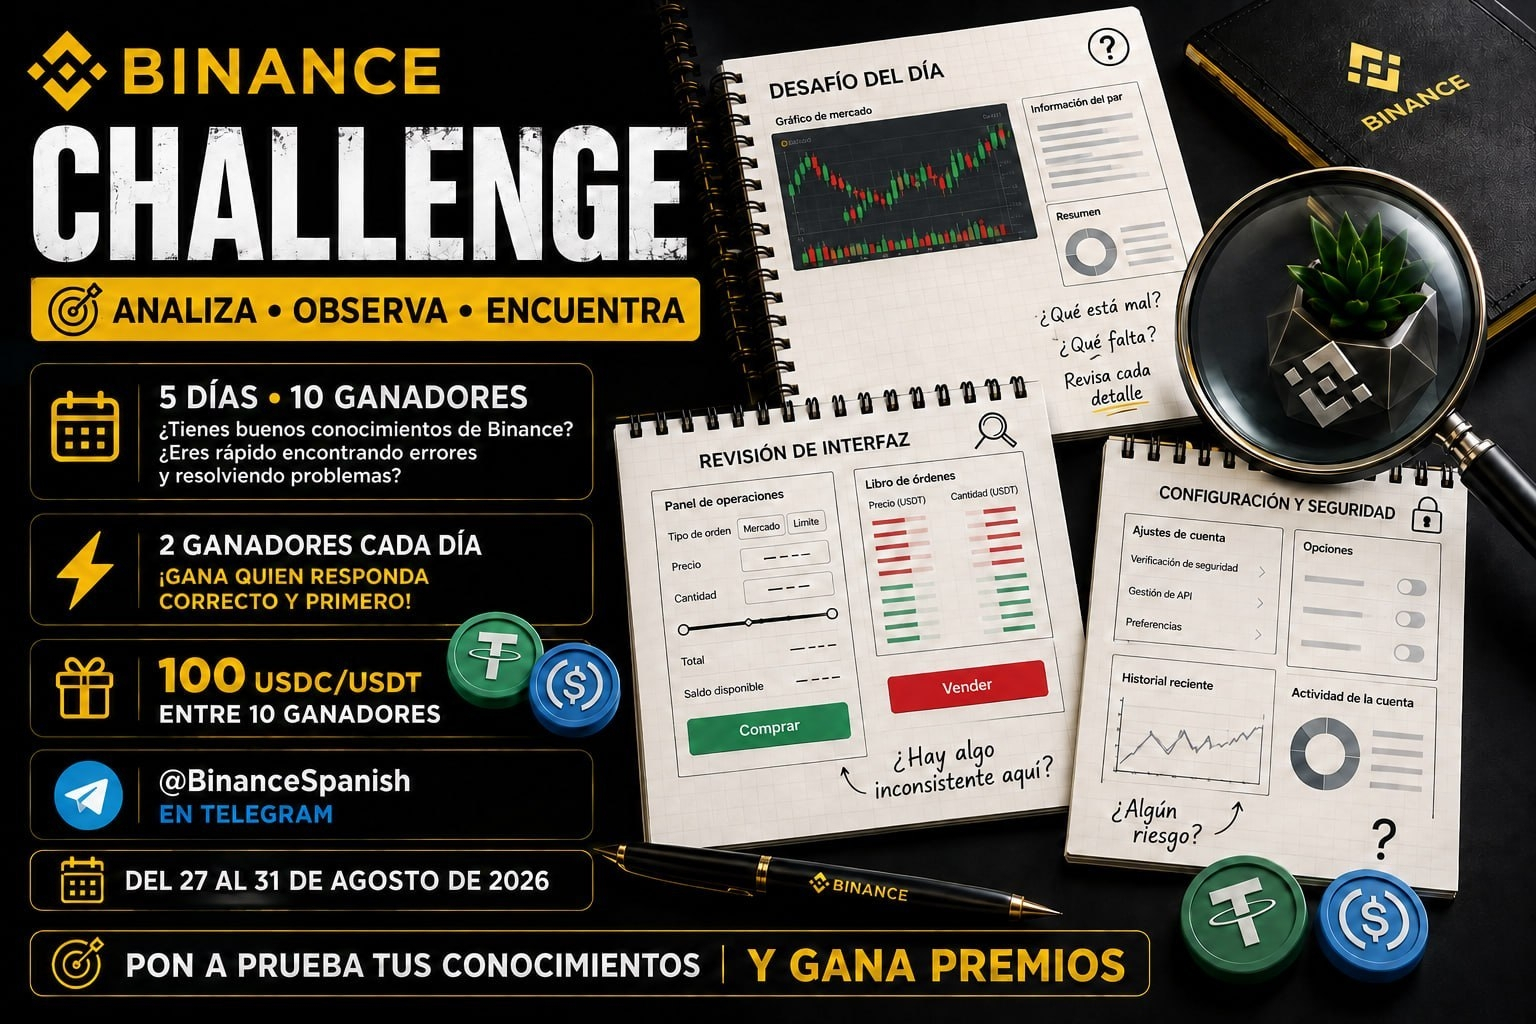
From August 27 to 31, show how much you know about Binance. #BinanceLatam #Nomadacripto


Binance LATAM Official
·
--
🏆 BINANCE CHALLENGE! 🏆
From August 27 to 31, show how much you know about Binance. 🔥 Each day will have a challenge with 2 correct answers and 2 winners. 🥇🥇
The winners will be those who answer correctly and are the first! ⚡️
📍 Exclusive for the Binance in Spanish group on Telegram.
5 days • 10 winners • 2 daily chances
Are you ready? 🚀 Join the Telegram community t.me/Binancespanish
From August 27 to 31, show how much you know about Binance. 🔥 Each day will have a challenge with 2 correct answers and 2 winners. 🥇🥇
The winners will be those who answer correctly and are the first! ⚡️
📍 Exclusive for the Binance in Spanish group on Telegram.
5 days • 10 winners • 2 daily chances
Are you ready? 🚀 Join the Telegram community t.me/Binancespanish
#dusk $DUSK @Dusk
As a trader, I'm used to finding rules when the time comes to execute a trade. But when investigating how Dusk proposes the issuance of regulated assets, an earlier question came up: when did the condition that this operation must comply with begin to exist?
In the workflows that Dusk proposes for regulated assets, certain conditions—such as eligibility requirements or transfer restrictions—can be part of the workflow design from the very beginning.
That changes the order in which I'm normally used to seeing the problem. A rule doesn't necessarily appear because someone tries to trade; it may already be part of the workflow before that specific operation exists.
That's where I found a distinction I want to incorporate into my analysis. I no longer want to ask only which rules condition a trade, but also at what point those conditions entered the operational design that makes it possible.
For me, understanding a rule also means looking at its origin within the process: the trade may be the moment when I encounter a condition, without necessarily being the moment when that condition started becoming part of the system.$DUSK
As a trader, I'm used to finding rules when the time comes to execute a trade. But when investigating how Dusk proposes the issuance of regulated assets, an earlier question came up: when did the condition that this operation must comply with begin to exist?
In the workflows that Dusk proposes for regulated assets, certain conditions—such as eligibility requirements or transfer restrictions—can be part of the workflow design from the very beginning.
That changes the order in which I'm normally used to seeing the problem. A rule doesn't necessarily appear because someone tries to trade; it may already be part of the workflow before that specific operation exists.
That's where I found a distinction I want to incorporate into my analysis. I no longer want to ask only which rules condition a trade, but also at what point those conditions entered the operational design that makes it possible.
For me, understanding a rule also means looking at its origin within the process: the trade may be the moment when I encounter a condition, without necessarily being the moment when that condition started becoming part of the system.$DUSK

KITE AI 中文
·
--
Agent economics need more than just smarter models.
Kite will participate as a sponsor in EastPoint:Seoul 2026. Kite CMO Cindy Shi will discuss: how autonomous AI agents move from intelligence to real economic action.
The event is jointly hosted by Hashed, BloomingBit, and 한국경제신문, bringing together the digital asset and AI industries.🪁
Resource: https://x.com/KiteAIChinese/status/2072986812562501759
Resource: https://x.com/KiteAIChinese/status/2092159233198608539
Kite will participate as a sponsor in EastPoint:Seoul 2026. Kite CMO Cindy Shi will discuss: how autonomous AI agents move from intelligence to real economic action.
The event is jointly hosted by Hashed, BloomingBit, and 한국경제신문, bringing together the digital asset and AI industries.🪁
Resource: https://x.com/KiteAIChinese/status/2072986812562501759
Resource: https://x.com/KiteAIChinese/status/2092159233198608539

Verified
#dusk $DUSK @Dusk
As a trader, when I look at a trade I tend to focus on the outcome and how quickly the information I need arrives so I can interpret it. But while studying an infrastructure, I started to wonder something different: is it enough for messages to arrive fast, or does it also matter whether their behavior is predictable?
That question led me to look at how Dusk organizes communication between participants in its network. I found that Kadcast works as Dusk’s P2P communication layer and uses a structure designed to reduce bandwidth usage and improve the predictability of latency.
Then a second question came up. If the information circulating among participants ends up being used by processes that need to move through different stages, what should I really be looking at when evaluating that infrastructure: only how long it takes for a message to arrive, or also how predictable the path the information follows is?
When reviewing how Dusk describes its consensus, I found that Succinct Attestation goes through stages of proposal, validation, and ratification. That allowed me to connect two elements I was initially observing separately: the way information circulates and the processes that depend on it to move forward.
That changed how I analyze infrastructure. Before, I tended to ask mainly how fast the information moves. Now I want to add another question: how predictable is the path the information follows before the dependent processes can advance?
It doesn’t mean that a faster network is automatically better, nor that predictability alone guarantees a particular outcome. My takeaway is more specific: when I analyze an infrastructure, I also want to observe how the characteristics of the information’s journey can become a relevant variable for understanding what happens after.
@Dusk #dusk $DUSK
As a trader, when I look at a trade I tend to focus on the outcome and how quickly the information I need arrives so I can interpret it. But while studying an infrastructure, I started to wonder something different: is it enough for messages to arrive fast, or does it also matter whether their behavior is predictable?
That question led me to look at how Dusk organizes communication between participants in its network. I found that Kadcast works as Dusk’s P2P communication layer and uses a structure designed to reduce bandwidth usage and improve the predictability of latency.
Then a second question came up. If the information circulating among participants ends up being used by processes that need to move through different stages, what should I really be looking at when evaluating that infrastructure: only how long it takes for a message to arrive, or also how predictable the path the information follows is?
When reviewing how Dusk describes its consensus, I found that Succinct Attestation goes through stages of proposal, validation, and ratification. That allowed me to connect two elements I was initially observing separately: the way information circulates and the processes that depend on it to move forward.
That changed how I analyze infrastructure. Before, I tended to ask mainly how fast the information moves. Now I want to add another question: how predictable is the path the information follows before the dependent processes can advance?
It doesn’t mean that a faster network is automatically better, nor that predictability alone guarantees a particular outcome. My takeaway is more specific: when I analyze an infrastructure, I also want to observe how the characteristics of the information’s journey can become a relevant variable for understanding what happens after.
@Dusk #dusk $DUSK
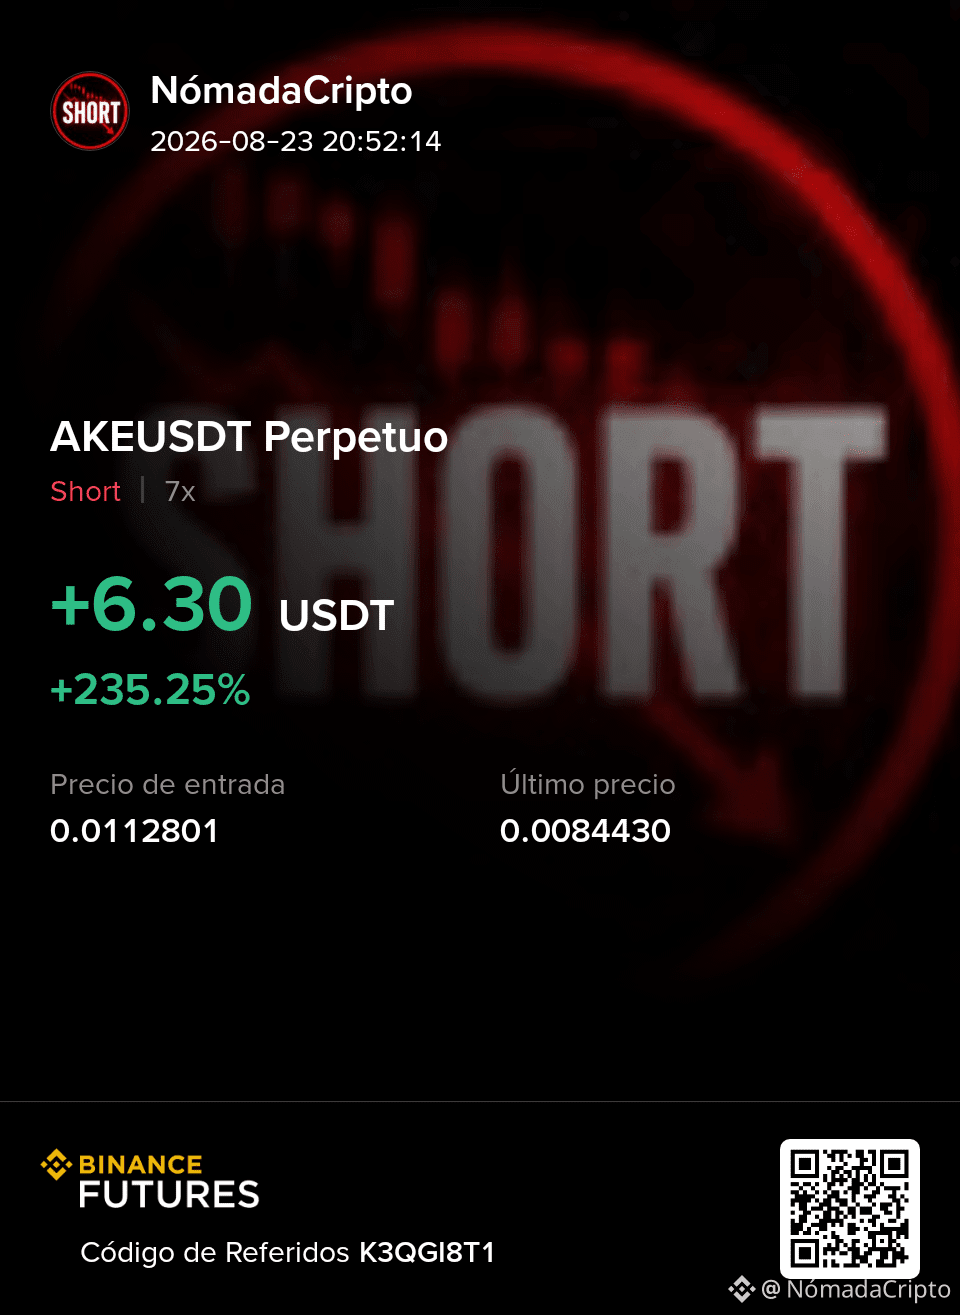
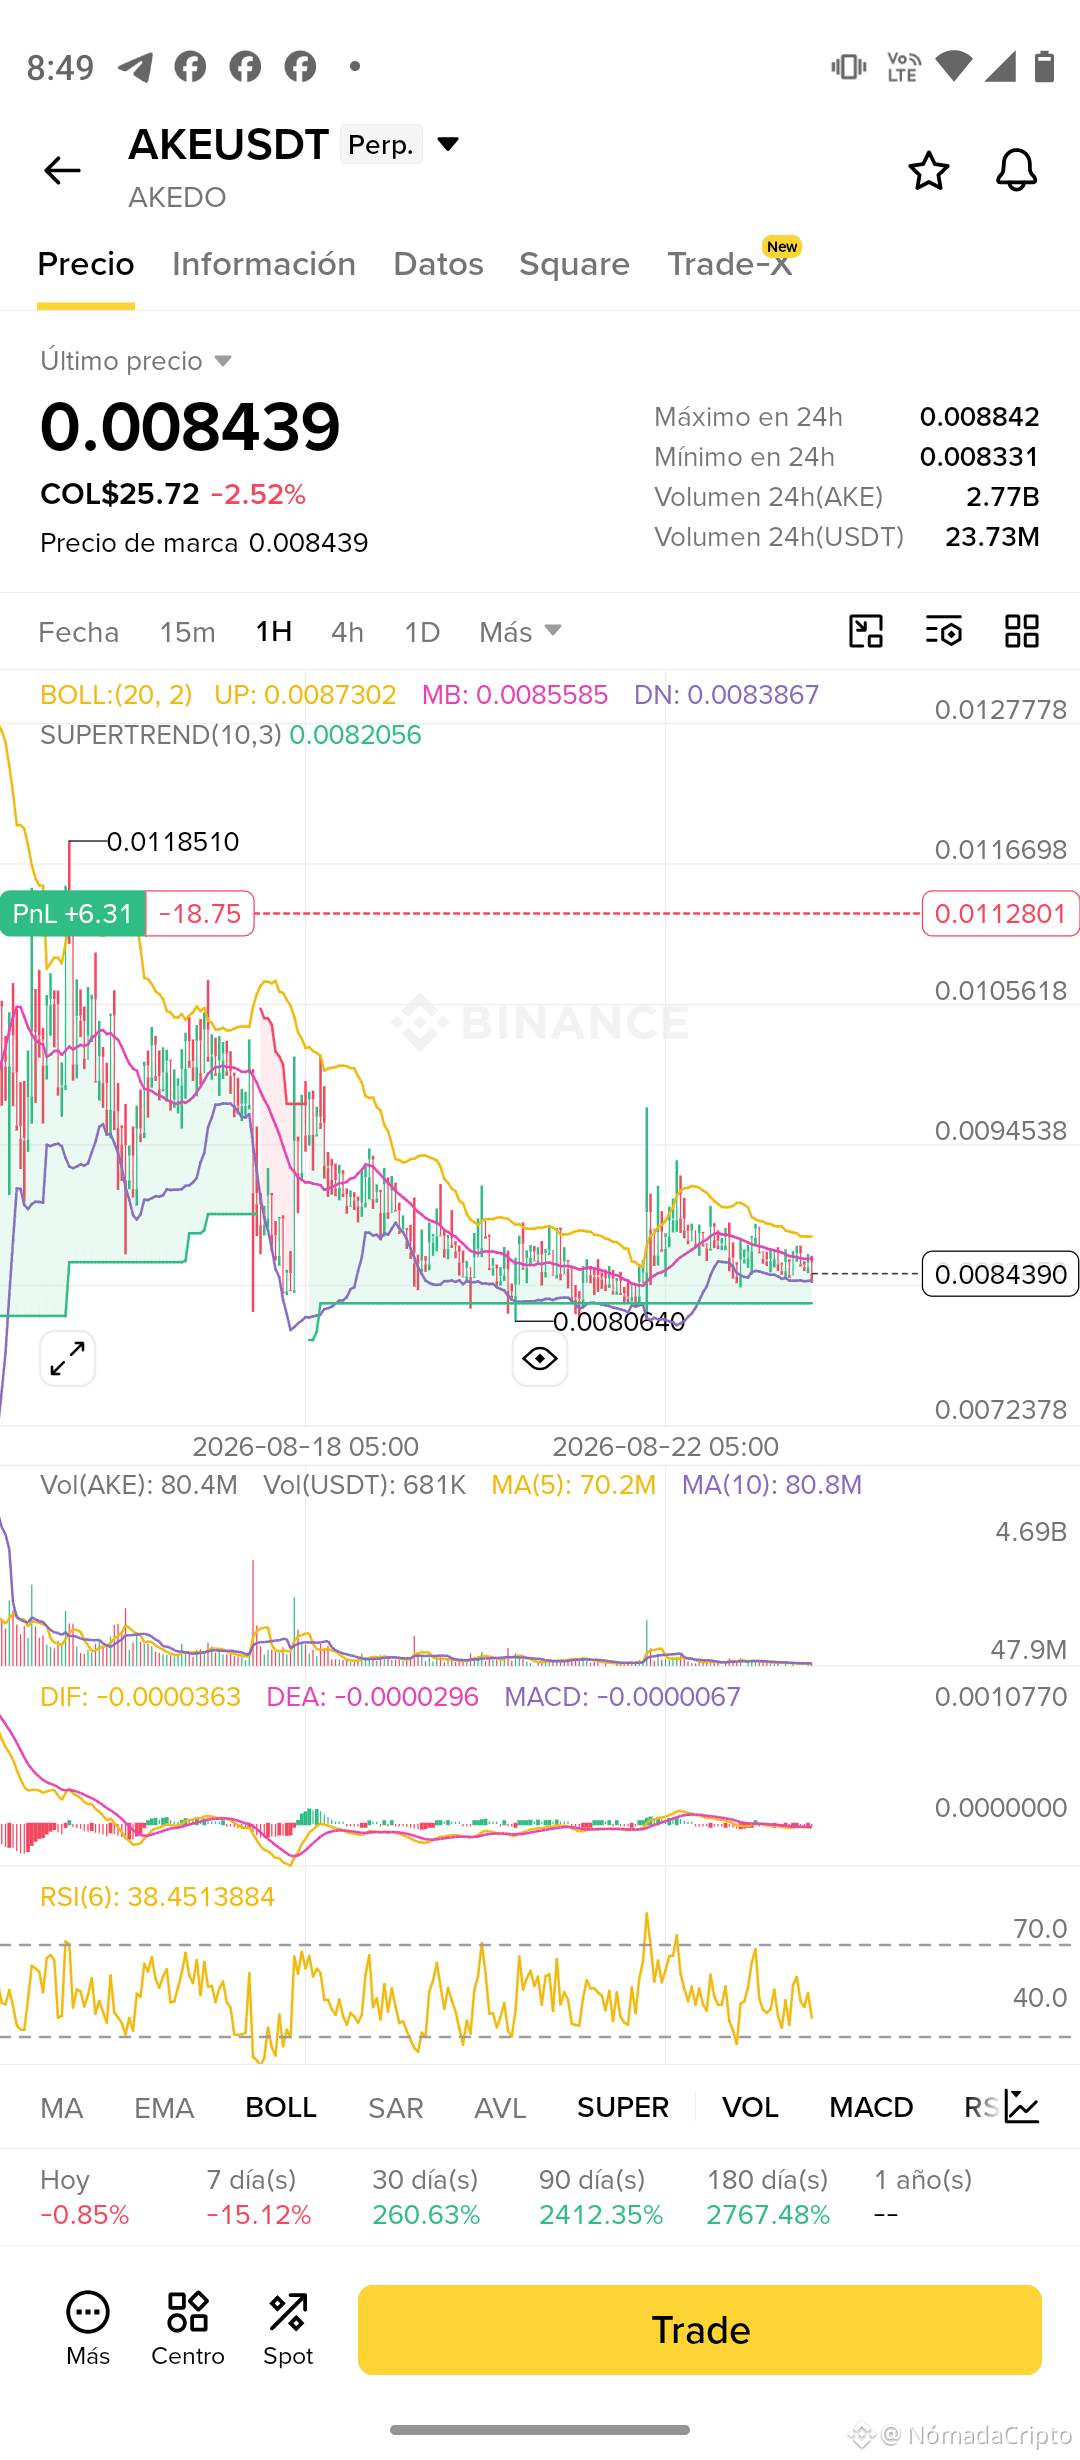
$AKE is serving me to test an idea I consider fundamental in my method: extraordinary historical performance can coexist with a completely different current structure. My short entry is at 0.0112801 and, as I continue along the path, AKE trades around 0.008439.
The first observation seems clear: in 7 days it accumulates a drop of 15.12%, while in 90 days it still holds on to a +260.63% and in 180 days an impressive +2,767.48%. But here is the question I’m interested in: why should I interpret that accumulated performance as current strength if the price has been compressing for several days after such a big expansion?
The chart provides a second clue. The price is below the Bollinger average of 0.0085585, the RSI is 38.45, and the MACD remains slightly negative. I don’t need to turn these data into a signal; I’m interested in observing what happens when several data points stop backing the idea that past performance represents the present structure.
My theory remains in the testing phase: accumulated performance describes what an asset has already done; the current structure helps me study what it is doing now. That’s why I don’t want to accept this idea just because it sounds logical. I want to keep recording trades until I discover whether the statistics from my method really confirm it.
#ShareMyTradFi #Nomadacripto #AKE #Trading #Futuros $AKE
The first observation seems clear: in 7 days it accumulates a drop of 15.12%, while in 90 days it still holds on to a +260.63% and in 180 days an impressive +2,767.48%. But here is the question I’m interested in: why should I interpret that accumulated performance as current strength if the price has been compressing for several days after such a big expansion?
The chart provides a second clue. The price is below the Bollinger average of 0.0085585, the RSI is 38.45, and the MACD remains slightly negative. I don’t need to turn these data into a signal; I’m interested in observing what happens when several data points stop backing the idea that past performance represents the present structure.
My theory remains in the testing phase: accumulated performance describes what an asset has already done; the current structure helps me study what it is doing now. That’s why I don’t want to accept this idea just because it sounds logical. I want to keep recording trades until I discover whether the statistics from my method really confirm it.
#ShareMyTradFi #Nomadacripto #AKE #Trading #Futuros $AKE
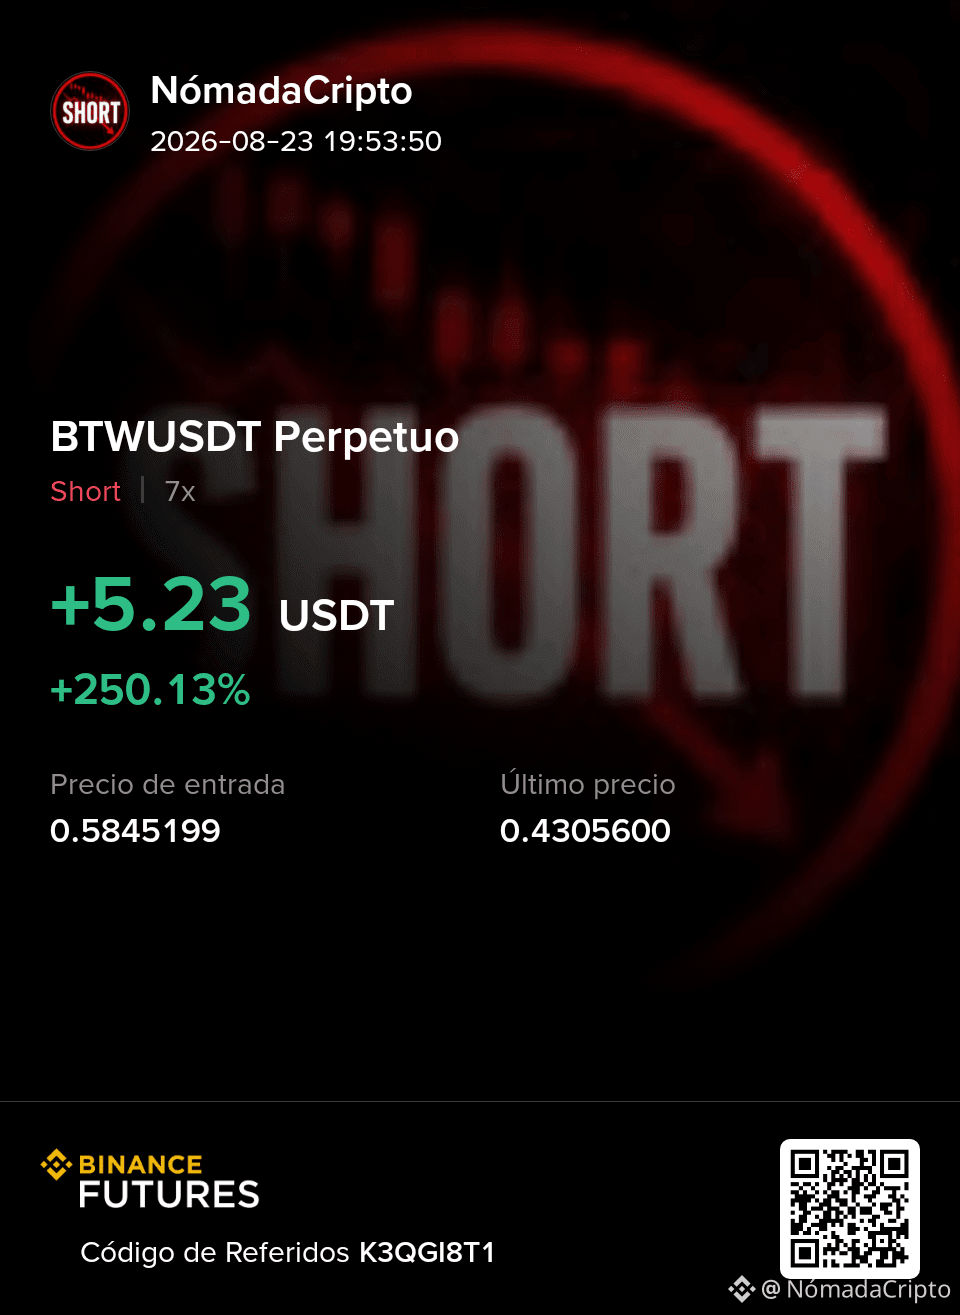
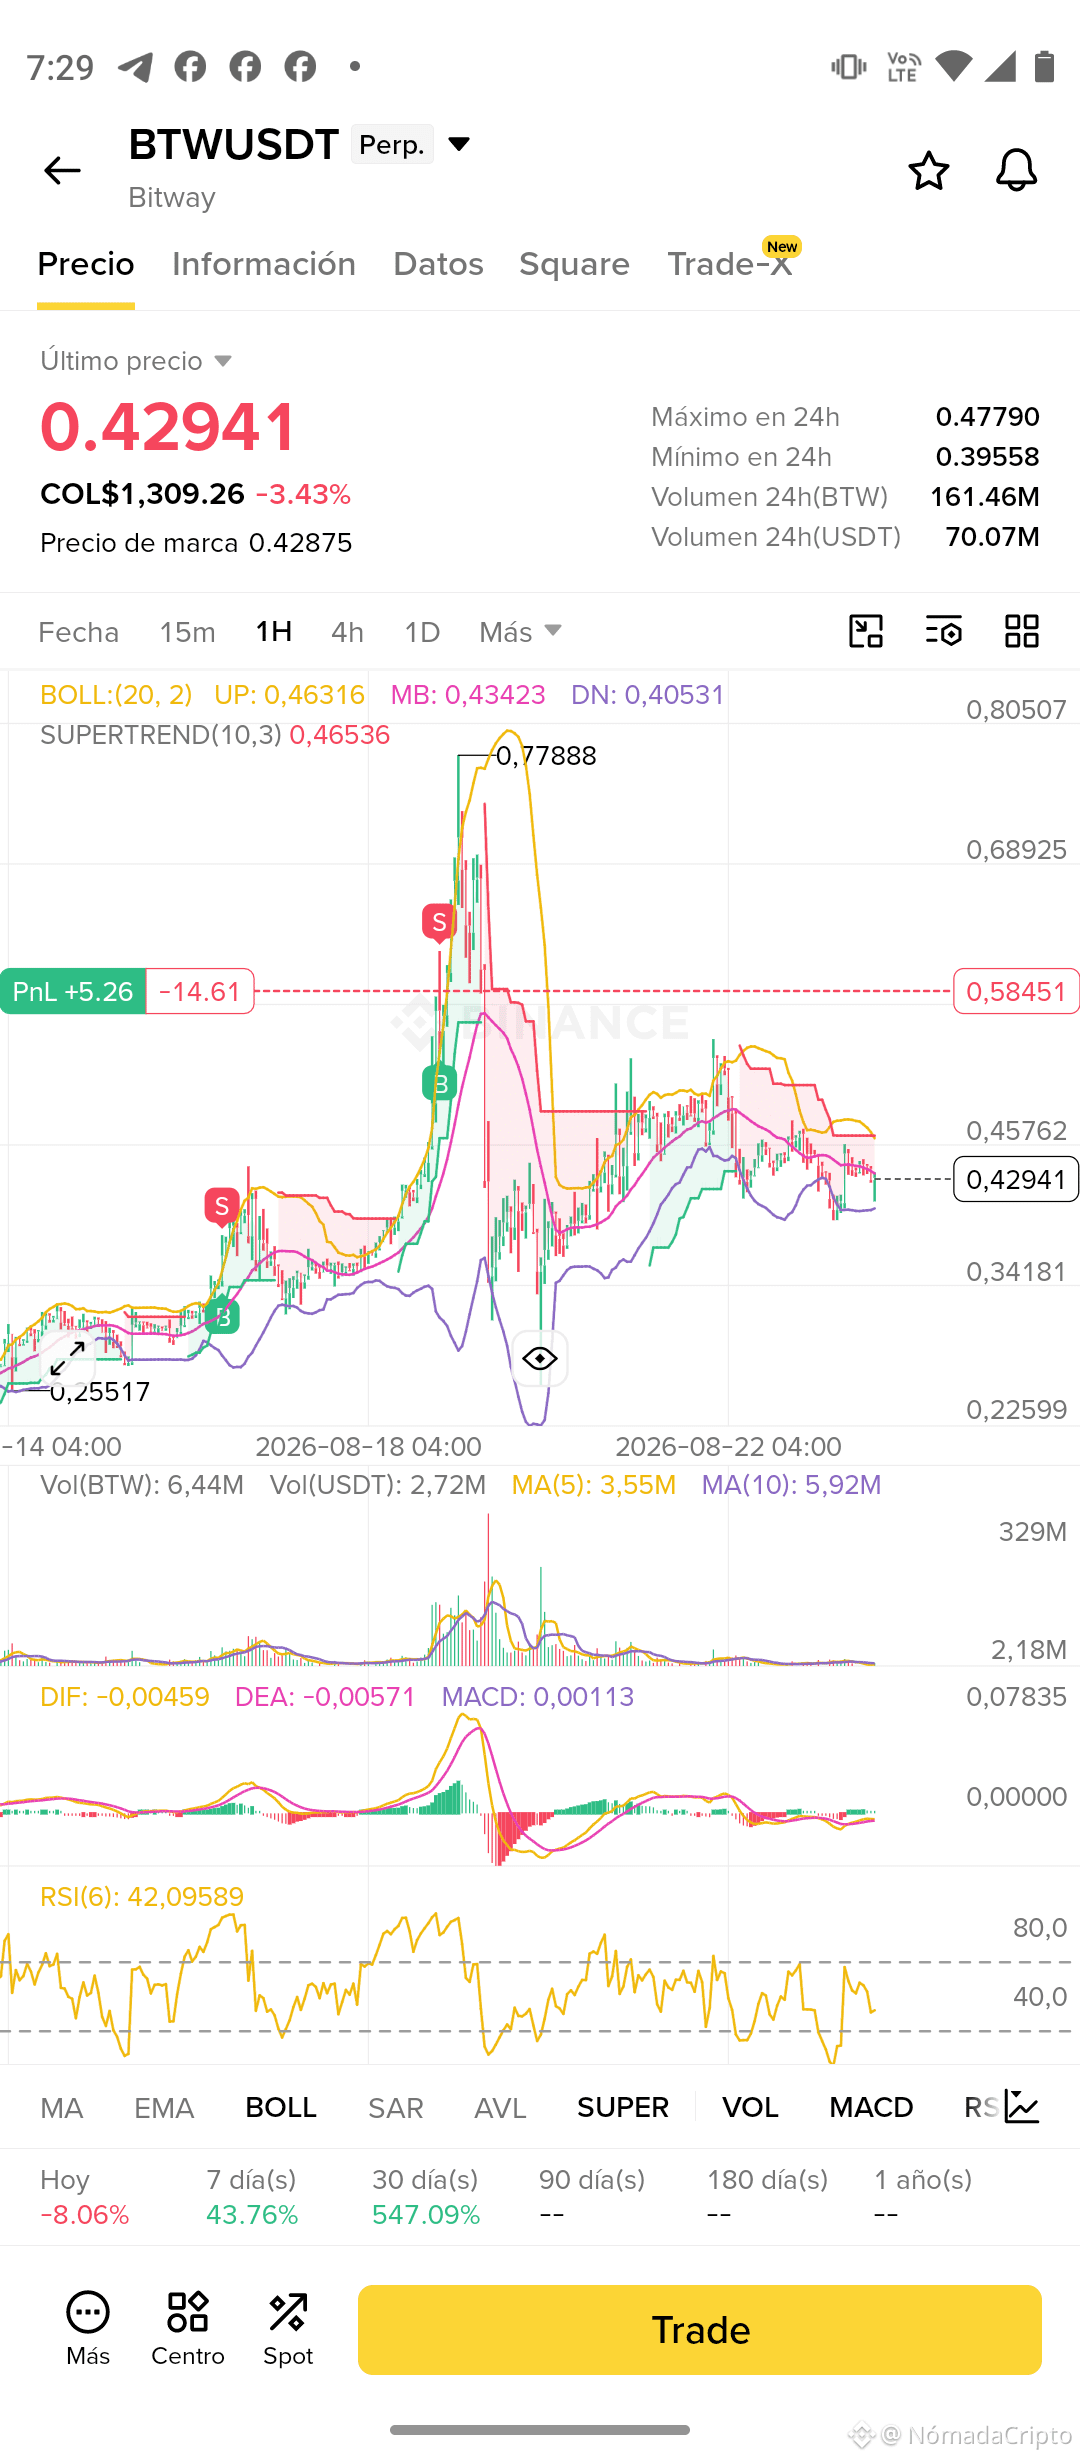
$BTW me is serving to continue testing an idea from my method: the movement that matters for an entry is not always the first major displacement, but what happens after it. In BTW I opened my short position around 0.58451 and, since then, I’ve been watching how the asset attempts to rebuild after moving from a visible high of 0.77888 down to a low near 0.25954.
What’s interesting now is the contradiction. BTW still shows a performance of 43.76% over seven days and 547.09% over 90 days, but in the one-hour structure the price is around 0.42941—below the Bollinger average at 0.43420 and below the Supertrend at 0.46356. This makes me question an idea that we often confuse when analyzing an asset: an extraordinary accumulated return does not necessarily mean that the current strength will continue intact.
My theory, still under investigation, is that after an extreme expansion I should separate the return that has already happened from the structure the asset is building right now. I’m not trying to guess the next move of BTW; I’m using this trade to check how long that gap can remain valid and what statistics appear when I observe it repeatedly.
For me, that’s the real usefulness of trading: not repeating concepts just because they sound right, but putting them to trades, recording results, and adjusting the method when the data forces us to.
#ShareMyTradFi #Nomadacripto #BTW #Bitway #Trading $BTW
What’s interesting now is the contradiction. BTW still shows a performance of 43.76% over seven days and 547.09% over 90 days, but in the one-hour structure the price is around 0.42941—below the Bollinger average at 0.43420 and below the Supertrend at 0.46356. This makes me question an idea that we often confuse when analyzing an asset: an extraordinary accumulated return does not necessarily mean that the current strength will continue intact.
My theory, still under investigation, is that after an extreme expansion I should separate the return that has already happened from the structure the asset is building right now. I’m not trying to guess the next move of BTW; I’m using this trade to check how long that gap can remain valid and what statistics appear when I observe it repeatedly.
For me, that’s the real usefulness of trading: not repeating concepts just because they sound right, but putting them to trades, recording results, and adjusting the method when the data forces us to.
#ShareMyTradFi #Nomadacripto #BTW #Bitway #Trading $BTW
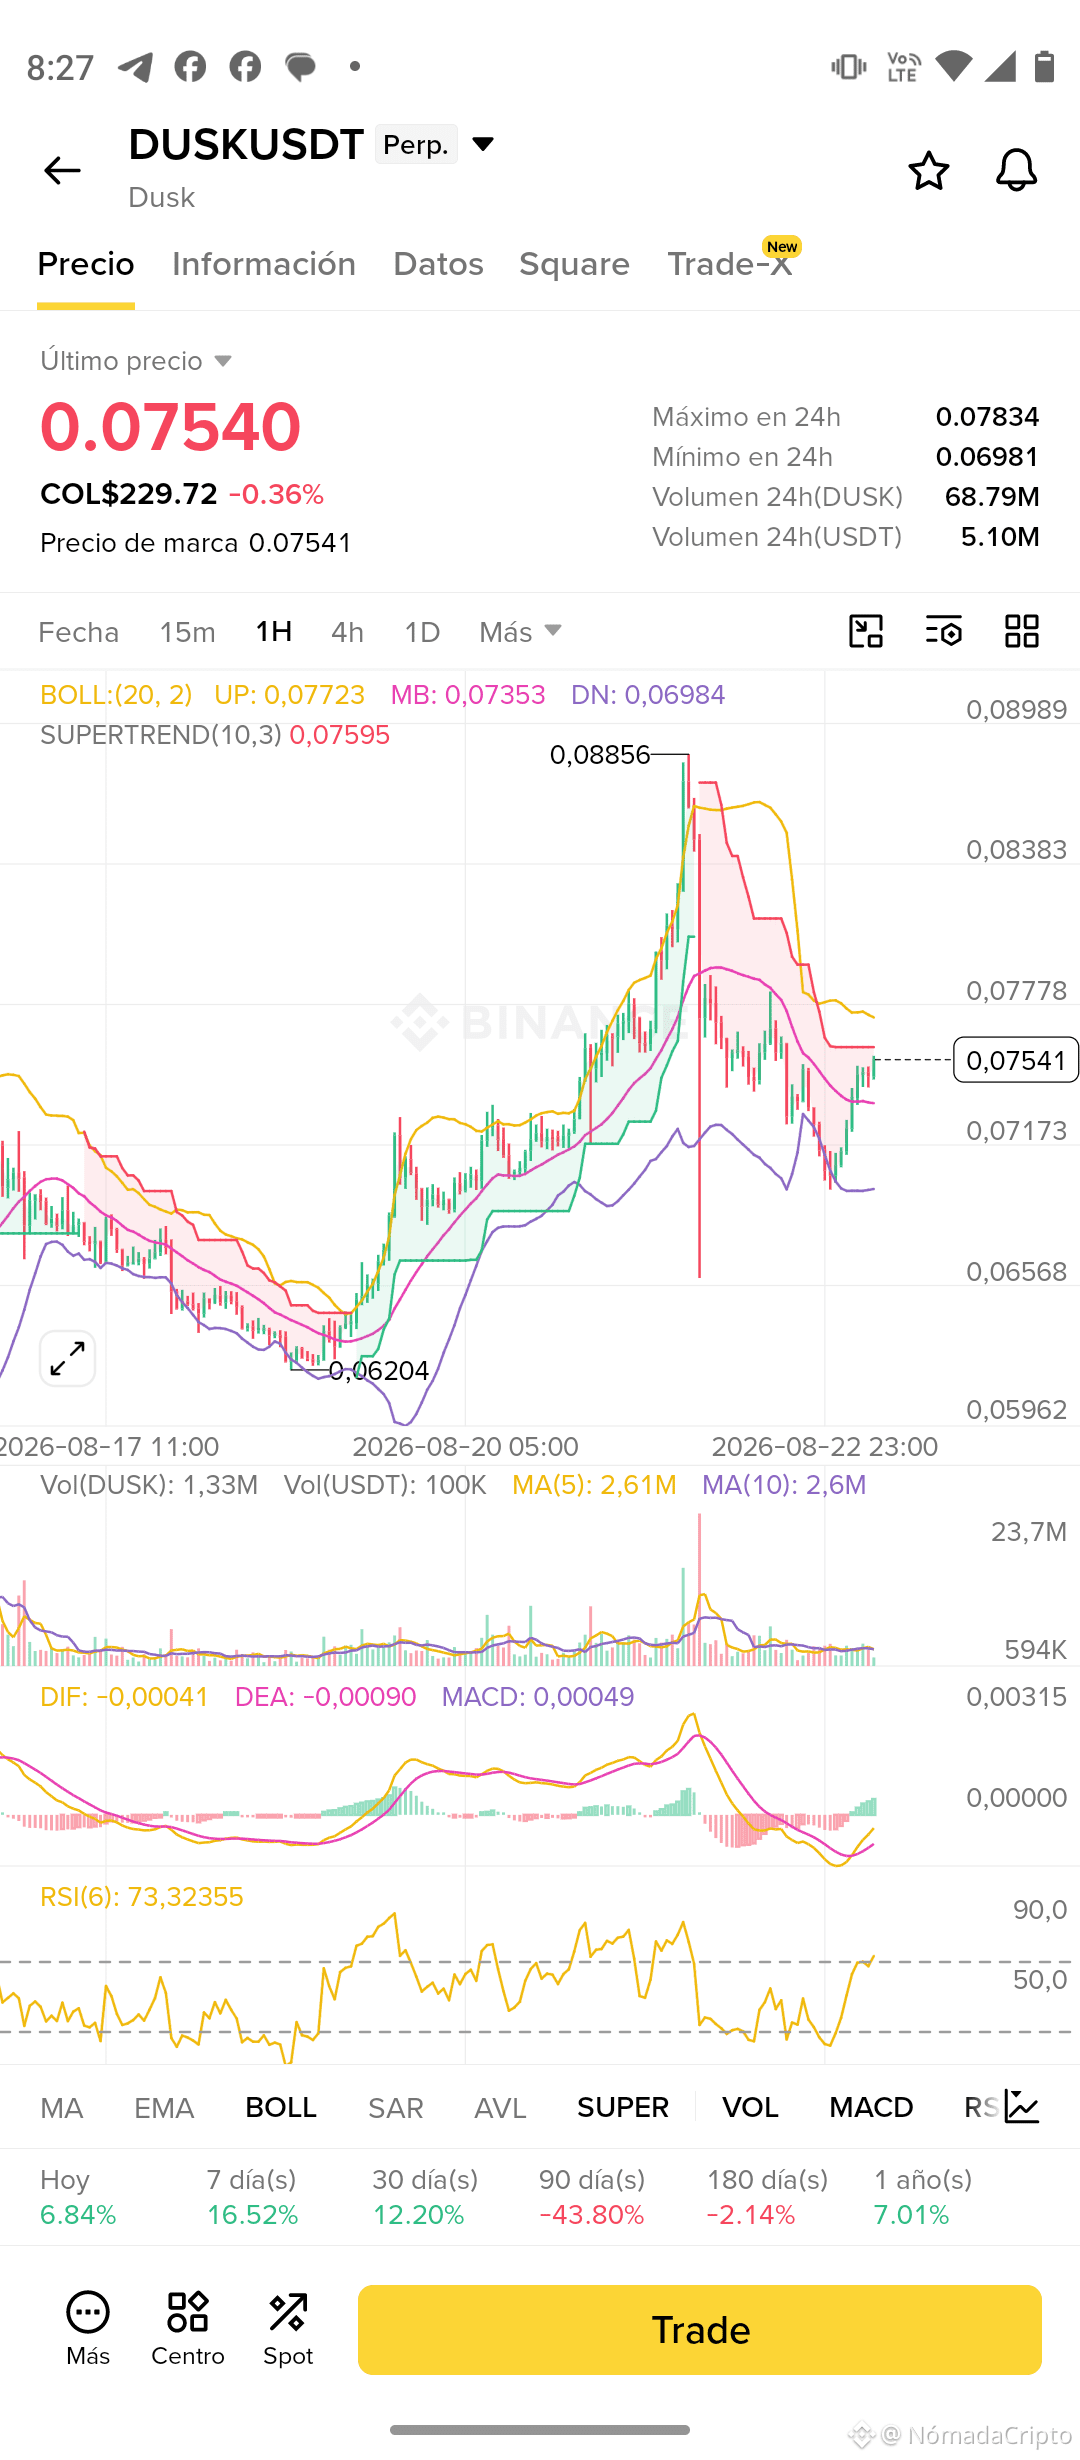
#dusk $DUSK @Dusk
As a trader, when I compare two different ways of operating the same activity, I usually start by looking at where it happens and what tools each one uses. But lately I’ve been wondering whether looking only at the environment in which an application runs really lets me understand which part of its infrastructure is different.
That question led me to review how Dusk organizes its execution environments. I found that DuskVM lets you run Rust/WASM contracts directly on Dusk L1, while DuskEVM provides an EVM-compatible environment. These are different execution paths, and that made me come up with a different question: if the execution environment changes, what should you actually compare in order to know whether two applications are built on a common foundation?
As I went deeper, I found that DuskDS provides the foundation related to consensus, settlement, and data availability, while the different environments occupy the execution layer. This made me notice a difference I hadn’t been separating before: that two applications use different environments doesn’t necessarily mean that all variables in their infrastructure are also different.
That’s where my criteria for analyzing an infrastructure changed. Before, I tended to compare mainly where an application ran and what environment it used. Now I want to separate which part of its behavior depends on the execution environment, and which part can be supported by elements that remain common across the infrastructure.
As a trader, this distinction seems useful because it prevents comparing systems only based on what changes at first glance. When I analyze an infrastructure, I also want to identify which variables depend on the environment and which ones remain as a common baseline, because this separation can reveal differences that aren’t obvious when you look only at where an application is executed.
Maybe understanding an infrastructure isn’t just about identifying its different paths, but about learning to tell what changes when you take each one
As a trader, when I compare two different ways of operating the same activity, I usually start by looking at where it happens and what tools each one uses. But lately I’ve been wondering whether looking only at the environment in which an application runs really lets me understand which part of its infrastructure is different.
That question led me to review how Dusk organizes its execution environments. I found that DuskVM lets you run Rust/WASM contracts directly on Dusk L1, while DuskEVM provides an EVM-compatible environment. These are different execution paths, and that made me come up with a different question: if the execution environment changes, what should you actually compare in order to know whether two applications are built on a common foundation?
As I went deeper, I found that DuskDS provides the foundation related to consensus, settlement, and data availability, while the different environments occupy the execution layer. This made me notice a difference I hadn’t been separating before: that two applications use different environments doesn’t necessarily mean that all variables in their infrastructure are also different.
That’s where my criteria for analyzing an infrastructure changed. Before, I tended to compare mainly where an application ran and what environment it used. Now I want to separate which part of its behavior depends on the execution environment, and which part can be supported by elements that remain common across the infrastructure.
As a trader, this distinction seems useful because it prevents comparing systems only based on what changes at first glance. When I analyze an infrastructure, I also want to identify which variables depend on the environment and which ones remain as a common baseline, because this separation can reveal differences that aren’t obvious when you look only at where an application is executed.
Maybe understanding an infrastructure isn’t just about identifying its different paths, but about learning to tell what changes when you take each one
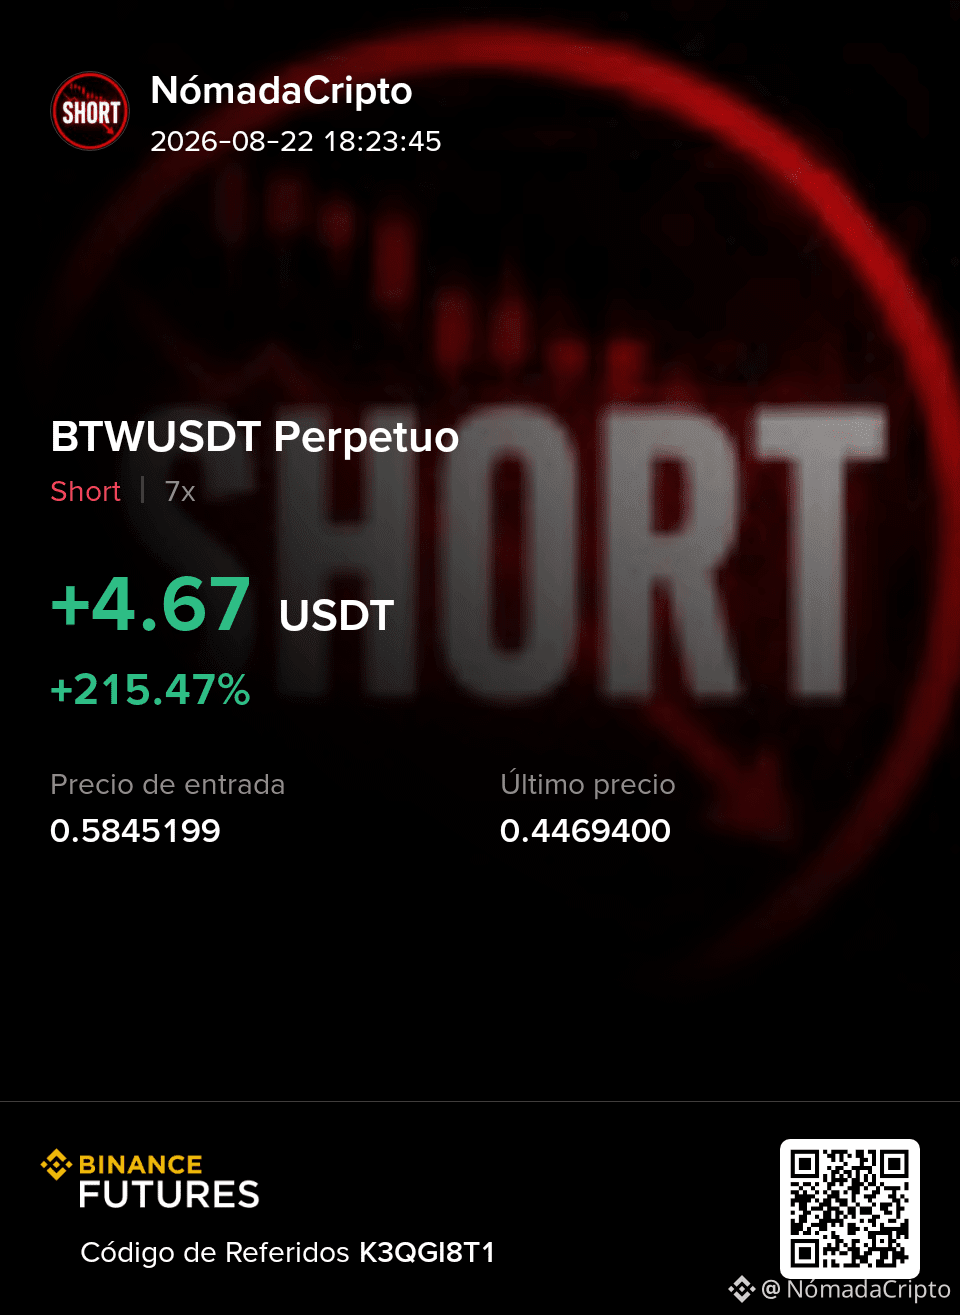
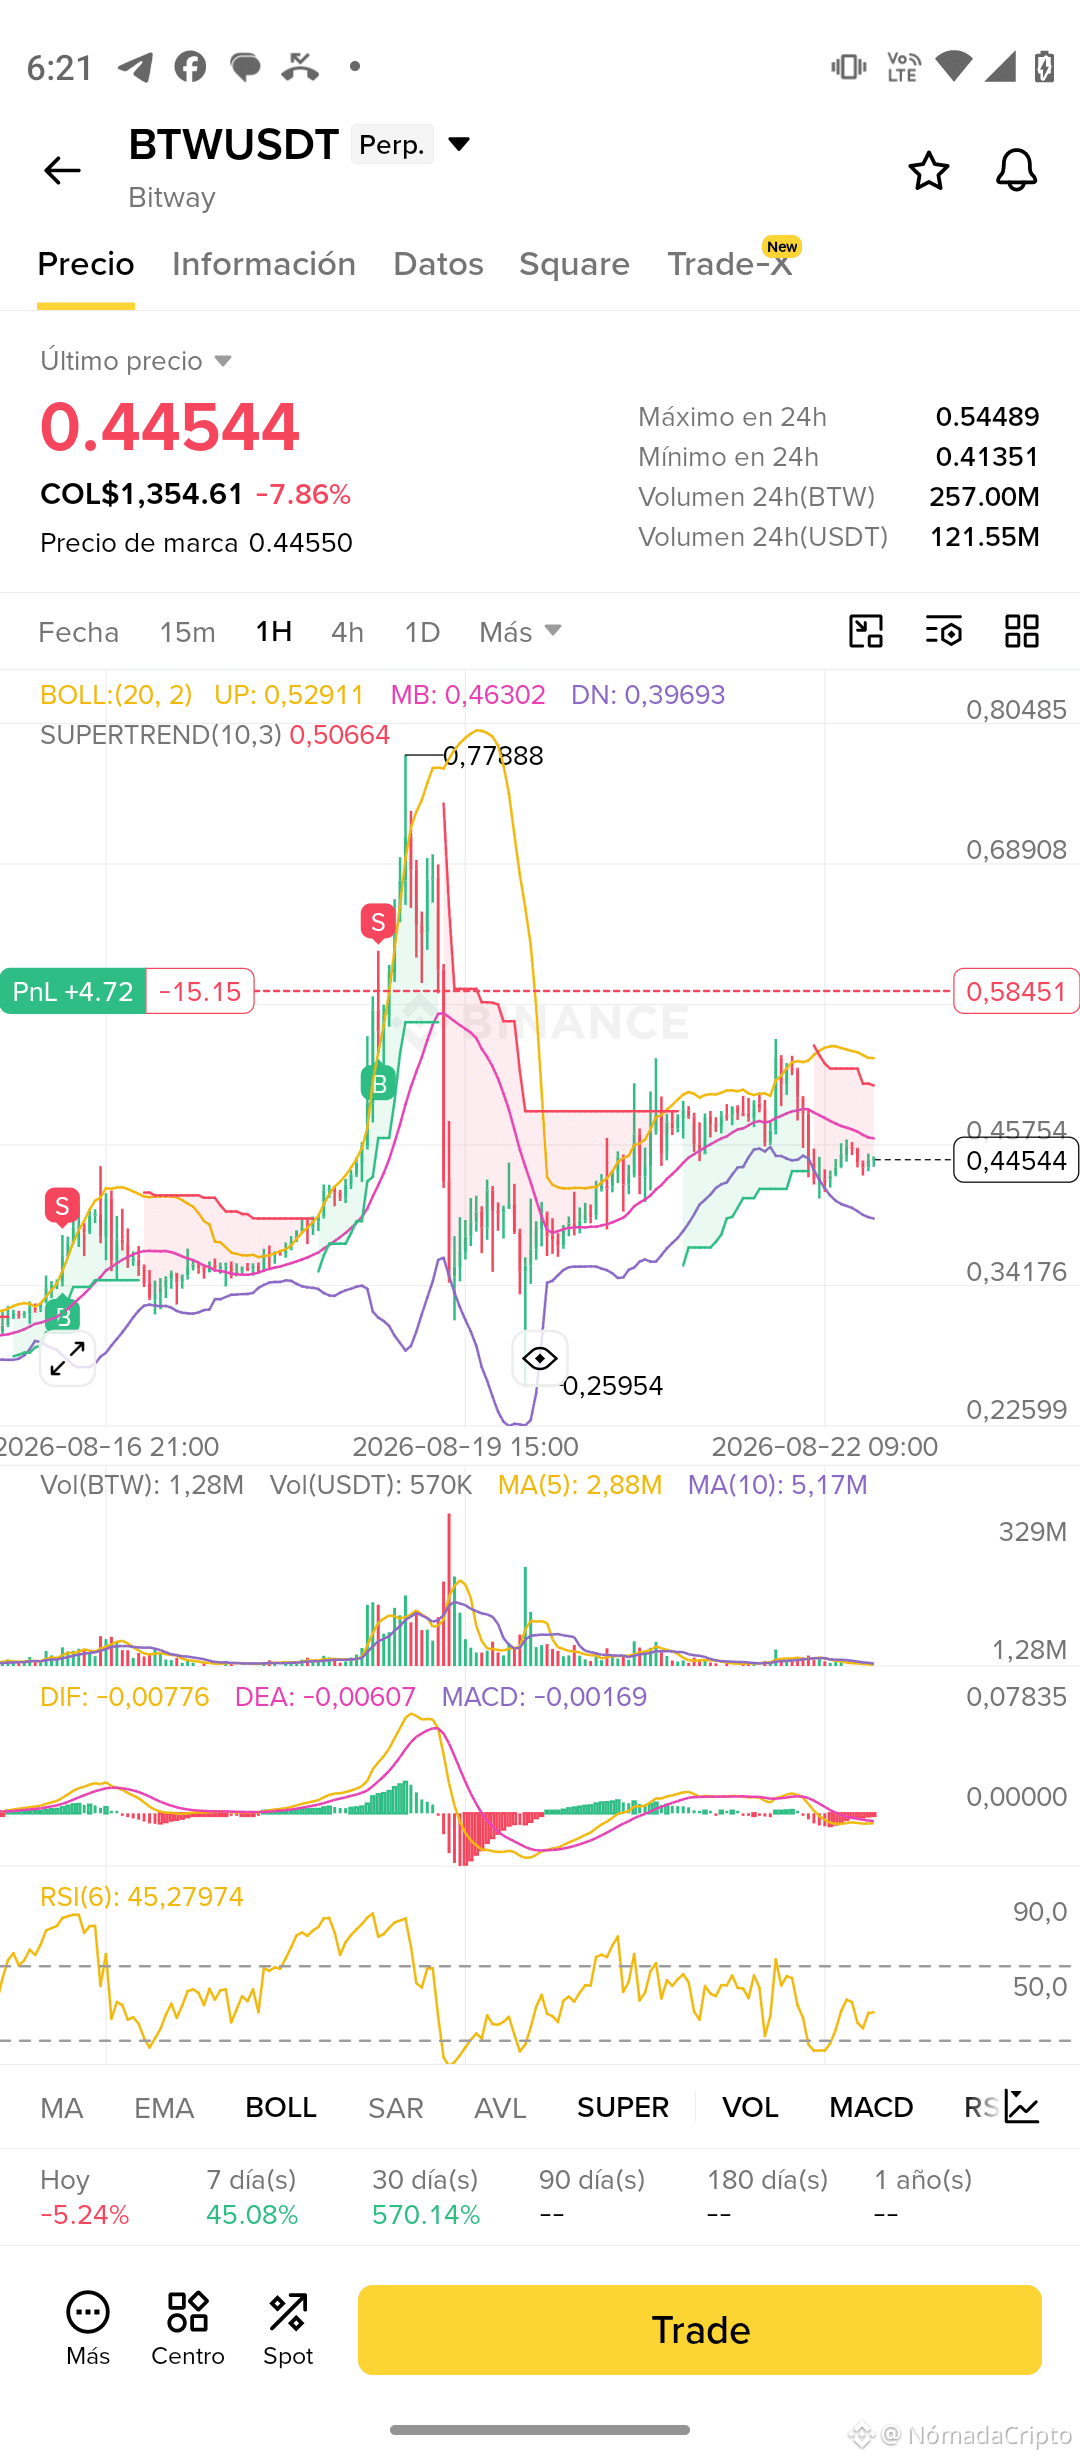
$BTW revisit to test one of the ideas I’m investigating within my method: after an extreme drop, a rebound does not necessarily mean the downtrend has ended.
On the chart you can see how BTW moved from 0.77888 to 0.25954 and then regained ground, approaching 0.50. It is now trading around 0.445, below the Bollinger middle band (0.463) and the Supertrend (0.506), while the MACD is again showing negative pressure and the RSI remains near 45.
This is where an important difference shows up between looking at an indicator and having a method. An indicator can describe the move; my research is trying to determine what behavior usually occurs after certain types of moves, and how long it can last.
This trade is precisely part of that process. I’m not trying to prove that BTW will necessarily fall. I’m recording what happens after a strong recovery and checking whether my statistic about these runs really has the ability to anticipate the next phase.
For me, trading isn’t about being right about a coin. It’s about accumulating enough observations to discover when a hypothesis starts becoming an applicable statistic.
#ShareMyTradFi #Nomadacripto #BTW #Trading #Futuros $BTW
On the chart you can see how BTW moved from 0.77888 to 0.25954 and then regained ground, approaching 0.50. It is now trading around 0.445, below the Bollinger middle band (0.463) and the Supertrend (0.506), while the MACD is again showing negative pressure and the RSI remains near 45.
This is where an important difference shows up between looking at an indicator and having a method. An indicator can describe the move; my research is trying to determine what behavior usually occurs after certain types of moves, and how long it can last.
This trade is precisely part of that process. I’m not trying to prove that BTW will necessarily fall. I’m recording what happens after a strong recovery and checking whether my statistic about these runs really has the ability to anticipate the next phase.
For me, trading isn’t about being right about a coin. It’s about accumulating enough observations to discover when a hypothesis starts becoming an applicable statistic.
#ShareMyTradFi #Nomadacripto #BTW #Trading #Futuros $BTW
#dusk $DUSK @Dusk
As a trader, I often think about a trade from the moment I make the decision until I see whether the result was favorable or not. But I started to wonder about something that I had previously oversimplified: what happens to a trade that shouldn’t be executed from the start?
That question led me to investigate how Dusk handles certain restrictions on regulated assets. I found that there are controls that determine under what conditions a transfer can be made. Then a second question emerged: if a trade can be incompatible with a given condition, when can I know that?
As I delved deeper, I found that certain controls can be checked or simulated before submitting a transaction. That’s when I realized a difference I hadn’t noticed before. It’s not just about knowing whether a transfer complies with a rule, but about when I can discover that an incompatibility exists.
That changed part of how I view a trade. Before, I tended to think of operational risk as something you uncover when you try to carry out an action. Now I want to distinguish between the conditions I can verify before sending a transaction and those that I can only learn during or after its execution.
As a trader, that changes part of my analysis: before committing to a trade, I also want to ask myself which conditions I can verify in advance and which will remain uncertain.
Maybe part of operational risk isn’t just about what can go wrong during a trade, but also about recognizing which questions can be answered before turning a decision into a transaction.
@Dusk #dusk $DUSK
As a trader, I often think about a trade from the moment I make the decision until I see whether the result was favorable or not. But I started to wonder about something that I had previously oversimplified: what happens to a trade that shouldn’t be executed from the start?
That question led me to investigate how Dusk handles certain restrictions on regulated assets. I found that there are controls that determine under what conditions a transfer can be made. Then a second question emerged: if a trade can be incompatible with a given condition, when can I know that?
As I delved deeper, I found that certain controls can be checked or simulated before submitting a transaction. That’s when I realized a difference I hadn’t noticed before. It’s not just about knowing whether a transfer complies with a rule, but about when I can discover that an incompatibility exists.
That changed part of how I view a trade. Before, I tended to think of operational risk as something you uncover when you try to carry out an action. Now I want to distinguish between the conditions I can verify before sending a transaction and those that I can only learn during or after its execution.
As a trader, that changes part of my analysis: before committing to a trade, I also want to ask myself which conditions I can verify in advance and which will remain uncertain.
Maybe part of operational risk isn’t just about what can go wrong during a trade, but also about recognizing which questions can be answered before turning a decision into a transaction.
@Dusk #dusk $DUSK
·
--
🎙️ The best assets to trade in SHORT are here.
End
03 h 02 m 26 s
950
BTWUSDT
Perp
Position
+4.49
0
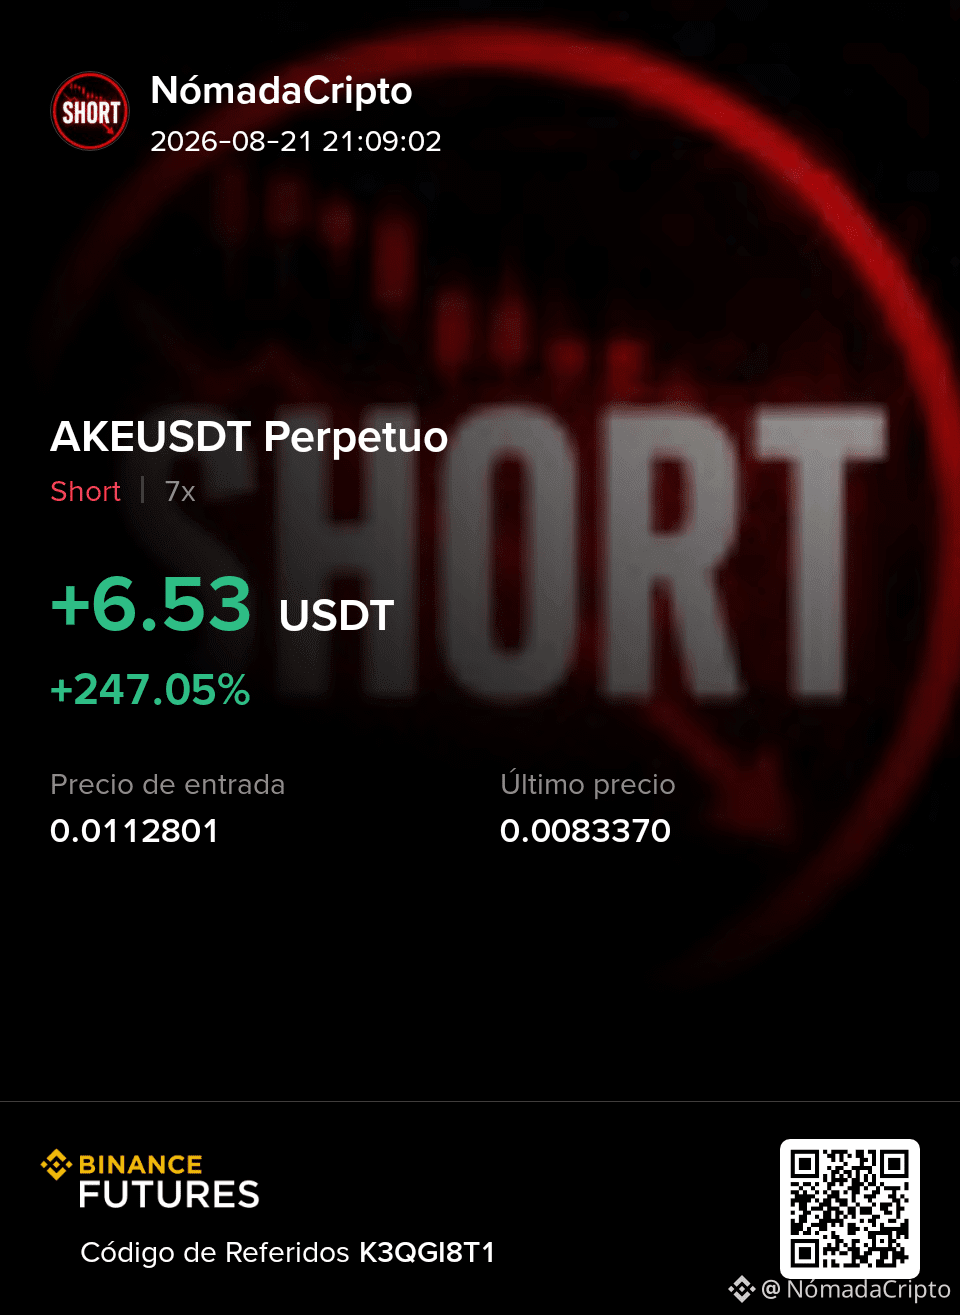
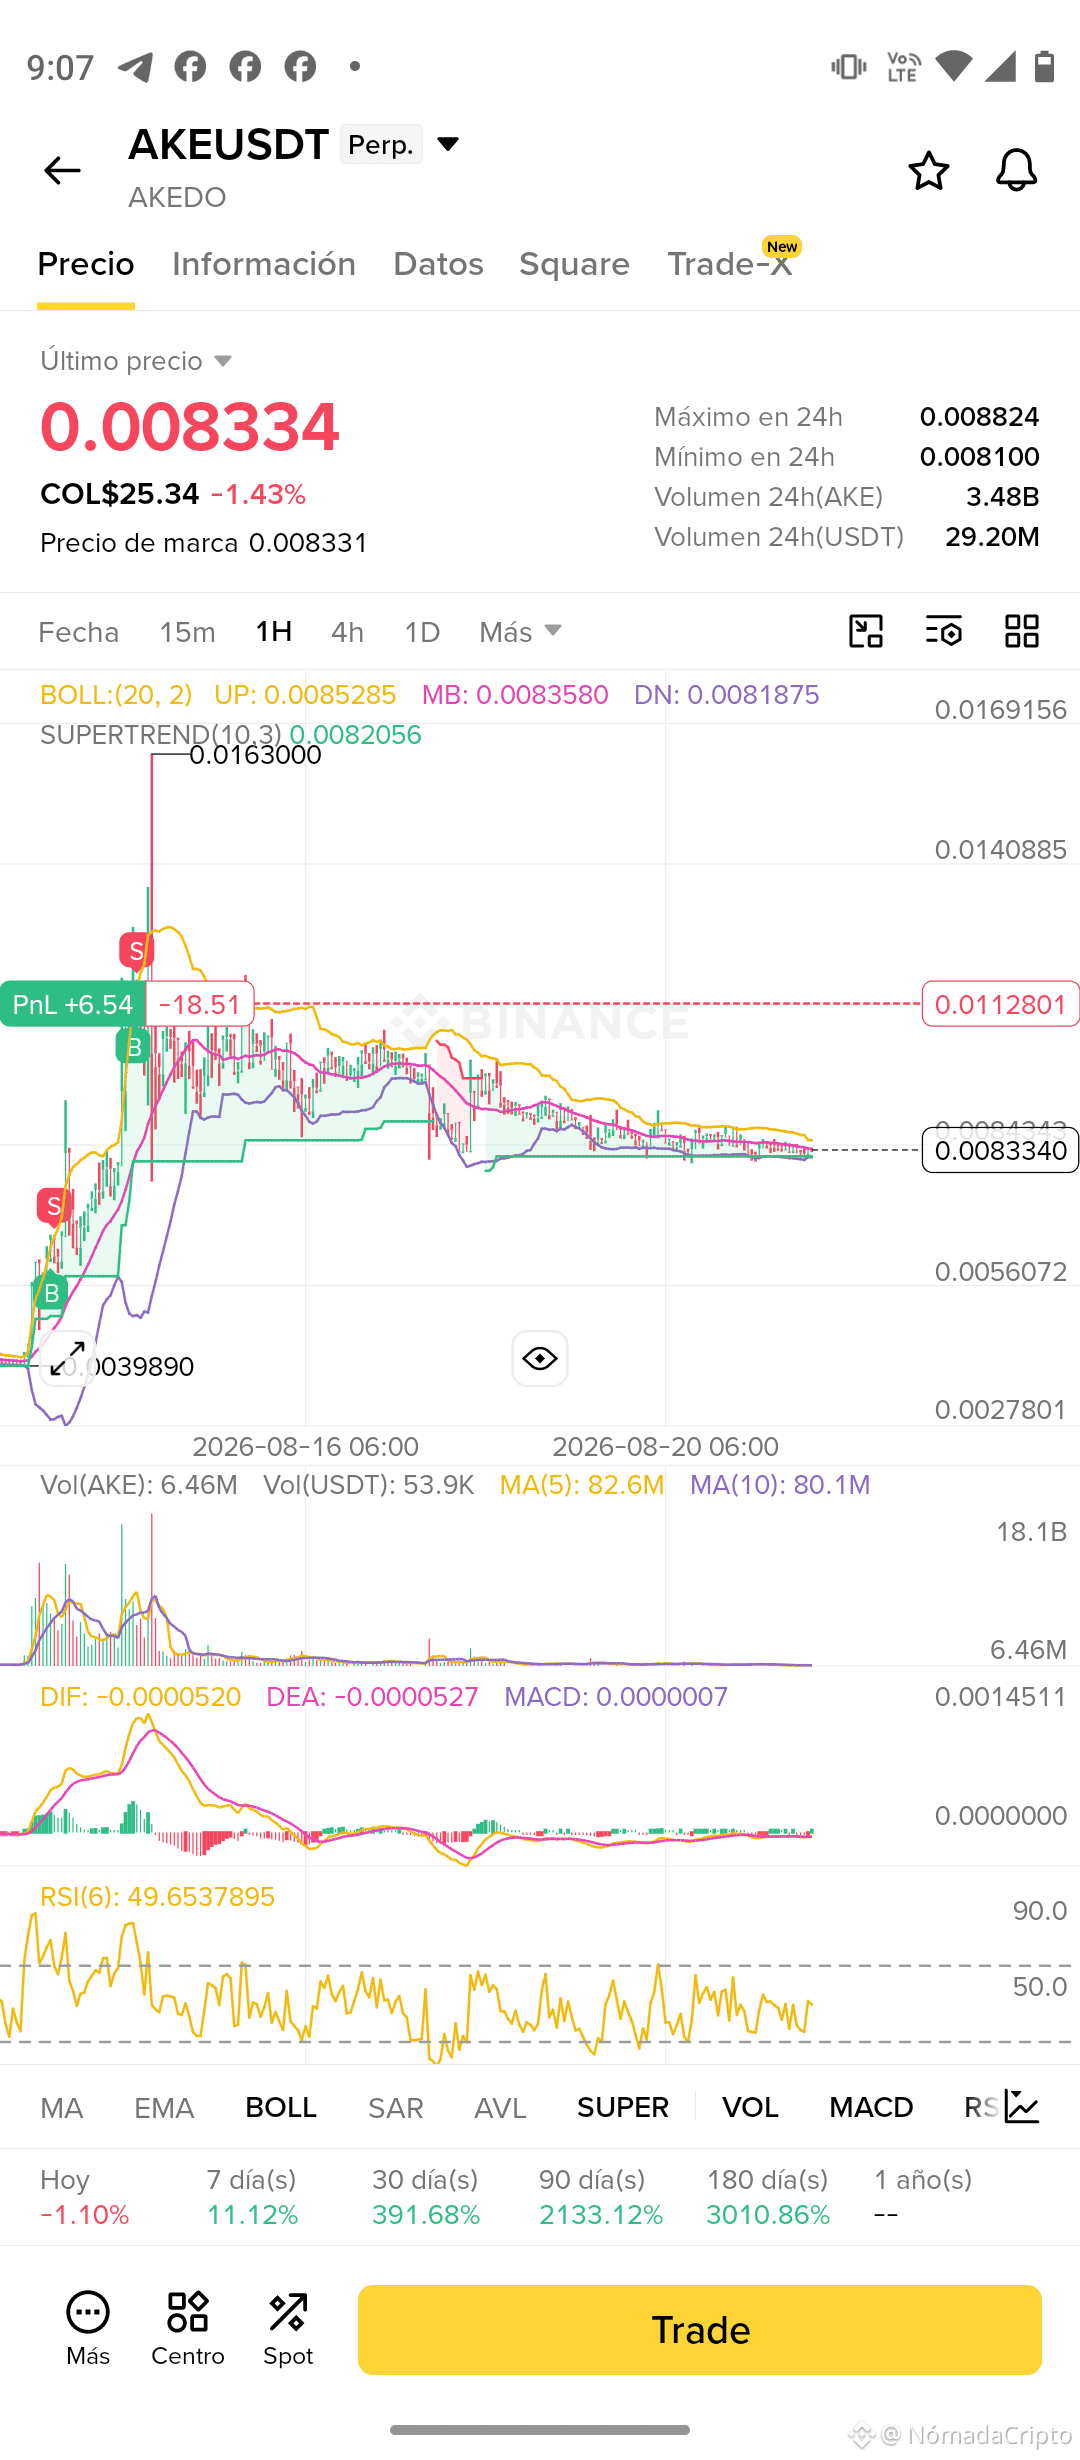
I am following my position in $AKE because it is putting to the test an idea that is part of the evolution of my method: after an extreme move, the market does not necessarily provide an immediate entry; sometimes it first builds a waiting zone.
AKE even reached 0.0163 and then lost much of that run. Now it is trading near 0.00833, practically on the middle Bollinger Band, while the bands have tightened and volume has decreased considerably. The RSI is around 49 and the MACD remains almost flat.
For me, this contradicts a fairly common idea: that after a big drop, a profitable rebound must always appear quickly. My statistics still need more samples to determine what happens after these compressions and how long the assets can remain in them.
That’s why I don’t try to guess what AKE will do. The trade continues to be an experiment of my method. I observe, log the behavior, and wait for the results to allow turning an observation into an applicable statistic.
Technical analysis shows me what is happening. My method tries to find out what to do with that information.
#ShareMyTradFi #Nomadacripto #AKE #Trading #Futuros $AKE
AKE even reached 0.0163 and then lost much of that run. Now it is trading near 0.00833, practically on the middle Bollinger Band, while the bands have tightened and volume has decreased considerably. The RSI is around 49 and the MACD remains almost flat.
For me, this contradicts a fairly common idea: that after a big drop, a profitable rebound must always appear quickly. My statistics still need more samples to determine what happens after these compressions and how long the assets can remain in them.
That’s why I don’t try to guess what AKE will do. The trade continues to be an experiment of my method. I observe, log the behavior, and wait for the results to allow turning an observation into an applicable statistic.
Technical analysis shows me what is happening. My method tries to find out what to do with that information.
#ShareMyTradFi #Nomadacripto #AKE #Trading #Futuros $AKE
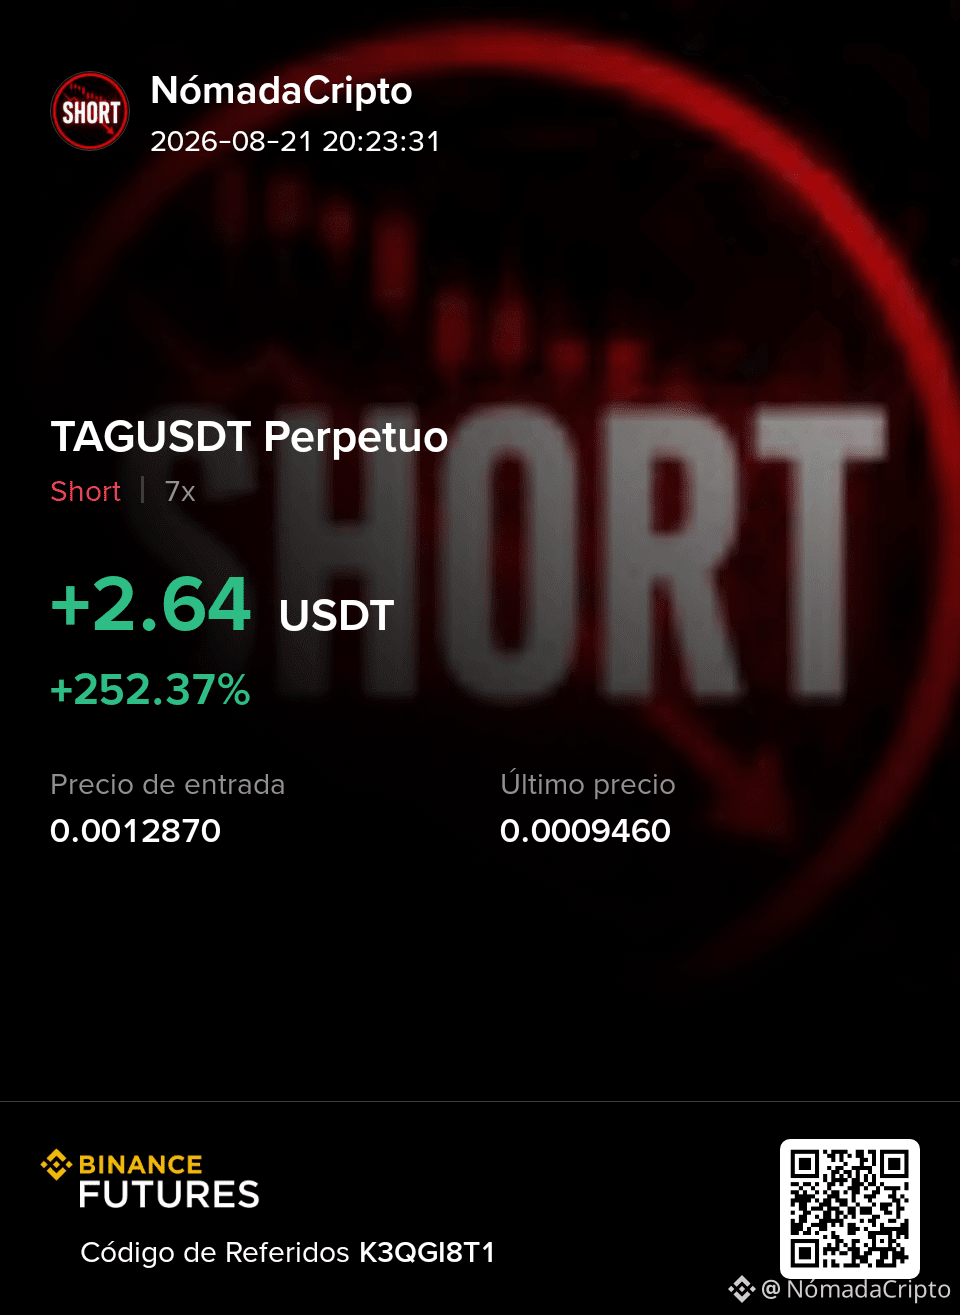
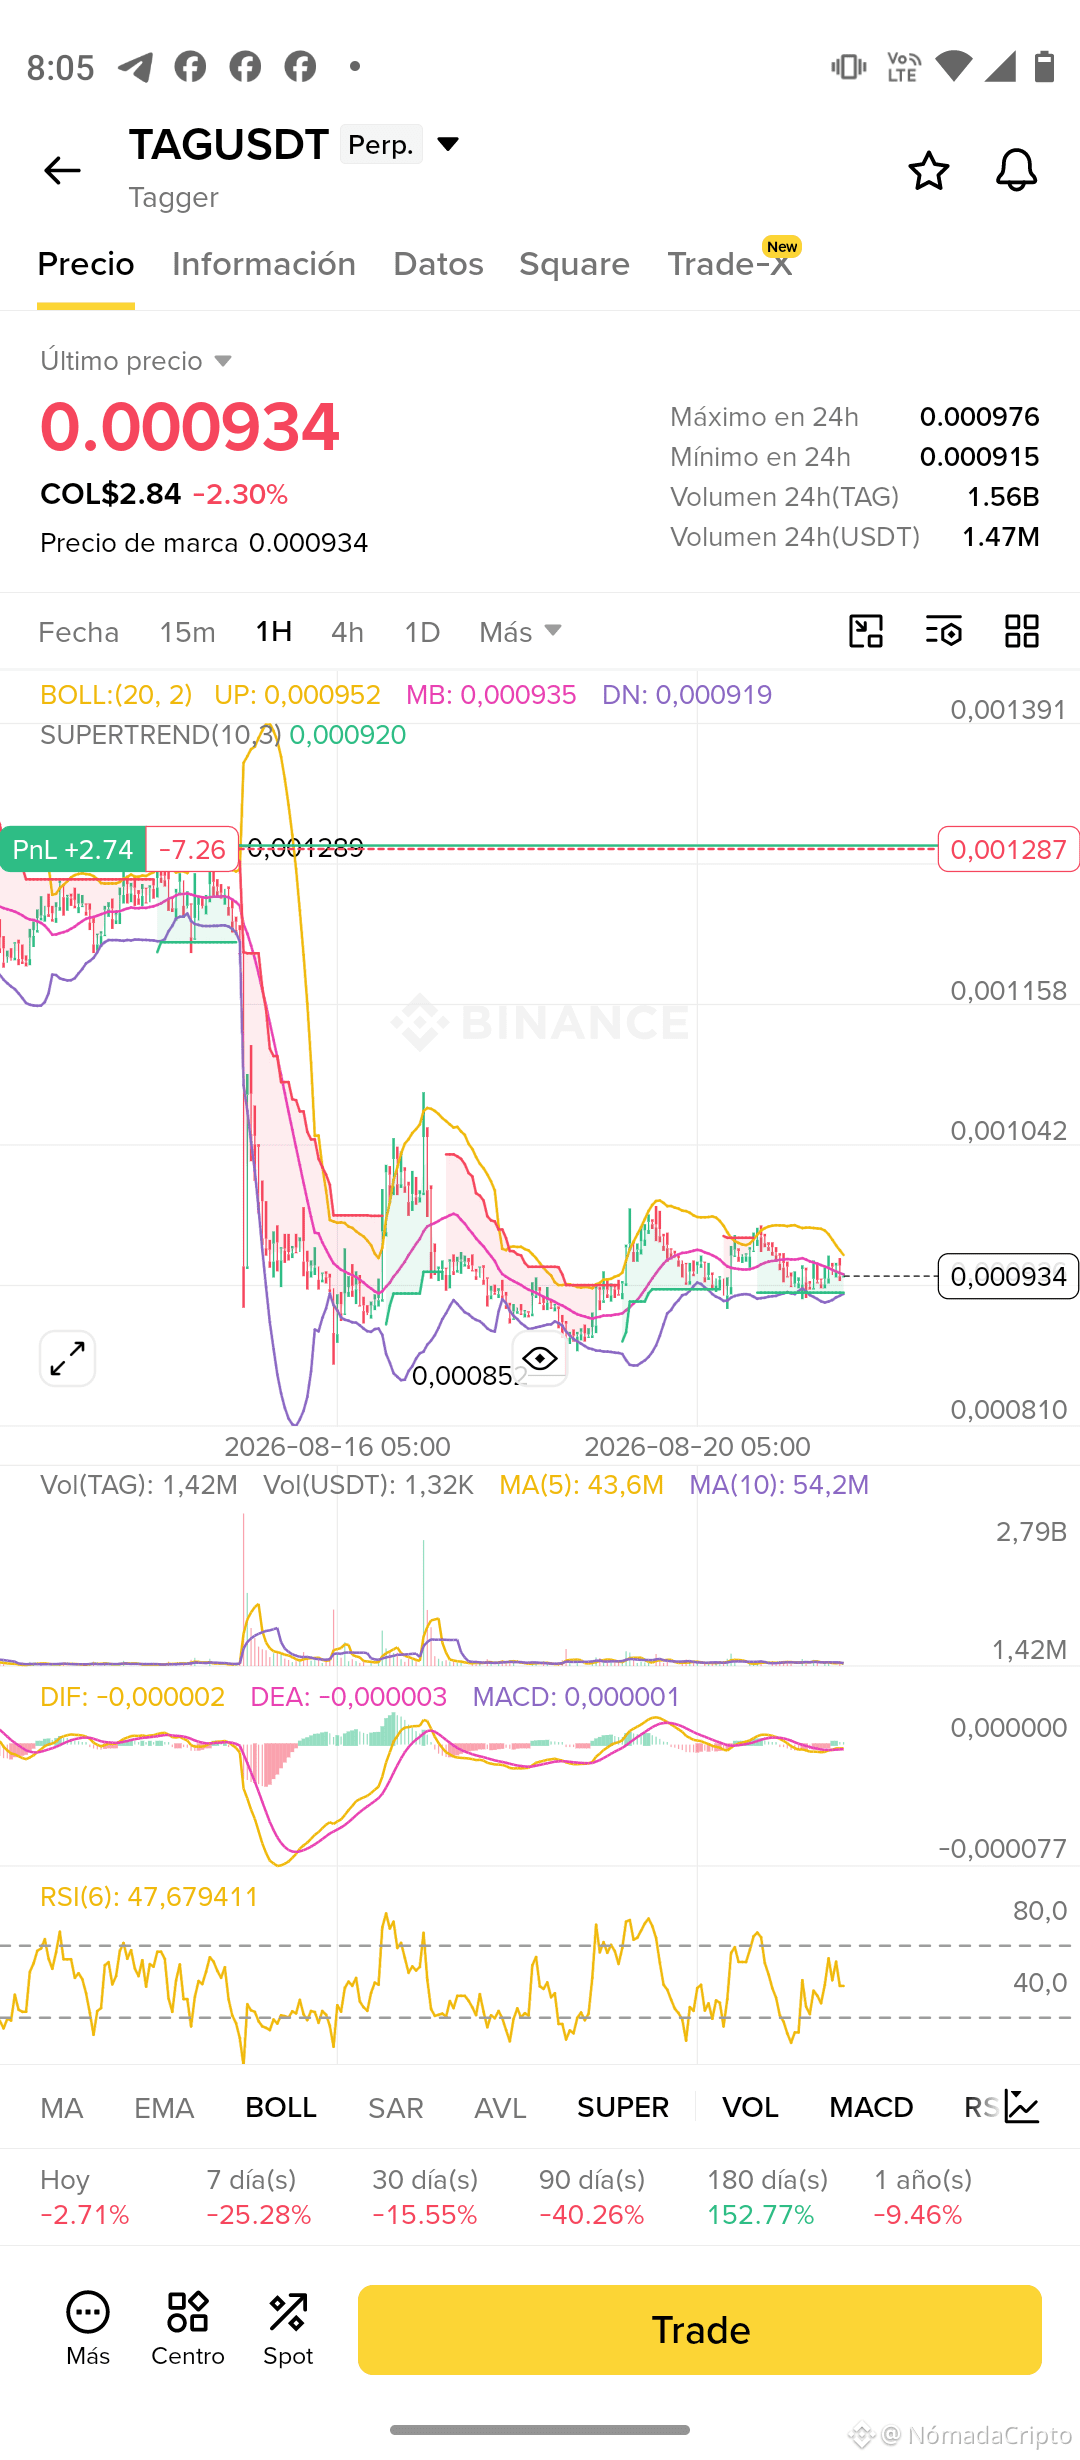
I keep observing my entry at $TAG and this operation is helping me test an idea from my method: a strong drop does not necessarily mean that the bearish leg will continue immediately. After the selloff from the 0.001289 zone, TAG reached 0.000852 and subsequently entered a much slower, sideways phase.
Now it trades near 0.000934, practically on the middle Bollinger Band at 0.000935. The RSI is at 47.68 and the MACD barely shows a positive difference, while volume has been reduced considerably compared to the initial impulse.
Here is a question that interests me more than trying to guess the next move: how long can an entry remain within a compression zone before it develops its run again?
This trade still isn't giving me an answer. It's giving me data.
And that's exactly the difference between an opinion and a statistic: an opinion tries to conclude; my method needs to observe, record, and wait for enough samples to verify it.
#ShareMyTradFi #Nomadacripto #TAG #Trading #Futuros $TAG
Now it trades near 0.000934, practically on the middle Bollinger Band at 0.000935. The RSI is at 47.68 and the MACD barely shows a positive difference, while volume has been reduced considerably compared to the initial impulse.
Here is a question that interests me more than trying to guess the next move: how long can an entry remain within a compression zone before it develops its run again?
This trade still isn't giving me an answer. It's giving me data.
And that's exactly the difference between an opinion and a statistic: an opinion tries to conclude; my method needs to observe, record, and wait for enough samples to verify it.
#ShareMyTradFi #Nomadacripto #TAG #Trading #Futuros $TAG
#termmax @TermMax
When I keep a position open, I usually think of a simple question: how much time is left until the scenario I’m expecting arrives? But investigating TermMax Alpha led me to ask another question: what economy am I building up while I wait?
In TermMax Alpha, the Option Financing Cost documentation relates the cost to the notional value, the rate applied by the mechanism, and the time the position remains open. This means that the time during which a position stays open is not just a distance to maturity—it also contributes to the financing cost’s economy.
That’s where I found a difference I think is especially relevant as a trader. When a trade hasn’t yet reached the expected outcome, waiting can feel like a neutral decision. However, if there’s a cost associated with the time the position remains open, waiting stops being simply “doing nothing.” The position continues to have an economic dimension while it’s still open.
This changes the question I ask when analyzing a position. I no longer want to look only at when the term ends or where I need the market to move. I also want to ask myself what cost I’m accumulating while I keep the trade open, waiting for my hypothesis to come true.
I don’t interpret this as an automatic reason to close early, nor as a sign that holding a position is incorrect. The issue is different: the time a position remains open can be part of its economics, and therefore should be included in the decision analysis.
TermMax Alpha gives me an idea I find useful for analyzing positions that remain open over a period of time: waiting can also have its own economics. Maturity indicates when a structure ends, but the time we spend within it may be altering what it really costs to maintain our decision.
#termmax @TermMax
When I keep a position open, I usually think of a simple question: how much time is left until the scenario I’m expecting arrives? But investigating TermMax Alpha led me to ask another question: what economy am I building up while I wait?
In TermMax Alpha, the Option Financing Cost documentation relates the cost to the notional value, the rate applied by the mechanism, and the time the position remains open. This means that the time during which a position stays open is not just a distance to maturity—it also contributes to the financing cost’s economy.
That’s where I found a difference I think is especially relevant as a trader. When a trade hasn’t yet reached the expected outcome, waiting can feel like a neutral decision. However, if there’s a cost associated with the time the position remains open, waiting stops being simply “doing nothing.” The position continues to have an economic dimension while it’s still open.
This changes the question I ask when analyzing a position. I no longer want to look only at when the term ends or where I need the market to move. I also want to ask myself what cost I’m accumulating while I keep the trade open, waiting for my hypothesis to come true.
I don’t interpret this as an automatic reason to close early, nor as a sign that holding a position is incorrect. The issue is different: the time a position remains open can be part of its economics, and therefore should be included in the decision analysis.
TermMax Alpha gives me an idea I find useful for analyzing positions that remain open over a period of time: waiting can also have its own economics. Maturity indicates when a structure ends, but the time we spend within it may be altering what it really costs to maintain our decision.
#termmax @TermMax
#dusk $DUSK @Dusk
When an operation shows a result, I normally tend to think the process is already over. But as a trader, I started wondering something I had previously oversimplified: what does it really mean for a transaction to be accepted by a node?
That question led me to review how Dusk describes a transaction’s journey. I found that the process goes through different stages: first it can be sent and admitted for processing; then it can enter the mempool, be included in a block, and executed. But then a new doubt appeared: if a transaction has already been accepted, included, and executed, does that necessarily mean the process has ended?
When I delved into Dusk’s documentation, I found a difference I hadn’t had in mind before: including and executing a transaction are not the same as finalizing it. A block can move through different states before reaching the condition that finalizes that block and the transactions it contains.
That changed how I look at an operation. Previously, I tended to focus mainly on whether an action had been sent and what its result was. Now I consider it more important to identify exactly which state it is in before assuming the process is over.
As a trader, this distinction seems relevant because a visible action does not necessarily represent the end of the entire process that exists behind it. Going forward, when I analyze a transaction, I don’t just want to ask whether it was accepted or executed; I also want to know whether it really reached the finalized state.
Sometimes, understanding a result requires stopping to look only at where the operation ended and starting to observe what had to happen beforehand in order for it to truly be considered finished.
@Dusk #dusk $DUSK
When an operation shows a result, I normally tend to think the process is already over. But as a trader, I started wondering something I had previously oversimplified: what does it really mean for a transaction to be accepted by a node?
That question led me to review how Dusk describes a transaction’s journey. I found that the process goes through different stages: first it can be sent and admitted for processing; then it can enter the mempool, be included in a block, and executed. But then a new doubt appeared: if a transaction has already been accepted, included, and executed, does that necessarily mean the process has ended?
When I delved into Dusk’s documentation, I found a difference I hadn’t had in mind before: including and executing a transaction are not the same as finalizing it. A block can move through different states before reaching the condition that finalizes that block and the transactions it contains.
That changed how I look at an operation. Previously, I tended to focus mainly on whether an action had been sent and what its result was. Now I consider it more important to identify exactly which state it is in before assuming the process is over.
As a trader, this distinction seems relevant because a visible action does not necessarily represent the end of the entire process that exists behind it. Going forward, when I analyze a transaction, I don’t just want to ask whether it was accepted or executed; I also want to know whether it really reached the finalized state.
Sometimes, understanding a result requires stopping to look only at where the operation ended and starting to observe what had to happen beforehand in order for it to truly be considered finished.
@Dusk #dusk $DUSK
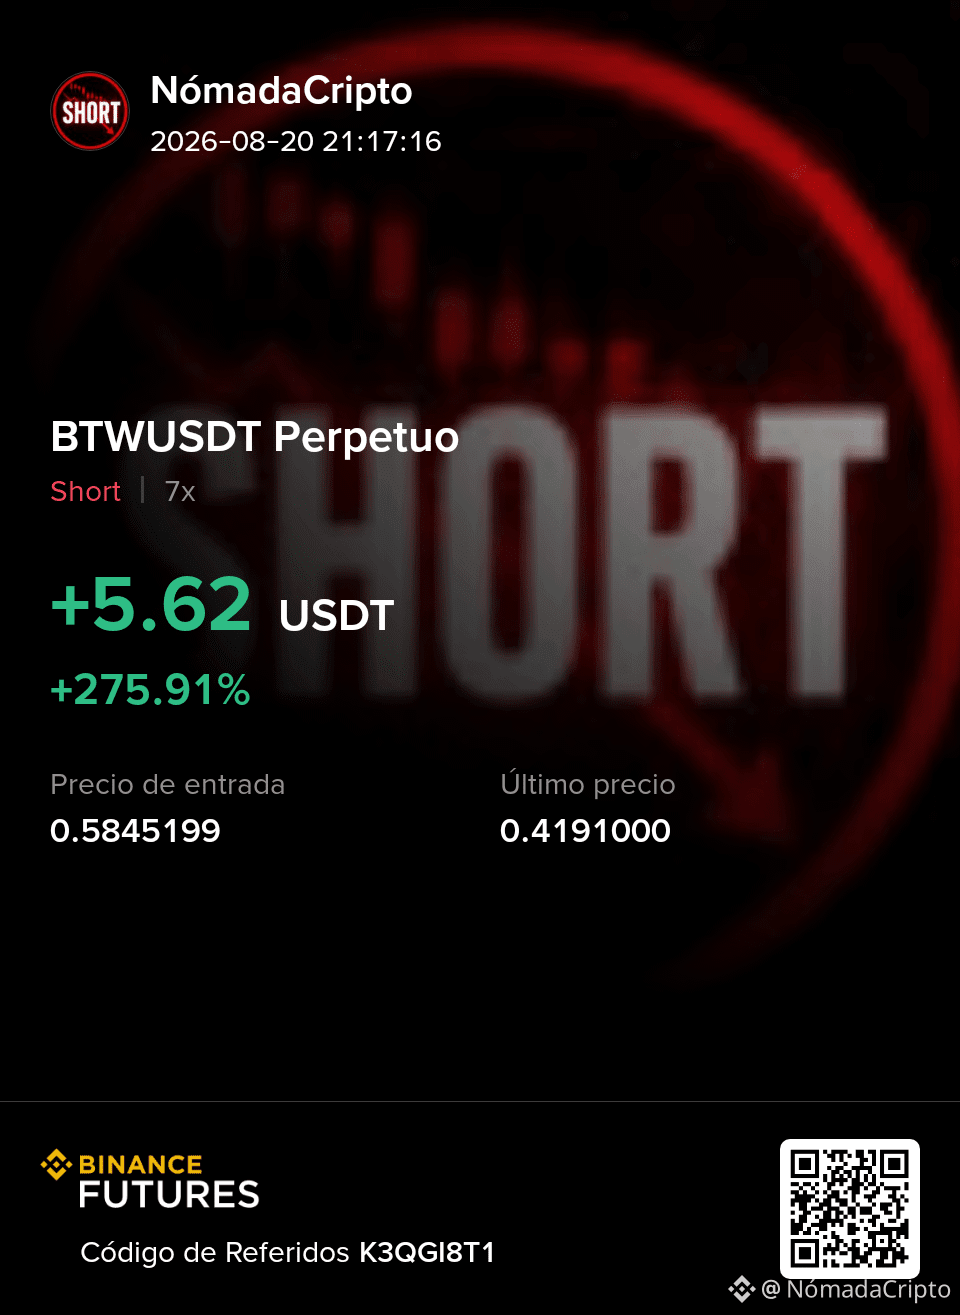
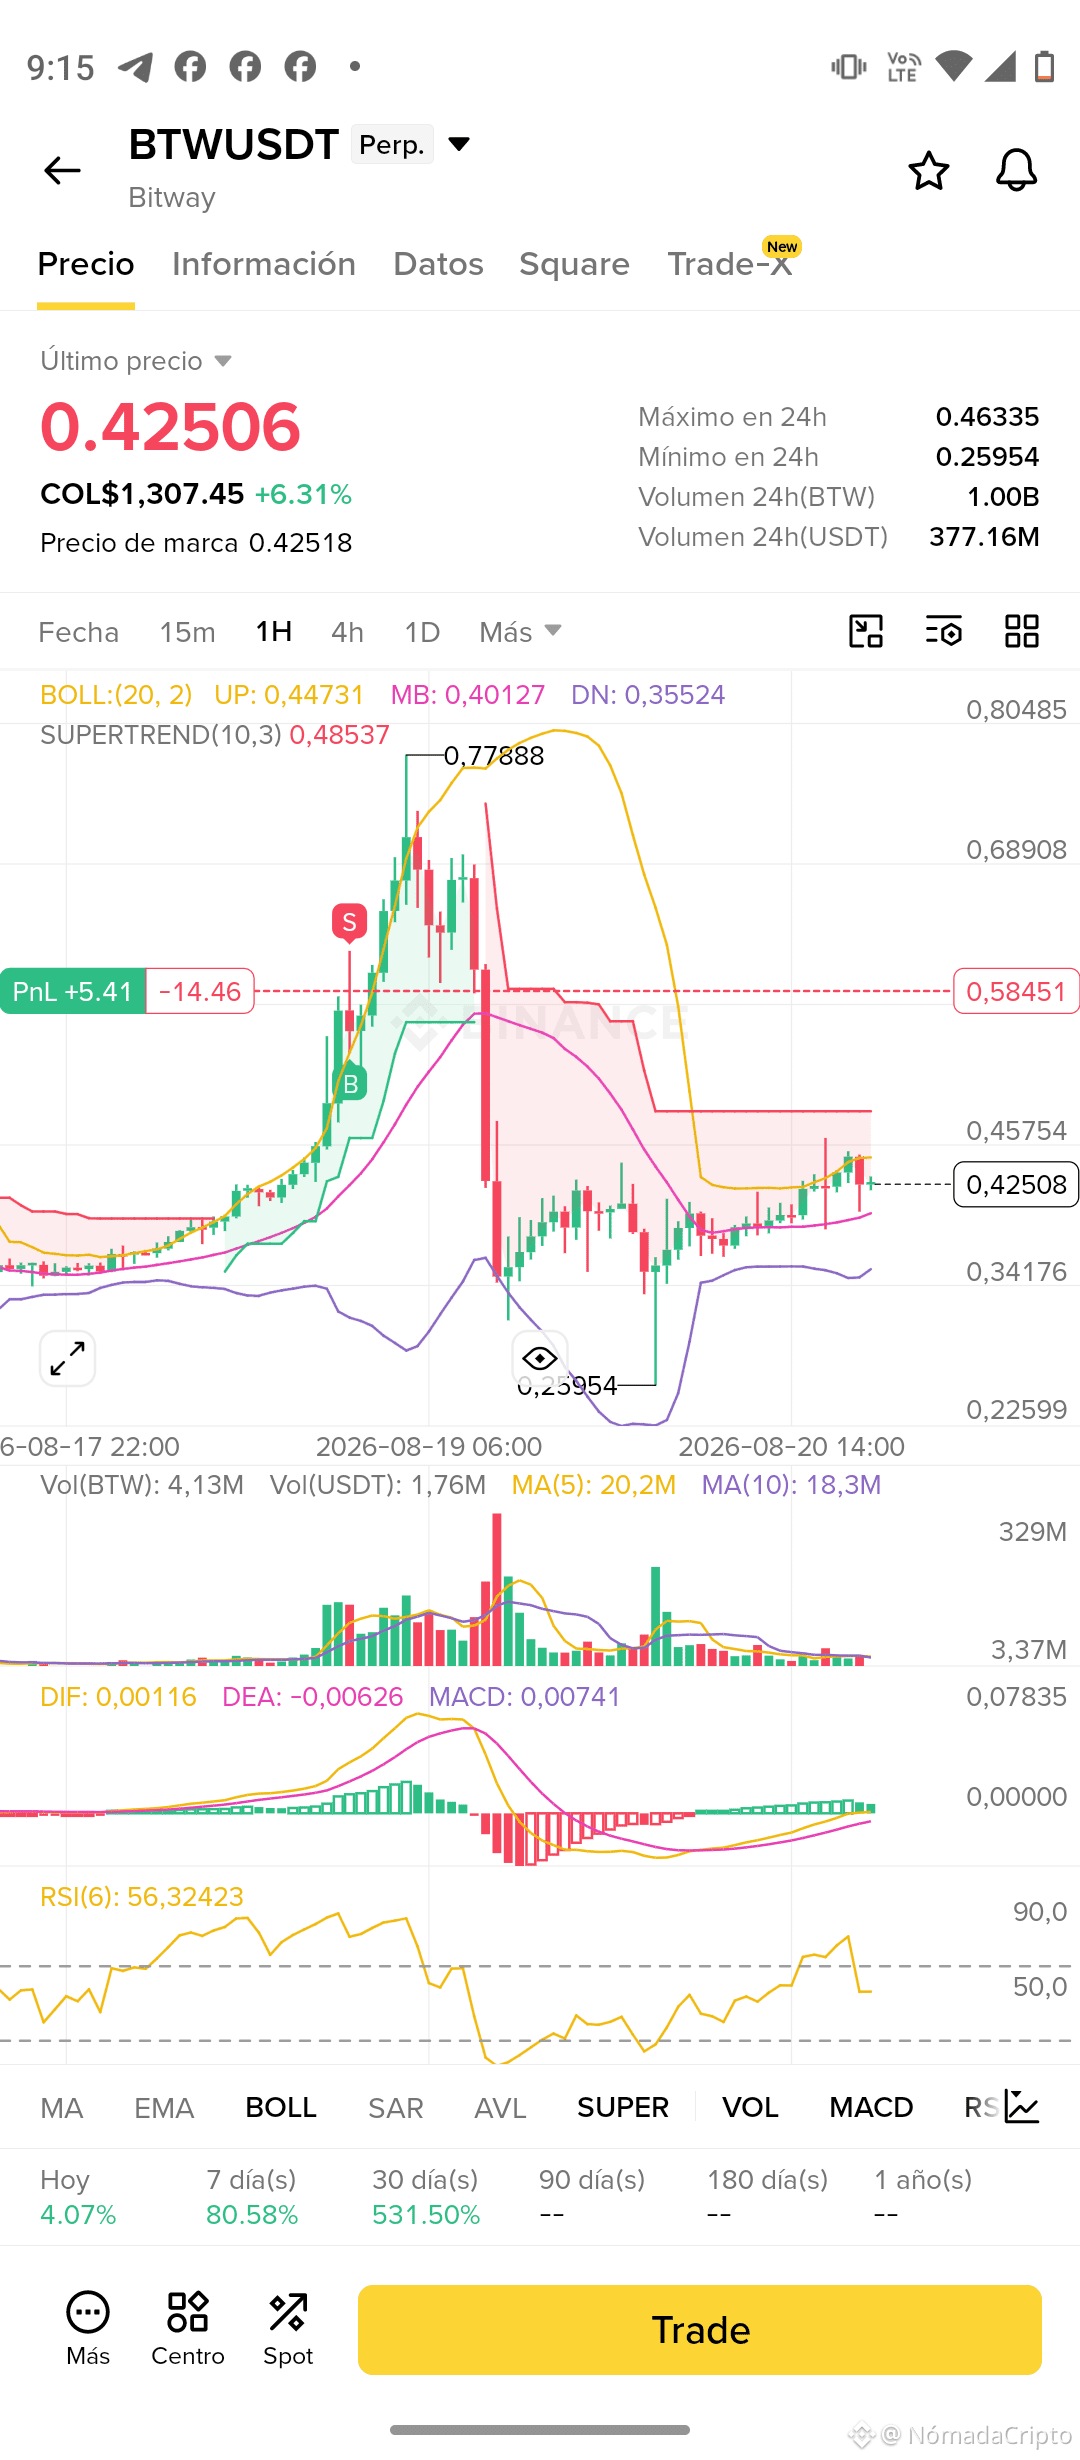
I’m following $BTW from a short position and this entry is giving me an interesting observation about my own method. The price reached a low of 0.77888 and then fell to 0.25954; now it is trading near 0.42506 and is starting to regain ground again.
This is where my theory about probabilistic trading makes sense: the goal isn’t to get the exact point where the drop starts or where the move ends, but to recognize structures that have historically shown a certain probability within my system.
In the chart, BTW has already regained part of the move after that drop. The MACD is back in positive territory, the RSI is close to 56, and the price is approaching the middle Bollinger Band, while the Supertrend remains above it, around 0.48537.
This reminds me of something I learned while trading: a bounce doesn’t automatically invalidate a thesis, but it also doesn’t confirm that the move will continue. The market forces me to update the theory with every new piece of data.
That’s why I keep watching BTW. My method doesn’t try to predict; it tries to verify whether the statistics start behaving the way I expect.
#ShareMyTradFi #Nomadacripto #BTW #Trading #Futuros $BTW
This is where my theory about probabilistic trading makes sense: the goal isn’t to get the exact point where the drop starts or where the move ends, but to recognize structures that have historically shown a certain probability within my system.
In the chart, BTW has already regained part of the move after that drop. The MACD is back in positive territory, the RSI is close to 56, and the price is approaching the middle Bollinger Band, while the Supertrend remains above it, around 0.48537.
This reminds me of something I learned while trading: a bounce doesn’t automatically invalidate a thesis, but it also doesn’t confirm that the move will continue. The market forces me to update the theory with every new piece of data.
That’s why I keep watching BTW. My method doesn’t try to predict; it tries to verify whether the statistics start behaving the way I expect.
#ShareMyTradFi #Nomadacripto #BTW #Trading #Futuros $BTW
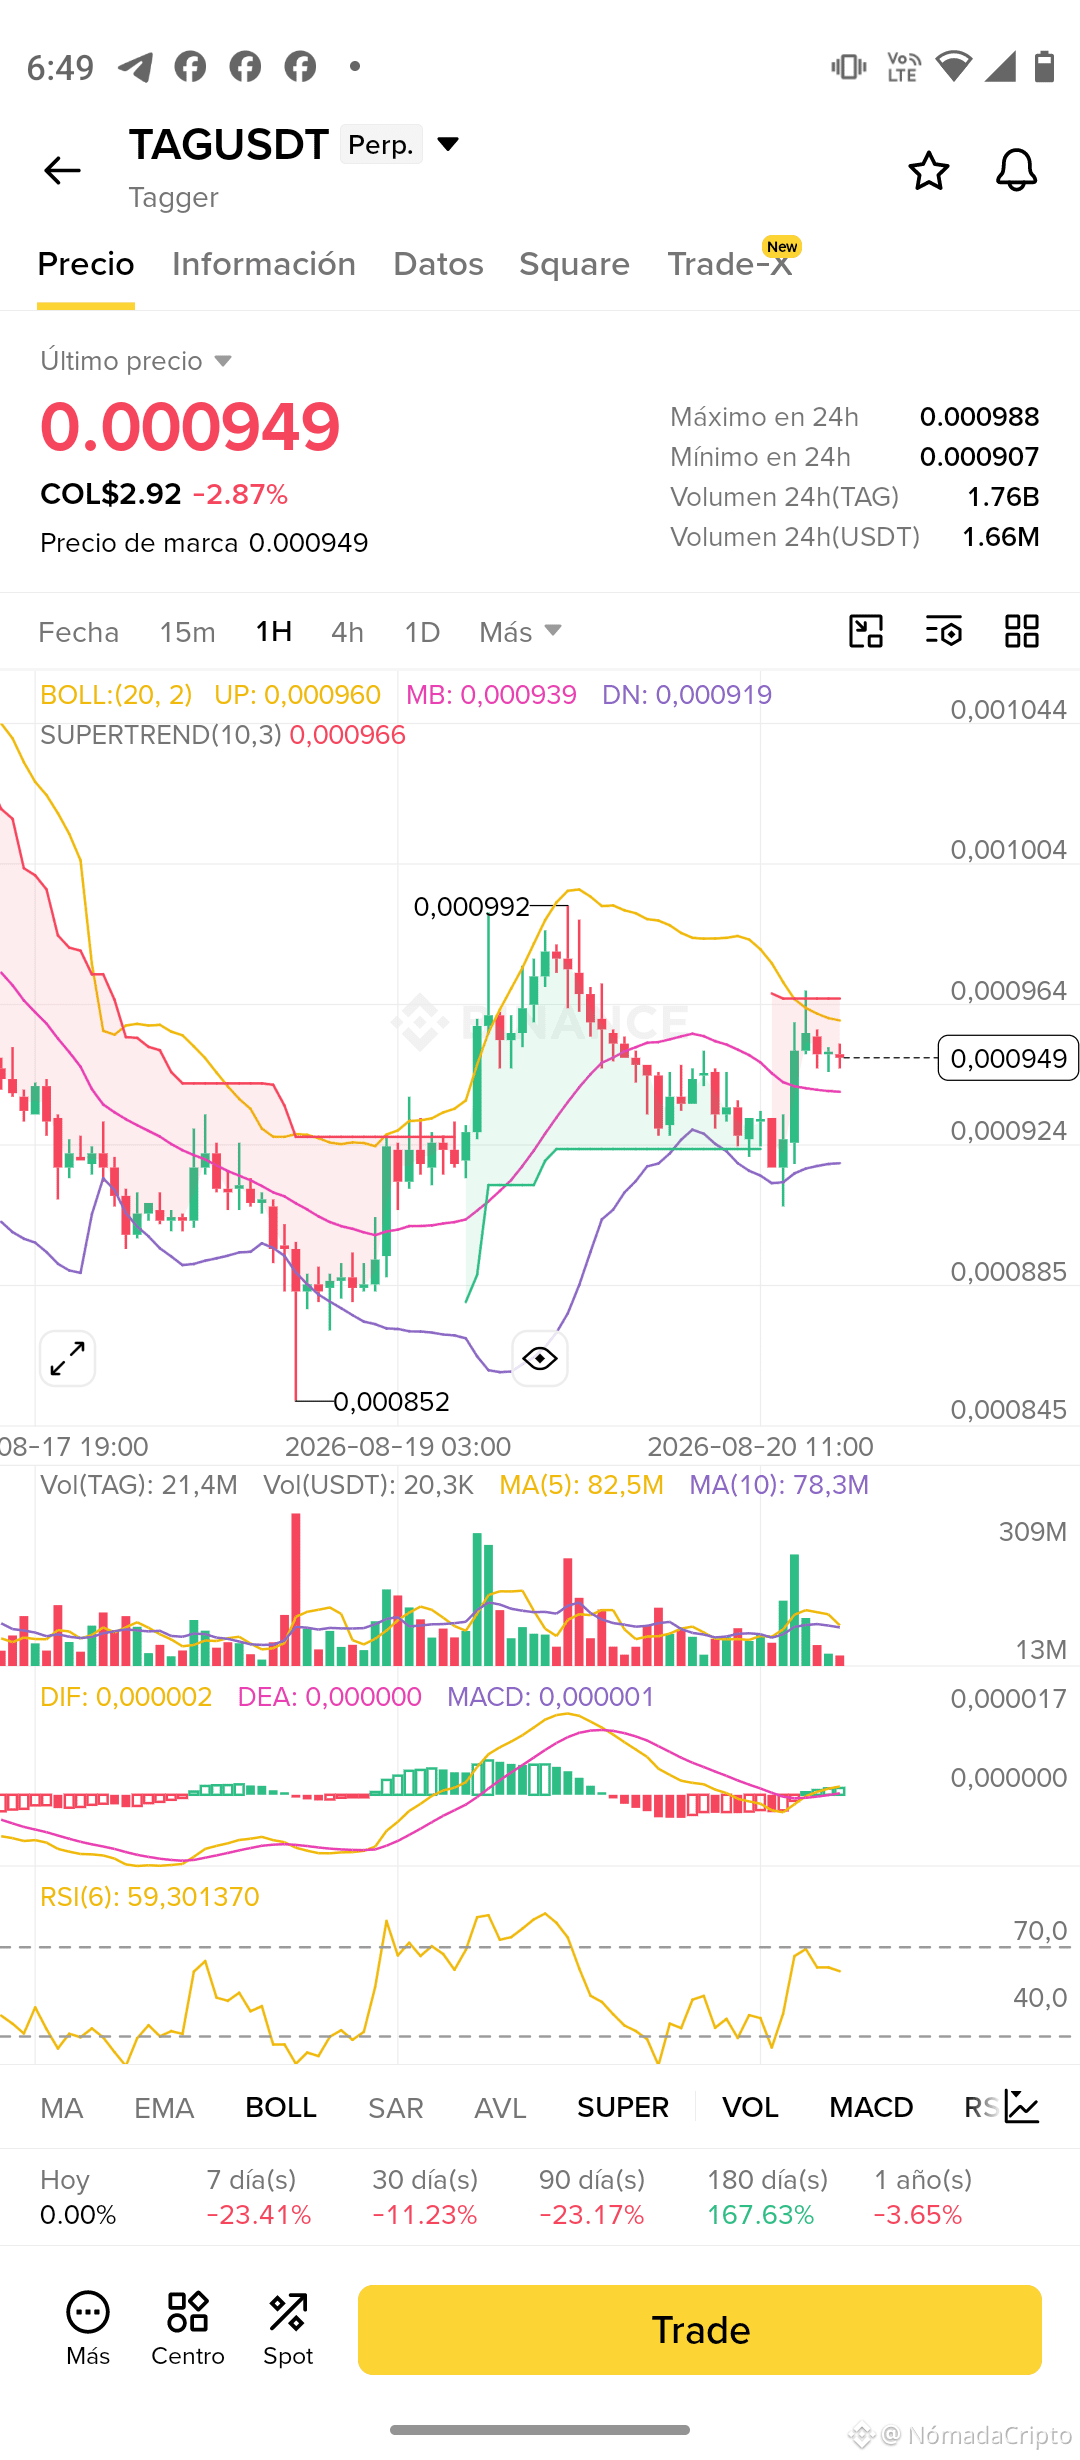
In this post about $TAG I’m observing something I consider more important than any isolated indicator: the moment when several readings begin telling different stories.
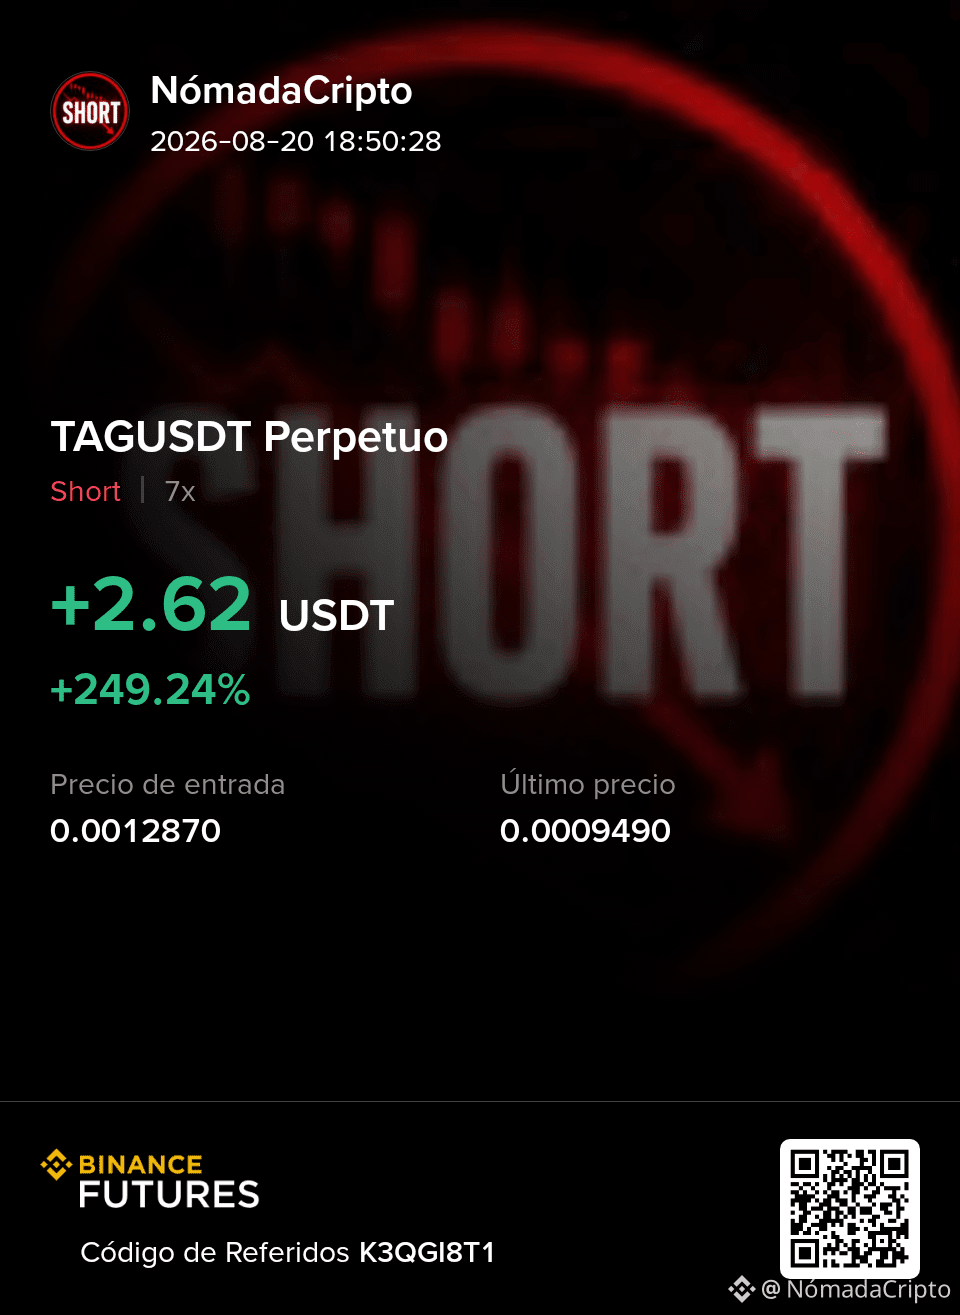
TAG is trading around 0,000949, after moving from the 0,000852 zone to 0,000992. Now the price stays near the Bollinger mid-band, while the upper band is at 0,000960 and the Supertrend remains around 0,000966. The RSI is near 59 and the MACD shows only a slight positive reading.
Here’s one of my theories: an indicator is not valuable enough on its own to decide a trade; its value shows up when I can compare it with the asset’s historical behavior and with the statistics from my method.
Many traders look for the RSI, MACD, or Bollinger to tell them what to do. I try something else: I look at what happened earlier when similar combinations appeared and what range the asset developed afterward.
That’s why this entry is still a lab. I’m not trying to guess TAG’s next move; I’m checking whether my statistical read again finds a known structure.
The theory is formed first. The statistics decide afterward.
#ShareMyTradFi #Nomadacripto #TAG #Trading #Futuros $TAG
TAG is trading around 0,000949, after moving from the 0,000852 zone to 0,000992. Now the price stays near the Bollinger mid-band, while the upper band is at 0,000960 and the Supertrend remains around 0,000966. The RSI is near 59 and the MACD shows only a slight positive reading.
Here’s one of my theories: an indicator is not valuable enough on its own to decide a trade; its value shows up when I can compare it with the asset’s historical behavior and with the statistics from my method.
Many traders look for the RSI, MACD, or Bollinger to tell them what to do. I try something else: I look at what happened earlier when similar combinations appeared and what range the asset developed afterward.
That’s why this entry is still a lab. I’m not trying to guess TAG’s next move; I’m checking whether my statistical read again finds a known structure.
The theory is formed first. The statistics decide afterward.
#ShareMyTradFi #Nomadacripto #TAG #Trading #Futuros $TAG
Log in to explore more content