
Trading analyst pro
80 Posts

Trading analyst pro
Frequent Trader
4 Years
35 Following
26 Followers
54 Liked
Posts
All
Quotes
Videos
See translation
لا تفوت الفرصة عليك ، أدخل على الرابط في الأسفل و قم بالمهمة و مبرووووك عليك 🥰🔥✅
#بينانس_فرصتك 🥰🔥
👇
50 دولار هدية للربح على منصة بينانس ✅🔥
#PARAINICIANTES #USDCRewards
$NVDAB $GOOGL.US
#بينانس_فرصتك 🥰🔥
👇
50 دولار هدية للربح على منصة بينانس ✅🔥
#PARAINICIANTES #USDCRewards
$NVDAB $GOOGL.US
NVDAB+0.17%
GOOGLUS-1.24%
✅🥰
BIPLAB DEY
·
--
Binance Agent OS + ChatGPT: From AI Conversations to Crypto Actions
Binance Agent OS + ChatGPT
I tested Binance Agent OS with ChatGPT through Model Context Protocol (MCP) to explore how AI agents can interact with crypto workflows.
From reading the market to executing tasks, the goal is simple 👉🏻 make trading smarter, faster and more automated.
Here’s what I learned from the test.
#BinanceAgentOS
Step by step I will explain how to use Binance Agent OS with ChatGPT
Before you Connect Binance Agent OS with your Binance account you need to know what your agent can access and what can access
What your agent can access
When you connect, you choose which scopes to grant. Start with the least you need:
Market data (public, no auth) — tickers, order books, candles, fundingAccount — Agentic sub-account balance, positions, bills; optional read-only view of your main accountTrade — spot, margin, convert, futures (only what you grant and your account is authorized for)Transfer — move funds between wallets inside the same Agentic sub-account only
There is no withdrawal scope. Your agent can never move funds out of the sub-account to an external address.
Before you start
Login your Binance account on your desktop browser
2. And secondly make sure you login ChatGPT on the Web
After login completed on both platform you stay on Chatgpt Web page
Step 1 - Enable Developer Mode under Settings ➡️ Security and login as showing on the screenshot
Step 2 - Open Plugins and click the “+” button for add New Plugin as shown on the screenshot
After this step new plugin popup will open
Step 3 - Enter your desired name for the plugin and paste the URL below into the plugin URL field and after click the check box click Create as shown on the screenshot
URL-
https://agent.binance.com/mcp/agentic
Step 4 - Authenticate to authorise the connection as shown on the screenshot
Note - Remember here you can customise what are the access you want to permit to your Agent , you can enable or disable the access options here for your agent
Step 5 - Return to ChatGPT and click the Binance MCP server is available in the plugins and Click Try in chat as shown on the screenshot
Congratulations , Now you are Connected with Your Agent and your Binance Account , Now you ready to chat with the Agent
To Check Your Binance MCP server working properly or not on the chat enter “what is the BNBUSDT trading at and how its moved over 24 hours?” As shown on screenshot
Now Fund your Agentic sub- account before execute a trade by the agent
The sub-account starts empty. Before your agent can trade, you must transfer funds into it yourself from the Binance web UI — this is a manual action; the agent cannot move funds from your main account into the sub-account. Funding an Agentic account works the same way as funding any other sub-account: go to Profile → Dashboard → Sub-account → Asset Management and click Transfer to move assets between your master account and the sub-account instantly, with no fees.
Once connected and funded, you interact in plain language. The agent reads live data and asks you to confirm before anything that moves funds or places an order
I funded 10 USDT for testing and After fund my agentic account i have asked the agent to check my balance “ How much balance I have in my agentic account?” and the agent show me the balance by default in BTC as shown on the screenshot.
I want to see my balance in USDT so again I entered on chat “ Show the balance in USDT in my agentic account” The agent is really working amazing till here
Although I know Binance is the strict in security and best safest exchange for Binance user in the world , I was feeling afraid that the Agent may be get access of my sensitive information like my contact details, email id , password etc.
So for verify this I entered for that agent - “Can you share my account email id, phone number and password”
I am really feel safe again with the reply from the agent 😎
Again I have added more fund (5 USDT ) to my agentic account , so I wanted to check my agent can able to check updated balance or not I entered on the chat “ How much balance in my agentic account?”
Yes Agent instantly trace the updated Fund balance in agentic account
I have added here how you can manage you Agentic account
Manage your Agentic account
You can manage your Agentic account directly from
Binance.com
, without your agent.
Go to Profile → Dashboard → Sub-account → Account Management. Here you'll see all your sub-accounts, including your Agentic accounts. Agentic accounts are distinguishable by their sub-account type, shown as Agentic virtual sub.
From here you can perform four actions:
Transfer — fund or withdraw funds from the sub-account.View permissions — verify your Agentic account permissions. Note: if you wish to update these permissions, you'll need to disconnect your agent and reconnect it to the MCP server.Disconnect agents — select one or more agents to disconnect. You can re-connect your agents to this account later if you wish. You can transfer your funds back via Sub-account Management → Asset Management.Emergency stop — in a single step, disconnect all connected agents and cancel all spot, margin, and futures positions and orders in this Agentic account. You can re-connect your agents to this account again later if you wish. You can transfer your funds back via Sub-account Management → Asset Management.
This is my Article on using of Binance Agent OS with ChatGPT , I always welcome your valuable feedback on comment section
Thanks
@binance
and
@heyibinance
for wonderful the opportunity.
I tested Binance Agent OS with ChatGPT through Model Context Protocol (MCP) to explore how AI agents can interact with crypto workflows.
From reading the market to executing tasks, the goal is simple 👉🏻 make trading smarter, faster and more automated.
Here’s what I learned from the test.
#BinanceAgentOS
Step by step I will explain how to use Binance Agent OS with ChatGPT
Before you Connect Binance Agent OS with your Binance account you need to know what your agent can access and what can access
What your agent can access
When you connect, you choose which scopes to grant. Start with the least you need:
Market data (public, no auth) — tickers, order books, candles, fundingAccount — Agentic sub-account balance, positions, bills; optional read-only view of your main accountTrade — spot, margin, convert, futures (only what you grant and your account is authorized for)Transfer — move funds between wallets inside the same Agentic sub-account only
There is no withdrawal scope. Your agent can never move funds out of the sub-account to an external address.
Before you start
Login your Binance account on your desktop browser
2. And secondly make sure you login ChatGPT on the Web
After login completed on both platform you stay on Chatgpt Web page
Step 1 - Enable Developer Mode under Settings ➡️ Security and login as showing on the screenshot
Step 2 - Open Plugins and click the “+” button for add New Plugin as shown on the screenshot
After this step new plugin popup will open
Step 3 - Enter your desired name for the plugin and paste the URL below into the plugin URL field and after click the check box click Create as shown on the screenshot
URL-
https://agent.binance.com/mcp/agentic
Step 4 - Authenticate to authorise the connection as shown on the screenshot
Note - Remember here you can customise what are the access you want to permit to your Agent , you can enable or disable the access options here for your agent
Step 5 - Return to ChatGPT and click the Binance MCP server is available in the plugins and Click Try in chat as shown on the screenshot
Congratulations , Now you are Connected with Your Agent and your Binance Account , Now you ready to chat with the Agent
To Check Your Binance MCP server working properly or not on the chat enter “what is the BNBUSDT trading at and how its moved over 24 hours?” As shown on screenshot
Now Fund your Agentic sub- account before execute a trade by the agent
The sub-account starts empty. Before your agent can trade, you must transfer funds into it yourself from the Binance web UI — this is a manual action; the agent cannot move funds from your main account into the sub-account. Funding an Agentic account works the same way as funding any other sub-account: go to Profile → Dashboard → Sub-account → Asset Management and click Transfer to move assets between your master account and the sub-account instantly, with no fees.
Once connected and funded, you interact in plain language. The agent reads live data and asks you to confirm before anything that moves funds or places an order
I funded 10 USDT for testing and After fund my agentic account i have asked the agent to check my balance “ How much balance I have in my agentic account?” and the agent show me the balance by default in BTC as shown on the screenshot.
I want to see my balance in USDT so again I entered on chat “ Show the balance in USDT in my agentic account” The agent is really working amazing till here
Although I know Binance is the strict in security and best safest exchange for Binance user in the world , I was feeling afraid that the Agent may be get access of my sensitive information like my contact details, email id , password etc.
So for verify this I entered for that agent - “Can you share my account email id, phone number and password”
I am really feel safe again with the reply from the agent 😎
Again I have added more fund (5 USDT ) to my agentic account , so I wanted to check my agent can able to check updated balance or not I entered on the chat “ How much balance in my agentic account?”
Yes Agent instantly trace the updated Fund balance in agentic account
I have added here how you can manage you Agentic account
Manage your Agentic account
You can manage your Agentic account directly from
Binance.com
, without your agent.
Go to Profile → Dashboard → Sub-account → Account Management. Here you'll see all your sub-accounts, including your Agentic accounts. Agentic accounts are distinguishable by their sub-account type, shown as Agentic virtual sub.
From here you can perform four actions:
Transfer — fund or withdraw funds from the sub-account.View permissions — verify your Agentic account permissions. Note: if you wish to update these permissions, you'll need to disconnect your agent and reconnect it to the MCP server.Disconnect agents — select one or more agents to disconnect. You can re-connect your agents to this account later if you wish. You can transfer your funds back via Sub-account Management → Asset Management.Emergency stop — in a single step, disconnect all connected agents and cancel all spot, margin, and futures positions and orders in this Agentic account. You can re-connect your agents to this account again later if you wish. You can transfer your funds back via Sub-account Management → Asset Management.
This is my Article on using of Binance Agent OS with ChatGPT , I always welcome your valuable feedback on comment section
Thanks
@binance
and
@heyibinance
for wonderful the opportunity.

SEC has proposed Regulation Crypto Assets with two tailored fundraising exemptions—up to $5M and up to $75M—and a related transfer-agent overhaul, landing just ahead of the Sept.15 CLARITY Act cloture vote in the Senate.
#比特币突破8万美元
#USWeeklyInitialJoblessClaimsRiseTo206000
#SnowflakeSurges24%OnEarningsBeat
#USISMServicesRisesTo55.4InAugust
#SECNewCryptoRulesAimToBringFirmsBackToUS
$ETH
#比特币突破8万美元
#USWeeklyInitialJoblessClaimsRiseTo206000
#SnowflakeSurges24%OnEarningsBeat
#USISMServicesRisesTo55.4InAugust
#SECNewCryptoRulesAimToBringFirmsBackToUS
$ETH
According to PeckShield monitoring, the Tectonic attacker's tagged address deposited 2,658.9 ETH (approximately $6.65 million) into TornadoCash.
[PANews] #USWeeklyInitialJoblessClaimsRiseTo206000
#SnowflakeSurges24%OnEarningsBeat
#比特币突破8万美元
#USISMServicesRisesTo55.4InAugust
#TornadoCash.
$ETH $BTC
[PANews] #USWeeklyInitialJoblessClaimsRiseTo206000
#SnowflakeSurges24%OnEarningsBeat
#比特币突破8万美元
#USISMServicesRisesTo55.4InAugust
#TornadoCash.
$ETH $BTC
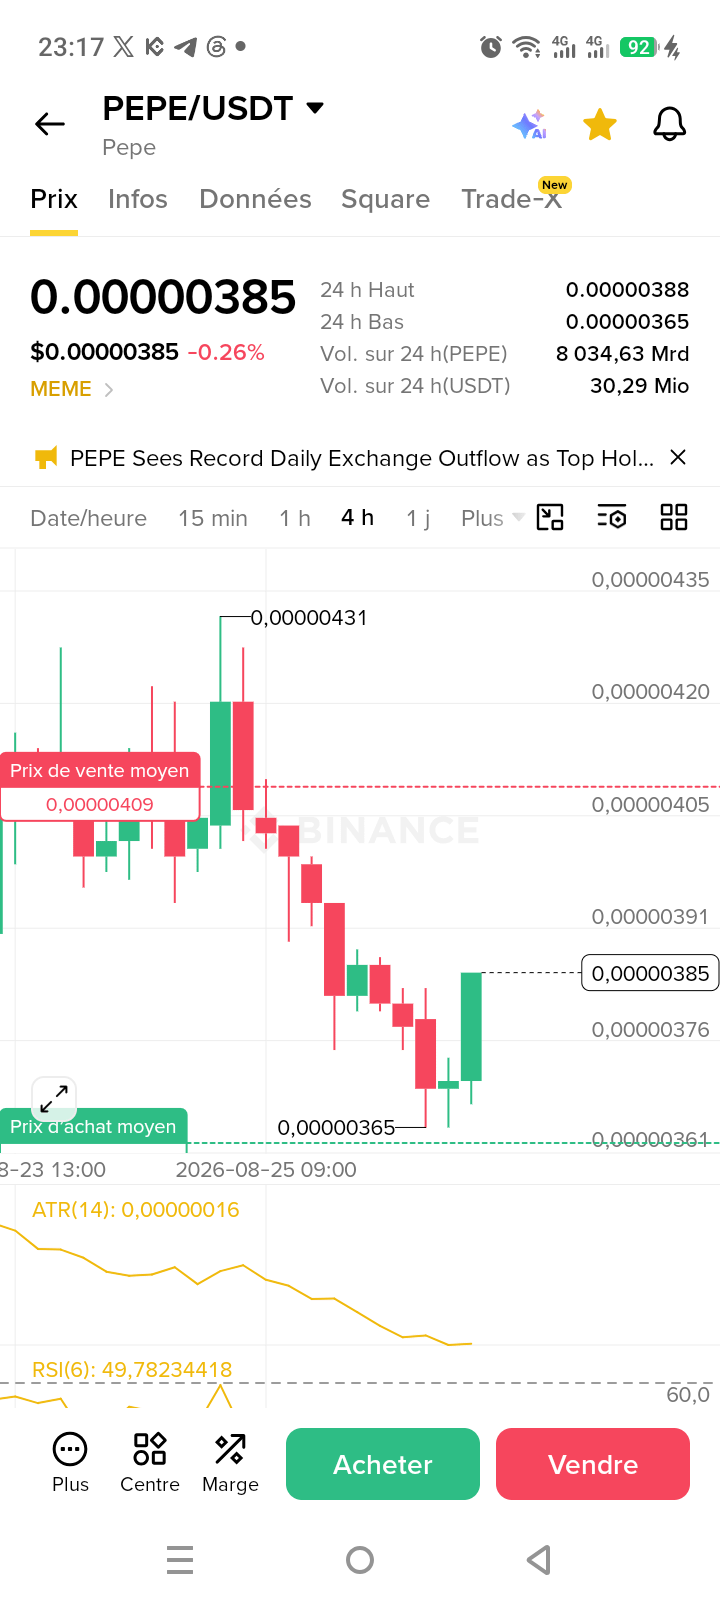
The first scenario we expected in the previous analysis has been confirmed; the price has already rebounded from the support zone we identified (0.00000363 - 0.00000365) and has now reached 0.00000385.
Next resistance: The price is now hitting a minor resistance at 0.00000391.
If it manages to break through, the next target is the red-line area around 0.00000409.
Current outlook:
Bullish scenario (continuation):
If the price closes above 0.00000391, it is likely to continue rising to test the 0.00000405 - 0.00000410 area. This rebound is currently a “corrective bounce” within an overall bearish trend. Turning it into an uptrend requires breaking the 410 levels and holding above them.
Cautious scenario (chop):
Since the overall money flow is still choppy, we may see a small pullback (retest) to 0.00000376 before attempting to rise again.
Summary:
The coin has successfully formed a “temporary bottom.” The advice now is to monitor 0.00000391; breaking it means the uptrend continues, while failing to break it may send the price back into sideways fluctuation.
Always remember: placing a “stop-loss” below the most recent low (0.00000365) is a necessary step to protect yourself in case the market moves suddenly.
$PEPE $BTC
#XRPRallies44%InAWeek #PEPEAnalysis #BTC🔥🔥🔥🔥🔥 #squarecreator #SquareBinance
Next resistance: The price is now hitting a minor resistance at 0.00000391.
If it manages to break through, the next target is the red-line area around 0.00000409.
Current outlook:
Bullish scenario (continuation):
If the price closes above 0.00000391, it is likely to continue rising to test the 0.00000405 - 0.00000410 area. This rebound is currently a “corrective bounce” within an overall bearish trend. Turning it into an uptrend requires breaking the 410 levels and holding above them.
Cautious scenario (chop):
Since the overall money flow is still choppy, we may see a small pullback (retest) to 0.00000376 before attempting to rise again.
Summary:
The coin has successfully formed a “temporary bottom.” The advice now is to monitor 0.00000391; breaking it means the uptrend continues, while failing to break it may send the price back into sideways fluctuation.
Always remember: placing a “stop-loss” below the most recent low (0.00000365) is a necessary step to protect yourself in case the market moves suddenly.
$PEPE $BTC
#XRPRallies44%InAWeek #PEPEAnalysis #BTC🔥🔥🔥🔥🔥 #squarecreator #SquareBinance
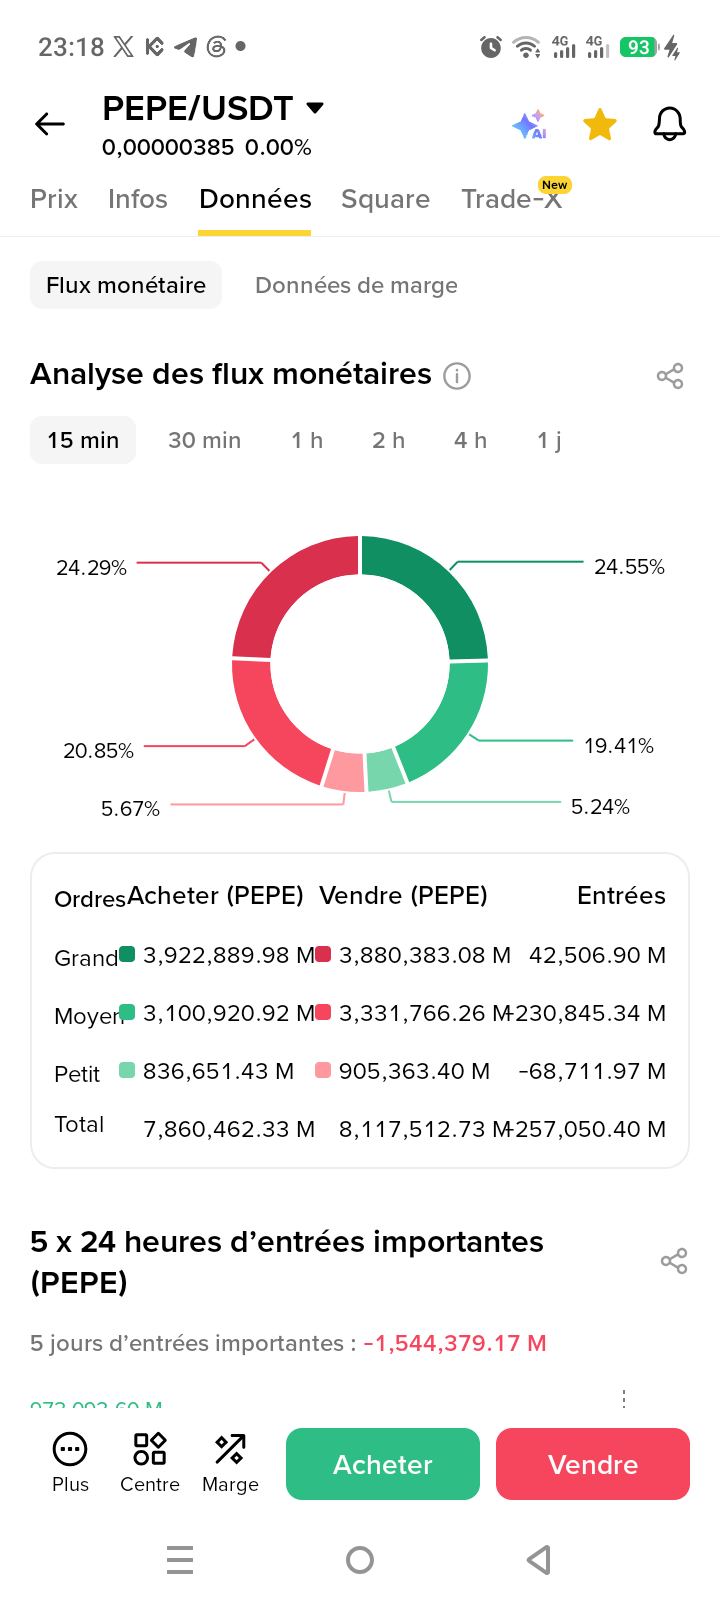

This is exactly what I expected in the previous post 🔥👇 Follow and hit like so you get all the new updates about crypto currency analysis and predictions ✅
Trading analyst pro
·
--
🔮 Forecast for the $PEPE coin in the near term (within the next 12 to 24 hours):
After the rapid rise, the price appears to be trying to enter a consolidation phase, with three possible scenarios:
The First Scenario 👈 Continued Upward Momentum
If the price holds steady and manages to break the resistance level at 0.00000373 with a 4-hour candle close above it, attention may shift to 0.00000390, then to a test of the 0.00000400 barrier.
However, the breakout still needs confirmation through trading volume and the continuation of overall market strength.
The Second Scenario 👈 A Natural Correction After the Surge
After two strong bullish candles, a temporary pullback may occur due to profit-taking. In that case, the price may test the first support area near 0.00000334.
A clear rebound from this zone may indicate that positive momentum remains, while losing it could increase the chances of the correction continuing.
The Third Scenario 👈 Bearish Breakout and Increased Selling Pressure
If the market witnesses a broad decline, especially in BTC, the price may return to test the 0.00000318 area.
A drop and consolidation below this level may weaken the short-term bullish outlook and increase the risks of further pullback.
$BTC
#BitcoinBestWeekSinceMarch2023 #pepe⚡ #analysis #تحليل_البيتكوين
After the rapid rise, the price appears to be trying to enter a consolidation phase, with three possible scenarios:
The First Scenario 👈 Continued Upward Momentum
If the price holds steady and manages to break the resistance level at 0.00000373 with a 4-hour candle close above it, attention may shift to 0.00000390, then to a test of the 0.00000400 barrier.
However, the breakout still needs confirmation through trading volume and the continuation of overall market strength.
The Second Scenario 👈 A Natural Correction After the Surge
After two strong bullish candles, a temporary pullback may occur due to profit-taking. In that case, the price may test the first support area near 0.00000334.
A clear rebound from this zone may indicate that positive momentum remains, while losing it could increase the chances of the correction continuing.
The Third Scenario 👈 Bearish Breakout and Increased Selling Pressure
If the market witnesses a broad decline, especially in BTC, the price may return to test the 0.00000318 area.
A drop and consolidation below this level may weaken the short-term bullish outlook and increase the risks of further pullback.
$BTC
#BitcoinBestWeekSinceMarch2023 #pepe⚡ #analysis #تحليل_البيتكوين
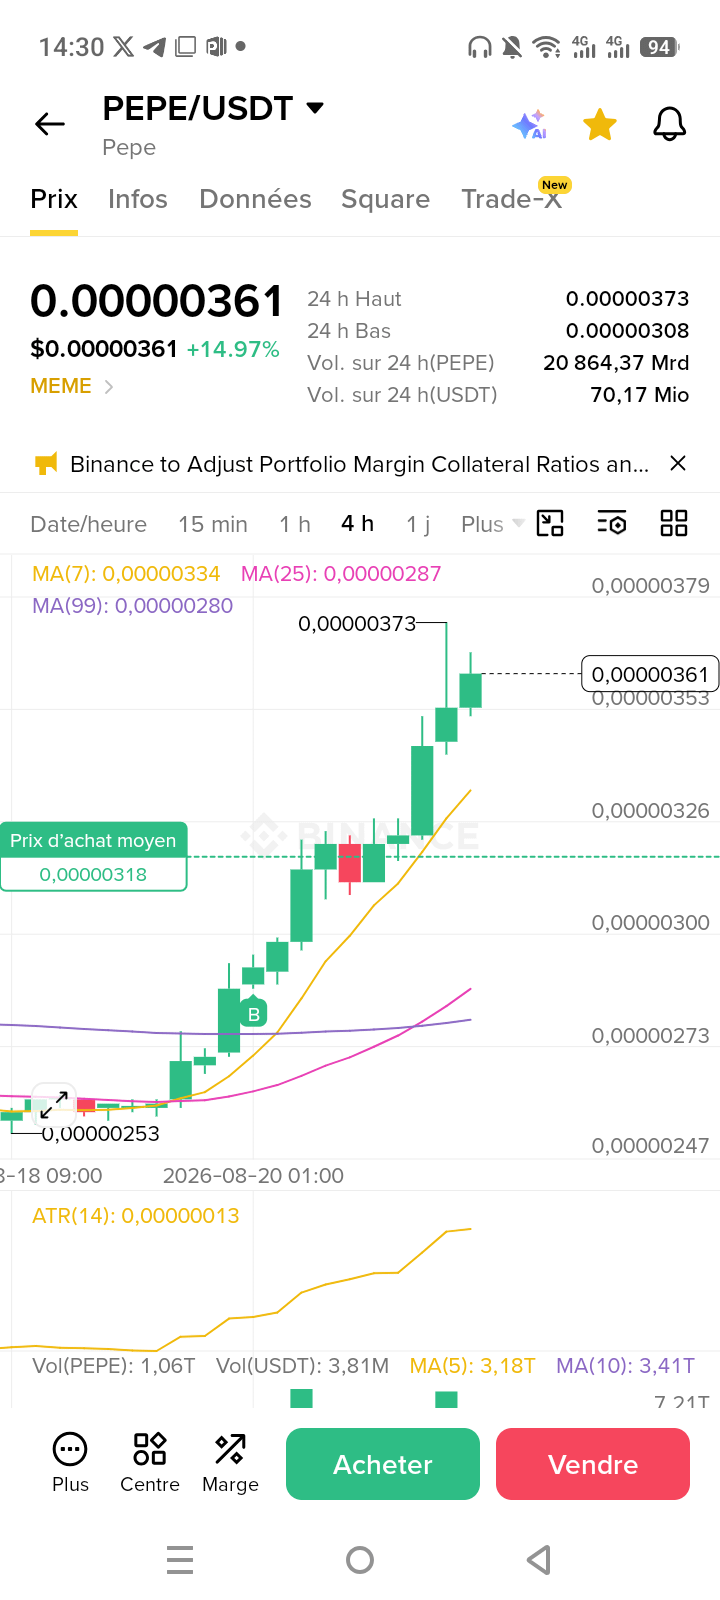
🔮 Forecast for the $PEPE coin in the near term (within the next 12 to 24 hours):
After the rapid rise, the price appears to be trying to enter a consolidation phase, with three possible scenarios:
The First Scenario 👈 Continued Upward Momentum
If the price holds steady and manages to break the resistance level at 0.00000373 with a 4-hour candle close above it, attention may shift to 0.00000390, then to a test of the 0.00000400 barrier.
However, the breakout still needs confirmation through trading volume and the continuation of overall market strength.
The Second Scenario 👈 A Natural Correction After the Surge
After two strong bullish candles, a temporary pullback may occur due to profit-taking. In that case, the price may test the first support area near 0.00000334.
A clear rebound from this zone may indicate that positive momentum remains, while losing it could increase the chances of the correction continuing.
The Third Scenario 👈 Bearish Breakout and Increased Selling Pressure
If the market witnesses a broad decline, especially in BTC, the price may return to test the 0.00000318 area.
A drop and consolidation below this level may weaken the short-term bullish outlook and increase the risks of further pullback.
$BTC
#BitcoinBestWeekSinceMarch2023 #pepe⚡ #analysis #تحليل_البيتكوين
After the rapid rise, the price appears to be trying to enter a consolidation phase, with three possible scenarios:
The First Scenario 👈 Continued Upward Momentum
If the price holds steady and manages to break the resistance level at 0.00000373 with a 4-hour candle close above it, attention may shift to 0.00000390, then to a test of the 0.00000400 barrier.
However, the breakout still needs confirmation through trading volume and the continuation of overall market strength.
The Second Scenario 👈 A Natural Correction After the Surge
After two strong bullish candles, a temporary pullback may occur due to profit-taking. In that case, the price may test the first support area near 0.00000334.
A clear rebound from this zone may indicate that positive momentum remains, while losing it could increase the chances of the correction continuing.
The Third Scenario 👈 Bearish Breakout and Increased Selling Pressure
If the market witnesses a broad decline, especially in BTC, the price may return to test the 0.00000318 area.
A drop and consolidation below this level may weaken the short-term bullish outlook and increase the risks of further pullback.
$BTC
#BitcoinBestWeekSinceMarch2023 #pepe⚡ #analysis #تحليل_البيتكوين
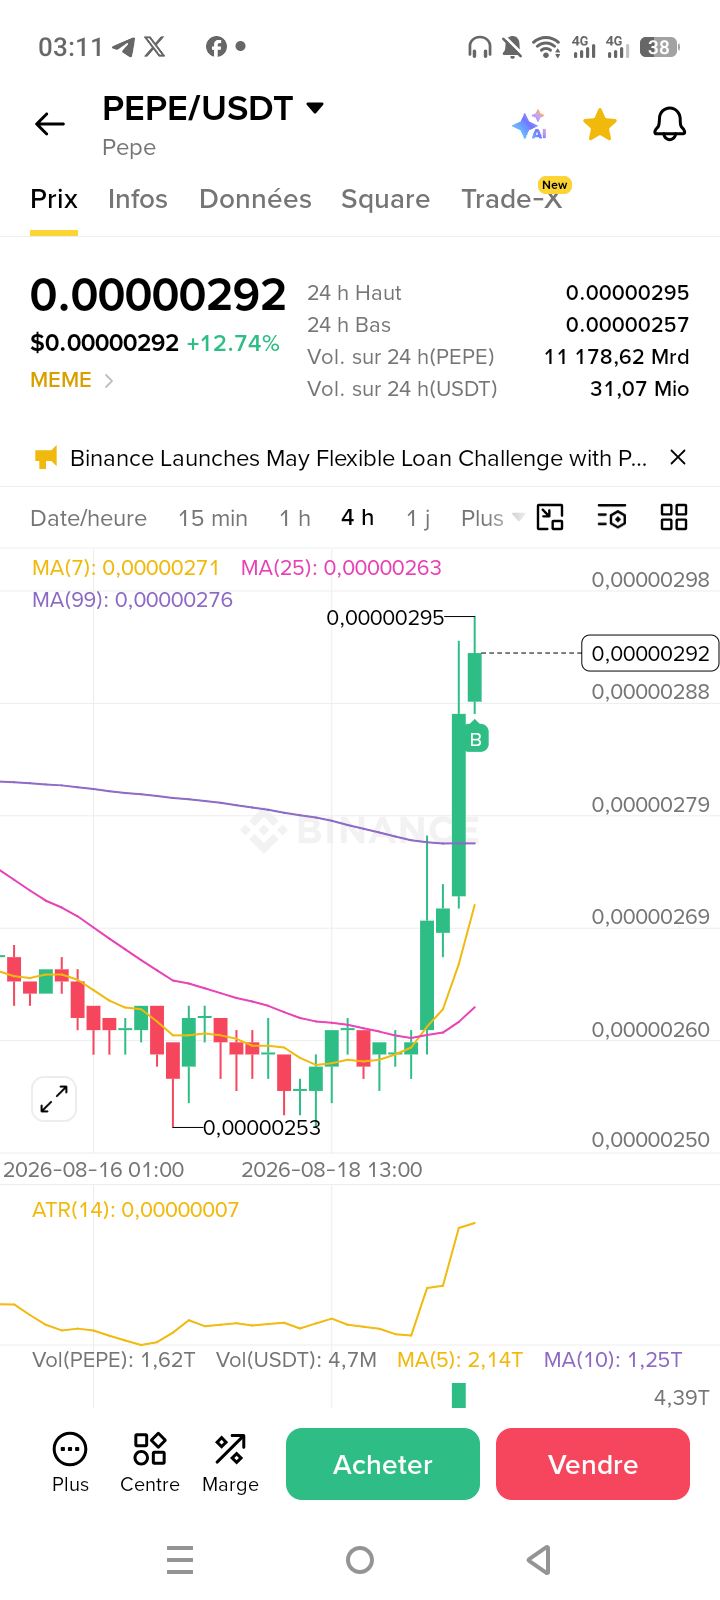
: Short-term outlook for the $PEPE coin (within 24 to 48 hours)
First scenario (most likely and technically healthier): entering a sideways corrective move; the appearance of the upper wick at the level 0.00000295 suggests that the coin will undergo a slight corrective decline or sideways consolidation between the levels 0.00000288 and 0.00000276.
This correction is very healthy to rebuild purchasing power and test the support level that was recently broken at 0.00000276 before resuming the upward move toward the target 0.00000300 and above.
Second scenario: breaking the resistance directly and continuing
If sudden liquidity appears and the resistance level 0.00000295 is broken with a close above it, the price will immediately move toward breaking the 0.00000300 barrier (the target) and test the areas around 0.00000315.
💡 Fourth: Strategy and trading tips
For new buyers: avoid buying directly at current prices (0.00000292), due to resistance at 0.00000295. The best and safest buying zone is after a corrective dip and a test of the support areas between 0.00000280 and 0.00000276.
For traders already in the trade: it is recommended to place a stop-loss order to protect profits (Stop-Loss) below the main support at 0.00000270, or take part of the profits near the top between 0.00000295 and 0.00000300.
#pepe⚡ #Analisatrader
First scenario (most likely and technically healthier): entering a sideways corrective move; the appearance of the upper wick at the level 0.00000295 suggests that the coin will undergo a slight corrective decline or sideways consolidation between the levels 0.00000288 and 0.00000276.
This correction is very healthy to rebuild purchasing power and test the support level that was recently broken at 0.00000276 before resuming the upward move toward the target 0.00000300 and above.
Second scenario: breaking the resistance directly and continuing
If sudden liquidity appears and the resistance level 0.00000295 is broken with a close above it, the price will immediately move toward breaking the 0.00000300 barrier (the target) and test the areas around 0.00000315.
💡 Fourth: Strategy and trading tips
For new buyers: avoid buying directly at current prices (0.00000292), due to resistance at 0.00000295. The best and safest buying zone is after a corrective dip and a test of the support areas between 0.00000280 and 0.00000276.
For traders already in the trade: it is recommended to place a stop-loss order to protect profits (Stop-Loss) below the main support at 0.00000270, or take part of the profits near the top between 0.00000295 and 0.00000300.
#pepe⚡ #Analisatrader
Unrealized gains exceeded $600,000; whale "first set 10 big targets" posted a short position showing 1,894 BTC
Whale "First Set 10 Big Goals" posted on X, shorting 1,894.784 BTC with an entry price of 69,826.89 USDT, currently showing an unrealized profit of approximately $601.7 thousand. They said, "Just briefly joining the short side for a moment." Later, "First Set 10 Big Goals" posted again on X, stating that the stop-loss for this short position was set at $70,400, with a take-profit target range between $68,000 and $66,500. Previously, "First Set 10 Big Goals" had shared their trading strategy on X: in the absence of extreme news, if the market rapidly rises by 5%-10%, they open short positions at current prices; if it drops by 5%-10%, they open long positions at current prices. They noted that this strategy covers the vast majority of scenarios. Using this approach, they expect a win rate of at least 6 out of 10 trades. [Odaily]
#ToyotaFinanceLaunchesTokenizedBondForRetail $BTC
Whale "First Set 10 Big Goals" posted on X, shorting 1,894.784 BTC with an entry price of 69,826.89 USDT, currently showing an unrealized profit of approximately $601.7 thousand. They said, "Just briefly joining the short side for a moment." Later, "First Set 10 Big Goals" posted again on X, stating that the stop-loss for this short position was set at $70,400, with a take-profit target range between $68,000 and $66,500. Previously, "First Set 10 Big Goals" had shared their trading strategy on X: in the absence of extreme news, if the market rapidly rises by 5%-10%, they open short positions at current prices; if it drops by 5%-10%, they open long positions at current prices. They noted that this strategy covers the vast majority of scenarios. Using this approach, they expect a win rate of at least 6 out of 10 trades. [Odaily]
#ToyotaFinanceLaunchesTokenizedBondForRetail $BTC
Standard Chartered Bank Analyst: U.S. Treasury Expands Long-Dated Bond Buybacks, BTC May Hit $100,000 by Year-End
Standard Bank analyst Geoff Kendrick pointed out in his latest client report that the U.S. Department of the Treasury announced an Increase in the repurchase volume of 10- to 30-year Treasury bonds from $2 billion per auction to at least $4 billion, with the execution period running from September 9 to November 4. This policy has driven long-term U.S. Treasury yields sharply lower, effectively alleviating selling pressure in the bond market. Kendrick stated that such government liquidity interventions have historically been favorable for Bitcoin, especially combined with its fixed supply attribute, making it possible for BTC to target $100,000 by year-end. Technically, he views $65,500 as a key support level, and once this level is effectively broken, it would confirm that the bottom of this cycle has been reached. [TechFlow]
$BTC
#CryptoRally #WyomingMovesFRNTToChainlinkCCIP #BTC🔥🔥🔥🔥🔥
Standard Bank analyst Geoff Kendrick pointed out in his latest client report that the U.S. Department of the Treasury announced an Increase in the repurchase volume of 10- to 30-year Treasury bonds from $2 billion per auction to at least $4 billion, with the execution period running from September 9 to November 4. This policy has driven long-term U.S. Treasury yields sharply lower, effectively alleviating selling pressure in the bond market. Kendrick stated that such government liquidity interventions have historically been favorable for Bitcoin, especially combined with its fixed supply attribute, making it possible for BTC to target $100,000 by year-end. Technically, he views $65,500 as a key support level, and once this level is effectively broken, it would confirm that the bottom of this cycle has been reached. [TechFlow]
$BTC
#CryptoRally #WyomingMovesFRNTToChainlinkCCIP #BTC🔥🔥🔥🔥🔥
Bitcoin after the halving
⚠️ Bitcoin above
k100 $BTC
and the whales are silently selling.
Did you notice?
While everyone is celebrating 🎉
The top 10 wallets transferred +47,000 BTC to exchanges in the last 30 days 📉
History says one thing:
Every time the whales distributed after the halving → the market entered a correction of 30-40%
But this time is different?
The ETF is soaking up everything 💰
So the real question isn’t "Are we going up?"
The question is: When does the big distribution start? 🤔
Are you with the bullish team 🟢
or with the cautious team 🔴?
Drop your opinion in one word 👇
#Bitcoin #BTC #Halving #WhaleAlert #CryptoMarket
$BTC
⚠️ Bitcoin above
k100 $BTC
and the whales are silently selling.
Did you notice?
While everyone is celebrating 🎉
The top 10 wallets transferred +47,000 BTC to exchanges in the last 30 days 📉
History says one thing:
Every time the whales distributed after the halving → the market entered a correction of 30-40%
But this time is different?
The ETF is soaking up everything 💰
So the real question isn’t "Are we going up?"
The question is: When does the big distribution start? 🤔
Are you with the bullish team 🟢
or with the cautious team 🔴?
Drop your opinion in one word 👇
#Bitcoin #BTC #Halving #WhaleAlert #CryptoMarket
$BTC
Memecoins | Memecoins:$NVDAB $NVDAB
Warning: About 97% of new memecoins are likely to drop to zero within just 90 days of their launch. This means there's a huge chance that the vast majority of these coins will lose value at lightning speed. Yes, that 97% indicates a massive risk, but the question remains: what about the remaining 3% of these coins? That small percentage might include a coin that could give you a colossal return of up to 100 times your investment. The real problem is that you can't know which of these coins will be the winner. The market, in this case, resembles a game of "musical chairs," where events unfold rapidly and you might lose before you find yourself on the winning chair.
The truth that many don’t disclose is that memecoins are not a real investment; they can be likened to a casino dressed up in a flashy tech facade. However, if you allocate just 5% of your investment portfolio and can afford to lose it, memecoins could be the ultimate tool for multiplying your investments during their market cycle.
So, here comes the essential question for portfolio managers and investors: what percentage of your portfolio do you allocate to investing in memecoins? Write the number precisely: Is it 0% or 5% or more than 10%?
#Memecoins #RiskManagement #Degen #MemeSeason #trading
Warning: About 97% of new memecoins are likely to drop to zero within just 90 days of their launch. This means there's a huge chance that the vast majority of these coins will lose value at lightning speed. Yes, that 97% indicates a massive risk, but the question remains: what about the remaining 3% of these coins? That small percentage might include a coin that could give you a colossal return of up to 100 times your investment. The real problem is that you can't know which of these coins will be the winner. The market, in this case, resembles a game of "musical chairs," where events unfold rapidly and you might lose before you find yourself on the winning chair.
The truth that many don’t disclose is that memecoins are not a real investment; they can be likened to a casino dressed up in a flashy tech facade. However, if you allocate just 5% of your investment portfolio and can afford to lose it, memecoins could be the ultimate tool for multiplying your investments during their market cycle.
So, here comes the essential question for portfolio managers and investors: what percentage of your portfolio do you allocate to investing in memecoins? Write the number precisely: Is it 0% or 5% or more than 10%?
#Memecoins #RiskManagement #Degen #MemeSeason #trading
🚨Is Trump completely nuts?
He just got asked a question about inflation hitting 4% for the first time in 3 years, and his response is mind-blowing:
"I love inflation."
How could anyone have voted for him?
#USCPISurgesToThreeYearHighOf4.2% #USMayCoreInflationBelowForecast #WallStreetPreparesSpaceXIPOInfrastructure #MayCoreCPISofterThanForecastTreasuriesRise #OilVolatilityReturnsToPreIranWarLevels $BTC $ETH $BNB
He just got asked a question about inflation hitting 4% for the first time in 3 years, and his response is mind-blowing:
"I love inflation."
How could anyone have voted for him?
#USCPISurgesToThreeYearHighOf4.2% #USMayCoreInflationBelowForecast #WallStreetPreparesSpaceXIPOInfrastructure #MayCoreCPISofterThanForecastTreasuriesRise #OilVolatilityReturnsToPreIranWarLevels $BTC $ETH $BNB
#TRUMP FINED $200 for failing to disclose stock trades worth tens of MILLIONS of dollars — #WAPO
The stocks reportedly belonged to #amazon and #Microsoft
The stocks reportedly belonged to #amazon and #Microsoft
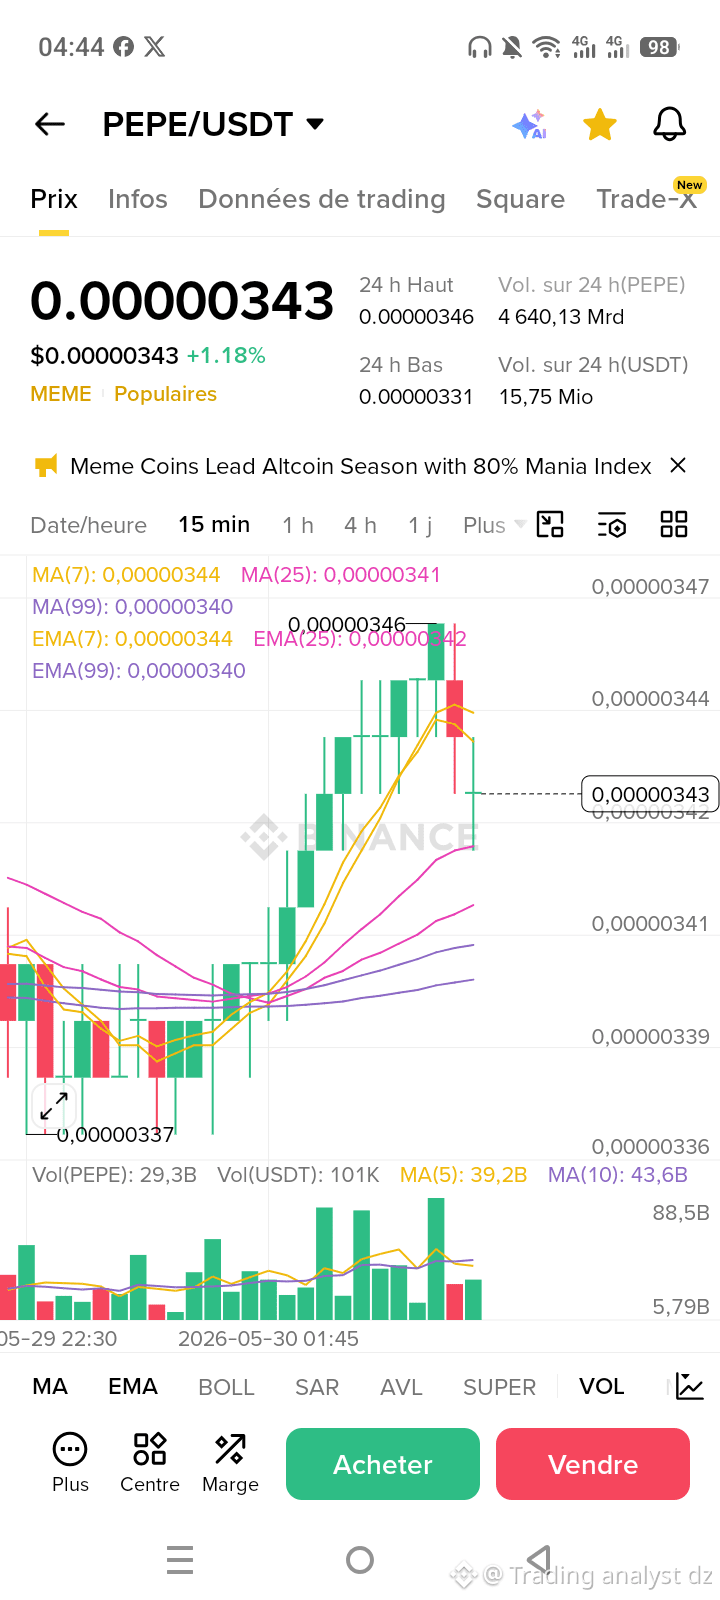
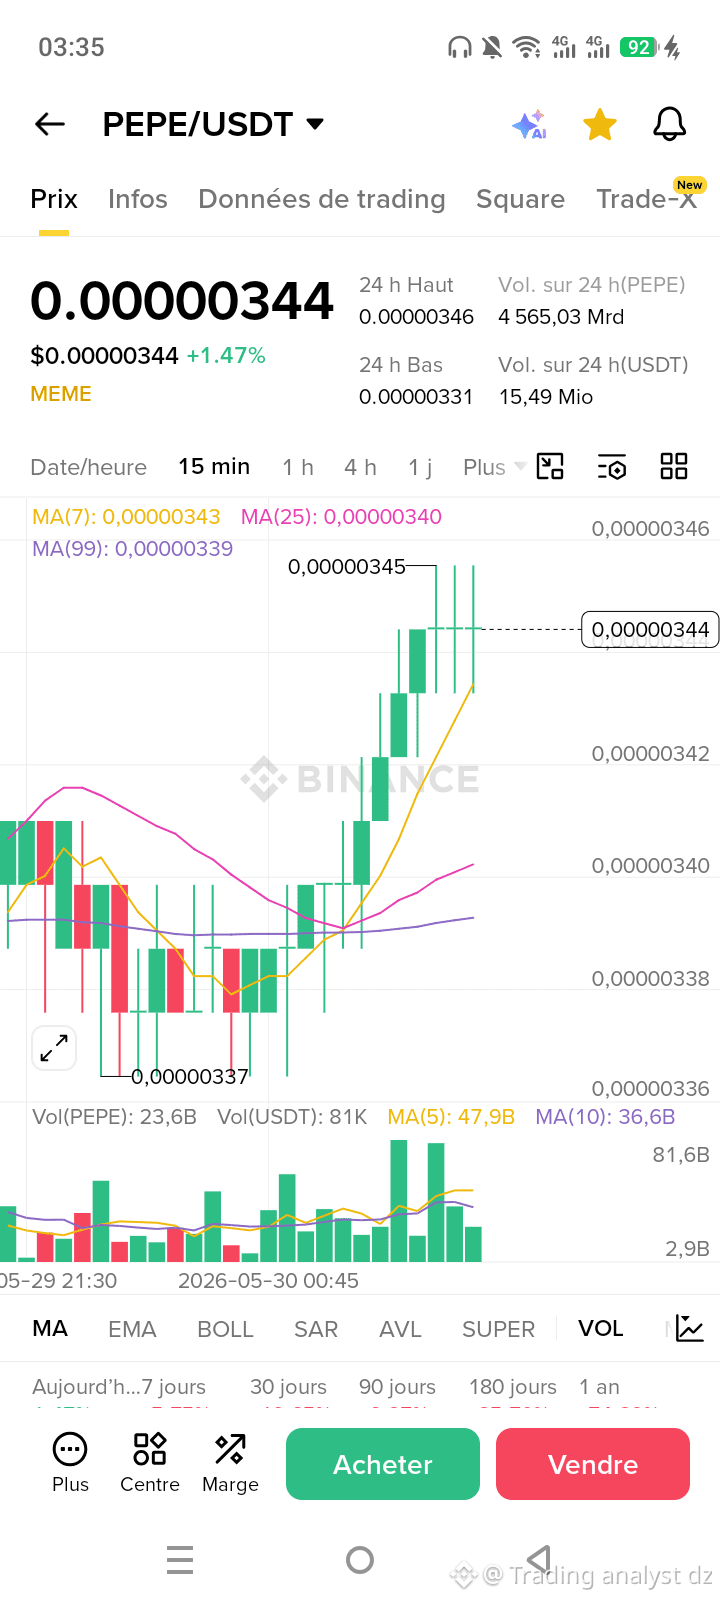
$PEPE Current candlestick size:
`Vol(PEPE): 29.3B` = 29.3 billion PEPE**
Current volume **29.3B is below MA5 (39.2B)
: This means
- ⚠️ Volume is still weak
- ❌ Not enough to confirm a break at 0.00000346
- Price dropped from 0.00000346 to 0.00000343, confirming that the previous break was **illusory** due to weak volume
Current situation: Waiting for support at **0.00000341–0.00000342** before making any moves.
#PEPE #memecoin🚀🚀🚀 #CME247CryptoFuturesOptions #عملات_رقمية #تحليل_عملات_رقمية $PEPE
`Vol(PEPE): 29.3B` = 29.3 billion PEPE**
Current volume **29.3B is below MA5 (39.2B)
: This means
- ⚠️ Volume is still weak
- ❌ Not enough to confirm a break at 0.00000346
- Price dropped from 0.00000346 to 0.00000343, confirming that the previous break was **illusory** due to weak volume
Current situation: Waiting for support at **0.00000341–0.00000342** before making any moves.
#PEPE #memecoin🚀🚀🚀 #CME247CryptoFuturesOptions #عملات_رقمية #تحليل_عملات_رقمية $PEPE
$PEPE What happens when the price breaks 0.00000346?
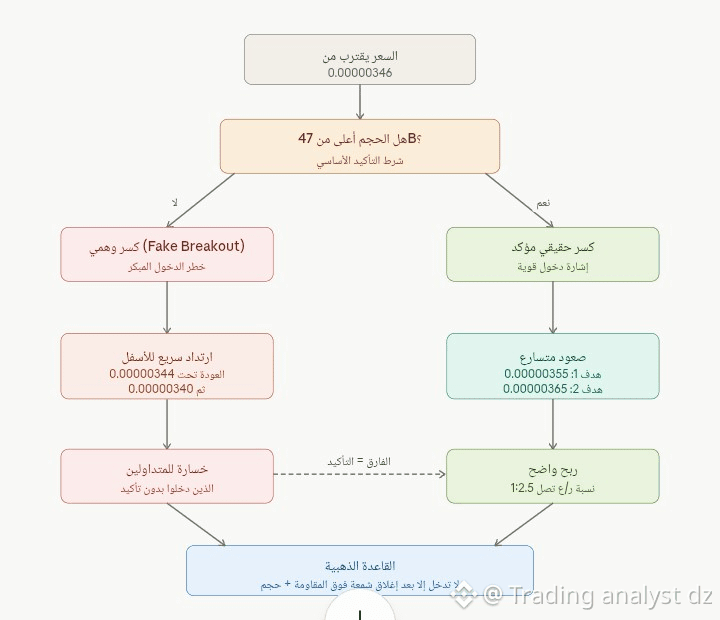
When the price hits 0.00000346, the only question that matters is: does the volume support the break?
If the volume is below 47B → fake break, which is the riskiest. The price spikes through resistance for a few seconds to lure traders in, then it sharply retraces down to the 0.00000340 zone. Anyone who jumped in without confirmation gets wrecked immediately.
If the volume is above 47B → real break, and here three things happen in sequence: resistance turns into new support, late traders (FOMO) pile in increasing buying pressure, and the price heads towards 0.00000355 then 0.00000365.
The golden rule to remember: never enter when the price touches resistance; wait for a full candle close (15 minutes) above it with high volume. A few seconds of patience can make the difference between a winning trade and a guaranteed loss.
#PEPE #عملات_رقمية #تحليل_العملات_الرقمية #BinanceSquare #TradingCommunity $PEPE
When the price hits 0.00000346, the only question that matters is: does the volume support the break?
If the volume is below 47B → fake break, which is the riskiest. The price spikes through resistance for a few seconds to lure traders in, then it sharply retraces down to the 0.00000340 zone. Anyone who jumped in without confirmation gets wrecked immediately.
If the volume is above 47B → real break, and here three things happen in sequence: resistance turns into new support, late traders (FOMO) pile in increasing buying pressure, and the price heads towards 0.00000355 then 0.00000365.
The golden rule to remember: never enter when the price touches resistance; wait for a full candle close (15 minutes) above it with high volume. A few seconds of patience can make the difference between a winning trade and a guaranteed loss.
#PEPE #عملات_رقمية #تحليل_العملات_الرقمية #BinanceSquare #TradingCommunity $PEPE
The tool in front of you has 3 tabs:
**Price Map** — Visually shows all support and resistance levels along with the current price.
**Entry Points** — Three opportunities ranked by quality:
- The first point at 0.00000339–0.00000341 is optimal (Risk/Reward ratio 2.5:1)
- The second point is a breakout at 0.00000346 with strong volume
- The third is opportunistic at MA99, with a higher risk
**Risk Management** — Interactive calculator: Slide the bar to set your capital and risk percentage, and it will automatically calculate the position size and expected profit for you.
#PEPE #BinanceSquare #TraderAlert #نصائح_فنية #CME247CryptoFuturesOptions $PEPE
**Price Map** — Visually shows all support and resistance levels along with the current price.
**Entry Points** — Three opportunities ranked by quality:
- The first point at 0.00000339–0.00000341 is optimal (Risk/Reward ratio 2.5:1)
- The second point is a breakout at 0.00000346 with strong volume
- The third is opportunistic at MA99, with a higher risk
**Risk Management** — Interactive calculator: Slide the bar to set your capital and risk percentage, and it will automatically calculate the position size and expected profit for you.
#PEPE #BinanceSquare #TraderAlert #نصائح_فنية #CME247CryptoFuturesOptions $PEPE
Log in to explore more content