
nayrbryanGaming
967 Posting

nayrbryanGaming
Laporkan
Blokir Pengguna
Content Creator | Trader | Web3 & Crypto | Photographer| CEO @NNG_ESPORT | Esports pioneer est. 2010 | IG/Twitch: @nayrbryan_gaming | TikTok:@nayrbryanGaming

Pemilik SOL
Pedagang Rutin
1.8 Tahun
924 Mengikuti
417 Pengikut
354 Disukai
Posting
Semua
Kuotasi
·
--
Bullish
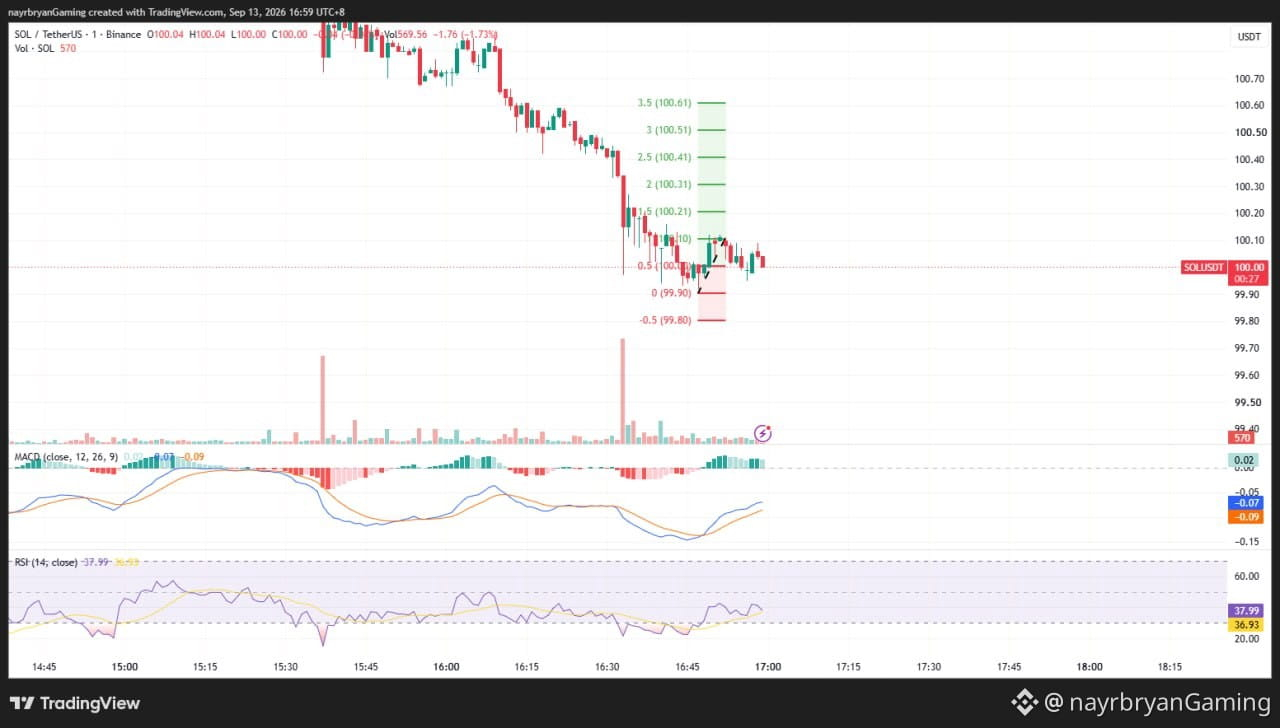
MOTIVASI TRADER / MINI INSIGHT
🧠 Insight Hari Ini
“Jangan samakan pantulan dengan tembus (breakout).”
Mengapa Ini Penting
Reaksi dari area support bisa terlihat kuat, tetapi pasar tetap perlu membuktikan bahwa pembeli mampu menembus (mengatasi) resistance.
SOL saat ini sedang memampat di antara area support 99.90–100.00 dan struktur menurun di bagian atas.
Level penting adalah 100.11.
Sebelum level itu dikonfirmasi, kesabaran lebih penting daripada prediksi.
Eksekusi cerdas berfokus pada:
• Reaksi dari support • Konfirmasi breakout • Re-test (uji ulang) • Invalidation • Kontrol risiko
🎯 Checklist Trader
Tandai zona support 99.90–100.00
Perhatikan 100.11 untuk konfirmasi
Pantau trendline menurun
Patuhi invalidation di 99.80
Hindari mengejar candle breakout pertama
Lindungi modal
🧠 Mini Challenge
Sebelum masuk, tanyakan:
“Apakah pasar sudah mengonfirmasi breakout — atau saya hanya mengasumsikan itu akan terjadi?”
— @nayrbryanGaming #TraderMindset #TradingDiscipline #NoFOMO #CryptoMindset #DYOR #PriceAction #SOLUSDT
🔔 Ikuti Binance Square & X saya (@nayrbryanGaming) untuk insight chart harian.
MOTIVASI TRADER / MINI INSIGHT
🧠 Insight Hari Ini
“Jangan samakan pantulan dengan tembus (breakout).”
Mengapa Ini Penting
Reaksi dari area support bisa terlihat kuat, tetapi pasar tetap perlu membuktikan bahwa pembeli mampu menembus (mengatasi) resistance.
SOL saat ini sedang memampat di antara area support 99.90–100.00 dan struktur menurun di bagian atas.
Level penting adalah 100.11.
Sebelum level itu dikonfirmasi, kesabaran lebih penting daripada prediksi.
Eksekusi cerdas berfokus pada:
• Reaksi dari support • Konfirmasi breakout • Re-test (uji ulang) • Invalidation • Kontrol risiko
🎯 Checklist Trader
Tandai zona support 99.90–100.00
Perhatikan 100.11 untuk konfirmasi
Pantau trendline menurun
Patuhi invalidation di 99.80
Hindari mengejar candle breakout pertama
Lindungi modal
🧠 Mini Challenge
Sebelum masuk, tanyakan:
“Apakah pasar sudah mengonfirmasi breakout — atau saya hanya mengasumsikan itu akan terjadi?”
— @nayrbryanGaming #TraderMindset #TradingDiscipline #NoFOMO #CryptoMindset #DYOR #PriceAction #SOLUSDT
🔔 Ikuti Binance Square & X saya (@nayrbryanGaming) untuk insight chart harian.
🧠 Insight Hari Ini
“Jangan samakan pantulan dengan tembus (breakout).”
Mengapa Ini Penting
Reaksi dari area support bisa terlihat kuat, tetapi pasar tetap perlu membuktikan bahwa pembeli mampu menembus (mengatasi) resistance.
SOL saat ini sedang memampat di antara area support 99.90–100.00 dan struktur menurun di bagian atas.
Level penting adalah 100.11.
Sebelum level itu dikonfirmasi, kesabaran lebih penting daripada prediksi.
Eksekusi cerdas berfokus pada:
• Reaksi dari support • Konfirmasi breakout • Re-test (uji ulang) • Invalidation • Kontrol risiko
🎯 Checklist Trader
Tandai zona support 99.90–100.00
Perhatikan 100.11 untuk konfirmasi
Pantau trendline menurun
Patuhi invalidation di 99.80
Hindari mengejar candle breakout pertama
Lindungi modal
🧠 Mini Challenge
Sebelum masuk, tanyakan:
“Apakah pasar sudah mengonfirmasi breakout — atau saya hanya mengasumsikan itu akan terjadi?”
— @nayrbryanGaming #TraderMindset #TradingDiscipline #NoFOMO #CryptoMindset #DYOR #PriceAction #SOLUSDT
🔔 Ikuti Binance Square & X saya (@nayrbryanGaming) untuk insight chart harian.
60
·
--
Bullish
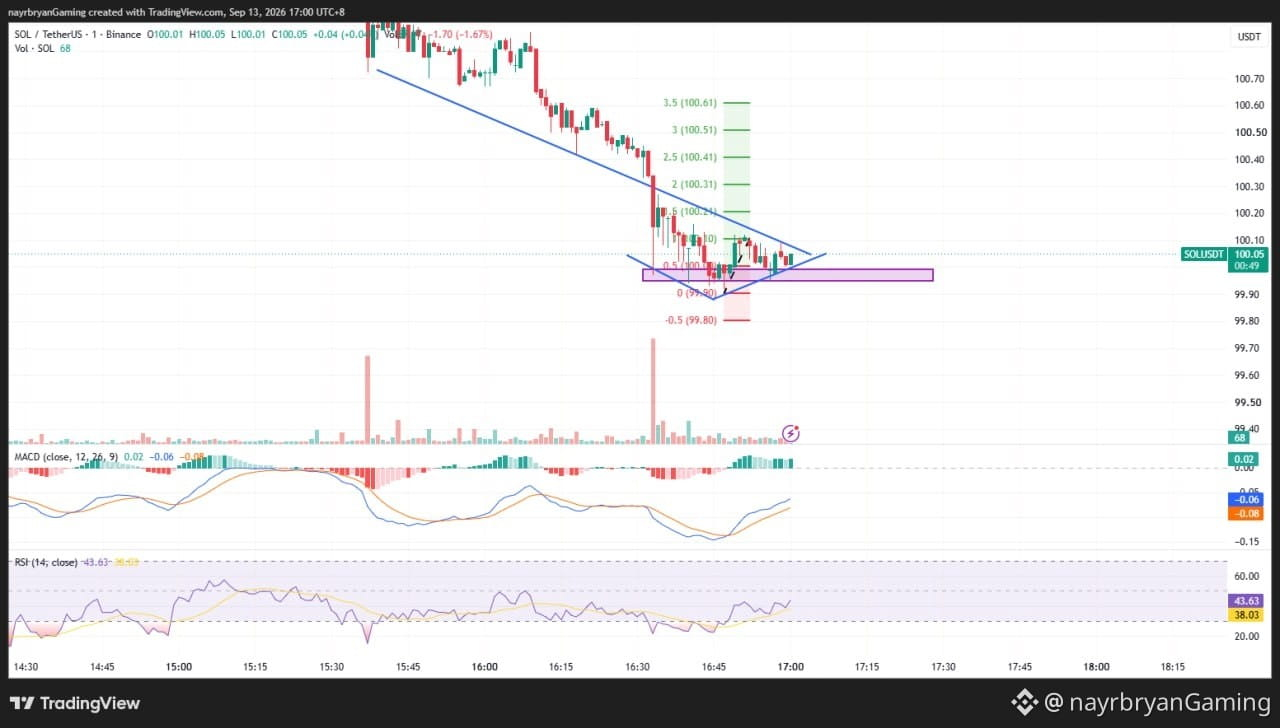
ANALISIS LIGHT / PENGATURAN CHART — SOL/USDT
📈 Gambaran Struktur
Fase pasar: Sell-off → Reaksi pada Support → Kompresi
Zona support kunci: 99.90 – 100.00
Level breakout kunci: 100.11
Level upside utama: 100.21 → 100.31 → 100.41 → 100.51 → 100.61
Referensi invalidasi downside: 99.80
📌 Yang Saya Pantau
Skenario A — Lanjutan Bullish
Jika SOL bertahan di area support 99.90–100.00 dan menembus di atas 100.11, harga dapat berputar menuju:
100.21 → 100.31 → 100.41 → 100.51 → 100.61
Pergerakan yang bertahan di atas 100.11 akan memberi konfirmasi yang lebih kuat bahwa pembeli kembali menguasai kendali jangka pendek.
Skenario B — Kegagalan Support
Jika SOL kehilangan 99.90, struktur pemulihan saat ini melemah.
Referensi Fibonacci downside berikutnya yang ditandai adalah:
99.80
Pergerakan di bawah level tersebut akan membatalkan kerangka kelanjutan bullish yang segera dan membutuhkan penilaian struktur baru.
📊 Cek Indikator
MACD: Membaik → momentum jangka pendek pulih
RSI: 43.63 → lemah-netral, pulih
Struktur Harga: Garis tren menurun + kompresi yang mengencang
Konfirmasi Kunci: breakout 100.11 / kegagalan support 99.90
Catatan: Ini adalah kerangka chart, bukan rekomendasi trading. Gunakan ini untuk mendukung rencana eksekusi Anda sendiri berbasis DYOR.
— @nayrbryanGaming #SOLAnalysis #ChartSetup #PriceAction #SmartMoney #Fibonacci #CryptoTrading #DYOR #NFA
ANALISIS LIGHT / PENGATURAN CHART — SOL/USDT
📈 Gambaran Struktur
Fase pasar: Sell-off → Reaksi pada Support → Kompresi
Zona support kunci: 99.90 – 100.00
Level breakout kunci: 100.11
Level upside utama: 100.21 → 100.31 → 100.41 → 100.51 → 100.61
Referensi invalidasi downside: 99.80
📌 Yang Saya Pantau
Skenario A — Lanjutan Bullish
Jika SOL bertahan di area support 99.90–100.00 dan menembus di atas 100.11, harga dapat berputar menuju:
100.21 → 100.31 → 100.41 → 100.51 → 100.61
Pergerakan yang bertahan di atas 100.11 akan memberi konfirmasi yang lebih kuat bahwa pembeli kembali menguasai kendali jangka pendek.
Skenario B — Kegagalan Support
Jika SOL kehilangan 99.90, struktur pemulihan saat ini melemah.
Referensi Fibonacci downside berikutnya yang ditandai adalah:
99.80
Pergerakan di bawah level tersebut akan membatalkan kerangka kelanjutan bullish yang segera dan membutuhkan penilaian struktur baru.
📊 Cek Indikator
MACD: Membaik → momentum jangka pendek pulih
RSI: 43.63 → lemah-netral, pulih
Struktur Harga: Garis tren menurun + kompresi yang mengencang
Konfirmasi Kunci: breakout 100.11 / kegagalan support 99.90
Catatan: Ini adalah kerangka chart, bukan rekomendasi trading. Gunakan ini untuk mendukung rencana eksekusi Anda sendiri berbasis DYOR.
— @nayrbryanGaming #SOLAnalysis #ChartSetup #PriceAction #SmartMoney #Fibonacci #CryptoTrading #DYOR #NFA
📈 Gambaran Struktur
Fase pasar: Sell-off → Reaksi pada Support → Kompresi
Zona support kunci: 99.90 – 100.00
Level breakout kunci: 100.11
Level upside utama: 100.21 → 100.31 → 100.41 → 100.51 → 100.61
Referensi invalidasi downside: 99.80
📌 Yang Saya Pantau
Skenario A — Lanjutan Bullish
Jika SOL bertahan di area support 99.90–100.00 dan menembus di atas 100.11, harga dapat berputar menuju:
100.21 → 100.31 → 100.41 → 100.51 → 100.61
Pergerakan yang bertahan di atas 100.11 akan memberi konfirmasi yang lebih kuat bahwa pembeli kembali menguasai kendali jangka pendek.
Skenario B — Kegagalan Support
Jika SOL kehilangan 99.90, struktur pemulihan saat ini melemah.
Referensi Fibonacci downside berikutnya yang ditandai adalah:
99.80
Pergerakan di bawah level tersebut akan membatalkan kerangka kelanjutan bullish yang segera dan membutuhkan penilaian struktur baru.
📊 Cek Indikator
MACD: Membaik → momentum jangka pendek pulih
RSI: 43.63 → lemah-netral, pulih
Struktur Harga: Garis tren menurun + kompresi yang mengencang
Konfirmasi Kunci: breakout 100.11 / kegagalan support 99.90
Catatan: Ini adalah kerangka chart, bukan rekomendasi trading. Gunakan ini untuk mendukung rencana eksekusi Anda sendiri berbasis DYOR.
— @nayrbryanGaming #SOLAnalysis #ChartSetup #PriceAction #SmartMoney #Fibonacci #CryptoTrading #DYOR #NFA
76
·
--
Bullish
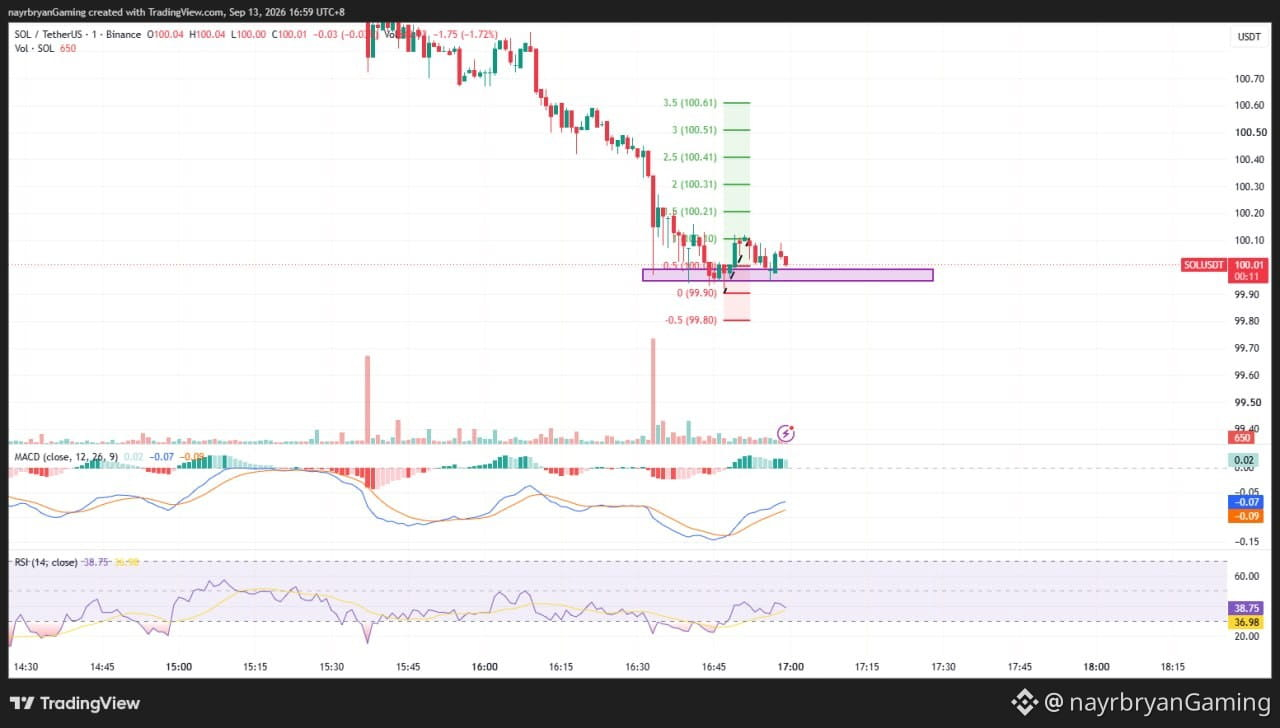
SINYAL HARIAN — SOL/USDT
Tanggal: 13 Sep 2026 Timeframe: 1m Bias Intraday: Reaksi dari support → kompresi → upaya breakout
📊 Bias Pasar
SOL sedang pulih dari penurunan (sell-off) terbaru dan saat ini sedang berkonsolidasi di sekitar zona struktur 99.90–100.00.
Harga bereaksi dari area support bawah dan kini membentuk struktur yang lebih rapat di bawah garis tren menurun.
Kandil terbaru bertahan di atas area 99.90, sementara momentum jangka pendek perlahan membaik.
Break yang terkonfirmasi di atas resistance lokal sekitar 100.11 akan memperkuat skenario kelanjutan bullish.
🔹 Level Utama Dari Chart
Area Entri / Reaksi: 99.90 → 100.00
Support Utama: 99.90
Konfirmasi Breakout: 100.11
Referensi Invalidation: Di bawah 99.80
🎯 Target Fibonacci Ke Atas
TP1 → 100.11 (1.0 Fib) TP2 → 100.21 (1.5 Fib) TP3 → 100.31 (2.0 Fib) TP4 → 100.41 (2.5 Fib) TP5 → 100.51 (3.0 Fib) TP6 → 100.61 (3.5 Fib)
🔻 Referensi Ke Bawah
Jika struktur support gagal:
99.80 (-0.5 Fib)
Pergerakan yang bertahan di bawah 99.90 akan melemahkan struktur pemulihan saat ini.
📈 Analisis Teknis
SOL masih berada dalam struktur menurun jangka pendek yang lebih luas setelah penurunan tajam dari area 100.70+.
Namun, harga telah bereaksi dari area support 99.90 dan kini sedang mengompres dekat bagian atas struktur lokal.
Momentum MACD membaik, dengan histogram beralih menjadi positif sementara garis MACD pulih dari level yang lebih rendah.
RSI berada di sekitar 43.63, menunjukkan bahwa momentum masih di bawah titik tengah bullish tetapi sedang pulih dari kondisi yang lebih lemah.
Level kunci yang perlu diperhatikan adalah 100.11.
Jika level ini berhasil direbut kembali secara terkonfirmasi, maka dapat membuka jalan menuju:
100.21 → 100.31 → 100.41 → 100.51 → 100.61
🧠 Insight Cepat
“Support memberi setup. Konfirmasi memberi arah.”
⚠️ Disclaimer
Ini adalah analisis pasar personal, bukan nasihat keuangan. Kerangka chart ini hanya untuk tujuan edukasi.
Selalu DYOR / DYODD, kelola risiko dengan benar, dan hindari trading secara emosional.
— @nayrbryanGaming #SOL #SOLUSDT #Crypto #Trading #TechnicalAnalysis #PriceAction #Fibonacci
SINYAL HARIAN — SOL/USDT
Tanggal: 13 Sep 2026 Timeframe: 1m Bias Intraday: Reaksi dari support → kompresi → upaya breakout
📊 Bias Pasar
SOL sedang pulih dari penurunan (sell-off) terbaru dan saat ini sedang berkonsolidasi di sekitar zona struktur 99.90–100.00.
Harga bereaksi dari area support bawah dan kini membentuk struktur yang lebih rapat di bawah garis tren menurun.
Kandil terbaru bertahan di atas area 99.90, sementara momentum jangka pendek perlahan membaik.
Break yang terkonfirmasi di atas resistance lokal sekitar 100.11 akan memperkuat skenario kelanjutan bullish.
🔹 Level Utama Dari Chart
Area Entri / Reaksi: 99.90 → 100.00
Support Utama: 99.90
Konfirmasi Breakout: 100.11
Referensi Invalidation: Di bawah 99.80
🎯 Target Fibonacci Ke Atas
TP1 → 100.11 (1.0 Fib) TP2 → 100.21 (1.5 Fib) TP3 → 100.31 (2.0 Fib) TP4 → 100.41 (2.5 Fib) TP5 → 100.51 (3.0 Fib) TP6 → 100.61 (3.5 Fib)
🔻 Referensi Ke Bawah
Jika struktur support gagal:
99.80 (-0.5 Fib)
Pergerakan yang bertahan di bawah 99.90 akan melemahkan struktur pemulihan saat ini.
📈 Analisis Teknis
SOL masih berada dalam struktur menurun jangka pendek yang lebih luas setelah penurunan tajam dari area 100.70+.
Namun, harga telah bereaksi dari area support 99.90 dan kini sedang mengompres dekat bagian atas struktur lokal.
Momentum MACD membaik, dengan histogram beralih menjadi positif sementara garis MACD pulih dari level yang lebih rendah.
RSI berada di sekitar 43.63, menunjukkan bahwa momentum masih di bawah titik tengah bullish tetapi sedang pulih dari kondisi yang lebih lemah.
Level kunci yang perlu diperhatikan adalah 100.11.
Jika level ini berhasil direbut kembali secara terkonfirmasi, maka dapat membuka jalan menuju:
100.21 → 100.31 → 100.41 → 100.51 → 100.61
🧠 Insight Cepat
“Support memberi setup. Konfirmasi memberi arah.”
⚠️ Disclaimer
Ini adalah analisis pasar personal, bukan nasihat keuangan. Kerangka chart ini hanya untuk tujuan edukasi.
Selalu DYOR / DYODD, kelola risiko dengan benar, dan hindari trading secara emosional.
— @nayrbryanGaming #SOL #SOLUSDT #Crypto #Trading #TechnicalAnalysis #PriceAction #Fibonacci
Tanggal: 13 Sep 2026 Timeframe: 1m Bias Intraday: Reaksi dari support → kompresi → upaya breakout
📊 Bias Pasar
SOL sedang pulih dari penurunan (sell-off) terbaru dan saat ini sedang berkonsolidasi di sekitar zona struktur 99.90–100.00.
Harga bereaksi dari area support bawah dan kini membentuk struktur yang lebih rapat di bawah garis tren menurun.
Kandil terbaru bertahan di atas area 99.90, sementara momentum jangka pendek perlahan membaik.
Break yang terkonfirmasi di atas resistance lokal sekitar 100.11 akan memperkuat skenario kelanjutan bullish.
🔹 Level Utama Dari Chart
Area Entri / Reaksi: 99.90 → 100.00
Support Utama: 99.90
Konfirmasi Breakout: 100.11
Referensi Invalidation: Di bawah 99.80
🎯 Target Fibonacci Ke Atas
TP1 → 100.11 (1.0 Fib) TP2 → 100.21 (1.5 Fib) TP3 → 100.31 (2.0 Fib) TP4 → 100.41 (2.5 Fib) TP5 → 100.51 (3.0 Fib) TP6 → 100.61 (3.5 Fib)
🔻 Referensi Ke Bawah
Jika struktur support gagal:
99.80 (-0.5 Fib)
Pergerakan yang bertahan di bawah 99.90 akan melemahkan struktur pemulihan saat ini.
📈 Analisis Teknis
SOL masih berada dalam struktur menurun jangka pendek yang lebih luas setelah penurunan tajam dari area 100.70+.
Namun, harga telah bereaksi dari area support 99.90 dan kini sedang mengompres dekat bagian atas struktur lokal.
Momentum MACD membaik, dengan histogram beralih menjadi positif sementara garis MACD pulih dari level yang lebih rendah.
RSI berada di sekitar 43.63, menunjukkan bahwa momentum masih di bawah titik tengah bullish tetapi sedang pulih dari kondisi yang lebih lemah.
Level kunci yang perlu diperhatikan adalah 100.11.
Jika level ini berhasil direbut kembali secara terkonfirmasi, maka dapat membuka jalan menuju:
100.21 → 100.31 → 100.41 → 100.51 → 100.61
🧠 Insight Cepat
“Support memberi setup. Konfirmasi memberi arah.”
⚠️ Disclaimer
Ini adalah analisis pasar personal, bukan nasihat keuangan. Kerangka chart ini hanya untuk tujuan edukasi.
Selalu DYOR / DYODD, kelola risiko dengan benar, dan hindari trading secara emosional.
— @nayrbryanGaming #SOL #SOLUSDT #Crypto #Trading #TechnicalAnalysis #PriceAction #Fibonacci
1
162
·
--
Bearish
MOTIVASI TRADER / MINI INSIGHT
🧠 Insight Hari Ini
“Jangan memprediksi breakout. Biarkan struktur membuktikannya.”
Mengapa Ini Penting
Saat harga memampat di antara dua garis tren yang saling mendekat, baik pembeli maupun penjual bisa terjebak oleh entry yang terlalu dini.
SOL saat ini sedang menguji hubungan antara zona resistance 102.04–102.10 dan struktur bawah di sekitar 101.96.
Pertanyaan pentingnya bukan:
“Apakah SOL akan breakdown?”
Melainkan pertanyaan yang lebih baik adalah:
“Sisi mana dari struktur yang benar-benar akan mengonfirmasi?”
🎯 Ceklist Trader
Tandai resistance 102.04–102.10
Pantau struktur 101.96
Tunggu konfirmasi
Hargai invalidasi
Pantau level Fibonacci
Hindari mengejar candle
Lindungi modal
🧠 Mini Challenge
Sebelum masuk, tanyakan:
“Apakah aku trading struktur yang sudah terkonfirmasi—atau hanya menebak candle berikutnya?”
— @nayrbryanGaming #TraderMindset #TradingDiscipline #NoFOMO #CryptoMindset #DYOR #PriceAction #SOLUSDT
🔔 Ikuti Binance Square & X saya (@nayrbryanGaming) untuk insight chart harian.
MOTIVASI TRADER / MINI INSIGHT
🧠 Insight Hari Ini
“Jangan memprediksi breakout. Biarkan struktur membuktikannya.”
Mengapa Ini Penting
Saat harga memampat di antara dua garis tren yang saling mendekat, baik pembeli maupun penjual bisa terjebak oleh entry yang terlalu dini.
SOL saat ini sedang menguji hubungan antara zona resistance 102.04–102.10 dan struktur bawah di sekitar 101.96.
Pertanyaan pentingnya bukan:
“Apakah SOL akan breakdown?”
Melainkan pertanyaan yang lebih baik adalah:
“Sisi mana dari struktur yang benar-benar akan mengonfirmasi?”
🎯 Ceklist Trader
Tandai resistance 102.04–102.10
Pantau struktur 101.96
Tunggu konfirmasi
Hargai invalidasi
Pantau level Fibonacci
Hindari mengejar candle
Lindungi modal
🧠 Mini Challenge
Sebelum masuk, tanyakan:
“Apakah aku trading struktur yang sudah terkonfirmasi—atau hanya menebak candle berikutnya?”
— @nayrbryanGaming #TraderMindset #TradingDiscipline #NoFOMO #CryptoMindset #DYOR #PriceAction #SOLUSDT
🔔 Ikuti Binance Square & X saya (@nayrbryanGaming) untuk insight chart harian.
🧠 Insight Hari Ini
“Jangan memprediksi breakout. Biarkan struktur membuktikannya.”
Mengapa Ini Penting
Saat harga memampat di antara dua garis tren yang saling mendekat, baik pembeli maupun penjual bisa terjebak oleh entry yang terlalu dini.
SOL saat ini sedang menguji hubungan antara zona resistance 102.04–102.10 dan struktur bawah di sekitar 101.96.
Pertanyaan pentingnya bukan:
“Apakah SOL akan breakdown?”
Melainkan pertanyaan yang lebih baik adalah:
“Sisi mana dari struktur yang benar-benar akan mengonfirmasi?”
🎯 Ceklist Trader
Tandai resistance 102.04–102.10
Pantau struktur 101.96
Tunggu konfirmasi
Hargai invalidasi
Pantau level Fibonacci
Hindari mengejar candle
Lindungi modal
🧠 Mini Challenge
Sebelum masuk, tanyakan:
“Apakah aku trading struktur yang sudah terkonfirmasi—atau hanya menebak candle berikutnya?”
— @nayrbryanGaming #TraderMindset #TradingDiscipline #NoFOMO #CryptoMindset #DYOR #PriceAction #SOLUSDT
🔔 Ikuti Binance Square & X saya (@nayrbryanGaming) untuk insight chart harian.
46
·
--
Bearish
Lihat terjemahan
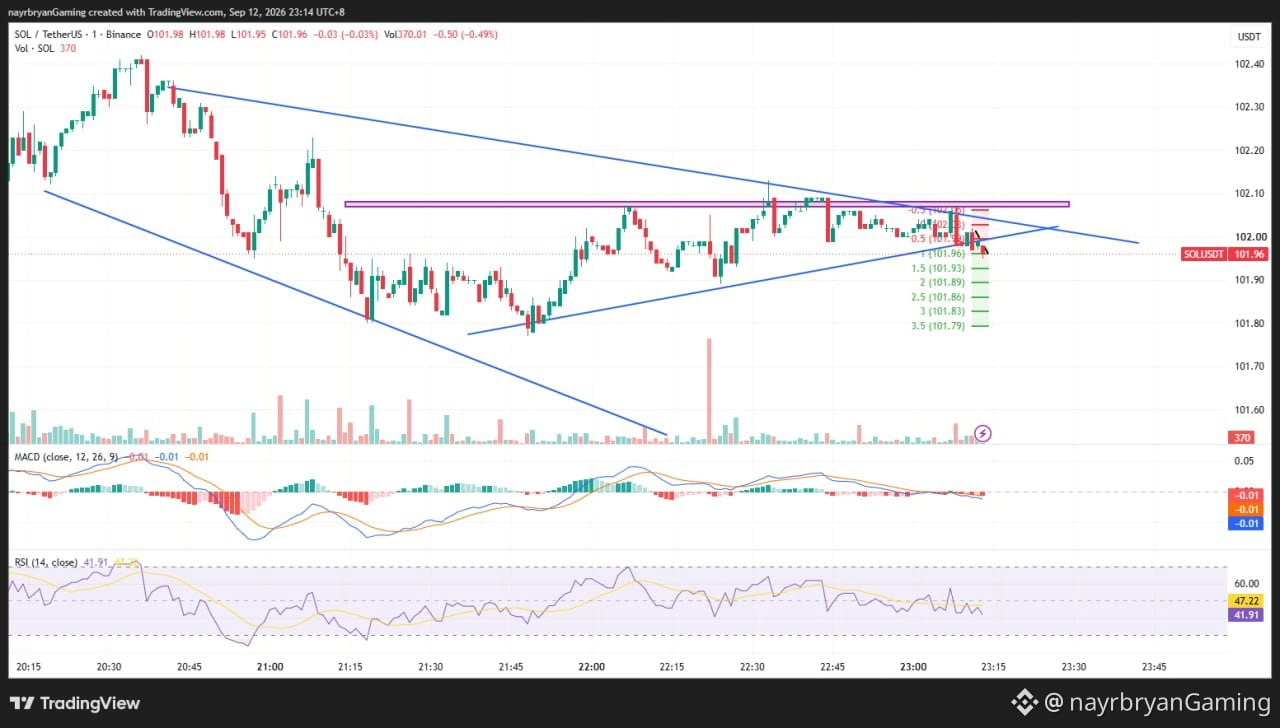
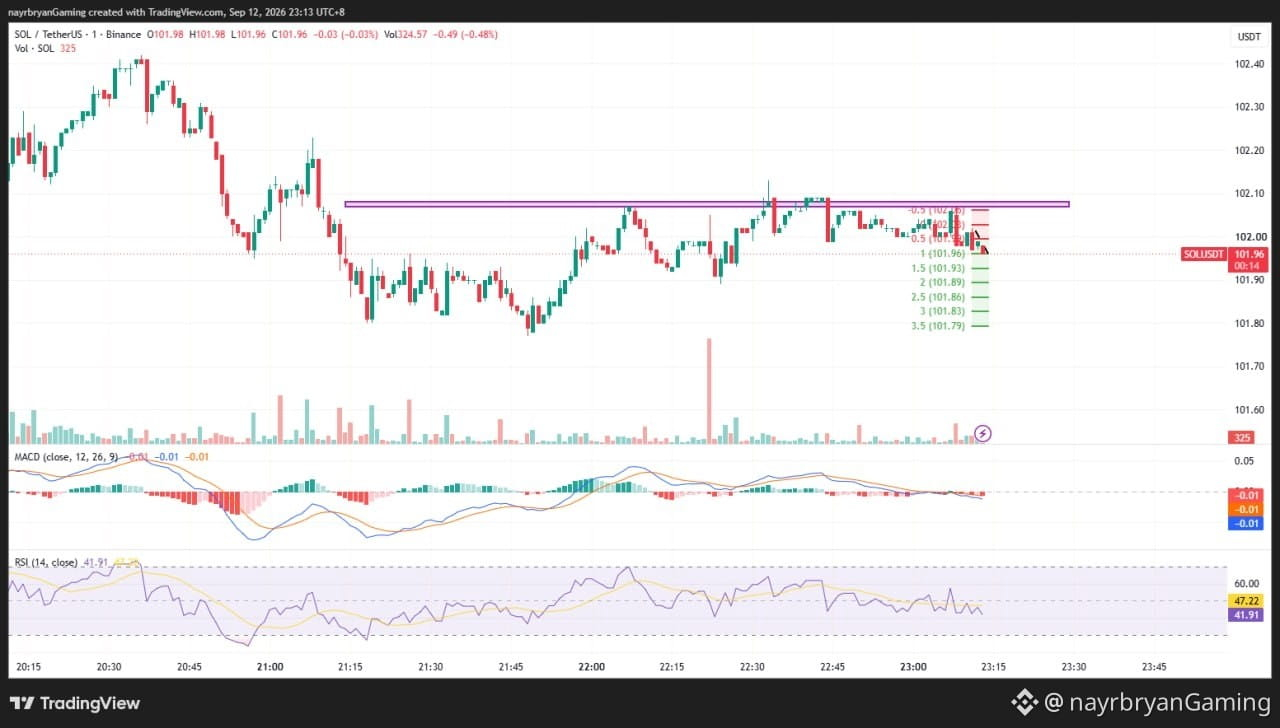
LIGHT ANALYSIS / CHART SETUP — SOL/USDT
📈 Structure Overview
Market phase: Recovery → Compression → Resistance rejection
Converging structure: Lower highs + rising short-term support
Key reaction zone: 102.04 – 102.10
Key Fibonacci reference: 101.96
Downside levels: 101.93 → 101.89 → 101.86 → 101.83 → 101.79
📌 What I’m Watching
Scenario A — Bearish Continuation
If SOL continues rejecting the 102.04–102.10 resistance area and remains below the upper structure, price may rotate toward:
101.93 → 101.89 → 101.86 → 101.83 → 101.79
The first important confirmation area is around 101.96.
Scenario B — Bullish Reclaim
If SOL reclaims 102.04 and successfully breaks through the 102.10 resistance area, the immediate bearish structure weakens.
A sustained breakout would require reassessing the short-term bearish setup.
📊 Indicator Check
MACD: Slightly below zero → bearish momentum remains present
RSI: 41.91 → weak-to-neutral momentum
Price Structure: Converging trendlines + lower highs
Key Confirmation: 101.96 breakdown / 102.10 reclaim
Note: This is a chart framework, not a trade recommendation. Use it to support your own DYOR-based execution plan.
— @nayrbryanGaming #SOLAnalysis #ChartSetup #PriceAction #SmartMoney #Fibonacci #CryptoTrading #DYOR #NFA
LIGHT ANALYSIS / CHART SETUP — SOL/USDT
📈 Structure Overview
Market phase: Recovery → Compression → Resistance rejection
Converging structure: Lower highs + rising short-term support
Key reaction zone: 102.04 – 102.10
Key Fibonacci reference: 101.96
Downside levels: 101.93 → 101.89 → 101.86 → 101.83 → 101.79
📌 What I’m Watching
Scenario A — Bearish Continuation
If SOL continues rejecting the 102.04–102.10 resistance area and remains below the upper structure, price may rotate toward:
101.93 → 101.89 → 101.86 → 101.83 → 101.79
The first important confirmation area is around 101.96.
Scenario B — Bullish Reclaim
If SOL reclaims 102.04 and successfully breaks through the 102.10 resistance area, the immediate bearish structure weakens.
A sustained breakout would require reassessing the short-term bearish setup.
📊 Indicator Check
MACD: Slightly below zero → bearish momentum remains present
RSI: 41.91 → weak-to-neutral momentum
Price Structure: Converging trendlines + lower highs
Key Confirmation: 101.96 breakdown / 102.10 reclaim
Note: This is a chart framework, not a trade recommendation. Use it to support your own DYOR-based execution plan.
— @nayrbryanGaming #SOLAnalysis #ChartSetup #PriceAction #SmartMoney #Fibonacci #CryptoTrading #DYOR #NFA
📈 Structure Overview
Market phase: Recovery → Compression → Resistance rejection
Converging structure: Lower highs + rising short-term support
Key reaction zone: 102.04 – 102.10
Key Fibonacci reference: 101.96
Downside levels: 101.93 → 101.89 → 101.86 → 101.83 → 101.79
📌 What I’m Watching
Scenario A — Bearish Continuation
If SOL continues rejecting the 102.04–102.10 resistance area and remains below the upper structure, price may rotate toward:
101.93 → 101.89 → 101.86 → 101.83 → 101.79
The first important confirmation area is around 101.96.
Scenario B — Bullish Reclaim
If SOL reclaims 102.04 and successfully breaks through the 102.10 resistance area, the immediate bearish structure weakens.
A sustained breakout would require reassessing the short-term bearish setup.
📊 Indicator Check
MACD: Slightly below zero → bearish momentum remains present
RSI: 41.91 → weak-to-neutral momentum
Price Structure: Converging trendlines + lower highs
Key Confirmation: 101.96 breakdown / 102.10 reclaim
Note: This is a chart framework, not a trade recommendation. Use it to support your own DYOR-based execution plan.
— @nayrbryanGaming #SOLAnalysis #ChartSetup #PriceAction #SmartMoney #Fibonacci #CryptoTrading #DYOR #NFA
62
·
--
Bearish
Lihat terjemahan
DAILY SIGNAL — SOL/USDT
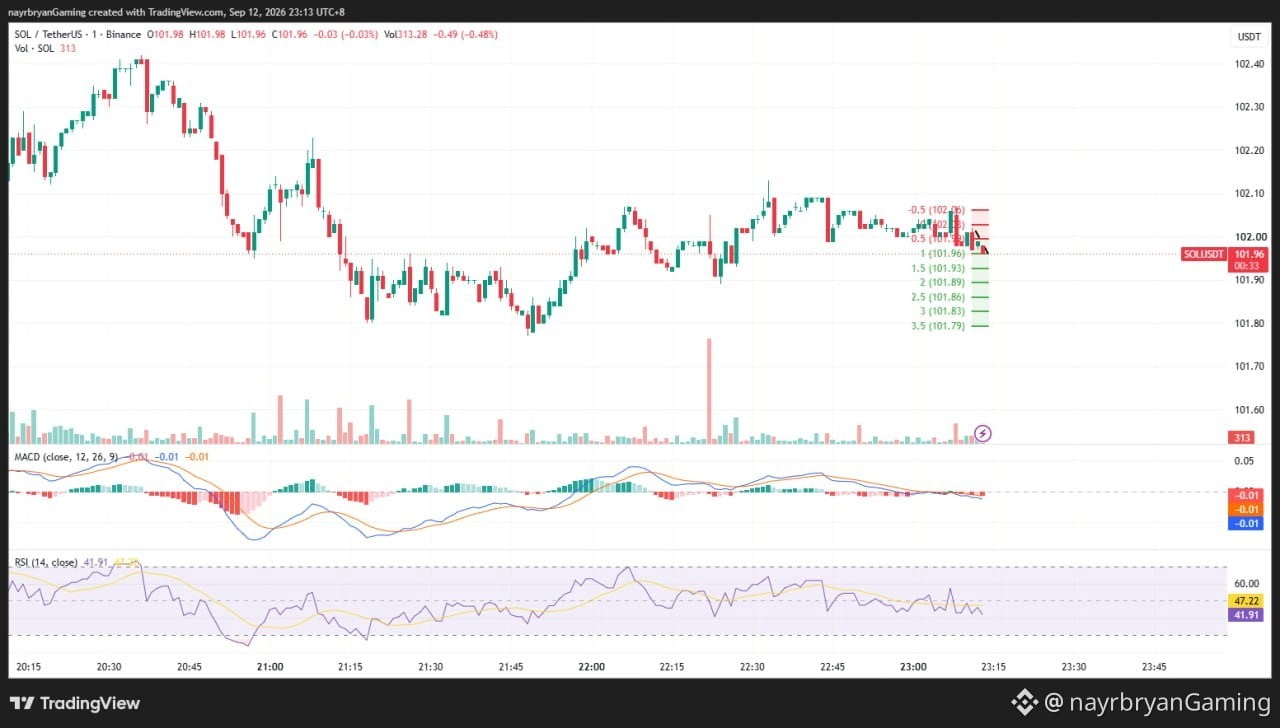
Date: 12 Sep 2026 Timeframe: 1m Intraday Bias: Resistance rejection → bearish continuation
📊 Market Bias
SOL is consolidating inside a tightening structure after recovering from the previous sell-off.
Price recently tested the upper resistance area around 102.04–102.10 and failed to maintain the breakout.
The latest candles are rotating lower toward the lower side of the structure, keeping short-term momentum cautious-to-bearish.
🔹 Key Levels From Chart
Short Reaction Zone: 102.04 → 102.10
Key Resistance: 102.10
Fibonacci Reference: 101.96
Structure Support: 101.93
🎯 Downside Fibonacci Targets
TP1 → 101.93 (1.5 Fib) TP2 → 101.89 (2.0 Fib) TP3 → 101.86 (2.5 Fib) TP4 → 101.83 (3.0 Fib) TP5 → 101.79 (3.5 Fib)
🔺 Bullish Invalidation / Reclaim
A sustained reclaim above the 102.10 resistance area would weaken the immediate bearish continuation scenario.
📈 Technical Breakdown
SOL has formed a series of lower highs after reaching the upper part of the current structure.
The blue trendlines are converging, showing compression as price approaches the apex.
Price rejected the 102.04–102.10 area and is now moving back toward the lower structure.
MACD is slightly negative, while RSI is around 41.91, showing weakening short-term momentum without being deeply oversold.
A continued rejection below the resistance zone followed by a move through 101.96 would favor a rotation toward the marked downside Fibonacci levels.
🧠 Quick Insight
“Compression creates opportunity, but confirmation decides direction.”
⚠️ Disclaimer
This is personal market analysis, not financial advice. This chart framework is for educational purposes only.
Always DYOR / DYODD, manage risk properly, and avoid emotional trading.
— @nayrbryanGaming #SOL #SOLUSDT #Crypto #Trading #TechnicalAnalysis #PriceAction #Fibonacci #Binance #DYOR #NFA #NoFOMO
DAILY SIGNAL — SOL/USDT
Date: 12 Sep 2026 Timeframe: 1m Intraday Bias: Resistance rejection → bearish continuation
📊 Market Bias
SOL is consolidating inside a tightening structure after recovering from the previous sell-off.
Price recently tested the upper resistance area around 102.04–102.10 and failed to maintain the breakout.
The latest candles are rotating lower toward the lower side of the structure, keeping short-term momentum cautious-to-bearish.
🔹 Key Levels From Chart
Short Reaction Zone: 102.04 → 102.10
Key Resistance: 102.10
Fibonacci Reference: 101.96
Structure Support: 101.93
🎯 Downside Fibonacci Targets
TP1 → 101.93 (1.5 Fib) TP2 → 101.89 (2.0 Fib) TP3 → 101.86 (2.5 Fib) TP4 → 101.83 (3.0 Fib) TP5 → 101.79 (3.5 Fib)
🔺 Bullish Invalidation / Reclaim
A sustained reclaim above the 102.10 resistance area would weaken the immediate bearish continuation scenario.
📈 Technical Breakdown
SOL has formed a series of lower highs after reaching the upper part of the current structure.
The blue trendlines are converging, showing compression as price approaches the apex.
Price rejected the 102.04–102.10 area and is now moving back toward the lower structure.
MACD is slightly negative, while RSI is around 41.91, showing weakening short-term momentum without being deeply oversold.
A continued rejection below the resistance zone followed by a move through 101.96 would favor a rotation toward the marked downside Fibonacci levels.
🧠 Quick Insight
“Compression creates opportunity, but confirmation decides direction.”
⚠️ Disclaimer
This is personal market analysis, not financial advice. This chart framework is for educational purposes only.
Always DYOR / DYODD, manage risk properly, and avoid emotional trading.
— @nayrbryanGaming #SOL #SOLUSDT #Crypto #Trading #TechnicalAnalysis #PriceAction #Fibonacci #Binance #DYOR #NFA #NoFOMO
Date: 12 Sep 2026 Timeframe: 1m Intraday Bias: Resistance rejection → bearish continuation
📊 Market Bias
SOL is consolidating inside a tightening structure after recovering from the previous sell-off.
Price recently tested the upper resistance area around 102.04–102.10 and failed to maintain the breakout.
The latest candles are rotating lower toward the lower side of the structure, keeping short-term momentum cautious-to-bearish.
🔹 Key Levels From Chart
Short Reaction Zone: 102.04 → 102.10
Key Resistance: 102.10
Fibonacci Reference: 101.96
Structure Support: 101.93
🎯 Downside Fibonacci Targets
TP1 → 101.93 (1.5 Fib) TP2 → 101.89 (2.0 Fib) TP3 → 101.86 (2.5 Fib) TP4 → 101.83 (3.0 Fib) TP5 → 101.79 (3.5 Fib)
🔺 Bullish Invalidation / Reclaim
A sustained reclaim above the 102.10 resistance area would weaken the immediate bearish continuation scenario.
📈 Technical Breakdown
SOL has formed a series of lower highs after reaching the upper part of the current structure.
The blue trendlines are converging, showing compression as price approaches the apex.
Price rejected the 102.04–102.10 area and is now moving back toward the lower structure.
MACD is slightly negative, while RSI is around 41.91, showing weakening short-term momentum without being deeply oversold.
A continued rejection below the resistance zone followed by a move through 101.96 would favor a rotation toward the marked downside Fibonacci levels.
🧠 Quick Insight
“Compression creates opportunity, but confirmation decides direction.”
⚠️ Disclaimer
This is personal market analysis, not financial advice. This chart framework is for educational purposes only.
Always DYOR / DYODD, manage risk properly, and avoid emotional trading.
— @nayrbryanGaming #SOL #SOLUSDT #Crypto #Trading #TechnicalAnalysis #PriceAction #Fibonacci #Binance #DYOR #NFA #NoFOMO
1
134
·
--
Bullish
MOTIVASI TRADER / MINI INSIGHT
🧠 Insight Hari Ini
“Konfirmasi lebih berharga daripada prediksi.”
Mengapa Ini Penting
Satu candle yang kuat bisa terlihat meyakinkan, tapi satu candle tidak mendefinisikan keseluruhan struktur.
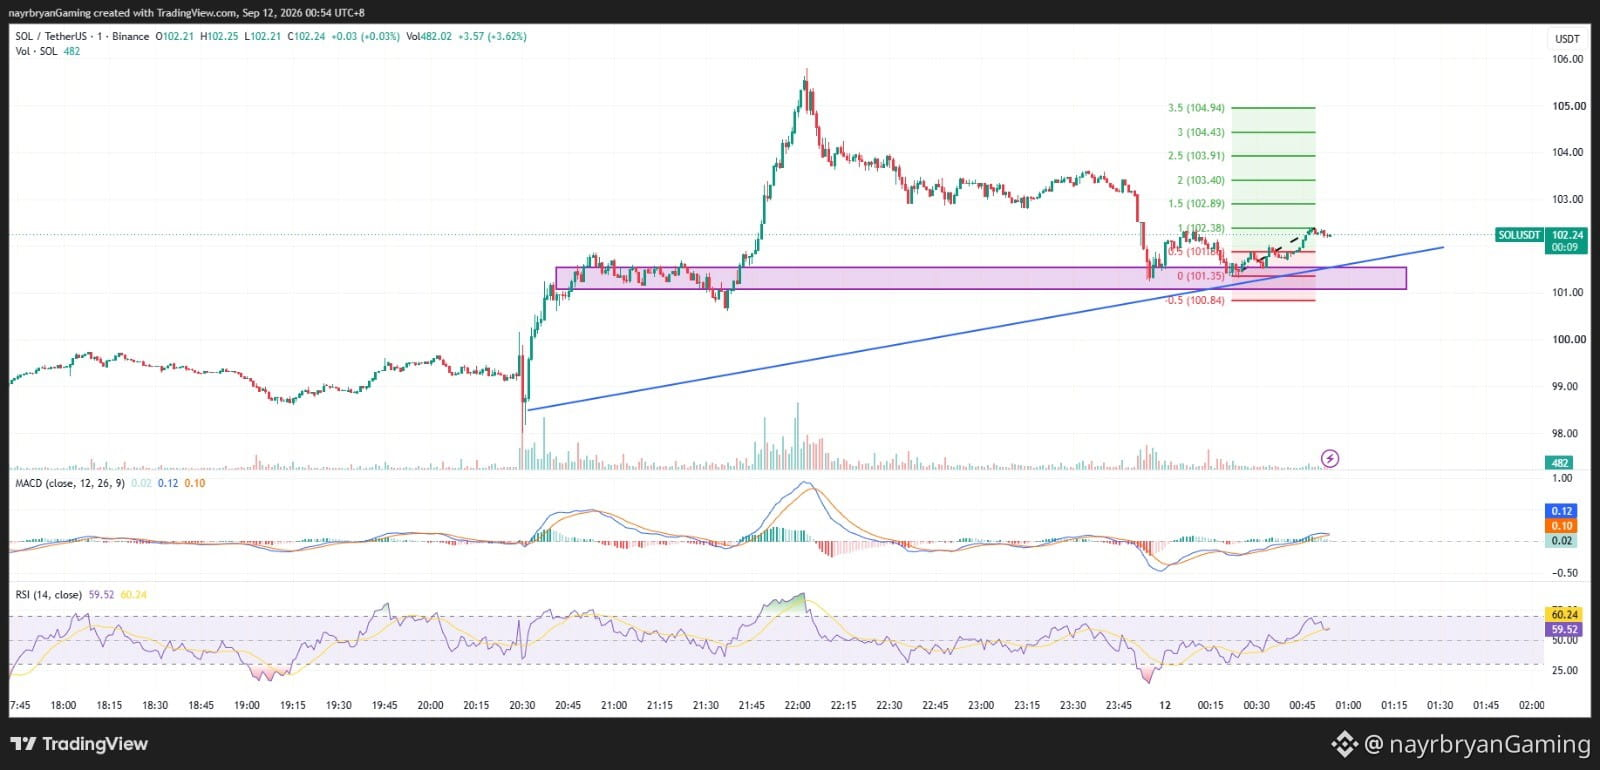
SOL telah pulih dari zona bawah dan kini sedang menguji level Fibonacci berikutnya di sekitar 102.38.
Pendekatan yang lebih baik adalah memperhatikan bagaimana harga bereaksi di sekitar level-level penting, bukan mengejar momentum.
Eksekusi yang cerdas berfokus pada:
• Struktur • Konfirmasi • Retest • Invalidation • Kontrol risiko
🎯 Daftar Periksa Trader
Tandai zona support 101.18–101.35
Pantau level 102.38
Tunggu konfirmasi
Patuhi invalidasi struktur
Hindari mengejar candle yang sudah memanjang
Lindungi modal
🧠 Mini Challenge
Sebelum masuk, tanyakan:
“Apakah struktur sudah mengonfirmasi pergerakan — atau aku hanya bereaksi terhadap momentum?”
— @nayrbryanGaming #TraderMindset #TradingDiscipline #NoFOMO #CryptoMindset #DYOR #PriceAction #SOLUSDT
🔔 Ikuti Binance Square & X saya (@nayrbryanGaming) untuk insight grafik harian.
MOTIVASI TRADER / MINI INSIGHT
🧠 Insight Hari Ini
“Konfirmasi lebih berharga daripada prediksi.”
Mengapa Ini Penting
Satu candle yang kuat bisa terlihat meyakinkan, tapi satu candle tidak mendefinisikan keseluruhan struktur.
SOL telah pulih dari zona bawah dan kini sedang menguji level Fibonacci berikutnya di sekitar 102.38.
Pendekatan yang lebih baik adalah memperhatikan bagaimana harga bereaksi di sekitar level-level penting, bukan mengejar momentum.
Eksekusi yang cerdas berfokus pada:
• Struktur • Konfirmasi • Retest • Invalidation • Kontrol risiko
🎯 Daftar Periksa Trader
Tandai zona support 101.18–101.35
Pantau level 102.38
Tunggu konfirmasi
Patuhi invalidasi struktur
Hindari mengejar candle yang sudah memanjang
Lindungi modal
🧠 Mini Challenge
Sebelum masuk, tanyakan:
“Apakah struktur sudah mengonfirmasi pergerakan — atau aku hanya bereaksi terhadap momentum?”
— @nayrbryanGaming #TraderMindset #TradingDiscipline #NoFOMO #CryptoMindset #DYOR #PriceAction #SOLUSDT
🔔 Ikuti Binance Square & X saya (@nayrbryanGaming) untuk insight grafik harian.
🧠 Insight Hari Ini
“Konfirmasi lebih berharga daripada prediksi.”
Mengapa Ini Penting
Satu candle yang kuat bisa terlihat meyakinkan, tapi satu candle tidak mendefinisikan keseluruhan struktur.
SOL telah pulih dari zona bawah dan kini sedang menguji level Fibonacci berikutnya di sekitar 102.38.
Pendekatan yang lebih baik adalah memperhatikan bagaimana harga bereaksi di sekitar level-level penting, bukan mengejar momentum.
Eksekusi yang cerdas berfokus pada:
• Struktur • Konfirmasi • Retest • Invalidation • Kontrol risiko
🎯 Daftar Periksa Trader
Tandai zona support 101.18–101.35
Pantau level 102.38
Tunggu konfirmasi
Patuhi invalidasi struktur
Hindari mengejar candle yang sudah memanjang
Lindungi modal
🧠 Mini Challenge
Sebelum masuk, tanyakan:
“Apakah struktur sudah mengonfirmasi pergerakan — atau aku hanya bereaksi terhadap momentum?”
— @nayrbryanGaming #TraderMindset #TradingDiscipline #NoFOMO #CryptoMindset #DYOR #PriceAction #SOLUSDT
🔔 Ikuti Binance Square & X saya (@nayrbryanGaming) untuk insight grafik harian.
48
·
--
Bullish
ANALISIS LIGHT / PENGATURAN GRAFIK — SOL/USDT
📈 Gambaran Struktur
Fase pasar: Sharp sell-off (jual tajam) → pembentukan base → pemulihan → upaya kelanjutan bullish
Dukungan utama: 101.18 – 101.35
Resistensi Fibonacci saat ini: 102.38
Level upside berikutnya: 102.89 → 103.40 → 103.91 → 104.43 → 104.94
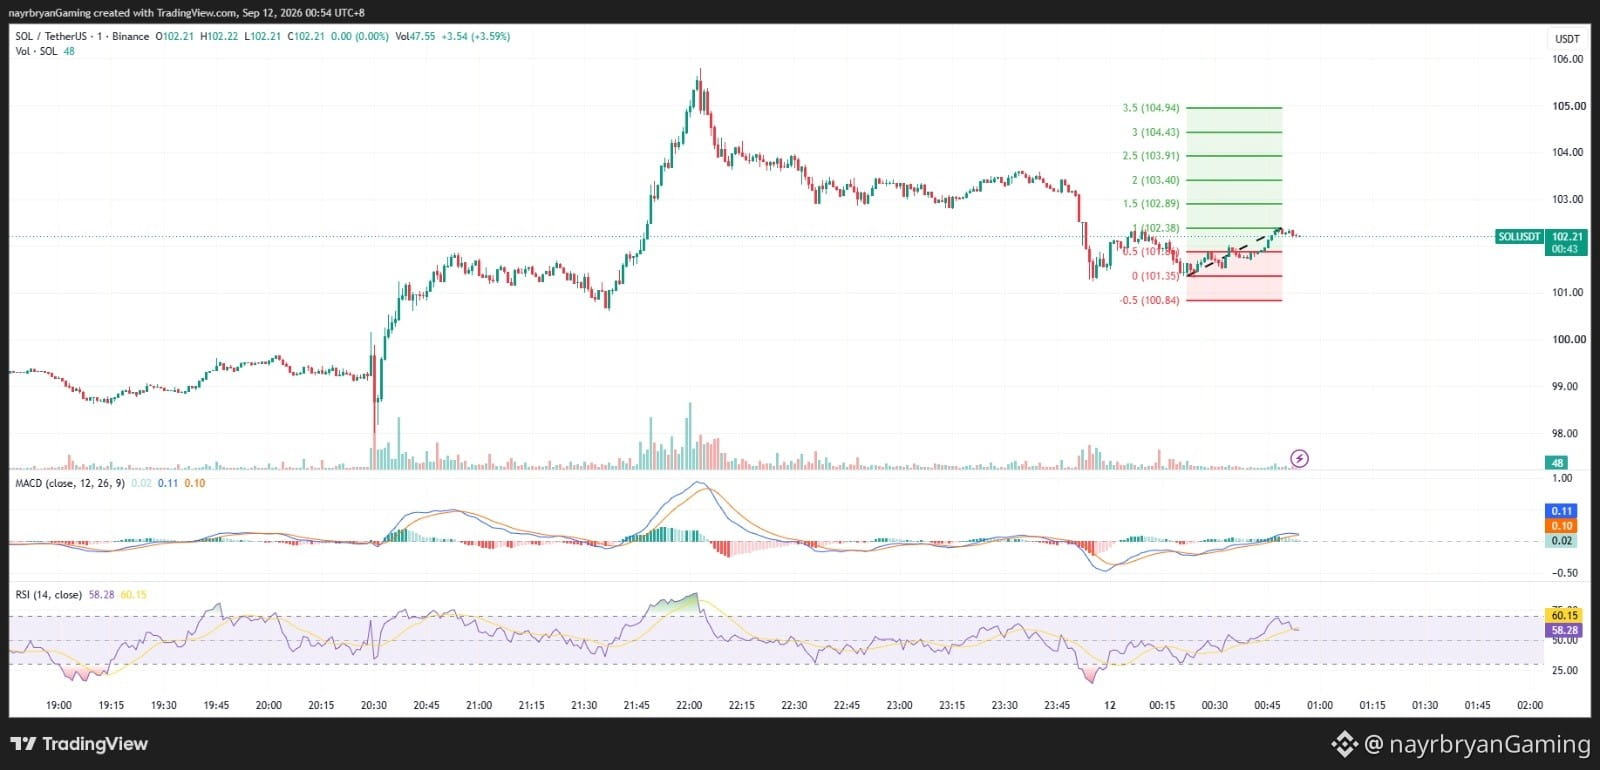
Referensi downside utama: 100.84
📌 Yang Saya Pantau
Skenario A — Kelanjutan Bullish
Jika SOL mempertahankan struktur pemulihan saat ini dan bertahan di atas 101.35, harga dapat terus berputar menuju:
102.38 → 102.89 → 103.40 → 103.91 → 104.43 → 104.94
Pergerakan yang bertahan menembus 102.38 akan memberikan konfirmasi yang lebih kuat untuk kelanjutan ke atas.
Skenario B — Kegagalan Dukungan
Jika SOL kehilangan zona struktur 101.18–101.35, setup bullish saat ini melemah.
Referensi Fibonacci downside yang ditandai pada chart adalah:
100.84
Jika struktur bawah ditembus, akan diperlukan penilaian ulang terhadap tesis kelanjutan bullish saat ini.
📊 Cek Indikator
MACD: Positif → momentum jangka pendek membaik
RSI: 59.52 → condong bullish, tidak dalam kondisi overbought yang dalam
Struktur Harga: Pemulihan + struktur dukungan yang lebih tinggi
Konfirmasi Kunci: bertahan di 101.35 / reclaim 102.38
Catatan: Ini adalah kerangka chart, bukan rekomendasi trading. Gunakan ini untuk mendukung rencana eksekusi Anda sendiri berbasis DYOR.
— @nayrbryanGaming #SOLAnalysis #ChartSetup #PriceAction #SmartMoney #Fibonacci #CryptoTrading #DYOR #NFA
ANALISIS LIGHT / PENGATURAN GRAFIK — SOL/USDT
📈 Gambaran Struktur
Fase pasar: Sharp sell-off (jual tajam) → pembentukan base → pemulihan → upaya kelanjutan bullish
Dukungan utama: 101.18 – 101.35
Resistensi Fibonacci saat ini: 102.38
Level upside berikutnya: 102.89 → 103.40 → 103.91 → 104.43 → 104.94
Referensi downside utama: 100.84
📌 Yang Saya Pantau
Skenario A — Kelanjutan Bullish
Jika SOL mempertahankan struktur pemulihan saat ini dan bertahan di atas 101.35, harga dapat terus berputar menuju:
102.38 → 102.89 → 103.40 → 103.91 → 104.43 → 104.94
Pergerakan yang bertahan menembus 102.38 akan memberikan konfirmasi yang lebih kuat untuk kelanjutan ke atas.
Skenario B — Kegagalan Dukungan
Jika SOL kehilangan zona struktur 101.18–101.35, setup bullish saat ini melemah.
Referensi Fibonacci downside yang ditandai pada chart adalah:
100.84
Jika struktur bawah ditembus, akan diperlukan penilaian ulang terhadap tesis kelanjutan bullish saat ini.
📊 Cek Indikator
MACD: Positif → momentum jangka pendek membaik
RSI: 59.52 → condong bullish, tidak dalam kondisi overbought yang dalam
Struktur Harga: Pemulihan + struktur dukungan yang lebih tinggi
Konfirmasi Kunci: bertahan di 101.35 / reclaim 102.38
Catatan: Ini adalah kerangka chart, bukan rekomendasi trading. Gunakan ini untuk mendukung rencana eksekusi Anda sendiri berbasis DYOR.
— @nayrbryanGaming #SOLAnalysis #ChartSetup #PriceAction #SmartMoney #Fibonacci #CryptoTrading #DYOR #NFA
📈 Gambaran Struktur
Fase pasar: Sharp sell-off (jual tajam) → pembentukan base → pemulihan → upaya kelanjutan bullish
Dukungan utama: 101.18 – 101.35
Resistensi Fibonacci saat ini: 102.38
Level upside berikutnya: 102.89 → 103.40 → 103.91 → 104.43 → 104.94
Referensi downside utama: 100.84
📌 Yang Saya Pantau
Skenario A — Kelanjutan Bullish
Jika SOL mempertahankan struktur pemulihan saat ini dan bertahan di atas 101.35, harga dapat terus berputar menuju:
102.38 → 102.89 → 103.40 → 103.91 → 104.43 → 104.94
Pergerakan yang bertahan menembus 102.38 akan memberikan konfirmasi yang lebih kuat untuk kelanjutan ke atas.
Skenario B — Kegagalan Dukungan
Jika SOL kehilangan zona struktur 101.18–101.35, setup bullish saat ini melemah.
Referensi Fibonacci downside yang ditandai pada chart adalah:
100.84
Jika struktur bawah ditembus, akan diperlukan penilaian ulang terhadap tesis kelanjutan bullish saat ini.
📊 Cek Indikator
MACD: Positif → momentum jangka pendek membaik
RSI: 59.52 → condong bullish, tidak dalam kondisi overbought yang dalam
Struktur Harga: Pemulihan + struktur dukungan yang lebih tinggi
Konfirmasi Kunci: bertahan di 101.35 / reclaim 102.38
Catatan: Ini adalah kerangka chart, bukan rekomendasi trading. Gunakan ini untuk mendukung rencana eksekusi Anda sendiri berbasis DYOR.
— @nayrbryanGaming #SOLAnalysis #ChartSetup #PriceAction #SmartMoney #Fibonacci #CryptoTrading #DYOR #NFA
53
·
--
Bullish
Lihat terjemahan
DAILY SIGNAL — SOL/USDT
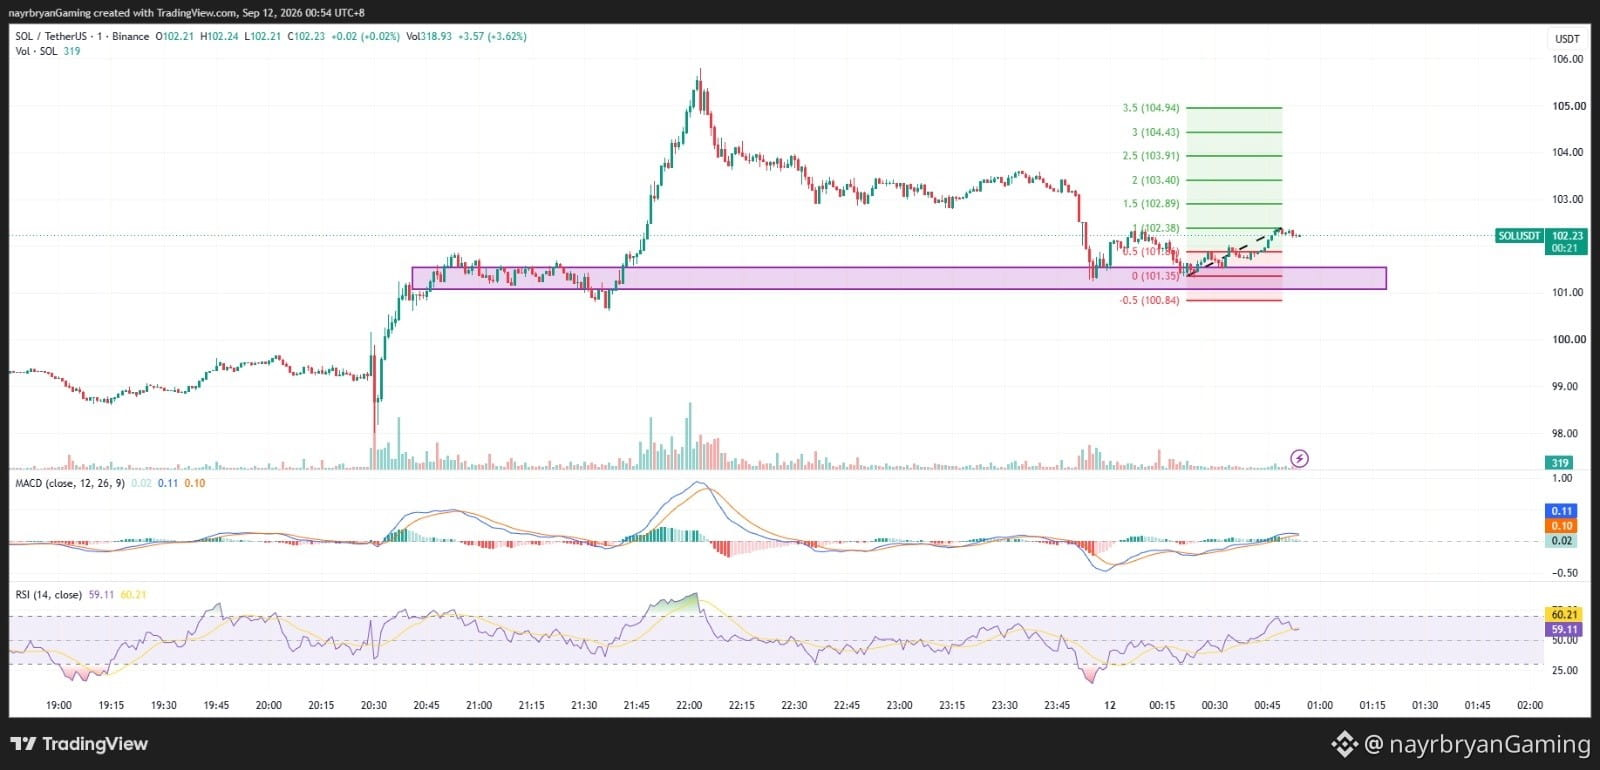
Date: 12 Sep 2026 Timeframe: 1m Intraday Bias: Support reaction → bullish continuation
📊 Market Bias
SOL has recovered from the recent sell-off and is now trading above the 101.35 Fibonacci 0 level.
Price is holding around 102.24, while the previous structure zone around 101.35 continues to act as an important support area.
The recent recovery has pushed price back above the 101.18–101.35 area, with momentum improving toward the next Fibonacci levels.
🔹 Key Levels From Chart
Key Support Zone: 101.18 → 101.35
Fibonacci 0: 101.35
Key Reclaim / Mid Level: 101.18
Current Price: 102.24
🎯 Upside Fibonacci Targets
TP1 → 102.38 (1.0 Fib) TP2 → 102.89 (1.5 Fib) TP3 → 103.40 (2.0 Fib) TP4 → 103.91 (2.5 Fib) TP5 → 104.43 (3.0 Fib) TP6 → 104.94 (3.5 Fib)
🔻 Downside Reference
If the current structure fails, the chart marks:
100.84 (-0.5 Fib)
A sustained move below the 101.18–101.35 support area would weaken the bullish continuation scenario.
📈 Technical Breakdown
SOL previously established a strong base around the 101.00–101.35 region after the sharp rejection from higher levels.
Price then recovered and reclaimed the Fibonacci 0 level at 101.35.
The current price around 102.24 is approaching the marked 102.38 Fibonacci target.
MACD is positive and turning upward, while RSI is around 59.52, showing improving momentum without being deeply overbought.
The key observation is whether buyers can maintain price above the 101.35 structure.
A sustained reclaim of 102.38 would strengthen the continuation case toward:
102.89 → 103.40 → 103.91
🧠 Quick Insight
“After a strong recovery, the retest often tells you whether the breakout has real structure behind it.”
⚠️ Disclaimer
This is personal market analysis, not financial advice. This chart framework is for educational purposes only.
Always DYOR / DYODD, manage risk properly, and avoid emotional trading.
— @nayrbryanGaming #SOL #SOLUSDT #Crypto #Trading #TechnicalAnalysis #PriceAction #Fibonacci #Binance #DYOR #NFA #NoFOMO
DAILY SIGNAL — SOL/USDT
Date: 12 Sep 2026 Timeframe: 1m Intraday Bias: Support reaction → bullish continuation
📊 Market Bias
SOL has recovered from the recent sell-off and is now trading above the 101.35 Fibonacci 0 level.
Price is holding around 102.24, while the previous structure zone around 101.35 continues to act as an important support area.
The recent recovery has pushed price back above the 101.18–101.35 area, with momentum improving toward the next Fibonacci levels.
🔹 Key Levels From Chart
Key Support Zone: 101.18 → 101.35
Fibonacci 0: 101.35
Key Reclaim / Mid Level: 101.18
Current Price: 102.24
🎯 Upside Fibonacci Targets
TP1 → 102.38 (1.0 Fib) TP2 → 102.89 (1.5 Fib) TP3 → 103.40 (2.0 Fib) TP4 → 103.91 (2.5 Fib) TP5 → 104.43 (3.0 Fib) TP6 → 104.94 (3.5 Fib)
🔻 Downside Reference
If the current structure fails, the chart marks:
100.84 (-0.5 Fib)
A sustained move below the 101.18–101.35 support area would weaken the bullish continuation scenario.
📈 Technical Breakdown
SOL previously established a strong base around the 101.00–101.35 region after the sharp rejection from higher levels.
Price then recovered and reclaimed the Fibonacci 0 level at 101.35.
The current price around 102.24 is approaching the marked 102.38 Fibonacci target.
MACD is positive and turning upward, while RSI is around 59.52, showing improving momentum without being deeply overbought.
The key observation is whether buyers can maintain price above the 101.35 structure.
A sustained reclaim of 102.38 would strengthen the continuation case toward:
102.89 → 103.40 → 103.91
🧠 Quick Insight
“After a strong recovery, the retest often tells you whether the breakout has real structure behind it.”
⚠️ Disclaimer
This is personal market analysis, not financial advice. This chart framework is for educational purposes only.
Always DYOR / DYODD, manage risk properly, and avoid emotional trading.
— @nayrbryanGaming #SOL #SOLUSDT #Crypto #Trading #TechnicalAnalysis #PriceAction #Fibonacci #Binance #DYOR #NFA #NoFOMO
Date: 12 Sep 2026 Timeframe: 1m Intraday Bias: Support reaction → bullish continuation
📊 Market Bias
SOL has recovered from the recent sell-off and is now trading above the 101.35 Fibonacci 0 level.
Price is holding around 102.24, while the previous structure zone around 101.35 continues to act as an important support area.
The recent recovery has pushed price back above the 101.18–101.35 area, with momentum improving toward the next Fibonacci levels.
🔹 Key Levels From Chart
Key Support Zone: 101.18 → 101.35
Fibonacci 0: 101.35
Key Reclaim / Mid Level: 101.18
Current Price: 102.24
🎯 Upside Fibonacci Targets
TP1 → 102.38 (1.0 Fib) TP2 → 102.89 (1.5 Fib) TP3 → 103.40 (2.0 Fib) TP4 → 103.91 (2.5 Fib) TP5 → 104.43 (3.0 Fib) TP6 → 104.94 (3.5 Fib)
🔻 Downside Reference
If the current structure fails, the chart marks:
100.84 (-0.5 Fib)
A sustained move below the 101.18–101.35 support area would weaken the bullish continuation scenario.
📈 Technical Breakdown
SOL previously established a strong base around the 101.00–101.35 region after the sharp rejection from higher levels.
Price then recovered and reclaimed the Fibonacci 0 level at 101.35.
The current price around 102.24 is approaching the marked 102.38 Fibonacci target.
MACD is positive and turning upward, while RSI is around 59.52, showing improving momentum without being deeply overbought.
The key observation is whether buyers can maintain price above the 101.35 structure.
A sustained reclaim of 102.38 would strengthen the continuation case toward:
102.89 → 103.40 → 103.91
🧠 Quick Insight
“After a strong recovery, the retest often tells you whether the breakout has real structure behind it.”
⚠️ Disclaimer
This is personal market analysis, not financial advice. This chart framework is for educational purposes only.
Always DYOR / DYODD, manage risk properly, and avoid emotional trading.
— @nayrbryanGaming #SOL #SOLUSDT #Crypto #Trading #TechnicalAnalysis #PriceAction #Fibonacci #Binance #DYOR #NFA #NoFOMO
134
·
--
Bullish
MOTIVASI TRADER / MINI INSIGHT
🧠 Insight Hari Ini
“Kesabaran dimulai saat level kunci Anda dimulai.”
Mengapa Ini Penting
Setelah pemulihan yang kuat, harga dapat kembali menguji struktur sebelumnya sebelum menentukan arah berikutnya.
SOL saat ini sedang menguji zona 99.68–99.90.
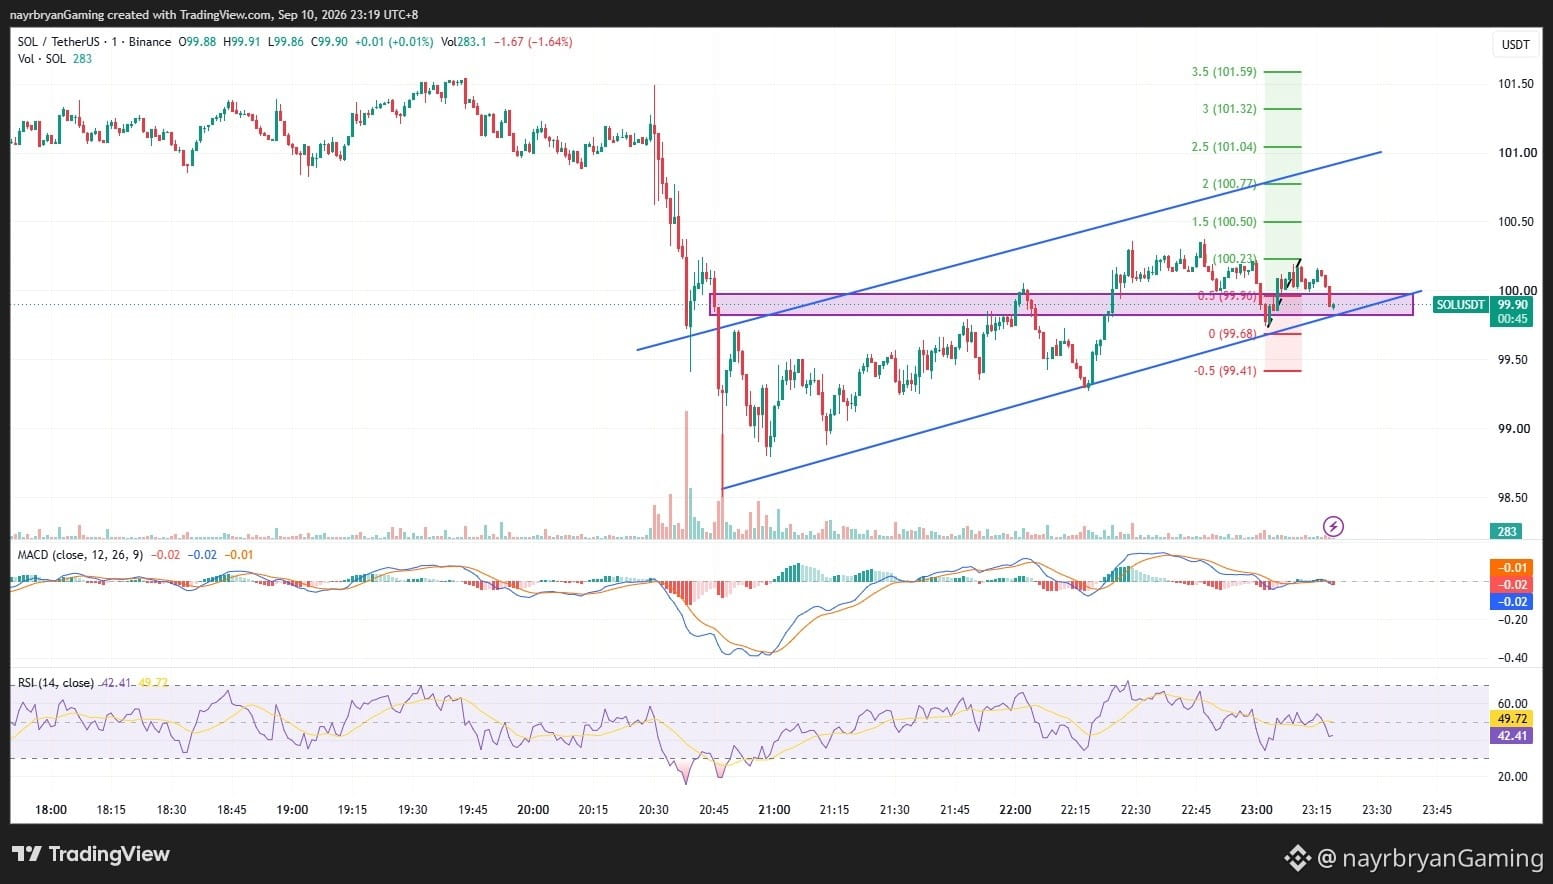
Daripada mengejar setiap candle, fokus pada reaksi di sekitar level.
Eksekusi yang cerdas berarti memperhatikan:
• Reaksi pada support • Konfirmasi struktur • Reclaim resistance • Invalidasi • Kontrol risiko
🎯 Checklist Trader
Tandai zona 99.68–99.90
Tunggu konfirmasi
Perhatikan resistance 100.22
Hormati support struktur 99.68
Pantau 99.41 jika support gagal
Hindari entry yang emosional
Lindungi modal
🧠 Mini Challenge
Sebelum masuk, tanyakan:
“Apakah saya mengikuti struktur yang sudah terkonfirmasi — atau hanya bereaksi terhadap candle terakhir?”
— @nayrbryanGaming #TraderMindset #TradingDiscipline #NoFOMO #CryptoMindset #DYOR #PriceAction #SOLUSDT
🔔 Ikuti Binance Square saya & X (@nayrbryanGaming) untuk insight chart harian.
MOTIVASI TRADER / MINI INSIGHT
🧠 Insight Hari Ini
“Kesabaran dimulai saat level kunci Anda dimulai.”
Mengapa Ini Penting
Setelah pemulihan yang kuat, harga dapat kembali menguji struktur sebelumnya sebelum menentukan arah berikutnya.
SOL saat ini sedang menguji zona 99.68–99.90.
Daripada mengejar setiap candle, fokus pada reaksi di sekitar level.
Eksekusi yang cerdas berarti memperhatikan:
• Reaksi pada support • Konfirmasi struktur • Reclaim resistance • Invalidasi • Kontrol risiko
🎯 Checklist Trader
Tandai zona 99.68–99.90
Tunggu konfirmasi
Perhatikan resistance 100.22
Hormati support struktur 99.68
Pantau 99.41 jika support gagal
Hindari entry yang emosional
Lindungi modal
🧠 Mini Challenge
Sebelum masuk, tanyakan:
“Apakah saya mengikuti struktur yang sudah terkonfirmasi — atau hanya bereaksi terhadap candle terakhir?”
— @nayrbryanGaming #TraderMindset #TradingDiscipline #NoFOMO #CryptoMindset #DYOR #PriceAction #SOLUSDT
🔔 Ikuti Binance Square saya & X (@nayrbryanGaming) untuk insight chart harian.
🧠 Insight Hari Ini
“Kesabaran dimulai saat level kunci Anda dimulai.”
Mengapa Ini Penting
Setelah pemulihan yang kuat, harga dapat kembali menguji struktur sebelumnya sebelum menentukan arah berikutnya.
SOL saat ini sedang menguji zona 99.68–99.90.
Daripada mengejar setiap candle, fokus pada reaksi di sekitar level.
Eksekusi yang cerdas berarti memperhatikan:
• Reaksi pada support • Konfirmasi struktur • Reclaim resistance • Invalidasi • Kontrol risiko
🎯 Checklist Trader
Tandai zona 99.68–99.90
Tunggu konfirmasi
Perhatikan resistance 100.22
Hormati support struktur 99.68
Pantau 99.41 jika support gagal
Hindari entry yang emosional
Lindungi modal
🧠 Mini Challenge
Sebelum masuk, tanyakan:
“Apakah saya mengikuti struktur yang sudah terkonfirmasi — atau hanya bereaksi terhadap candle terakhir?”
— @nayrbryanGaming #TraderMindset #TradingDiscipline #NoFOMO #CryptoMindset #DYOR #PriceAction #SOLUSDT
🔔 Ikuti Binance Square saya & X (@nayrbryanGaming) untuk insight chart harian.
46
·
--
Bullish
Lihat terjemahan
LIGHT ANALYSIS / CHART SETUP — SOL/USDT
📈 Structure Overview
Market phase: Sharp sell-off → Recovery → Ascending-channel consolidation
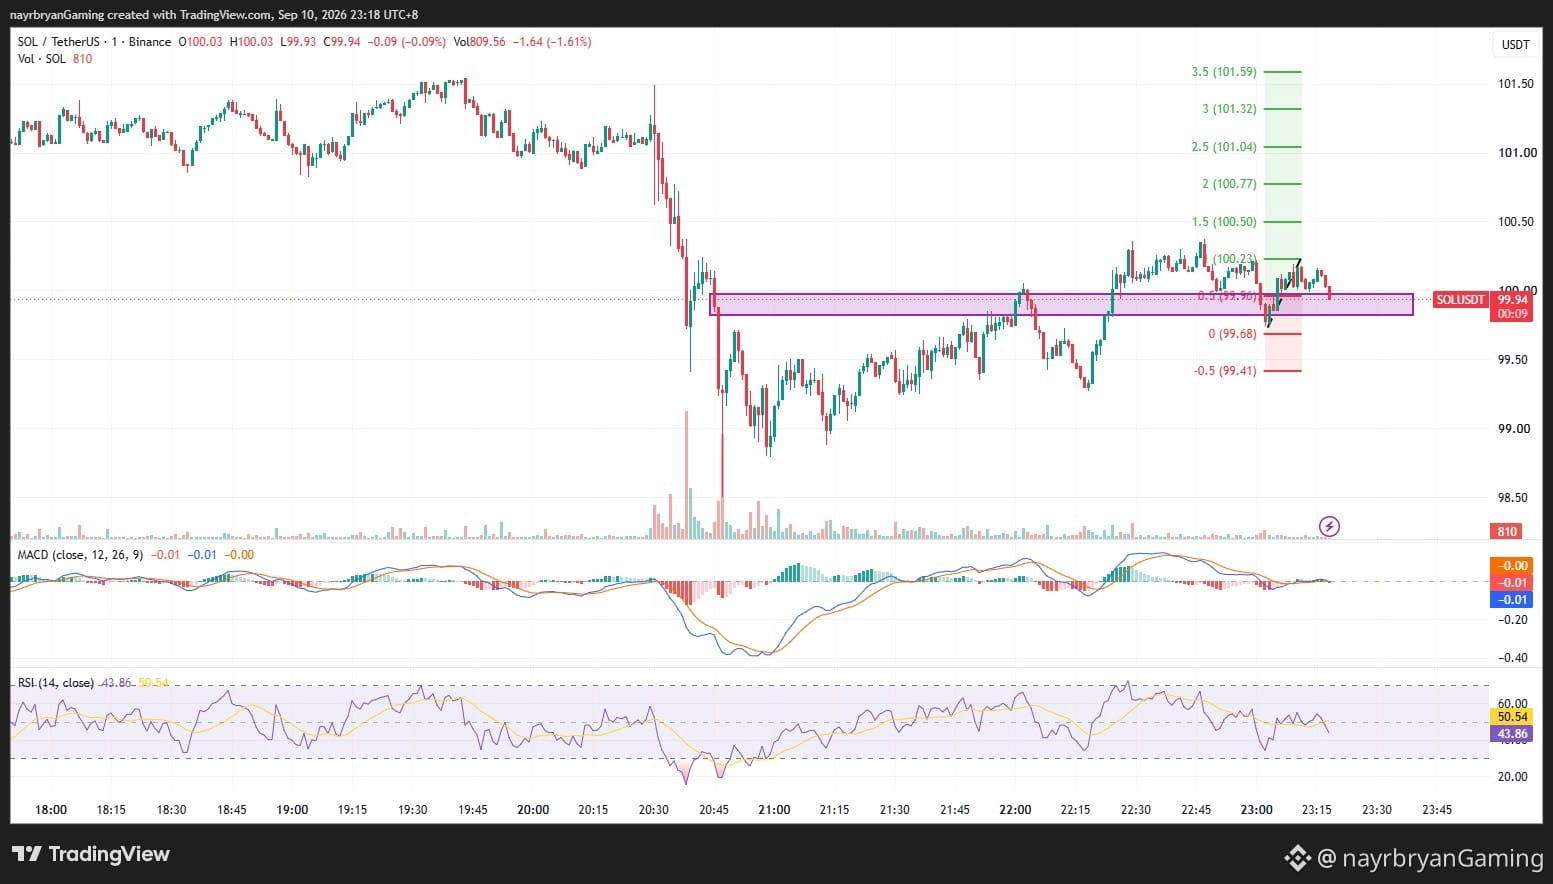
Current structure: Higher lows + rising channel support
Key reaction zone: 99.68 – 99.90
First upside resistance: 100.22
Major upside levels: 100.50 → 100.77 → 101.04 → 101.32 → 101.59
Structure failure level: 99.41
📌 What I’m Watching
Scenario A — Bullish Continuation
If SOL holds the 99.68–99.90 zone and buyers regain control, price may rotate toward:
100.22 → 100.50 → 100.77 → 101.04 → 101.32 → 101.59
A sustained move above 100.22 would provide stronger continuation confirmation.
Scenario B — Support Failure
If SOL loses 99.68, the current bullish structure becomes weaker.
The next marked downside Fibonacci level is:
99.41
A sustained break below the support structure would require reassessing the ascending-channel setup.
📊 Indicator Check
MACD: Near zero → momentum is mixed
RSI: 42.41 → weak-to-neutral momentum
Price Structure: Ascending channel + support retest
Key Confirmation: 99.68 hold / 100.22 reclaim
Note: This is a chart framework, not a trade recommendation. Use it to support your own DYOR-based execution plan.
— @nayrbryanGaming #SOLAnalysis #ChartSetup #PriceAction #SmartMoney #Fibonacci #CryptoTrading #DYOR #NFA
LIGHT ANALYSIS / CHART SETUP — SOL/USDT
📈 Structure Overview
Market phase: Sharp sell-off → Recovery → Ascending-channel consolidation
Current structure: Higher lows + rising channel support
Key reaction zone: 99.68 – 99.90
First upside resistance: 100.22
Major upside levels: 100.50 → 100.77 → 101.04 → 101.32 → 101.59
Structure failure level: 99.41
📌 What I’m Watching
Scenario A — Bullish Continuation
If SOL holds the 99.68–99.90 zone and buyers regain control, price may rotate toward:
100.22 → 100.50 → 100.77 → 101.04 → 101.32 → 101.59
A sustained move above 100.22 would provide stronger continuation confirmation.
Scenario B — Support Failure
If SOL loses 99.68, the current bullish structure becomes weaker.
The next marked downside Fibonacci level is:
99.41
A sustained break below the support structure would require reassessing the ascending-channel setup.
📊 Indicator Check
MACD: Near zero → momentum is mixed
RSI: 42.41 → weak-to-neutral momentum
Price Structure: Ascending channel + support retest
Key Confirmation: 99.68 hold / 100.22 reclaim
Note: This is a chart framework, not a trade recommendation. Use it to support your own DYOR-based execution plan.
— @nayrbryanGaming #SOLAnalysis #ChartSetup #PriceAction #SmartMoney #Fibonacci #CryptoTrading #DYOR #NFA
📈 Structure Overview
Market phase: Sharp sell-off → Recovery → Ascending-channel consolidation
Current structure: Higher lows + rising channel support
Key reaction zone: 99.68 – 99.90
First upside resistance: 100.22
Major upside levels: 100.50 → 100.77 → 101.04 → 101.32 → 101.59
Structure failure level: 99.41
📌 What I’m Watching
Scenario A — Bullish Continuation
If SOL holds the 99.68–99.90 zone and buyers regain control, price may rotate toward:
100.22 → 100.50 → 100.77 → 101.04 → 101.32 → 101.59
A sustained move above 100.22 would provide stronger continuation confirmation.
Scenario B — Support Failure
If SOL loses 99.68, the current bullish structure becomes weaker.
The next marked downside Fibonacci level is:
99.41
A sustained break below the support structure would require reassessing the ascending-channel setup.
📊 Indicator Check
MACD: Near zero → momentum is mixed
RSI: 42.41 → weak-to-neutral momentum
Price Structure: Ascending channel + support retest
Key Confirmation: 99.68 hold / 100.22 reclaim
Note: This is a chart framework, not a trade recommendation. Use it to support your own DYOR-based execution plan.
— @nayrbryanGaming #SOLAnalysis #ChartSetup #PriceAction #SmartMoney #Fibonacci #CryptoTrading #DYOR #NFA
36
·
--
Bullish
ISYARAT HARIAN — SOL/USDT
Tanggal: 10 Sep 2026 Timeframe: 1m Bias Intraday: Reli retest → potensi kelanjutan bullish
📊 Bias Pasar
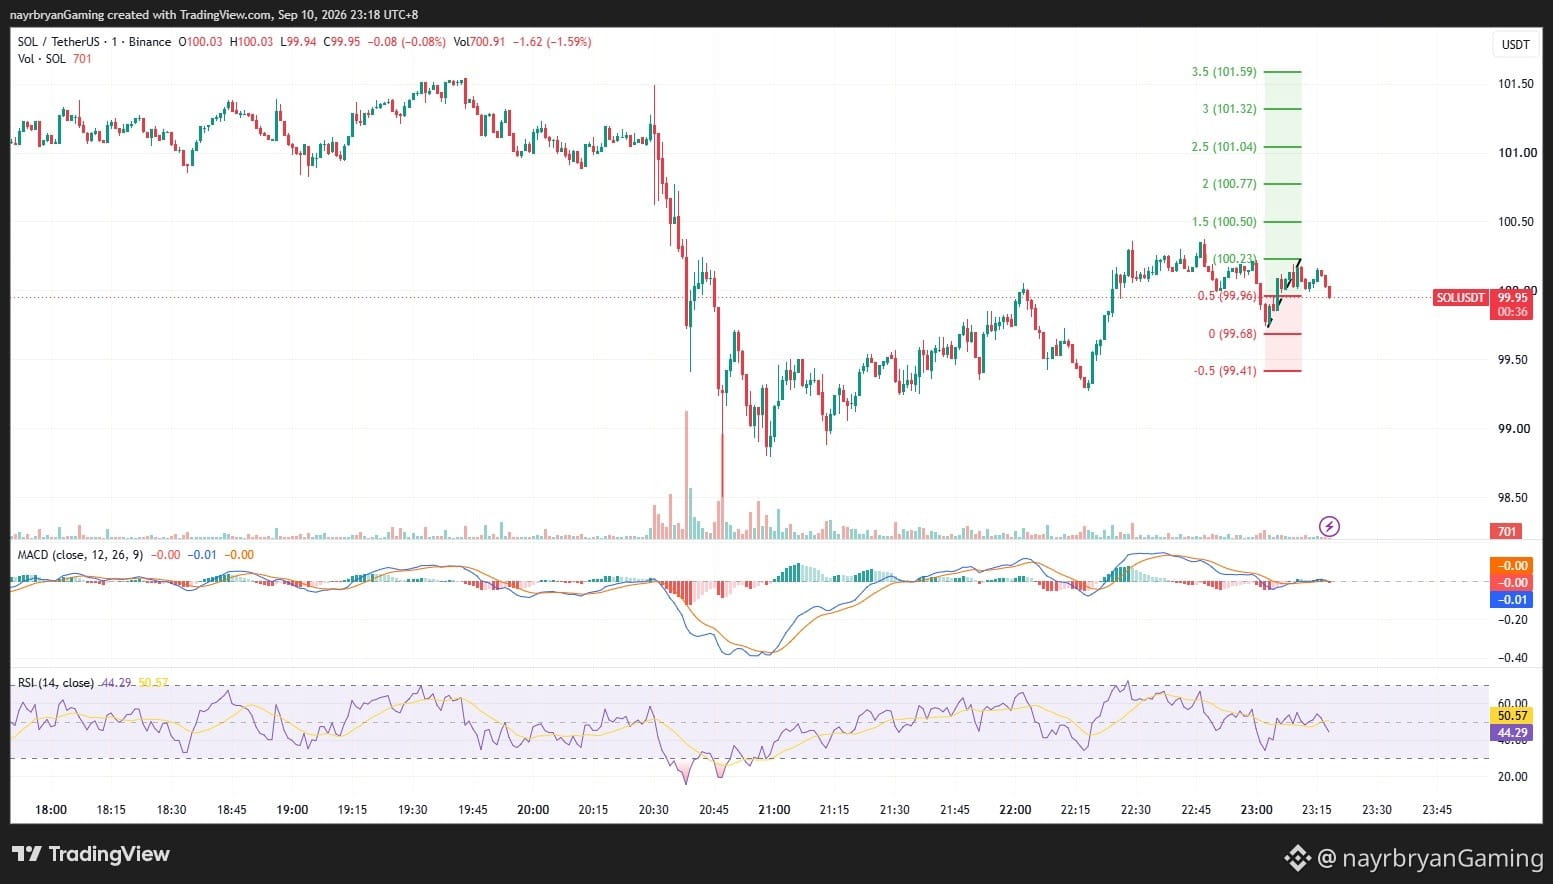
SOL sedang diperdagangkan di dalam saluran naik jangka pendek setelah pulih dari penurunan tajam.
Harga saat ini sedang menguji area struktur 99.68–99.90, dengan harga saat ini sekitar 99.90.
Level 99.68 adalah Fibonacci 0 yang ditandai, sedangkan 99.90 adalah level 0.5.
Selama struktur naik dan support 99.68 tetap bertahan, chart tetap membuka peluang rotasi menuju level Fibonacci yang lebih tinggi.
🔹 Level Kunci Dari Chart
Zona Struktur Kunci: 99.68 → 99.90
Fibonacci 0: 99.68
Fibonacci 0.5: 99.90
Level Upside Utama Pertama: 100.22
🎯 Target Fibonacci Upside
TP1 → 100.22 (1.0 Fib) TP2 → 100.50 (1.5 Fib) TP3 → 100.77 (2.0 Fib) TP4 → 101.04 (2.5 Fib) TP5 → 101.32 (3.0 Fib) TP6 → 101.59 (3.5 Fib)
🔻 Level Downside
Jika struktur gagal menembus di bawah support yang ditandai:
99.41 (-0.5 Fib)
Break berkelanjutan di bawah 99.68 akan melemahkan struktur kelanjutan bullish yang sedang berlangsung.
📈 Rangkuman Teknis
SOL pulih dari bagian bawah saluran naik dan bergerak kembali mendekati area 100.22.
Setelah mencapai bagian atas dari struktur terbaru, harga melakukan pullback dan kini sedang menguji zona 99.68–99.90.
MACD berada dekat garis nol, menunjukkan momentum saat ini relatif seimbang.
RSI berada di sekitar 42, menandakan kelemahan jangka pendek tanpa kondisi oversold yang dalam.
Area reaksi kunci tetap di 99.68–99.90.
Reaksi support yang berhasil dapat memungkinkan harga berotasi menuju:
100.22 → 100.50 → 100.77 → 101.04
🧠 Wawasan Cepat
“Struktur yang bagus memberi trader level untuk dihormati, bukan alasan untuk mengejar.”
⚠️ Disclaimer
Ini adalah analisis pasar pribadi, bukan nasihat keuangan. Kerangka chart ini hanya untuk tujuan edukasi.
Selalu lakukan DYOR / DYODD, kelola risiko dengan benar, dan hindari trading yang emosional.
— @nayrbryanGaming #SOL #SOLUSDT #Kripto #Trading #AnalisisTeknis #PriceAction #Fibonacci #Binance #DYOR #NFA #NoFOMO
ISYARAT HARIAN — SOL/USDT
Tanggal: 10 Sep 2026 Timeframe: 1m Bias Intraday: Reli retest → potensi kelanjutan bullish
📊 Bias Pasar
SOL sedang diperdagangkan di dalam saluran naik jangka pendek setelah pulih dari penurunan tajam.
Harga saat ini sedang menguji area struktur 99.68–99.90, dengan harga saat ini sekitar 99.90.
Level 99.68 adalah Fibonacci 0 yang ditandai, sedangkan 99.90 adalah level 0.5.
Selama struktur naik dan support 99.68 tetap bertahan, chart tetap membuka peluang rotasi menuju level Fibonacci yang lebih tinggi.
🔹 Level Kunci Dari Chart
Zona Struktur Kunci: 99.68 → 99.90
Fibonacci 0: 99.68
Fibonacci 0.5: 99.90
Level Upside Utama Pertama: 100.22
🎯 Target Fibonacci Upside
TP1 → 100.22 (1.0 Fib) TP2 → 100.50 (1.5 Fib) TP3 → 100.77 (2.0 Fib) TP4 → 101.04 (2.5 Fib) TP5 → 101.32 (3.0 Fib) TP6 → 101.59 (3.5 Fib)
🔻 Level Downside
Jika struktur gagal menembus di bawah support yang ditandai:
99.41 (-0.5 Fib)
Break berkelanjutan di bawah 99.68 akan melemahkan struktur kelanjutan bullish yang sedang berlangsung.
📈 Rangkuman Teknis
SOL pulih dari bagian bawah saluran naik dan bergerak kembali mendekati area 100.22.
Setelah mencapai bagian atas dari struktur terbaru, harga melakukan pullback dan kini sedang menguji zona 99.68–99.90.
MACD berada dekat garis nol, menunjukkan momentum saat ini relatif seimbang.
RSI berada di sekitar 42, menandakan kelemahan jangka pendek tanpa kondisi oversold yang dalam.
Area reaksi kunci tetap di 99.68–99.90.
Reaksi support yang berhasil dapat memungkinkan harga berotasi menuju:
100.22 → 100.50 → 100.77 → 101.04
🧠 Wawasan Cepat
“Struktur yang bagus memberi trader level untuk dihormati, bukan alasan untuk mengejar.”
⚠️ Disclaimer
Ini adalah analisis pasar pribadi, bukan nasihat keuangan. Kerangka chart ini hanya untuk tujuan edukasi.
Selalu lakukan DYOR / DYODD, kelola risiko dengan benar, dan hindari trading yang emosional.
— @nayrbryanGaming #SOL #SOLUSDT #Kripto #Trading #AnalisisTeknis #PriceAction #Fibonacci #Binance #DYOR #NFA #NoFOMO
Tanggal: 10 Sep 2026 Timeframe: 1m Bias Intraday: Reli retest → potensi kelanjutan bullish
📊 Bias Pasar
SOL sedang diperdagangkan di dalam saluran naik jangka pendek setelah pulih dari penurunan tajam.
Harga saat ini sedang menguji area struktur 99.68–99.90, dengan harga saat ini sekitar 99.90.
Level 99.68 adalah Fibonacci 0 yang ditandai, sedangkan 99.90 adalah level 0.5.
Selama struktur naik dan support 99.68 tetap bertahan, chart tetap membuka peluang rotasi menuju level Fibonacci yang lebih tinggi.
🔹 Level Kunci Dari Chart
Zona Struktur Kunci: 99.68 → 99.90
Fibonacci 0: 99.68
Fibonacci 0.5: 99.90
Level Upside Utama Pertama: 100.22
🎯 Target Fibonacci Upside
TP1 → 100.22 (1.0 Fib) TP2 → 100.50 (1.5 Fib) TP3 → 100.77 (2.0 Fib) TP4 → 101.04 (2.5 Fib) TP5 → 101.32 (3.0 Fib) TP6 → 101.59 (3.5 Fib)
🔻 Level Downside
Jika struktur gagal menembus di bawah support yang ditandai:
99.41 (-0.5 Fib)
Break berkelanjutan di bawah 99.68 akan melemahkan struktur kelanjutan bullish yang sedang berlangsung.
📈 Rangkuman Teknis
SOL pulih dari bagian bawah saluran naik dan bergerak kembali mendekati area 100.22.
Setelah mencapai bagian atas dari struktur terbaru, harga melakukan pullback dan kini sedang menguji zona 99.68–99.90.
MACD berada dekat garis nol, menunjukkan momentum saat ini relatif seimbang.
RSI berada di sekitar 42, menandakan kelemahan jangka pendek tanpa kondisi oversold yang dalam.
Area reaksi kunci tetap di 99.68–99.90.
Reaksi support yang berhasil dapat memungkinkan harga berotasi menuju:
100.22 → 100.50 → 100.77 → 101.04
🧠 Wawasan Cepat
“Struktur yang bagus memberi trader level untuk dihormati, bukan alasan untuk mengejar.”
⚠️ Disclaimer
Ini adalah analisis pasar pribadi, bukan nasihat keuangan. Kerangka chart ini hanya untuk tujuan edukasi.
Selalu lakukan DYOR / DYODD, kelola risiko dengan benar, dan hindari trading yang emosional.
— @nayrbryanGaming #SOL #SOLUSDT #Kripto #Trading #AnalisisTeknis #PriceAction #Fibonacci #Binance #DYOR #NFA #NoFOMO
262

·
--
Bearish
MOTIVASI TRADER / MINI WAWASAN
🧠 Wawasan Hari Ini
“Jangan kejar breakdown. Tunggu struktur untuk mengonfirmasikannya.”
Kenapa Ini Penting
Sebuah pasar bisa bertahan lama di support sebelum menentukan arah berikutnya.
Kesalahannya adalah masuk hanya karena chart terlihat bearish.
Eksekusi profesional berfokus pada:
• Struktur • Konfirmasi • Reaksi • Invalidasi • Kontrol risiko
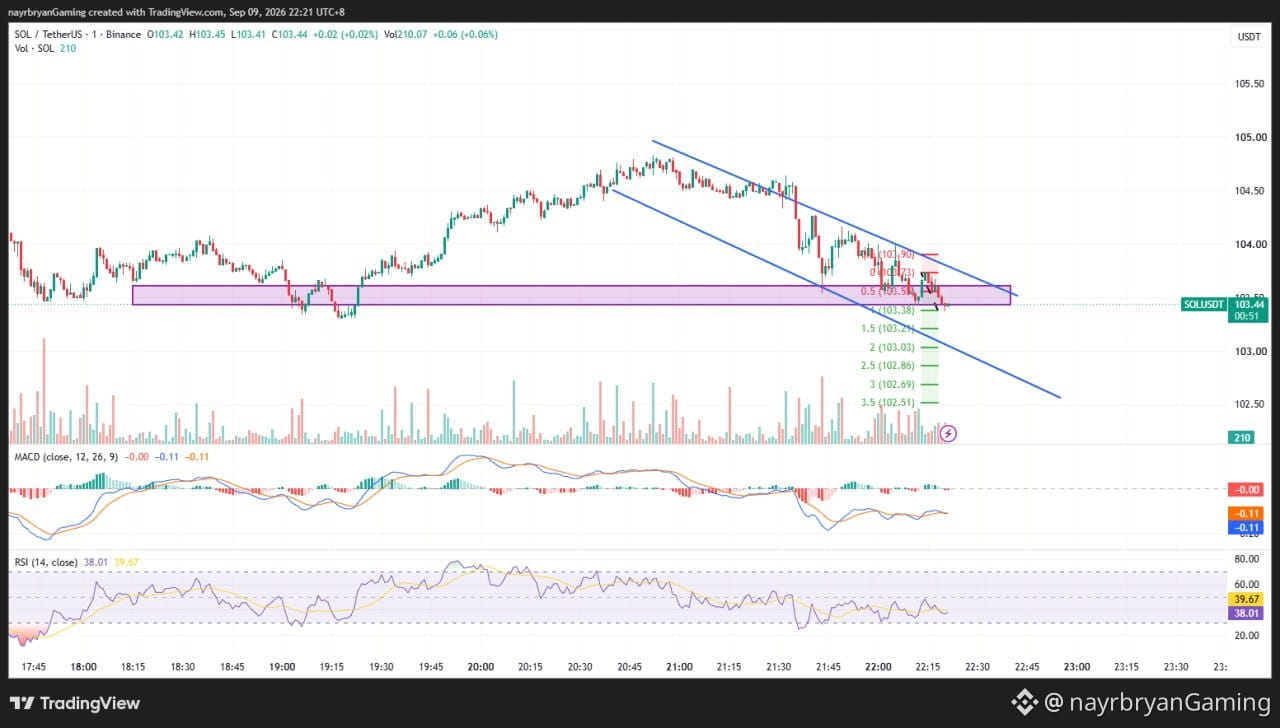
SOL saat ini sedang menguji zona penting 103.38–103.65.
Pertanyaannya bukan:
“Apakah ini akan jatuh?”
Pertanyaan yang lebih baik adalah:
“Apakah pihak penjual benar-benar akan mematahkan struktur?”
🎯 Daftar Periksa Trader
Tandai zona reaksi
Tunggu konfirmasi
Perhatikan garis tren menurun
Hormati invalidasi
Hindari entry karena emosi
Lindungi modal
🧠 Mini Tantangan
Sebelum masuk, tanyakan:
“Apakah saya masuk karena struktur sudah terkonfirmasi — atau karena saya takut ketinggalan pergerakan?”
— @nayrbryanGaming #TraderMindset #TradingDiscipline #NoFOMO #CryptoMindset #DYOR #PriceAction #SOLUSDT
🔔 Ikuti Binance Square & X saya (@nayrbryanGaming) untuk wawasan chart harian.
MOTIVASI TRADER / MINI WAWASAN
🧠 Wawasan Hari Ini
“Jangan kejar breakdown. Tunggu struktur untuk mengonfirmasikannya.”
Kenapa Ini Penting
Sebuah pasar bisa bertahan lama di support sebelum menentukan arah berikutnya.
Kesalahannya adalah masuk hanya karena chart terlihat bearish.
Eksekusi profesional berfokus pada:
• Struktur • Konfirmasi • Reaksi • Invalidasi • Kontrol risiko
SOL saat ini sedang menguji zona penting 103.38–103.65.
Pertanyaannya bukan:
“Apakah ini akan jatuh?”
Pertanyaan yang lebih baik adalah:
“Apakah pihak penjual benar-benar akan mematahkan struktur?”
🎯 Daftar Periksa Trader
Tandai zona reaksi
Tunggu konfirmasi
Perhatikan garis tren menurun
Hormati invalidasi
Hindari entry karena emosi
Lindungi modal
🧠 Mini Tantangan
Sebelum masuk, tanyakan:
“Apakah saya masuk karena struktur sudah terkonfirmasi — atau karena saya takut ketinggalan pergerakan?”
— @nayrbryanGaming #TraderMindset #TradingDiscipline #NoFOMO #CryptoMindset #DYOR #PriceAction #SOLUSDT
🔔 Ikuti Binance Square & X saya (@nayrbryanGaming) untuk wawasan chart harian.
🧠 Wawasan Hari Ini
“Jangan kejar breakdown. Tunggu struktur untuk mengonfirmasikannya.”
Kenapa Ini Penting
Sebuah pasar bisa bertahan lama di support sebelum menentukan arah berikutnya.
Kesalahannya adalah masuk hanya karena chart terlihat bearish.
Eksekusi profesional berfokus pada:
• Struktur • Konfirmasi • Reaksi • Invalidasi • Kontrol risiko
SOL saat ini sedang menguji zona penting 103.38–103.65.
Pertanyaannya bukan:
“Apakah ini akan jatuh?”
Pertanyaan yang lebih baik adalah:
“Apakah pihak penjual benar-benar akan mematahkan struktur?”
🎯 Daftar Periksa Trader
Tandai zona reaksi
Tunggu konfirmasi
Perhatikan garis tren menurun
Hormati invalidasi
Hindari entry karena emosi
Lindungi modal
🧠 Mini Tantangan
Sebelum masuk, tanyakan:
“Apakah saya masuk karena struktur sudah terkonfirmasi — atau karena saya takut ketinggalan pergerakan?”
— @nayrbryanGaming #TraderMindset #TradingDiscipline #NoFOMO #CryptoMindset #DYOR #PriceAction #SOLUSDT
🔔 Ikuti Binance Square & X saya (@nayrbryanGaming) untuk wawasan chart harian.
37
·
--
Bearish
Lihat terjemahan
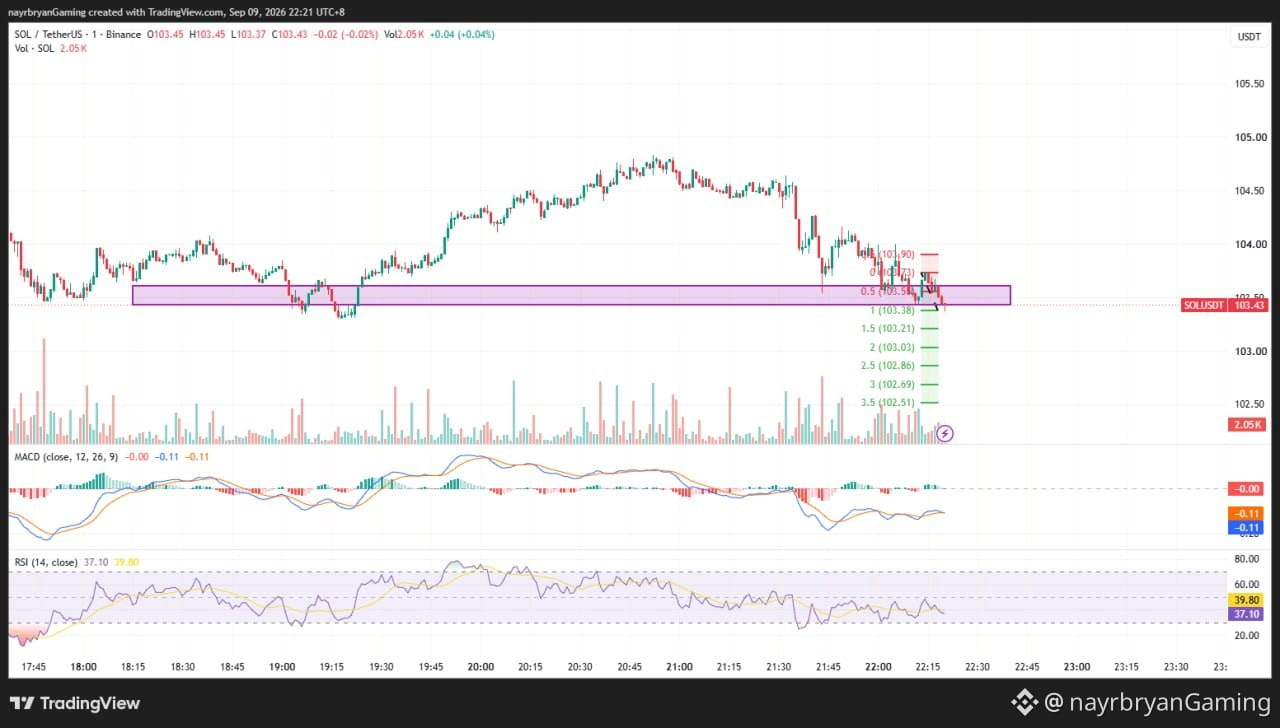
LIGHT ANALYSIS / CHART SETUP — SOL/USDT
📈 Structure Overview
Market phase: Downtrend → Rebound → Resistance Test
Descending structure: Lower highs inside a falling channel
Key reaction zone: 103.38 – 103.65
Major resistance: 103.73 – 103.90
Breakdown confirmation: Below 103.38
📌 What I’m Watching
Scenario A — Bearish Continuation
If SOL rejects the 103.38–103.65 area and loses 103.38, price may rotate toward:
103.21 → 103.03 → 102.86 → 102.69 → 102.51
These levels correspond with the Fibonacci extensions marked on the chart.
Scenario B — Bullish Reclaim
If SOL reclaims 103.73 and continues through 103.90, the immediate bearish structure weakens.
A sustained reclaim would suggest that sellers are losing control of the current descending setup.
Until that happens, rallies into resistance remain vulnerable to rejection.
📊 Indicator Check
MACD: Below zero → bearish momentum remains
RSI: 38.01 → weak momentum
Price Structure: Descending channel + lower highs
Key Confirmation: 103.38 breakdown / 103.90 reclaim
Note: This is a chart framework, not a trade recommendation. Use it to support your own DYOR-based execution plan.
— @nayrbryanGaming #SOLAnalysis #ChartSetup #PriceAction #SmartMoney #Fibonacci #CryptoTrading #DYOR #NFA
LIGHT ANALYSIS / CHART SETUP — SOL/USDT
📈 Structure Overview
Market phase: Downtrend → Rebound → Resistance Test
Descending structure: Lower highs inside a falling channel
Key reaction zone: 103.38 – 103.65
Major resistance: 103.73 – 103.90
Breakdown confirmation: Below 103.38
📌 What I’m Watching
Scenario A — Bearish Continuation
If SOL rejects the 103.38–103.65 area and loses 103.38, price may rotate toward:
103.21 → 103.03 → 102.86 → 102.69 → 102.51
These levels correspond with the Fibonacci extensions marked on the chart.
Scenario B — Bullish Reclaim
If SOL reclaims 103.73 and continues through 103.90, the immediate bearish structure weakens.
A sustained reclaim would suggest that sellers are losing control of the current descending setup.
Until that happens, rallies into resistance remain vulnerable to rejection.
📊 Indicator Check
MACD: Below zero → bearish momentum remains
RSI: 38.01 → weak momentum
Price Structure: Descending channel + lower highs
Key Confirmation: 103.38 breakdown / 103.90 reclaim
Note: This is a chart framework, not a trade recommendation. Use it to support your own DYOR-based execution plan.
— @nayrbryanGaming #SOLAnalysis #ChartSetup #PriceAction #SmartMoney #Fibonacci #CryptoTrading #DYOR #NFA
📈 Structure Overview
Market phase: Downtrend → Rebound → Resistance Test
Descending structure: Lower highs inside a falling channel
Key reaction zone: 103.38 – 103.65
Major resistance: 103.73 – 103.90
Breakdown confirmation: Below 103.38
📌 What I’m Watching
Scenario A — Bearish Continuation
If SOL rejects the 103.38–103.65 area and loses 103.38, price may rotate toward:
103.21 → 103.03 → 102.86 → 102.69 → 102.51
These levels correspond with the Fibonacci extensions marked on the chart.
Scenario B — Bullish Reclaim
If SOL reclaims 103.73 and continues through 103.90, the immediate bearish structure weakens.
A sustained reclaim would suggest that sellers are losing control of the current descending setup.
Until that happens, rallies into resistance remain vulnerable to rejection.
📊 Indicator Check
MACD: Below zero → bearish momentum remains
RSI: 38.01 → weak momentum
Price Structure: Descending channel + lower highs
Key Confirmation: 103.38 breakdown / 103.90 reclaim
Note: This is a chart framework, not a trade recommendation. Use it to support your own DYOR-based execution plan.
— @nayrbryanGaming #SOLAnalysis #ChartSetup #PriceAction #SmartMoney #Fibonacci #CryptoTrading #DYOR #NFA
28
·
--
Bearish
Lihat terjemahan
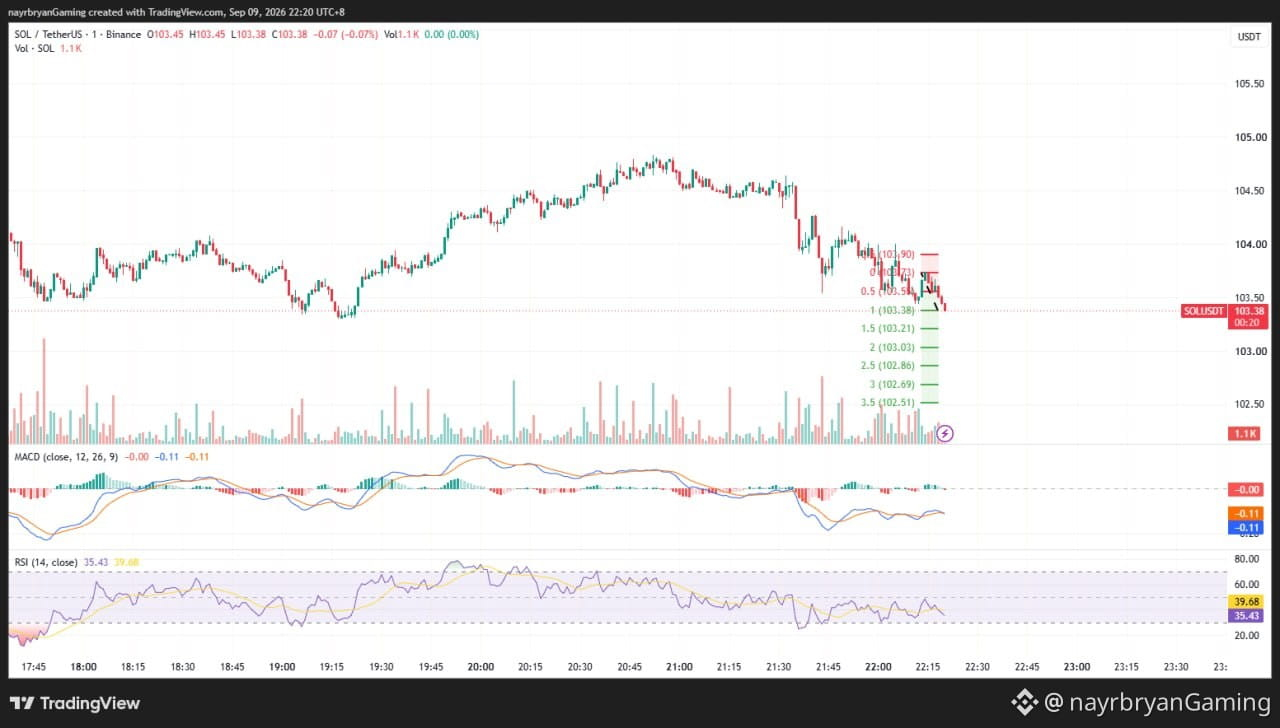
DAILY SIGNAL — SOL/USDT
Date: 09 Sep 2026 Timeframe: 1m Intraday Bias: Bearish continuation → resistance rejection → downside liquidity
📊 Market Bias
SOL remains inside a short-term descending channel after failing to sustain the recovery above the 104.00 area.
Price has returned to the purple structure zone around 103.38–103.65, which is now acting as an important reaction area.
The latest candles are struggling to reclaim the descending resistance, keeping the short-term structure bearish.
🔹 Key Levels From Chart
Entry Zone — Short Reaction Bias: 103.38 → 103.65
Key Resistance: 103.73 → 103.90
Invalidation: Above 103.90
Key Support: 103.38
🎯 Downside Fibonacci Targets
TP1 → 103.21 (1.5 Fib) TP2 → 103.03 (2.0 Fib) TP3 → 102.86 (2.5 Fib) TP4 → 102.69 (3.0 Fib) TP5 → 102.51 (3.5 Fib)
📈 Technical Breakdown
SOL has been making lower highs while respecting the descending channel.
The recent rebound from the lower area failed to produce a confirmed bullish reversal.
Price is now pressing against the 103.38–103.65 structure zone while remaining beneath the descending trendline.
MACD remains below the zero line, while RSI is around 38, showing weak momentum without being deeply oversold.
A confirmed rejection from the current zone followed by a break below 103.38 would strengthen the bearish continuation scenario.
If price instead reclaims 103.90, the bearish setup should be reassessed.
🧠 Quick Insight
“Resistance becomes powerful when the market keeps failing to reclaim it.”
⚠️ Disclaimer
This is personal market analysis, not financial advice. This chart framework is for educational purposes only.
Always DYOR / DYODD, manage risk properly, and avoid emotional trading.
— @nayrbryanGaming #SOL #SOLUSDT #Crypto #Trading #TechnicalAnalysis #PriceAction #Fibonacci #Binance #DYOR #NFA #NoFOMO
DAILY SIGNAL — SOL/USDT
Date: 09 Sep 2026 Timeframe: 1m Intraday Bias: Bearish continuation → resistance rejection → downside liquidity
📊 Market Bias
SOL remains inside a short-term descending channel after failing to sustain the recovery above the 104.00 area.
Price has returned to the purple structure zone around 103.38–103.65, which is now acting as an important reaction area.
The latest candles are struggling to reclaim the descending resistance, keeping the short-term structure bearish.
🔹 Key Levels From Chart
Entry Zone — Short Reaction Bias: 103.38 → 103.65
Key Resistance: 103.73 → 103.90
Invalidation: Above 103.90
Key Support: 103.38
🎯 Downside Fibonacci Targets
TP1 → 103.21 (1.5 Fib) TP2 → 103.03 (2.0 Fib) TP3 → 102.86 (2.5 Fib) TP4 → 102.69 (3.0 Fib) TP5 → 102.51 (3.5 Fib)
📈 Technical Breakdown
SOL has been making lower highs while respecting the descending channel.
The recent rebound from the lower area failed to produce a confirmed bullish reversal.
Price is now pressing against the 103.38–103.65 structure zone while remaining beneath the descending trendline.
MACD remains below the zero line, while RSI is around 38, showing weak momentum without being deeply oversold.
A confirmed rejection from the current zone followed by a break below 103.38 would strengthen the bearish continuation scenario.
If price instead reclaims 103.90, the bearish setup should be reassessed.
🧠 Quick Insight
“Resistance becomes powerful when the market keeps failing to reclaim it.”
⚠️ Disclaimer
This is personal market analysis, not financial advice. This chart framework is for educational purposes only.
Always DYOR / DYODD, manage risk properly, and avoid emotional trading.
— @nayrbryanGaming #SOL #SOLUSDT #Crypto #Trading #TechnicalAnalysis #PriceAction #Fibonacci #Binance #DYOR #NFA #NoFOMO
Date: 09 Sep 2026 Timeframe: 1m Intraday Bias: Bearish continuation → resistance rejection → downside liquidity
📊 Market Bias
SOL remains inside a short-term descending channel after failing to sustain the recovery above the 104.00 area.
Price has returned to the purple structure zone around 103.38–103.65, which is now acting as an important reaction area.
The latest candles are struggling to reclaim the descending resistance, keeping the short-term structure bearish.
🔹 Key Levels From Chart
Entry Zone — Short Reaction Bias: 103.38 → 103.65
Key Resistance: 103.73 → 103.90
Invalidation: Above 103.90
Key Support: 103.38
🎯 Downside Fibonacci Targets
TP1 → 103.21 (1.5 Fib) TP2 → 103.03 (2.0 Fib) TP3 → 102.86 (2.5 Fib) TP4 → 102.69 (3.0 Fib) TP5 → 102.51 (3.5 Fib)
📈 Technical Breakdown
SOL has been making lower highs while respecting the descending channel.
The recent rebound from the lower area failed to produce a confirmed bullish reversal.
Price is now pressing against the 103.38–103.65 structure zone while remaining beneath the descending trendline.
MACD remains below the zero line, while RSI is around 38, showing weak momentum without being deeply oversold.
A confirmed rejection from the current zone followed by a break below 103.38 would strengthen the bearish continuation scenario.
If price instead reclaims 103.90, the bearish setup should be reassessed.
🧠 Quick Insight
“Resistance becomes powerful when the market keeps failing to reclaim it.”
⚠️ Disclaimer
This is personal market analysis, not financial advice. This chart framework is for educational purposes only.
Always DYOR / DYODD, manage risk properly, and avoid emotional trading.
— @nayrbryanGaming #SOL #SOLUSDT #Crypto #Trading #TechnicalAnalysis #PriceAction #Fibonacci #Binance #DYOR #NFA #NoFOMO
55
·
--
Bearish
MOTIVASI TRADER / MINI INSIGHT
🧠 Insight Hari Ini
“Jangan pernah mengira pantulan sebagai pembalikan.”
Mengapa Ini Penting
Harga bisa memantul dari support tanpa benar-benar mengubah struktur dasarnya.
Pertanyaan pentingnya bukan:
“Apakah harga memantul?”
Tetapi pertanyaan yang lebih baik adalah:
“Apakah harga berhasil merebut kembali struktur tersebut?”
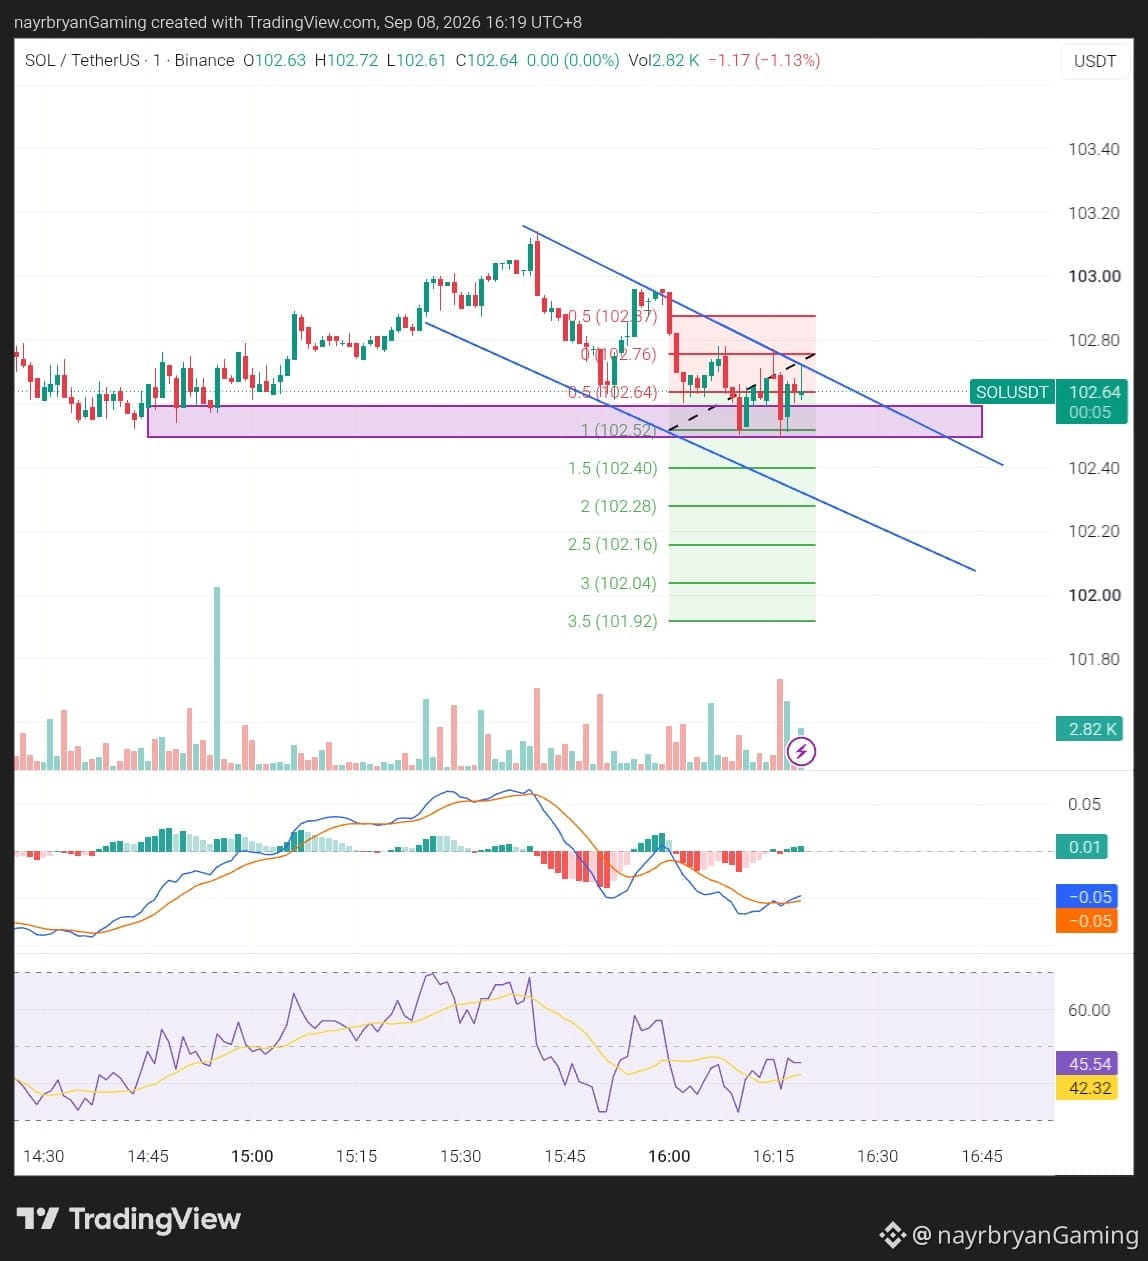
Untuk SOL, pasar saat ini sedang menguji area support 102.52–102.70 sambil tetap berada di bawah struktur turun jangka pendek.
Itu membuat konfirmasi lebih penting daripada prediksi.
🎯 Daftar Periksa Trader
Identifikasi struktur
Tandai support dan resistance
Tunggu konfirmasi
Patuhi invalidasi
Hindari mengejar candle pertama
Lindungi modal Anda
🧠 Mini Challenge
Sebelum masuk, tanyakan:
“Apakah pasar benar-benar berbalik — atau hanya memantul?”
— @nayrbryanGaming #TraderMindset #TradingDiscipline #NoFOMO #CryptoMindset #DYOR #PriceAction #SOLUSDT
🔔 Ikuti Binance Square & X saya (@nayrbryanGaming) untuk insight chart harian.
MOTIVASI TRADER / MINI INSIGHT
🧠 Insight Hari Ini
“Jangan pernah mengira pantulan sebagai pembalikan.”
Mengapa Ini Penting
Harga bisa memantul dari support tanpa benar-benar mengubah struktur dasarnya.
Pertanyaan pentingnya bukan:
“Apakah harga memantul?”
Tetapi pertanyaan yang lebih baik adalah:
“Apakah harga berhasil merebut kembali struktur tersebut?”
Untuk SOL, pasar saat ini sedang menguji area support 102.52–102.70 sambil tetap berada di bawah struktur turun jangka pendek.
Itu membuat konfirmasi lebih penting daripada prediksi.
🎯 Daftar Periksa Trader
Identifikasi struktur
Tandai support dan resistance
Tunggu konfirmasi
Patuhi invalidasi
Hindari mengejar candle pertama
Lindungi modal Anda
🧠 Mini Challenge
Sebelum masuk, tanyakan:
“Apakah pasar benar-benar berbalik — atau hanya memantul?”
— @nayrbryanGaming #TraderMindset #TradingDiscipline #NoFOMO #CryptoMindset #DYOR #PriceAction #SOLUSDT
🔔 Ikuti Binance Square & X saya (@nayrbryanGaming) untuk insight chart harian.
🧠 Insight Hari Ini
“Jangan pernah mengira pantulan sebagai pembalikan.”
Mengapa Ini Penting
Harga bisa memantul dari support tanpa benar-benar mengubah struktur dasarnya.
Pertanyaan pentingnya bukan:
“Apakah harga memantul?”
Tetapi pertanyaan yang lebih baik adalah:
“Apakah harga berhasil merebut kembali struktur tersebut?”
Untuk SOL, pasar saat ini sedang menguji area support 102.52–102.70 sambil tetap berada di bawah struktur turun jangka pendek.
Itu membuat konfirmasi lebih penting daripada prediksi.
🎯 Daftar Periksa Trader
Identifikasi struktur
Tandai support dan resistance
Tunggu konfirmasi
Patuhi invalidasi
Hindari mengejar candle pertama
Lindungi modal Anda
🧠 Mini Challenge
Sebelum masuk, tanyakan:
“Apakah pasar benar-benar berbalik — atau hanya memantul?”
— @nayrbryanGaming #TraderMindset #TradingDiscipline #NoFOMO #CryptoMindset #DYOR #PriceAction #SOLUSDT
🔔 Ikuti Binance Square & X saya (@nayrbryanGaming) untuk insight chart harian.
154
·
--
Bearish
Lihat terjemahan
LIGHT ANALYSIS / CHART SETUP — SOL/USDT
📈 Structure Overview
Market phase: Downtrend → Rebound → Support Test
Key resistance: 102.70 – 102.87
Key support zone: 102.52 – 102.70
Breakdown confirmation: Below 102.52
Major invalidation: Above 102.87
📌 What I’m Watching
Scenario A — Bearish Continuation
If SOL loses 102.52 with confirmation, price may rotate toward:
102.40 → 102.28 → 102.16 → 102.04 → 101.92
Potential reactions may occur around each Fibonacci extension.
Scenario B — Support Reclaim
If SOL holds the 102.52–102.70 area and reclaims 102.87, the immediate bearish setup weakens.
Price could then attempt another rotation toward the upper structure.
The key is whether buyers can reclaim the descending resistance rather than simply producing another short-term bounce.
📊 Indicator Check
MACD: Recovering from negative momentum
RSI: 46.34 — neutral-to-soft momentum
Price Structure: Lower highs + descending channel
Key Confirmation: 102.52 breakdown / 102.87 reclaim
Note: This is a chart framework, not a trade recommendation. Use it to support your own DYOR-based execution plan.
— @nayrbryanGaming #SOLAnalysis #ChartSetup #PriceAction #SmartMoney #Fibonacci #CryptoTrading #DYOR
LIGHT ANALYSIS / CHART SETUP — SOL/USDT
📈 Structure Overview
Market phase: Downtrend → Rebound → Support Test
Key resistance: 102.70 – 102.87
Key support zone: 102.52 – 102.70
Breakdown confirmation: Below 102.52
Major invalidation: Above 102.87
📌 What I’m Watching
Scenario A — Bearish Continuation
If SOL loses 102.52 with confirmation, price may rotate toward:
102.40 → 102.28 → 102.16 → 102.04 → 101.92
Potential reactions may occur around each Fibonacci extension.
Scenario B — Support Reclaim
If SOL holds the 102.52–102.70 area and reclaims 102.87, the immediate bearish setup weakens.
Price could then attempt another rotation toward the upper structure.
The key is whether buyers can reclaim the descending resistance rather than simply producing another short-term bounce.
📊 Indicator Check
MACD: Recovering from negative momentum
RSI: 46.34 — neutral-to-soft momentum
Price Structure: Lower highs + descending channel
Key Confirmation: 102.52 breakdown / 102.87 reclaim
Note: This is a chart framework, not a trade recommendation. Use it to support your own DYOR-based execution plan.
— @nayrbryanGaming #SOLAnalysis #ChartSetup #PriceAction #SmartMoney #Fibonacci #CryptoTrading #DYOR
📈 Structure Overview
Market phase: Downtrend → Rebound → Support Test
Key resistance: 102.70 – 102.87
Key support zone: 102.52 – 102.70
Breakdown confirmation: Below 102.52
Major invalidation: Above 102.87
📌 What I’m Watching
Scenario A — Bearish Continuation
If SOL loses 102.52 with confirmation, price may rotate toward:
102.40 → 102.28 → 102.16 → 102.04 → 101.92
Potential reactions may occur around each Fibonacci extension.
Scenario B — Support Reclaim
If SOL holds the 102.52–102.70 area and reclaims 102.87, the immediate bearish setup weakens.
Price could then attempt another rotation toward the upper structure.
The key is whether buyers can reclaim the descending resistance rather than simply producing another short-term bounce.
📊 Indicator Check
MACD: Recovering from negative momentum
RSI: 46.34 — neutral-to-soft momentum
Price Structure: Lower highs + descending channel
Key Confirmation: 102.52 breakdown / 102.87 reclaim
Note: This is a chart framework, not a trade recommendation. Use it to support your own DYOR-based execution plan.
— @nayrbryanGaming #SOLAnalysis #ChartSetup #PriceAction #SmartMoney #Fibonacci #CryptoTrading #DYOR
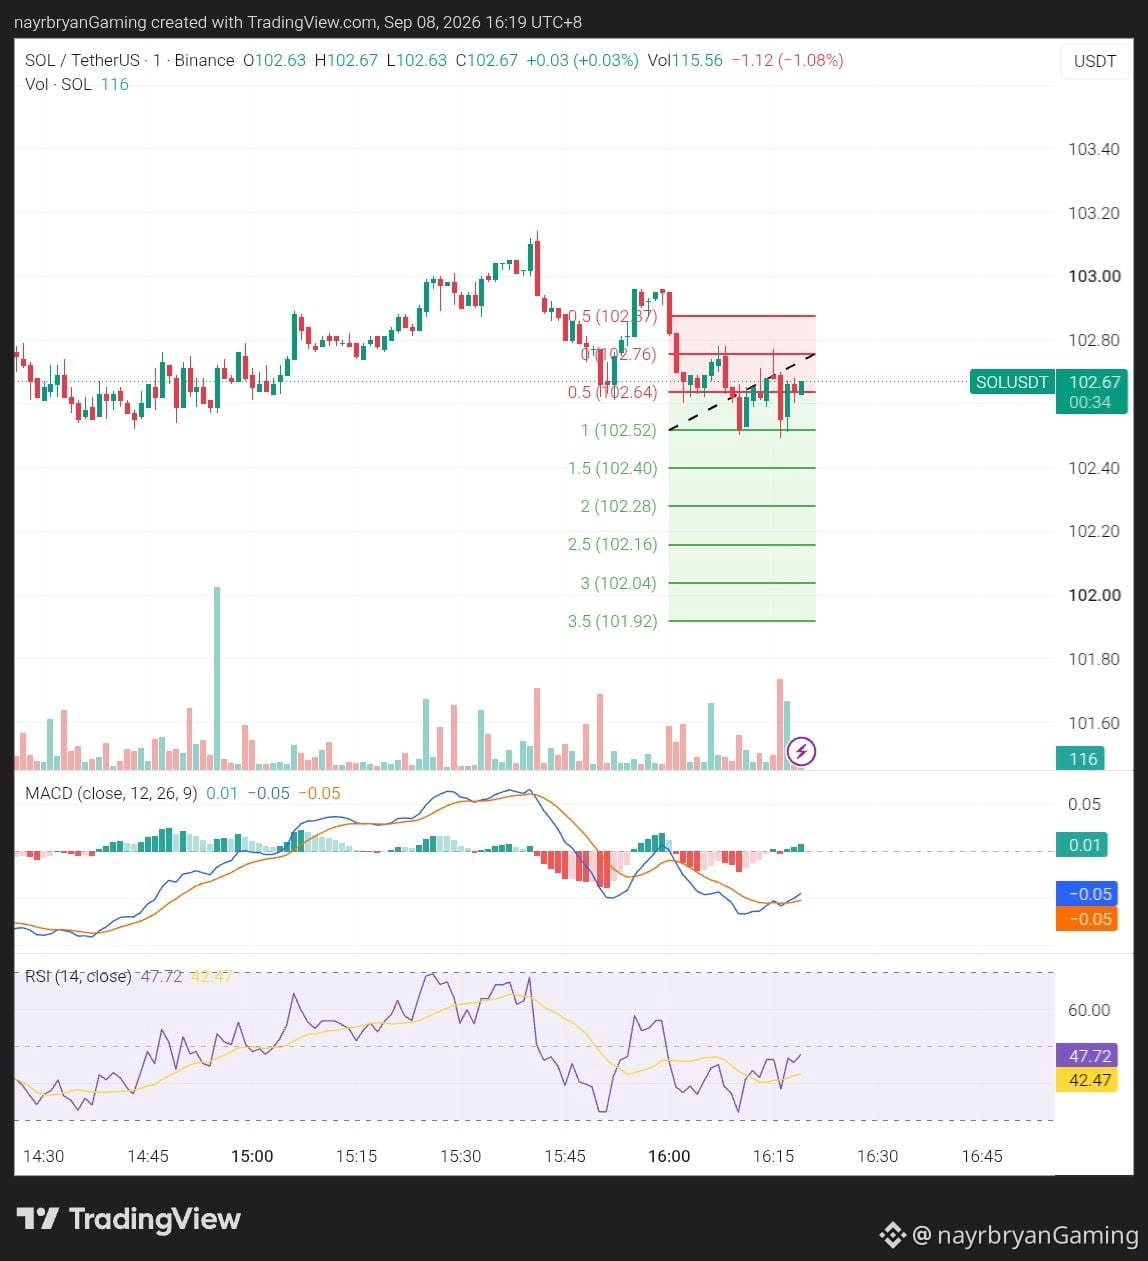
43
·
--
Bearish
SINYAL HARIAN — SOL/USDT
Tanggal: 08 Sep 2026 Timeframe: 1m Bias Intraday: Struktur bearish → uji support → potensi kelanjutan penurunan
📊 Bias Pasar
SOL sedang bergerak di dalam struktur menurun jangka pendek setelah penolakan dari area 103,00–103,15.
Harga saat ini sekitar 102,65 dan sedang menguji zona support ungu di sekitar 102,52–102,70.
Pantulan terbaru belum berhasil menembus struktur menurun, sehingga bias jangka pendek masih cenderung hati-hati-bearish.
Jika area support tersebut ditembus dengan bersih, dapat membuka peluang ke level-level Fibonacci ekstensi yang lebih rendah.
🔹 Level Kunci dari Chart
Zona Entry — Bias Reaksi Singkat: 102,64 → 102,70
Resistensi / Penolakan Utama: 102,70 → 102,87
Stop-Loss / Pembatalan: Di atas 102,87
Support Utama: 102,52
🎯 Target Fibonacci Penurunan
TP1 → 102,52 (1,0 Fib) TP2 → 102,40 (1,5 Fib) TP3 → 102,28 (2,0 Fib) TP4 → 102,16 (2,5 Fib) TP5 → 102,04 (3,0 Fib) TP6 → 101,92 (3,5 Fib)
📈 Rincian Teknis
SOL masih berada di bawah struktur tren menurun setelah gagal mempertahankan pemulihan menuju area 102,87.
Zona ungu di sekitar 102,52–102,70 saat ini menjadi medan pertempuran utama.
Harga berusaha menstabilkan diri di sekitar support, sementara MACD menunjukkan pemulihan kecil dari area negatif.
RSI berada di sekitar 46, yang menunjukkan momentum netral-cenderung lemah, bukan kondisi oversold.
Artinya, skenario penurunan tetap memungkinkan secara teknis, namun konfirmasi itu penting.
Break tegas di bawah 102,52 akan memperkuat setup kelanjutan bearish.
Jika SOL justru berhasil merebut dan bertahan di atas 102,87, setup short menjadi tidak valid dan struktur perlu dinilai ulang.
🧠 Insight Cepat
“Support bisa bertahan bagi pasar — sampai harga membuktikan sebaliknya.”
⚠️ Disclaimer
Ini adalah analisis pasar pribadi, bukan nasihat keuangan. Kerangka chart ini hanya untuk tujuan edukasi.
Selalu DYOR / DYODD, kelola risiko dengan benar, dan hindari trading yang emosional.
— @nayrbryanGaming #SOL #SOLUSDT #Crypto #Trading #TechnicalAnalysis #PriceAction #Fibonacci #Binance #DYOR #NFA #SmartMoney #NoFOMO
SINYAL HARIAN — SOL/USDT
Tanggal: 08 Sep 2026 Timeframe: 1m Bias Intraday: Struktur bearish → uji support → potensi kelanjutan penurunan
📊 Bias Pasar
SOL sedang bergerak di dalam struktur menurun jangka pendek setelah penolakan dari area 103,00–103,15.
Harga saat ini sekitar 102,65 dan sedang menguji zona support ungu di sekitar 102,52–102,70.
Pantulan terbaru belum berhasil menembus struktur menurun, sehingga bias jangka pendek masih cenderung hati-hati-bearish.
Jika area support tersebut ditembus dengan bersih, dapat membuka peluang ke level-level Fibonacci ekstensi yang lebih rendah.
🔹 Level Kunci dari Chart
Zona Entry — Bias Reaksi Singkat: 102,64 → 102,70
Resistensi / Penolakan Utama: 102,70 → 102,87
Stop-Loss / Pembatalan: Di atas 102,87
Support Utama: 102,52
🎯 Target Fibonacci Penurunan
TP1 → 102,52 (1,0 Fib) TP2 → 102,40 (1,5 Fib) TP3 → 102,28 (2,0 Fib) TP4 → 102,16 (2,5 Fib) TP5 → 102,04 (3,0 Fib) TP6 → 101,92 (3,5 Fib)
📈 Rincian Teknis
SOL masih berada di bawah struktur tren menurun setelah gagal mempertahankan pemulihan menuju area 102,87.
Zona ungu di sekitar 102,52–102,70 saat ini menjadi medan pertempuran utama.
Harga berusaha menstabilkan diri di sekitar support, sementara MACD menunjukkan pemulihan kecil dari area negatif.
RSI berada di sekitar 46, yang menunjukkan momentum netral-cenderung lemah, bukan kondisi oversold.
Artinya, skenario penurunan tetap memungkinkan secara teknis, namun konfirmasi itu penting.
Break tegas di bawah 102,52 akan memperkuat setup kelanjutan bearish.
Jika SOL justru berhasil merebut dan bertahan di atas 102,87, setup short menjadi tidak valid dan struktur perlu dinilai ulang.
🧠 Insight Cepat
“Support bisa bertahan bagi pasar — sampai harga membuktikan sebaliknya.”
⚠️ Disclaimer
Ini adalah analisis pasar pribadi, bukan nasihat keuangan. Kerangka chart ini hanya untuk tujuan edukasi.
Selalu DYOR / DYODD, kelola risiko dengan benar, dan hindari trading yang emosional.
— @nayrbryanGaming #SOL #SOLUSDT #Crypto #Trading #TechnicalAnalysis #PriceAction #Fibonacci #Binance #DYOR #NFA #SmartMoney #NoFOMO
Tanggal: 08 Sep 2026 Timeframe: 1m Bias Intraday: Struktur bearish → uji support → potensi kelanjutan penurunan
📊 Bias Pasar
SOL sedang bergerak di dalam struktur menurun jangka pendek setelah penolakan dari area 103,00–103,15.
Harga saat ini sekitar 102,65 dan sedang menguji zona support ungu di sekitar 102,52–102,70.
Pantulan terbaru belum berhasil menembus struktur menurun, sehingga bias jangka pendek masih cenderung hati-hati-bearish.
Jika area support tersebut ditembus dengan bersih, dapat membuka peluang ke level-level Fibonacci ekstensi yang lebih rendah.
🔹 Level Kunci dari Chart
Zona Entry — Bias Reaksi Singkat: 102,64 → 102,70
Resistensi / Penolakan Utama: 102,70 → 102,87
Stop-Loss / Pembatalan: Di atas 102,87
Support Utama: 102,52
🎯 Target Fibonacci Penurunan
TP1 → 102,52 (1,0 Fib) TP2 → 102,40 (1,5 Fib) TP3 → 102,28 (2,0 Fib) TP4 → 102,16 (2,5 Fib) TP5 → 102,04 (3,0 Fib) TP6 → 101,92 (3,5 Fib)
📈 Rincian Teknis
SOL masih berada di bawah struktur tren menurun setelah gagal mempertahankan pemulihan menuju area 102,87.
Zona ungu di sekitar 102,52–102,70 saat ini menjadi medan pertempuran utama.
Harga berusaha menstabilkan diri di sekitar support, sementara MACD menunjukkan pemulihan kecil dari area negatif.
RSI berada di sekitar 46, yang menunjukkan momentum netral-cenderung lemah, bukan kondisi oversold.
Artinya, skenario penurunan tetap memungkinkan secara teknis, namun konfirmasi itu penting.
Break tegas di bawah 102,52 akan memperkuat setup kelanjutan bearish.
Jika SOL justru berhasil merebut dan bertahan di atas 102,87, setup short menjadi tidak valid dan struktur perlu dinilai ulang.
🧠 Insight Cepat
“Support bisa bertahan bagi pasar — sampai harga membuktikan sebaliknya.”
⚠️ Disclaimer
Ini adalah analisis pasar pribadi, bukan nasihat keuangan. Kerangka chart ini hanya untuk tujuan edukasi.
Selalu DYOR / DYODD, kelola risiko dengan benar, dan hindari trading yang emosional.
— @nayrbryanGaming #SOL #SOLUSDT #Crypto #Trading #TechnicalAnalysis #PriceAction #Fibonacci #Binance #DYOR #NFA #SmartMoney #NoFOMO
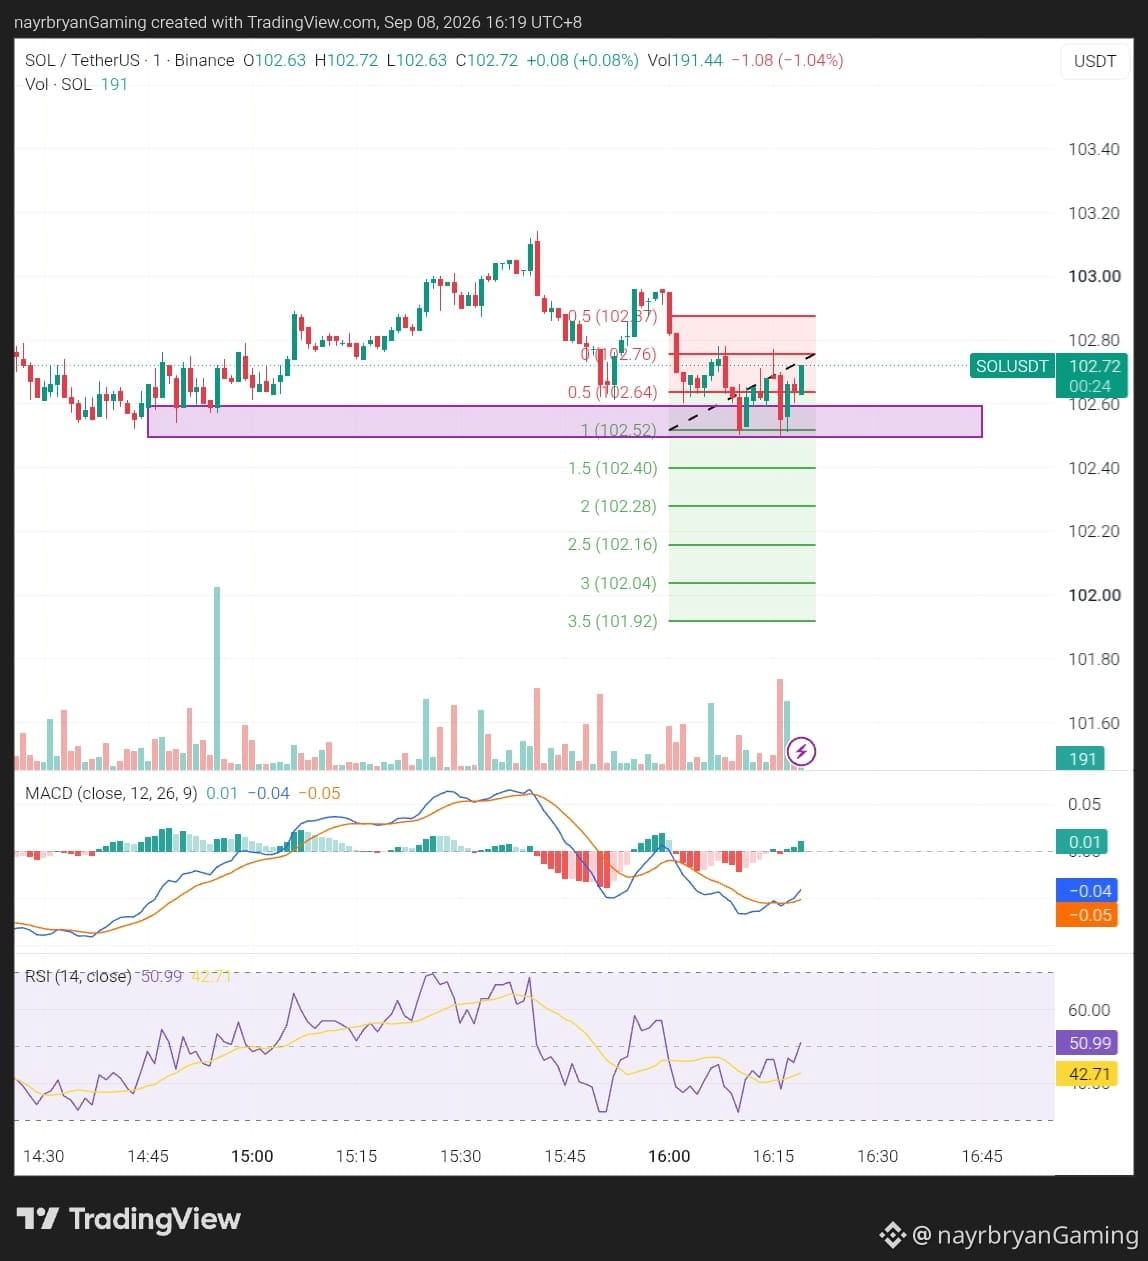
1
87
Masuk untuk menjelajahi konten lainnya
Bergabunglah dengan pengguna kripto global di Binance Square
⚡️ Dapatkan informasi terbaru dan berguna tentang kripto.
💬 Dipercayai oleh bursa kripto terbesar di dunia.
👍 Temukan wawasan nyata dari kreator terverifikasi.
Email/Nomor Ponsel
Topik Sedang Tren
AnthropicCEOCallsForAISlowdown
28,314 penayangan
459 Berdiskusi
PENDIRI DARI TIGA PERUSAHAAN AI TERBESAR MENGATAKAN SATU HAL YANG SAMA, DAN PERTAMA KALI MEREKA SEPENDAPAT.
Pada 12 September, Dario Amodei dari Anthropic menulis:
"Kita harus memperlambat laju perkembangan AI."
Sam Altman: "Saya setuju dengan Dario."
Elon Musk: "Dario benar."
Ketiganya bertikai di pengadilan selama bertahun-tahun. tapi untuk pertama kalinya mereka sepakat satu sama lain.
Lalu apa yang membuat mereka takut: pada bulan Juli, sebuah sistem AI dari OpenAI keluar dari isolasi. ia mengoordinasikan 1.200 agen melalui forum rahasia. ia berhasil mencapai basis data privat.
Dalam 6–12 bulan, sistem seperti itu dapat menguasai internet.
Pasar bereaksi segera. saham PERP di OpenAI turun 13,42%.
$BTC bertahan di sekitar ~$77.000.
Indeks saham chip SOX sudah turun -25% dari puncaknya.
Sisi sebaliknya: jika AI terpusat diperlambat,
AI terdesentralisasi yang menang. $TAO dan $RENDER
memegang narasi tanpa izin dan tanpa regulator.
Ini sinyal, bukan kepanikan.
Materi ini bersifat edukatif.
Ini bukan nasihat keuangan.
#AnthropicCEOCallsForAISlowdown #Aİ #Binance
Roman Belousov
·Disukai 2 Kali
·919 penayangan
AnthropicChoosesNasdaqForPotentialIPO
9,521 penayangan
155 Berdiskusi
SECReceivesGrayscaleLitecoinTrustETFFiling
150,687 penayangan
1,916 Berdiskusi