

BitcoinGuide
87 Posting

BitcoinGuide
Laporkan
Blokir Pengguna
I've been working as a chart analyst at TradingView for 10 years. You can check "Bitcoin" entry prices, target prices, stop-loss and trading paths in real time daily on a 30-minute candle chart. You'll be the experience a new world. Thank you.
0 Mengikuti
2 Pengikut
1 Disukai
Posting
Semua
Video
·
--
Lihat terjemahan
[OCTOBER 1 Bitcoin chart analysis]
BTCUSD 30Min Chart
*My analysis is optimized for TradingView.
If you press the replay button, you can check real-time movements.
-Long position strategy-
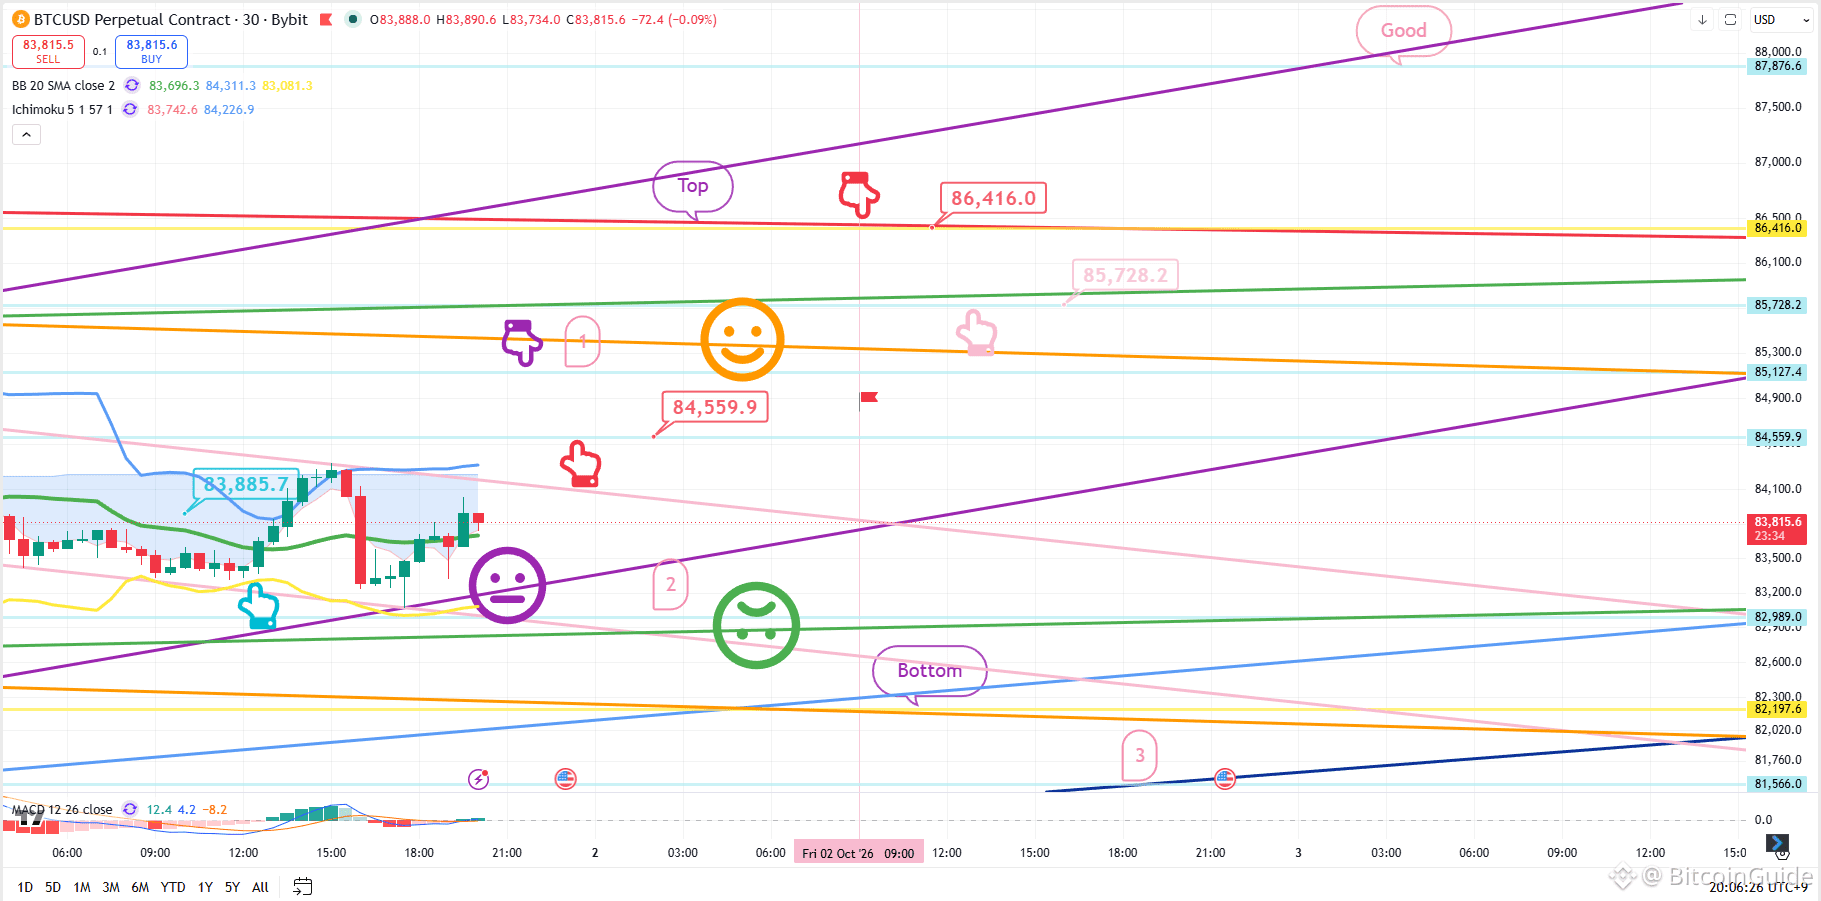
At the bottom left, indicated by the light blue finger, I have maintained the strategy for the long position entry point of $83,885.7 established yesterday.
Nasdaq economic data is scheduled for release at 11:00.
*Long position strategy based on touching the "Purple Finger 1" zone at the top:
1) After confirming a touch on "Purple Finger 1":
Long position entry at the red finger mark ($84,559.9) / Stop-loss if the purple support line is breached.
2) Top zone ($86,416) as the 1st target for the long position -> "Good" level as the 2nd target.
If the strategy succeeds, the $85.7K level can be used for re-entering a long position.
3) If the price drops without touching Zone 1:
Long position entry at Zone 2 ($82,989) / Stop-loss if the green support line is breached.
For those holding the $83.8K long position from yesterday,
it would be advisable to apply the same stop-loss level based on the green support line.
Once the green support line is breached,
the price could drop toward the "Bottom" zone marked below—potentially down to Zone 3—
so please exercise caution.
Although yesterday's monthly candle formed at the lower end,
it touched the Bollinger Bands' middle line;
therefore, if it holds without breaking the purple support line, the upward trend can continue.
I post the analysis results as a Comment every day.
Thank you.
(You can find the link on my profile.)
- Click Follow to receive faster information every day.
- Check the results using the replay button on TradingView.
#BTC100K #Altcoin Season# #Crypto #BTC Price Analysis# $ETH $XRP $USDT $BTC
[OCTOBER 1 Bitcoin chart analysis]
BTCUSD 30Min Chart
*My analysis is optimized for TradingView.
If you press the replay button, you can check real-time movements.
-Long position strategy-
At the bottom left, indicated by the light blue finger, I have maintained the strategy for the long position entry point of $83,885.7 established yesterday.
Nasdaq economic data is scheduled for release at 11:00.
*Long position strategy based on touching the "Purple Finger 1" zone at the top:
1) After confirming a touch on "Purple Finger 1":
Long position entry at the red finger mark ($84,559.9) / Stop-loss if the purple support line is breached.
2) Top zone ($86,416) as the 1st target for the long position -> "Good" level as the 2nd target.
If the strategy succeeds, the $85.7K level can be used for re-entering a long position.
3) If the price drops without touching Zone 1:
Long position entry at Zone 2 ($82,989) / Stop-loss if the green support line is breached.
For those holding the $83.8K long position from yesterday,
it would be advisable to apply the same stop-loss level based on the green support line.
Once the green support line is breached,
the price could drop toward the "Bottom" zone marked below—potentially down to Zone 3—
so please exercise caution.
Although yesterday's monthly candle formed at the lower end,
it touched the Bollinger Bands' middle line;
therefore, if it holds without breaking the purple support line, the upward trend can continue.
I post the analysis results as a Comment every day.
Thank you.
(You can find the link on my profile.)
- Click Follow to receive faster information every day.
- Check the results using the replay button on TradingView.
#BTC100K #Altcoin Season# #Crypto #BTC Price Analysis# $ETH $XRP $USDT $BTC
BTCUSD 30Min Chart
*My analysis is optimized for TradingView.
If you press the replay button, you can check real-time movements.
-Long position strategy-
At the bottom left, indicated by the light blue finger, I have maintained the strategy for the long position entry point of $83,885.7 established yesterday.
Nasdaq economic data is scheduled for release at 11:00.
*Long position strategy based on touching the "Purple Finger 1" zone at the top:
1) After confirming a touch on "Purple Finger 1":
Long position entry at the red finger mark ($84,559.9) / Stop-loss if the purple support line is breached.
2) Top zone ($86,416) as the 1st target for the long position -> "Good" level as the 2nd target.
If the strategy succeeds, the $85.7K level can be used for re-entering a long position.
3) If the price drops without touching Zone 1:
Long position entry at Zone 2 ($82,989) / Stop-loss if the green support line is breached.
For those holding the $83.8K long position from yesterday,
it would be advisable to apply the same stop-loss level based on the green support line.
Once the green support line is breached,
the price could drop toward the "Bottom" zone marked below—potentially down to Zone 3—
so please exercise caution.
Although yesterday's monthly candle formed at the lower end,
it touched the Bollinger Bands' middle line;
therefore, if it holds without breaking the purple support line, the upward trend can continue.
I post the analysis results as a Comment every day.
Thank you.
(You can find the link on my profile.)
- Click Follow to receive faster information every day.
- Check the results using the replay button on TradingView.
#BTC100K #Altcoin Season# #Crypto #BTC Price Analysis# $ETH $XRP $USDT $BTC
37
·
--
Lihat terjemahan
[September 30 Bitcoin chart analysis]
BTCUSD 30Min Chart
*My analysis is optimized for TradingView.
If you press the replay button, you can check real-time movements.
-Long position strategy-
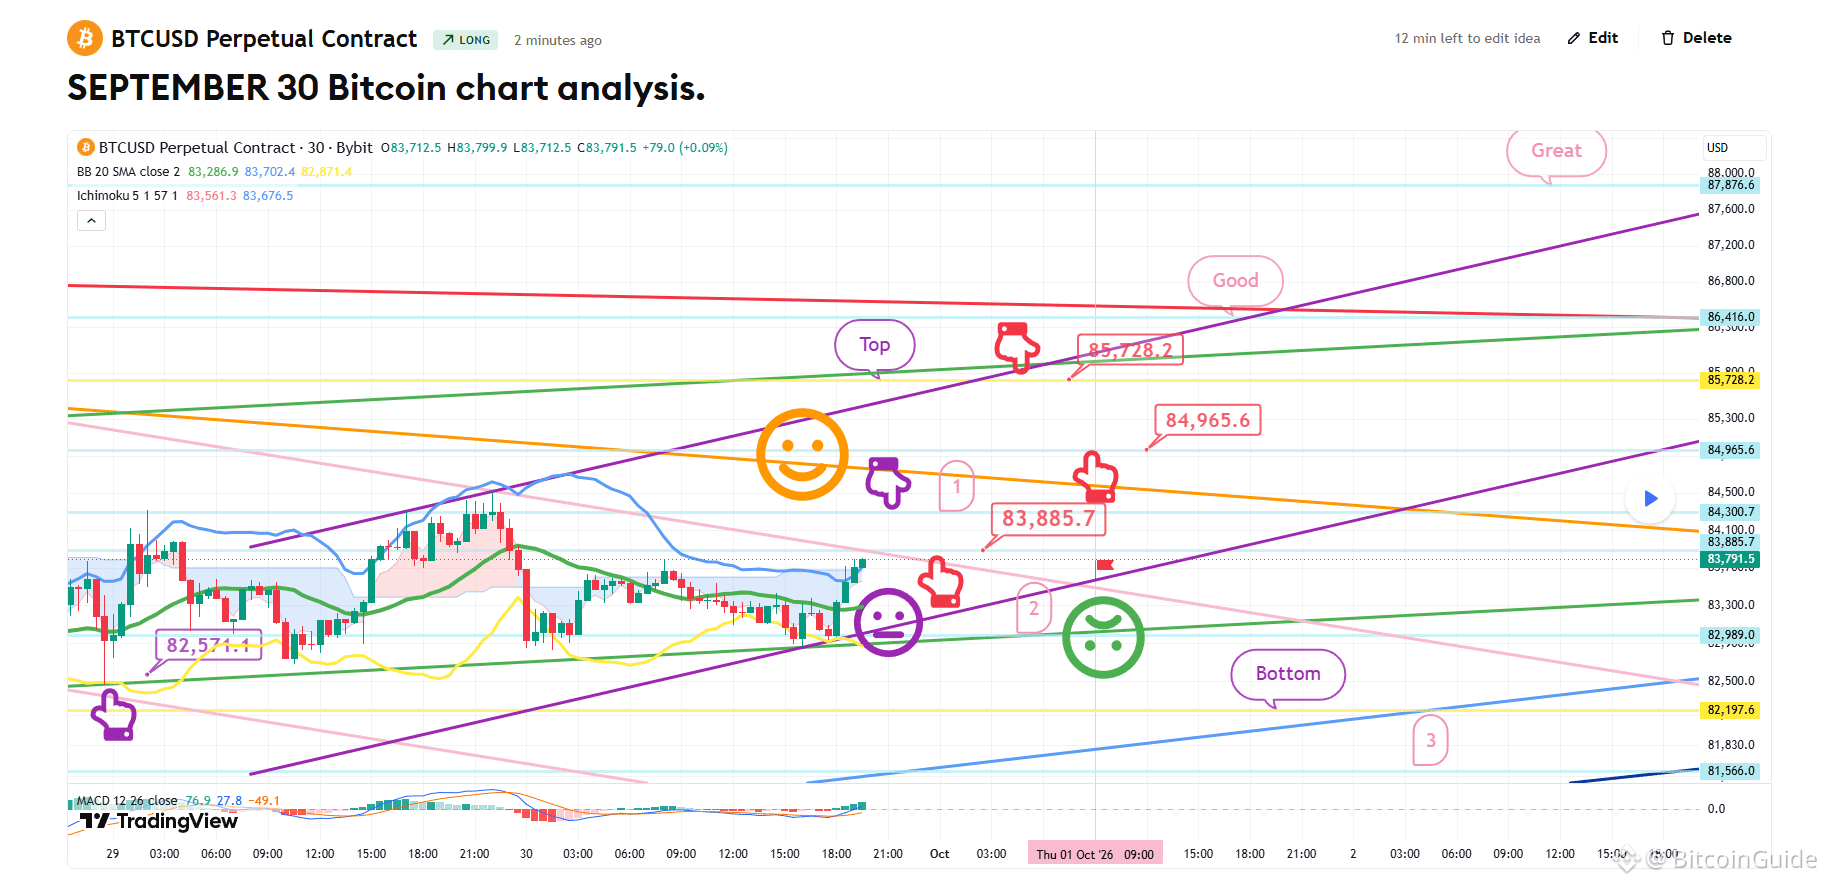
At the bottom left, indicated by a purple finger,
I have maintained the strategy for the long position entered on the 28th at $82,571.1.
*Long position strategy regarding the touch of the area marked by purple finger 1 at the top:
1) After confirming a touch on the area marked by purple finger 1 at the top,
look for a long entry at the level marked by the red finger ($83,885.7)
/ Stop-loss if the green support line is breached.
2) Top target area: $85,728.2 (1st target) -> Targets follow the sequence of "Good" then "Great."
If the strategy succeeds, the 84.9K level serves as a zone for re-entering a long position.
3) If the price drops without touching the area marked by purple finger 1,
wait for a long entry at the bottom area marked 1 / Stop-loss if the green support line is breached.
The same stop-loss level applies to those currently holding the 82.5K long position.
- Although the probability is very low before the new monthly candle forms tomorrow,
if the "Great" target is touched, a strong upward trend could continue.
This would increase the likelihood of hitting a new all-time high by the end of the year.
- If the price holds without breaking below the purple parallel lines,
there is a possibility of a vertical or strong upward surge.
- If the green support line is breached,
be aware that the price could drop toward the "Bottom" area—potentially down to the 3rd zone.
I post the analysis results as a Comment every day.
Thank you.
(You can find the link on my profile.)
- Click Follow to receive faster information every day.
- Check the results using the replay button on TradingView.
#BTC100K #BTC Price Analysis# #Altcoin Season# #Crypto #Trading $ETH $XRP $USDT $BTC
[September 30 Bitcoin chart analysis]
BTCUSD 30Min Chart
*My analysis is optimized for TradingView.
If you press the replay button, you can check real-time movements.
-Long position strategy-
At the bottom left, indicated by a purple finger,
I have maintained the strategy for the long position entered on the 28th at $82,571.1.
*Long position strategy regarding the touch of the area marked by purple finger 1 at the top:
1) After confirming a touch on the area marked by purple finger 1 at the top,
look for a long entry at the level marked by the red finger ($83,885.7)
/ Stop-loss if the green support line is breached.
2) Top target area: $85,728.2 (1st target) -> Targets follow the sequence of "Good" then "Great."
If the strategy succeeds, the 84.9K level serves as a zone for re-entering a long position.
3) If the price drops without touching the area marked by purple finger 1,
wait for a long entry at the bottom area marked 1 / Stop-loss if the green support line is breached.
The same stop-loss level applies to those currently holding the 82.5K long position.
- Although the probability is very low before the new monthly candle forms tomorrow,
if the "Great" target is touched, a strong upward trend could continue.
This would increase the likelihood of hitting a new all-time high by the end of the year.
- If the price holds without breaking below the purple parallel lines,
there is a possibility of a vertical or strong upward surge.
- If the green support line is breached,
be aware that the price could drop toward the "Bottom" area—potentially down to the 3rd zone.
I post the analysis results as a Comment every day.
Thank you.
(You can find the link on my profile.)
- Click Follow to receive faster information every day.
- Check the results using the replay button on TradingView.
#BTC100K #BTC Price Analysis# #Altcoin Season# #Crypto #Trading $ETH $XRP $USDT $BTC
BTCUSD 30Min Chart
*My analysis is optimized for TradingView.
If you press the replay button, you can check real-time movements.
-Long position strategy-
At the bottom left, indicated by a purple finger,
I have maintained the strategy for the long position entered on the 28th at $82,571.1.
*Long position strategy regarding the touch of the area marked by purple finger 1 at the top:
1) After confirming a touch on the area marked by purple finger 1 at the top,
look for a long entry at the level marked by the red finger ($83,885.7)
/ Stop-loss if the green support line is breached.
2) Top target area: $85,728.2 (1st target) -> Targets follow the sequence of "Good" then "Great."
If the strategy succeeds, the 84.9K level serves as a zone for re-entering a long position.
3) If the price drops without touching the area marked by purple finger 1,
wait for a long entry at the bottom area marked 1 / Stop-loss if the green support line is breached.
The same stop-loss level applies to those currently holding the 82.5K long position.
- Although the probability is very low before the new monthly candle forms tomorrow,
if the "Great" target is touched, a strong upward trend could continue.
This would increase the likelihood of hitting a new all-time high by the end of the year.
- If the price holds without breaking below the purple parallel lines,
there is a possibility of a vertical or strong upward surge.
- If the green support line is breached,
be aware that the price could drop toward the "Bottom" area—potentially down to the 3rd zone.
I post the analysis results as a Comment every day.
Thank you.
(You can find the link on my profile.)
- Click Follow to receive faster information every day.
- Check the results using the replay button on TradingView.
#BTC100K #BTC Price Analysis# #Altcoin Season# #Crypto #Trading $ETH $XRP $USDT $BTC
61
·
--
[Analisis chart Bitcoin 29 September]
Grafik BTCUSD 30Menit
*Analisis saya dioptimalkan untuk TradingView.
Jika Anda menekan tombol replay, Anda bisa memeriksa pergerakan secara real-time.
- Strategi netral-
Ini adalah grafik Bitcoin 30 menit.
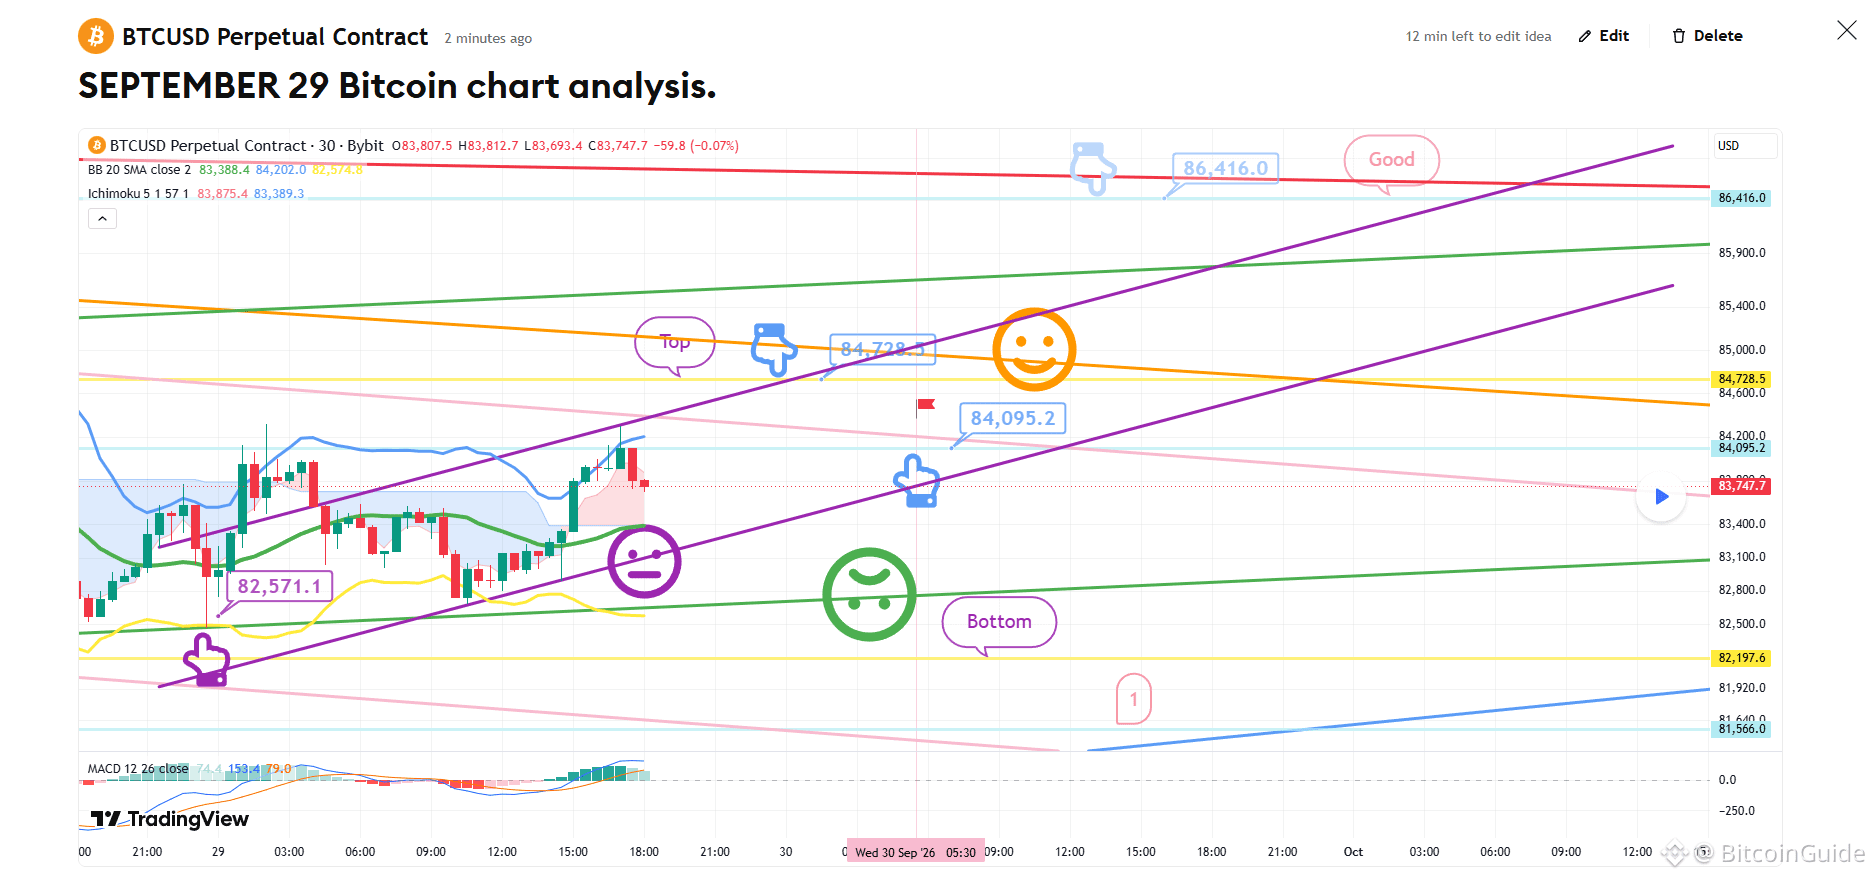
Di bagian kiri bawah, ditunjukkan oleh jari ungu,
saya telah mempertahankan strategi untuk posisi long yang masuk pada tanggal 28 di $82.571,1.
*Jika harga mengikuti jalur jari biru muda:
Strategi netral dua arah
1) Zona atas (jari biru muda):
Entry posisi short di $84.728,5 / Stop-loss jika garis resistance oranye terputus.
2) Zona re-entry untuk posisi long di $84.095,2 / Stop-loss jika garis support ungu terputus.
3) Zona target akhir (setelah besok): $86.416
/ Perhatikan MACD "death cross" yang terkonfirmasi pada chart harian.
4) Jika garis support ungu terputus,
ada kemungkinan pergerakan sideways atau penurunan lanjutan.
Bagi yang saat ini memegang posisi di atas $82,5K,
disarankan untuk memasang stop-loss berdasarkan terputusnya garis support hijau terakhir.
Jika garis support hijau terputus,
harga bisa turun ke zona "Bottom" yang ditandai di bagian bawah (hingga Zone 1),
jadi mohon berhati-hati.
Karena saat ini ada korelasi yang kuat ("forced coupling") dengan Nasdaq,
mohon terus memantau pergerakan Nasdaq.
Saya memposting hasil analisis sebagai Komentar setiap hari.
Terima kasih.
(Anda bisa menemukan tautannya di profil saya.)
- Klik Follow untuk mendapatkan informasi lebih cepat setiap hari.
- Cek hasilnya menggunakan tombol replay di TradingView.
#AnalisisHargaBTC# #Crypto #MusimAltcoin# $XRP $USDC $USDT $BTC
[Analisis chart Bitcoin 29 September]
Grafik BTCUSD 30Menit
*Analisis saya dioptimalkan untuk TradingView.
Jika Anda menekan tombol replay, Anda bisa memeriksa pergerakan secara real-time.
- Strategi netral-
Ini adalah grafik Bitcoin 30 menit.
Di bagian kiri bawah, ditunjukkan oleh jari ungu,
saya telah mempertahankan strategi untuk posisi long yang masuk pada tanggal 28 di $82.571,1.
*Jika harga mengikuti jalur jari biru muda:
Strategi netral dua arah
1) Zona atas (jari biru muda):
Entry posisi short di $84.728,5 / Stop-loss jika garis resistance oranye terputus.
2) Zona re-entry untuk posisi long di $84.095,2 / Stop-loss jika garis support ungu terputus.
3) Zona target akhir (setelah besok): $86.416
/ Perhatikan MACD "death cross" yang terkonfirmasi pada chart harian.
4) Jika garis support ungu terputus,
ada kemungkinan pergerakan sideways atau penurunan lanjutan.
Bagi yang saat ini memegang posisi di atas $82,5K,
disarankan untuk memasang stop-loss berdasarkan terputusnya garis support hijau terakhir.
Jika garis support hijau terputus,
harga bisa turun ke zona "Bottom" yang ditandai di bagian bawah (hingga Zone 1),
jadi mohon berhati-hati.
Karena saat ini ada korelasi yang kuat ("forced coupling") dengan Nasdaq,
mohon terus memantau pergerakan Nasdaq.
Saya memposting hasil analisis sebagai Komentar setiap hari.
Terima kasih.
(Anda bisa menemukan tautannya di profil saya.)
- Klik Follow untuk mendapatkan informasi lebih cepat setiap hari.
- Cek hasilnya menggunakan tombol replay di TradingView.
#AnalisisHargaBTC# #Crypto #MusimAltcoin# $XRP $USDC $USDT $BTC
Grafik BTCUSD 30Menit
*Analisis saya dioptimalkan untuk TradingView.
Jika Anda menekan tombol replay, Anda bisa memeriksa pergerakan secara real-time.
- Strategi netral-
Ini adalah grafik Bitcoin 30 menit.
Di bagian kiri bawah, ditunjukkan oleh jari ungu,
saya telah mempertahankan strategi untuk posisi long yang masuk pada tanggal 28 di $82.571,1.
*Jika harga mengikuti jalur jari biru muda:
Strategi netral dua arah
1) Zona atas (jari biru muda):
Entry posisi short di $84.728,5 / Stop-loss jika garis resistance oranye terputus.
2) Zona re-entry untuk posisi long di $84.095,2 / Stop-loss jika garis support ungu terputus.
3) Zona target akhir (setelah besok): $86.416
/ Perhatikan MACD "death cross" yang terkonfirmasi pada chart harian.
4) Jika garis support ungu terputus,
ada kemungkinan pergerakan sideways atau penurunan lanjutan.
Bagi yang saat ini memegang posisi di atas $82,5K,
disarankan untuk memasang stop-loss berdasarkan terputusnya garis support hijau terakhir.
Jika garis support hijau terputus,
harga bisa turun ke zona "Bottom" yang ditandai di bagian bawah (hingga Zone 1),
jadi mohon berhati-hati.
Karena saat ini ada korelasi yang kuat ("forced coupling") dengan Nasdaq,
mohon terus memantau pergerakan Nasdaq.
Saya memposting hasil analisis sebagai Komentar setiap hari.
Terima kasih.
(Anda bisa menemukan tautannya di profil saya.)
- Klik Follow untuk mendapatkan informasi lebih cepat setiap hari.
- Cek hasilnya menggunakan tombol replay di TradingView.
#AnalisisHargaBTC# #Crypto #MusimAltcoin# $XRP $USDC $USDT $BTC
69
·
--
[Analisis chart Bitcoin 28 September]
Grafik BTCUSD 30 Menit
*Analisis saya dioptimalkan untuk TradingView.
Jika Anda menekan tombol replay, Anda dapat memeriksa pergerakan real-time.
-Strategi dua arah netral-
Saat ini, Nasdaq sedang menunjukkan "death cross" pada chart 12 jam,
sementara Bitcoin mengalami "death cross" MACD pada chart harian.
Mengingat kita berada pada titik di mana koreksi sangat mungkin terjadi,
saya telah menyiapkan strategi netral dua arah.
*Strategi yang melibatkan peralihan dari short ke long, atau menunggu posisi long,
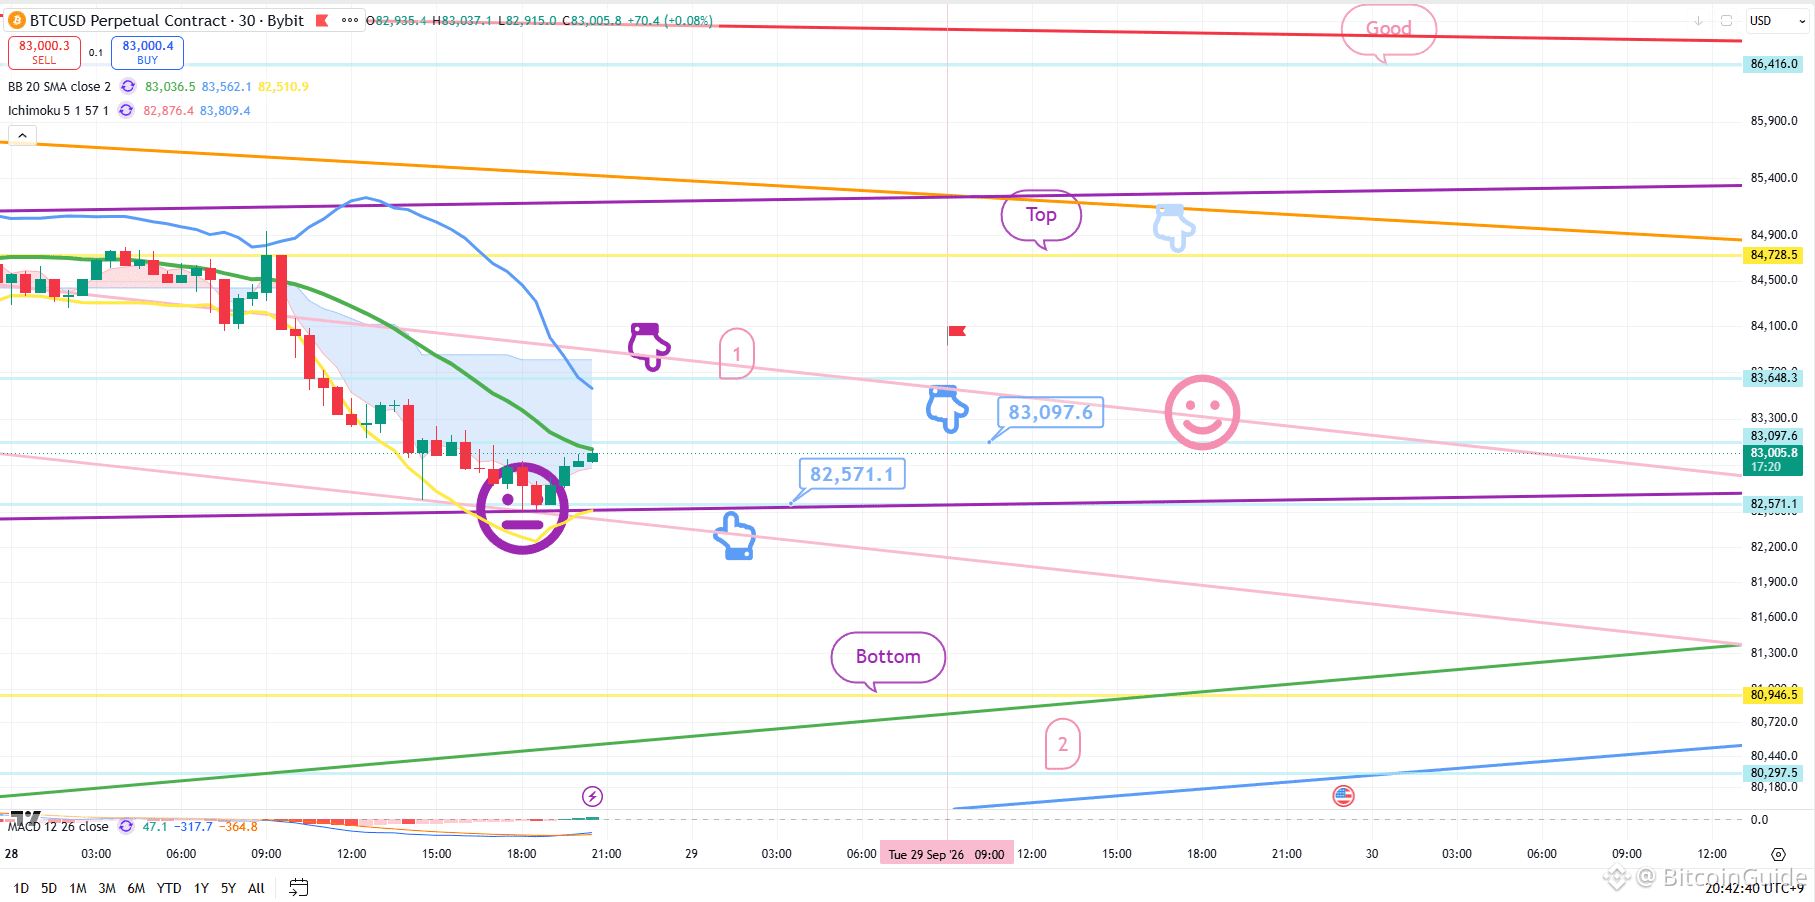
berdasarkan sentuhan pada zona "jari ungu" (Zone 1) di bagian atas:
1) Saat menyentuh zona "jari ungu" (Zone 1) di bagian atas:
Titik masuk untuk posisi short; stop-loss jika garis resistensi pink terputus.
2) Beralih ke posisi long pada level "jari biru langit" ($82,571.1) di bagian bawah;
stop-loss jika garis support ungu ditembus.
-> Harga target akhir ditetapkan untuk zona "Atas" mulai besok dan seterusnya.
- Jika harga langsung menembus di bawah garis support ungu:
Titik masuk posisi long terakhir berada di "Zone 2" (paling bawah).
Jika harga menyentuh zona "Bawah" dan menutup di sana:
Pergerakan lebih ke bawah bisa berlanjut mulai besok dan seterusnya.
Saya memposting hasil analisis sebagai Komentar setiap hari.
Terima kasih.
(Anda dapat menemukan tautannya di profil saya.)
- Klik Follow untuk menerima informasi lebih cepat setiap hari.
- Cek hasilnya menggunakan tombol replay di TradingView.
#Analisis Harga BTC# #Crypto #AltcoinSeason# #Emas #ETH $USDC $TRX $XRP $BTC
[Analisis chart Bitcoin 28 September]
Grafik BTCUSD 30 Menit
*Analisis saya dioptimalkan untuk TradingView.
Jika Anda menekan tombol replay, Anda dapat memeriksa pergerakan real-time.
-Strategi dua arah netral-
Saat ini, Nasdaq sedang menunjukkan "death cross" pada chart 12 jam,
sementara Bitcoin mengalami "death cross" MACD pada chart harian.
Mengingat kita berada pada titik di mana koreksi sangat mungkin terjadi,
saya telah menyiapkan strategi netral dua arah.
*Strategi yang melibatkan peralihan dari short ke long, atau menunggu posisi long,
berdasarkan sentuhan pada zona "jari ungu" (Zone 1) di bagian atas:
1) Saat menyentuh zona "jari ungu" (Zone 1) di bagian atas:
Titik masuk untuk posisi short; stop-loss jika garis resistensi pink terputus.
2) Beralih ke posisi long pada level "jari biru langit" ($82,571.1) di bagian bawah;
stop-loss jika garis support ungu ditembus.
-> Harga target akhir ditetapkan untuk zona "Atas" mulai besok dan seterusnya.
- Jika harga langsung menembus di bawah garis support ungu:
Titik masuk posisi long terakhir berada di "Zone 2" (paling bawah).
Jika harga menyentuh zona "Bawah" dan menutup di sana:
Pergerakan lebih ke bawah bisa berlanjut mulai besok dan seterusnya.
Saya memposting hasil analisis sebagai Komentar setiap hari.
Terima kasih.
(Anda dapat menemukan tautannya di profil saya.)
- Klik Follow untuk menerima informasi lebih cepat setiap hari.
- Cek hasilnya menggunakan tombol replay di TradingView.
#Analisis Harga BTC# #Crypto #AltcoinSeason# #Emas #ETH $USDC $TRX $XRP $BTC
Grafik BTCUSD 30 Menit
*Analisis saya dioptimalkan untuk TradingView.
Jika Anda menekan tombol replay, Anda dapat memeriksa pergerakan real-time.
-Strategi dua arah netral-
Saat ini, Nasdaq sedang menunjukkan "death cross" pada chart 12 jam,
sementara Bitcoin mengalami "death cross" MACD pada chart harian.
Mengingat kita berada pada titik di mana koreksi sangat mungkin terjadi,
saya telah menyiapkan strategi netral dua arah.
*Strategi yang melibatkan peralihan dari short ke long, atau menunggu posisi long,
berdasarkan sentuhan pada zona "jari ungu" (Zone 1) di bagian atas:
1) Saat menyentuh zona "jari ungu" (Zone 1) di bagian atas:
Titik masuk untuk posisi short; stop-loss jika garis resistensi pink terputus.
2) Beralih ke posisi long pada level "jari biru langit" ($82,571.1) di bagian bawah;
stop-loss jika garis support ungu ditembus.
-> Harga target akhir ditetapkan untuk zona "Atas" mulai besok dan seterusnya.
- Jika harga langsung menembus di bawah garis support ungu:
Titik masuk posisi long terakhir berada di "Zone 2" (paling bawah).
Jika harga menyentuh zona "Bawah" dan menutup di sana:
Pergerakan lebih ke bawah bisa berlanjut mulai besok dan seterusnya.
Saya memposting hasil analisis sebagai Komentar setiap hari.
Terima kasih.
(Anda dapat menemukan tautannya di profil saya.)
- Klik Follow untuk menerima informasi lebih cepat setiap hari.
- Cek hasilnya menggunakan tombol replay di TradingView.
#Analisis Harga BTC# #Crypto #AltcoinSeason# #Emas #ETH $USDC $TRX $XRP $BTC
61
·
--
[Analisis grafik Bitcoin 23 September]
Grafik BTCUSD 30 Menit
*Analisis saya dioptimalkan untuk TradingView.
Jika Anda menekan tombol replay, Anda bisa memeriksa pergerakan secara real-time.
-Strategi posisi long-
Ini adalah grafik Bitcoin 30 menit.
Meskipun koreksi kemungkinan terjadi untuk Nasdaq,
Bitcoin tampaknya sangat mungkin bergerak sideways pada level ini.
Saya mengabaikan "death cross" MACD pada grafik 6 jam.
Juga, saya menafsirkan grafik bulanan seolah-olah belum menyentuh garis tengah Bollinger Bands.
*Jika harga mengikuti jalur yang ditunjukkan oleh panah merah:
Strategi posisi long
1) Zona entry long: $85,871.9 / Level stop-loss: Jika garis support ungu ditembus
2) Target 1 posisi long: $87,876.6 -> target 2: zona puncak
Level $87,114.4 adalah area yang dapat dipertimbangkan untuk re-enter long.
Bahkan jika harga turun setelah periode pergerakan sideways,
pola bullish tetap terjaga,
sehingga area hingga level "Bottom" dianggap sebagai zona aman.
Jika garis support ungu ditembus,
mohon diperhatikan bahwa harga bisa turun ke level "Bottom" yang ditandai di bawah,
lalu ke level 1, dan berpotensi serendah $83,699.9 hingga akhir pekan.
Korea Selatan merayakan libur Chuseok (Festival Musim Gugur Pertengahan) mulai besok hingga tanggal 27.
Saya akan beristirahat dengan baik selama akhir pekan dan kembali pada hari Senin depan.
Saya memposting hasil analisis sebagai Komentar setiap hari.
Terima kasih.
(Anda bisa menemukan tautannya di profil saya.)
- Klik Follow untuk mendapatkan informasi lebih cepat setiap hari.
- Periksa hasilnya menggunakan tombol replay di TradingView.
#Bitcoin #BTC100K #Crypto #Altcoin Season# #BTC Price Analysis# $ETH $USDT $BTC $BNB $XRP
[Analisis grafik Bitcoin 23 September]
Grafik BTCUSD 30 Menit
*Analisis saya dioptimalkan untuk TradingView.
Jika Anda menekan tombol replay, Anda bisa memeriksa pergerakan secara real-time.
-Strategi posisi long-
Ini adalah grafik Bitcoin 30 menit.
Meskipun koreksi kemungkinan terjadi untuk Nasdaq,
Bitcoin tampaknya sangat mungkin bergerak sideways pada level ini.
Saya mengabaikan "death cross" MACD pada grafik 6 jam.
Juga, saya menafsirkan grafik bulanan seolah-olah belum menyentuh garis tengah Bollinger Bands.
*Jika harga mengikuti jalur yang ditunjukkan oleh panah merah:
Strategi posisi long
1) Zona entry long: $85,871.9 / Level stop-loss: Jika garis support ungu ditembus
2) Target 1 posisi long: $87,876.6 -> target 2: zona puncak
Level $87,114.4 adalah area yang dapat dipertimbangkan untuk re-enter long.
Bahkan jika harga turun setelah periode pergerakan sideways,
pola bullish tetap terjaga,
sehingga area hingga level "Bottom" dianggap sebagai zona aman.
Jika garis support ungu ditembus,
mohon diperhatikan bahwa harga bisa turun ke level "Bottom" yang ditandai di bawah,
lalu ke level 1, dan berpotensi serendah $83,699.9 hingga akhir pekan.
Korea Selatan merayakan libur Chuseok (Festival Musim Gugur Pertengahan) mulai besok hingga tanggal 27.
Saya akan beristirahat dengan baik selama akhir pekan dan kembali pada hari Senin depan.
Saya memposting hasil analisis sebagai Komentar setiap hari.
Terima kasih.
(Anda bisa menemukan tautannya di profil saya.)
- Klik Follow untuk mendapatkan informasi lebih cepat setiap hari.
- Periksa hasilnya menggunakan tombol replay di TradingView.
#Bitcoin #BTC100K #Crypto #Altcoin Season# #BTC Price Analysis# $ETH $USDT $BTC $BNB $XRP
Grafik BTCUSD 30 Menit
*Analisis saya dioptimalkan untuk TradingView.
Jika Anda menekan tombol replay, Anda bisa memeriksa pergerakan secara real-time.
-Strategi posisi long-
Ini adalah grafik Bitcoin 30 menit.
Meskipun koreksi kemungkinan terjadi untuk Nasdaq,
Bitcoin tampaknya sangat mungkin bergerak sideways pada level ini.
Saya mengabaikan "death cross" MACD pada grafik 6 jam.
Juga, saya menafsirkan grafik bulanan seolah-olah belum menyentuh garis tengah Bollinger Bands.
*Jika harga mengikuti jalur yang ditunjukkan oleh panah merah:
Strategi posisi long
1) Zona entry long: $85,871.9 / Level stop-loss: Jika garis support ungu ditembus
2) Target 1 posisi long: $87,876.6 -> target 2: zona puncak
Level $87,114.4 adalah area yang dapat dipertimbangkan untuk re-enter long.
Bahkan jika harga turun setelah periode pergerakan sideways,
pola bullish tetap terjaga,
sehingga area hingga level "Bottom" dianggap sebagai zona aman.
Jika garis support ungu ditembus,
mohon diperhatikan bahwa harga bisa turun ke level "Bottom" yang ditandai di bawah,
lalu ke level 1, dan berpotensi serendah $83,699.9 hingga akhir pekan.
Korea Selatan merayakan libur Chuseok (Festival Musim Gugur Pertengahan) mulai besok hingga tanggal 27.
Saya akan beristirahat dengan baik selama akhir pekan dan kembali pada hari Senin depan.
Saya memposting hasil analisis sebagai Komentar setiap hari.
Terima kasih.
(Anda bisa menemukan tautannya di profil saya.)
- Klik Follow untuk mendapatkan informasi lebih cepat setiap hari.
- Periksa hasilnya menggunakan tombol replay di TradingView.
#Bitcoin #BTC100K #Crypto #Altcoin Season# #BTC Price Analysis# $ETH $USDT $BTC $BNB $XRP
86
·
--
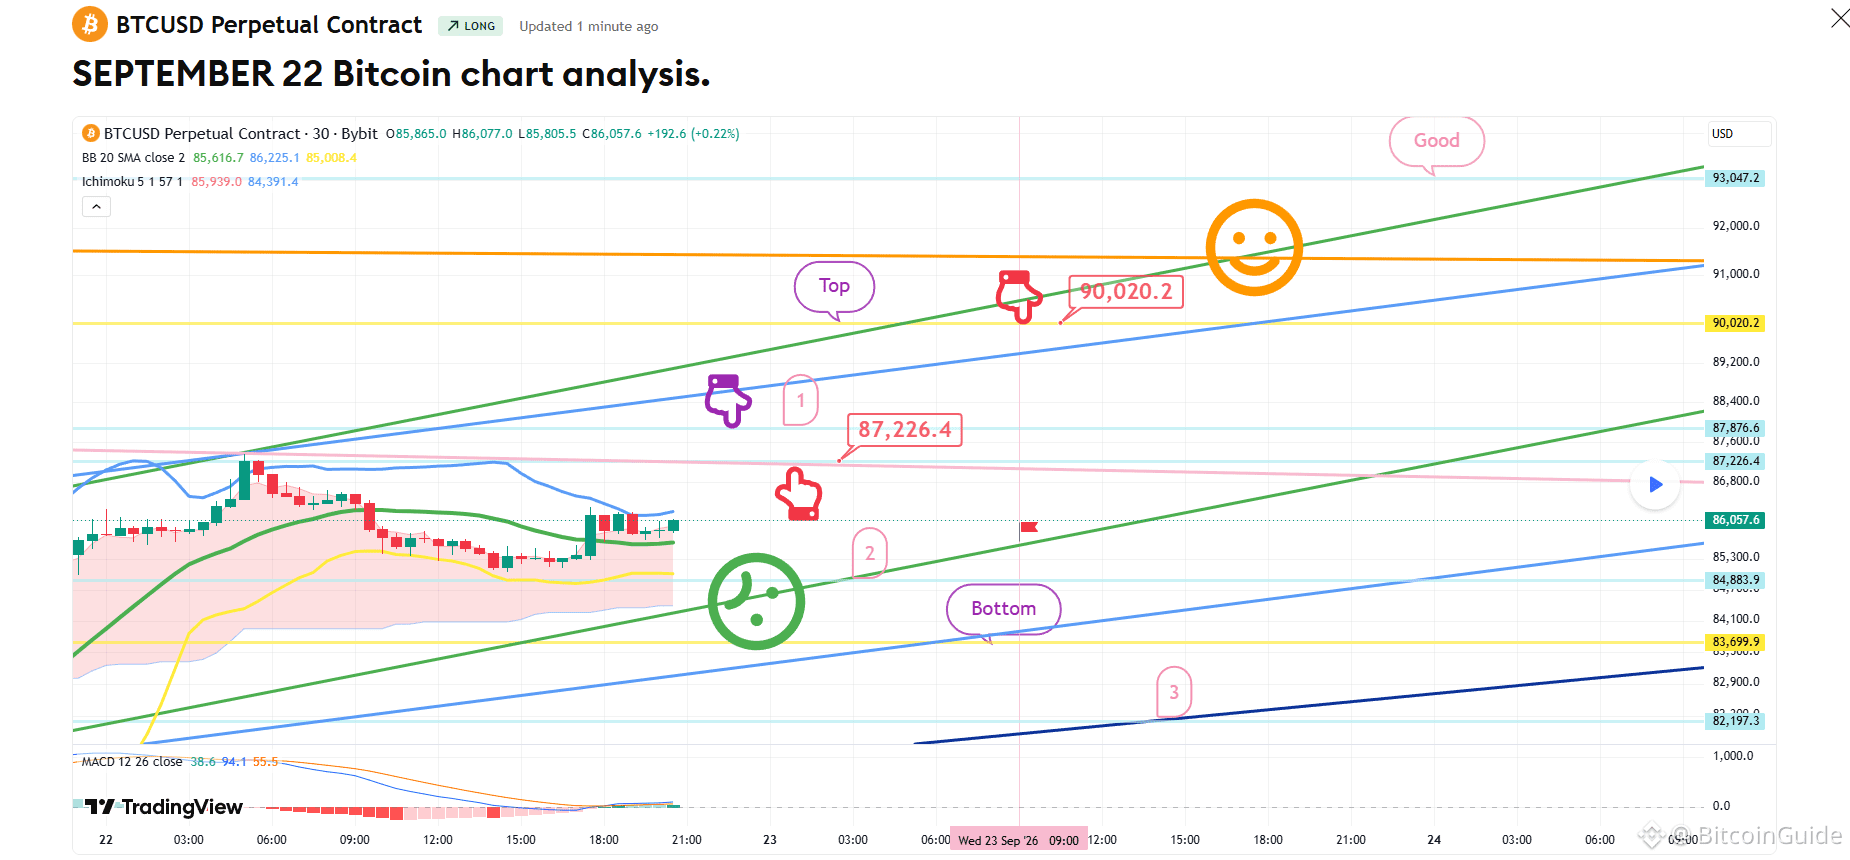
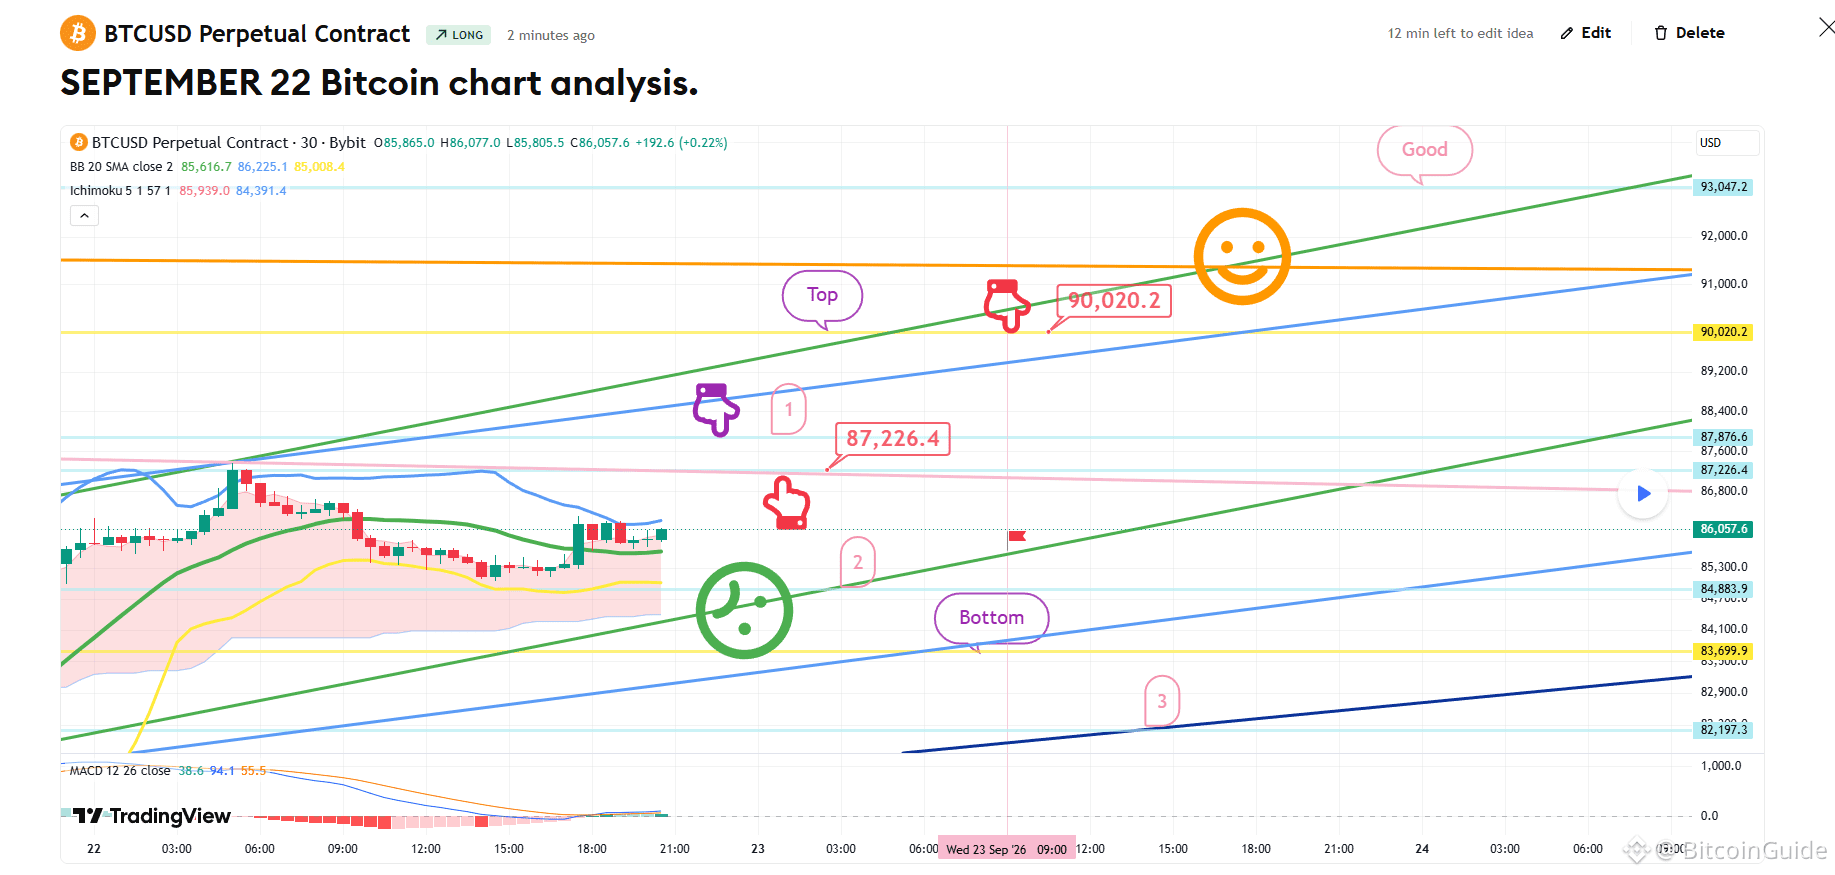
[Analisis Bagan Bitcoin 22 September] Bagan BTCUSD 30Menit *Analisis saya dioptimalkan untuk TradingView. Jika Anda menekan tombol replay, Anda dapat memeriksa pergerakan real-time. -Strategi posisi Long- *Strategi posisi long berfokus pada area yang ditandai oleh jari ungu (berlabel "1")—khususnya, pergerakan sebelum dan sesudah menyentuhnya. 1) Setelah mengonfirmasi sentuhan di zona jari ungu (87,876.6 USD): Masuk posisi long di zona jari merah (87,226.4 USD); tetapkan level stop-loss pada titik ketika garis support hijau terlewati. 2) Zona atas (90,0020.2 USD) adalah target pertama untuk posisi long -> zona "Good" adalah target kedua. 3) Jika harga turun segera tanpa menyentuh zona jari ungu: Strateginya adalah menunggu entry long di zona bawah yang ditandai "2." Mohon berhati-hati: jika garis support hijau terputus, harga dapat turun ke level yang ditandai "Bottom" atau bahkan turun ke zona "3." Saya memposting hasil analisis sebagai Komentar setiap hari. Terima kasih. (Anda bisa menemukan tautannya di profil saya.) - Klik Follow untuk menerima informasi lebih cepat setiap hari. - Periksa hasilnya menggunakan tombol replay di TradingView. #Bitcoin #Crypto# #XRP #BTC100K $USDT $XRP $BTC $ETH
[Analisis Bagan Bitcoin 22 September] Bagan BTCUSD 30Menit *Analisis saya dioptimalkan untuk TradingView. Jika Anda menekan tombol replay, Anda dapat memeriksa pergerakan real-time. -Strategi posisi Long- *Strategi posisi long berfokus pada area yang ditandai oleh jari ungu (berlabel "1")—khususnya, pergerakan sebelum dan sesudah menyentuhnya. 1) Setelah mengonfirmasi sentuhan di zona jari ungu (87,876.6 USD): Masuk posisi long di zona jari merah (87,226.4 USD); tetapkan level stop-loss pada titik ketika garis support hijau terlewati. 2) Zona atas (90,0020.2 USD) adalah target pertama untuk posisi long -> zona "Good" adalah target kedua. 3) Jika harga turun segera tanpa menyentuh zona jari ungu: Strateginya adalah menunggu entry long di zona bawah yang ditandai "2." Mohon berhati-hati: jika garis support hijau terputus, harga dapat turun ke level yang ditandai "Bottom" atau bahkan turun ke zona "3." Saya memposting hasil analisis sebagai Komentar setiap hari. Terima kasih. (Anda bisa menemukan tautannya di profil saya.) - Klik Follow untuk menerima informasi lebih cepat setiap hari. - Periksa hasilnya menggunakan tombol replay di TradingView. #Bitcoin #Crypto# #XRP #BTC100K $USDT $XRP $BTC $ETH
55
·
--
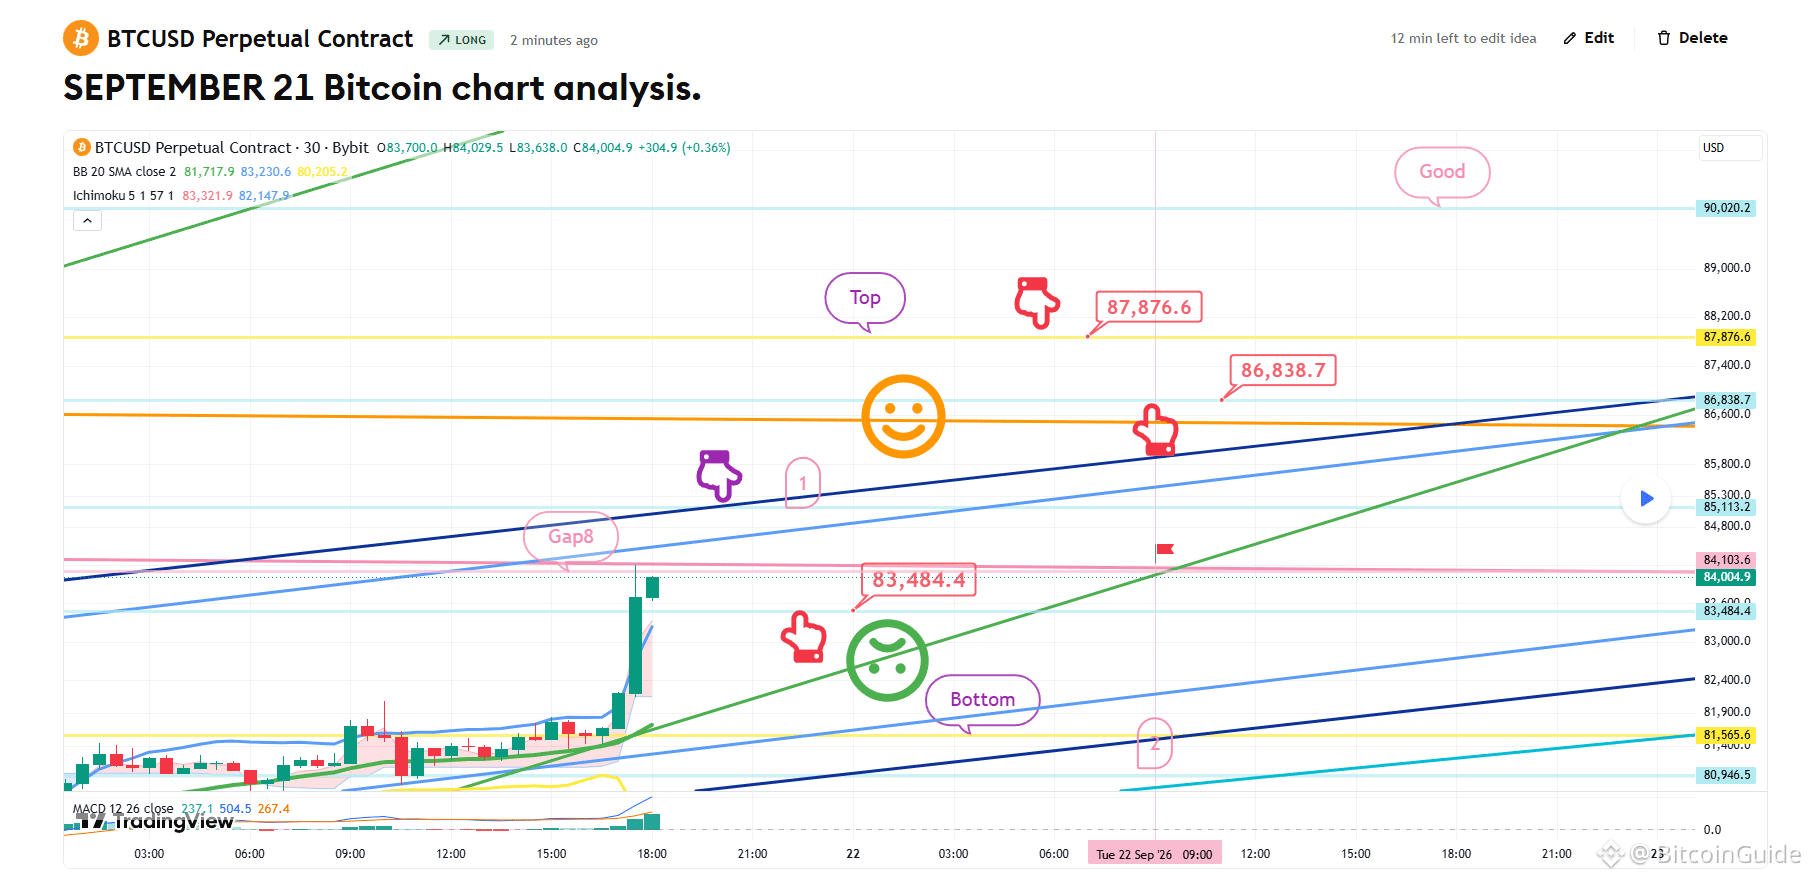
[Analisis grafik Bitcoin 21 September]
Grafik BTCUSD 30Menit
*Analisis saya dioptimalkan untuk TradingView.
Jika Anda menekan tombol replay, Anda bisa memeriksa pergerakan secara real-time.
- Strategi posisi long -
1) Terlepas dari apakah harga menyentuh penanda panah ungu (berlabel "1")—yang biasanya diikuti lonjakan vertikal—
Masuk posisi long pada level panah merah ($83.484,4); pasang stop-loss di titik ketika garis support hijau ditembus.
2) Target utama untuk posisi long adalah zona "Top" $87.876,6; level "Good" berfungsi sebagai target sekunder.
Jika strategi berhasil, zona 86,8K yang ditandai dapat digunakan untuk masuk long kembali.
Jika garis support hijau ditembus:
Harga bisa turun ke zona "Bottom" yang ditandai di bagian bawah—berpotensi meluas hingga penanda "2".
Saya memposting hasil analisis sebagai Komentar setiap hari.
Terima kasih.
(Anda bisa menemukan tautannya di profil saya.)
- Klik Follow untuk menerima informasi lebih cepat setiap hari.
- Cek hasilnya menggunakan tombol replay di TradingView.
#Analisis Harga BTC# #Musim Altcoin# #Kripto# #BTC100K $BTC $USDT $XRP $ETH
[Analisis grafik Bitcoin 21 September]
Grafik BTCUSD 30Menit
*Analisis saya dioptimalkan untuk TradingView.
Jika Anda menekan tombol replay, Anda bisa memeriksa pergerakan secara real-time.
- Strategi posisi long -
1) Terlepas dari apakah harga menyentuh penanda panah ungu (berlabel "1")—yang biasanya diikuti lonjakan vertikal—
Masuk posisi long pada level panah merah ($83.484,4); pasang stop-loss di titik ketika garis support hijau ditembus.
2) Target utama untuk posisi long adalah zona "Top" $87.876,6; level "Good" berfungsi sebagai target sekunder.
Jika strategi berhasil, zona 86,8K yang ditandai dapat digunakan untuk masuk long kembali.
Jika garis support hijau ditembus:
Harga bisa turun ke zona "Bottom" yang ditandai di bagian bawah—berpotensi meluas hingga penanda "2".
Saya memposting hasil analisis sebagai Komentar setiap hari.
Terima kasih.
(Anda bisa menemukan tautannya di profil saya.)
- Klik Follow untuk menerima informasi lebih cepat setiap hari.
- Cek hasilnya menggunakan tombol replay di TradingView.
#Analisis Harga BTC# #Musim Altcoin# #Kripto# #BTC100K $BTC $USDT $XRP $ETH
Grafik BTCUSD 30Menit
*Analisis saya dioptimalkan untuk TradingView.
Jika Anda menekan tombol replay, Anda bisa memeriksa pergerakan secara real-time.
- Strategi posisi long -
1) Terlepas dari apakah harga menyentuh penanda panah ungu (berlabel "1")—yang biasanya diikuti lonjakan vertikal—
Masuk posisi long pada level panah merah ($83.484,4); pasang stop-loss di titik ketika garis support hijau ditembus.
2) Target utama untuk posisi long adalah zona "Top" $87.876,6; level "Good" berfungsi sebagai target sekunder.
Jika strategi berhasil, zona 86,8K yang ditandai dapat digunakan untuk masuk long kembali.
Jika garis support hijau ditembus:
Harga bisa turun ke zona "Bottom" yang ditandai di bagian bawah—berpotensi meluas hingga penanda "2".
Saya memposting hasil analisis sebagai Komentar setiap hari.
Terima kasih.
(Anda bisa menemukan tautannya di profil saya.)
- Klik Follow untuk menerima informasi lebih cepat setiap hari.
- Cek hasilnya menggunakan tombol replay di TradingView.
#Analisis Harga BTC# #Musim Altcoin# #Kripto# #BTC100K $BTC $USDT $XRP $ETH
62
·
--
Lihat terjemahan
[September 11 Bitcoin chart analysis]
BTCUSD 30Min Chart
*My analysis is optimized for TradingView.
If you press the replay button, you can check real-time movements.
-Long position strategy-
At the bottom left, I have maintained the strategy for the long position entry point of $76,999.4 (marked with a purple finger), which was established on September 10th.
The CPI data release is scheduled for 9:30 shortly.
*Long position strategy regarding the upper "Purple Finger 1" zone:
1) After confirming a touch of the "Purple Finger 1" zone at $78,360.4:
Long position entry at $77,743.5 (red finger); stop-loss if the purple support line is breached.
2) First target for the long position at $79,558.7 ->
Subsequent targets for the weekend: "Good" followed by "Great."
- If the strategy succeeds, the $78.9K level can be used for re-entering a long position.
3) If the price drops directly without touching the "Purple Finger 1" zone:
Long position entry at the lower "Zone 2" ($76,748.2); stop-loss if the purple support line is breached.
- For those currently holding the $76.9K long position, you may apply the same stop-loss rule (exit if the purple support line is breached).
- If the purple support line breaks, the price moves to the "Bottom" zone (the final support line of the rising channel).
- Although not visible on the chart, there is potential downside room down to $74.9K below that level.
Please use this analysis solely for reference and planning purposes.
I hope you trade safely by adhering to your principles and using stop-loss orders.
I post the analysis results as a Comment every day.
Thank you.
(You can find the link on my profile.)
- Click Follow to receive faster information every day.
- Check the results using the replay button on TradingView.
#BTC Price Analysis# #BNBChain# #BTC100K #Altcoin Season# $USDT $ETH $XRP $SOL $BTC
[September 11 Bitcoin chart analysis]
BTCUSD 30Min Chart
*My analysis is optimized for TradingView.
If you press the replay button, you can check real-time movements.
-Long position strategy-
At the bottom left, I have maintained the strategy for the long position entry point of $76,999.4 (marked with a purple finger), which was established on September 10th.
The CPI data release is scheduled for 9:30 shortly.
*Long position strategy regarding the upper "Purple Finger 1" zone:
1) After confirming a touch of the "Purple Finger 1" zone at $78,360.4:
Long position entry at $77,743.5 (red finger); stop-loss if the purple support line is breached.
2) First target for the long position at $79,558.7 ->
Subsequent targets for the weekend: "Good" followed by "Great."
- If the strategy succeeds, the $78.9K level can be used for re-entering a long position.
3) If the price drops directly without touching the "Purple Finger 1" zone:
Long position entry at the lower "Zone 2" ($76,748.2); stop-loss if the purple support line is breached.
- For those currently holding the $76.9K long position, you may apply the same stop-loss rule (exit if the purple support line is breached).
- If the purple support line breaks, the price moves to the "Bottom" zone (the final support line of the rising channel).
- Although not visible on the chart, there is potential downside room down to $74.9K below that level.
Please use this analysis solely for reference and planning purposes.
I hope you trade safely by adhering to your principles and using stop-loss orders.
I post the analysis results as a Comment every day.
Thank you.
(You can find the link on my profile.)
- Click Follow to receive faster information every day.
- Check the results using the replay button on TradingView.
#BTC Price Analysis# #BNBChain# #BTC100K #Altcoin Season# $USDT $ETH $XRP $SOL $BTC
BTCUSD 30Min Chart
*My analysis is optimized for TradingView.
If you press the replay button, you can check real-time movements.
-Long position strategy-
At the bottom left, I have maintained the strategy for the long position entry point of $76,999.4 (marked with a purple finger), which was established on September 10th.
The CPI data release is scheduled for 9:30 shortly.
*Long position strategy regarding the upper "Purple Finger 1" zone:
1) After confirming a touch of the "Purple Finger 1" zone at $78,360.4:
Long position entry at $77,743.5 (red finger); stop-loss if the purple support line is breached.
2) First target for the long position at $79,558.7 ->
Subsequent targets for the weekend: "Good" followed by "Great."
- If the strategy succeeds, the $78.9K level can be used for re-entering a long position.
3) If the price drops directly without touching the "Purple Finger 1" zone:
Long position entry at the lower "Zone 2" ($76,748.2); stop-loss if the purple support line is breached.
- For those currently holding the $76.9K long position, you may apply the same stop-loss rule (exit if the purple support line is breached).
- If the purple support line breaks, the price moves to the "Bottom" zone (the final support line of the rising channel).
- Although not visible on the chart, there is potential downside room down to $74.9K below that level.
Please use this analysis solely for reference and planning purposes.
I hope you trade safely by adhering to your principles and using stop-loss orders.
I post the analysis results as a Comment every day.
Thank you.
(You can find the link on my profile.)
- Click Follow to receive faster information every day.
- Check the results using the replay button on TradingView.
#BTC Price Analysis# #BNBChain# #BTC100K #Altcoin Season# $USDT $ETH $XRP $SOL $BTC

59
·
--
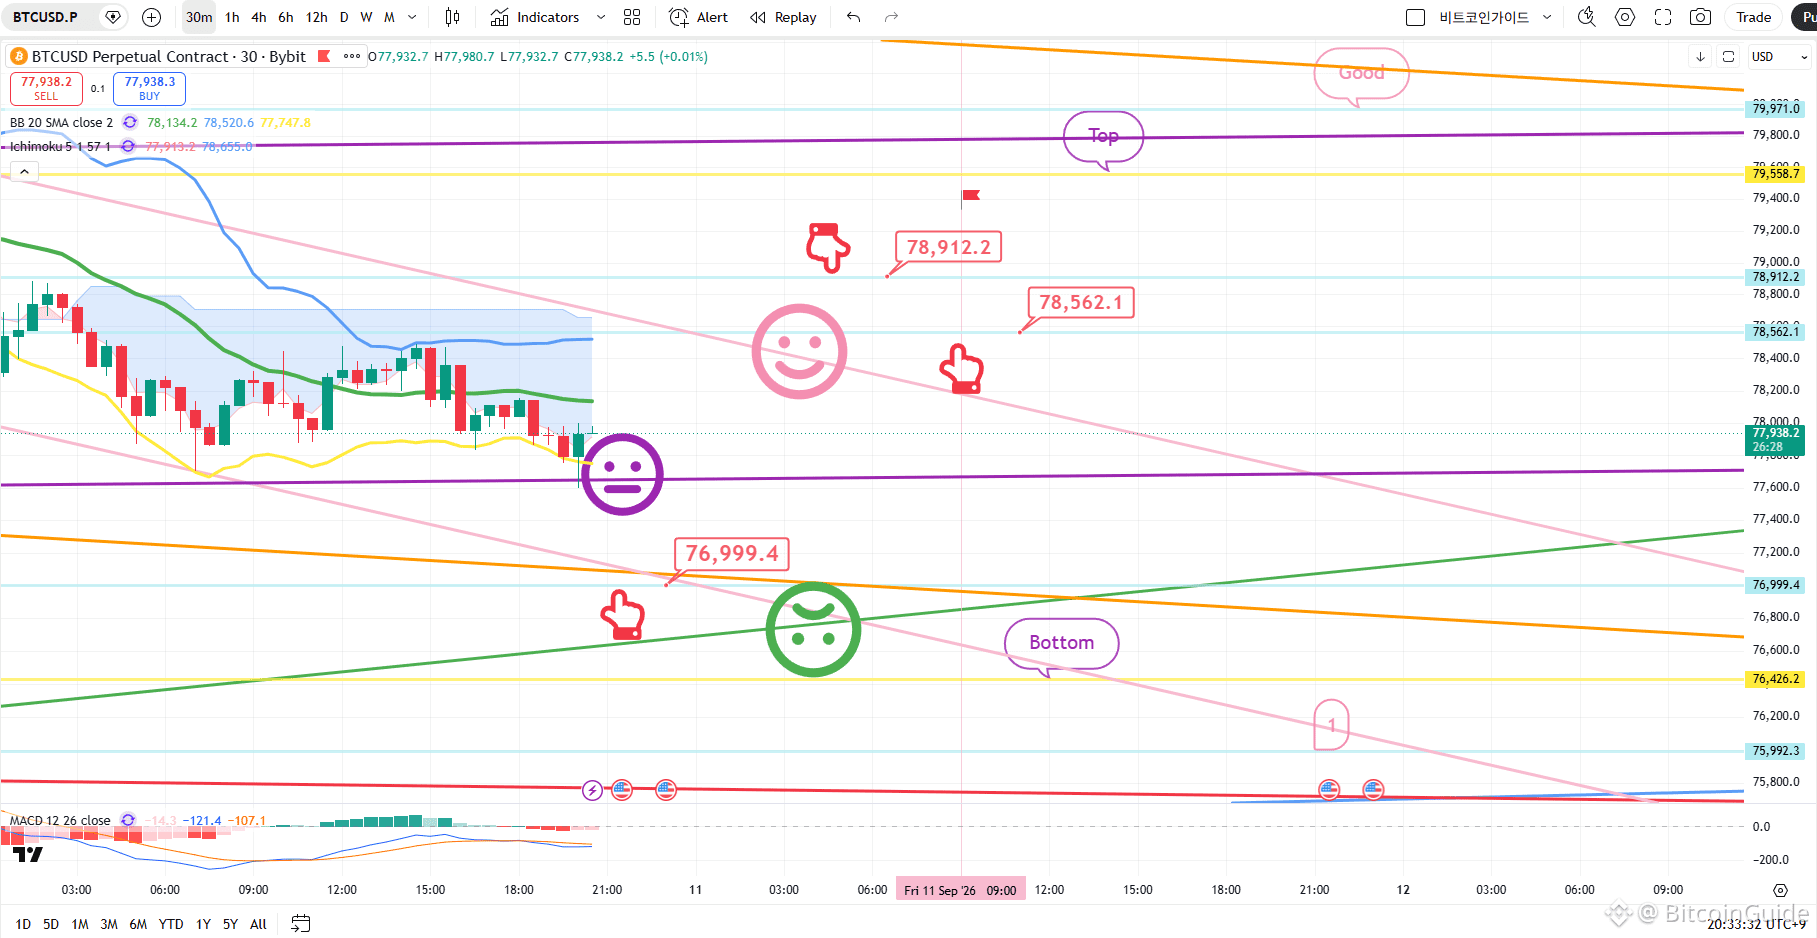
[Analisis chart Bitcoin 10 September]
Grafik BTCUSD 30Menit
*Analisis saya dioptimalkan untuk TradingView.
Jika Anda menekan tombol replay, Anda bisa memeriksa pergerakan secara real-time.
-Strategi posisi long-
*Jika harga mengikuti jalur yang ditunjukkan oleh panah merah:
Strategi posisi long
1) Zona entry long: $76,999.4 / Stop-loss: Jika harga menembus di bawah garis support hijau
2) Target pertama posisi long: $78,912.2 -> Target berikutnya: 'Top' lalu 'Good'
- Jika strategi berhasil, level $78.5K (ditandai dengan panah merah) bisa digunakan sebagai zona re-entry untuk posisi long.
- Jika harga menembus di bawah garis support hijau,
channel yang sedang naik akan dinyatakan tidak valid, dan mungkin memerlukan waktu lama agar harga kembali naik.
- Saat ini, Nasdaq menunjukkan "death cross" MACD pada chart 12 jam,
sehingga ada kemungkinan tinggi terjadinya pergerakan menyamping.
Jika harga bertahan di atas garis support ungu, pasar bisa menutup dengan tren menyamping yang cenderung naik.
Jika menembus di bawah garis support hijau, harga bisa turun menuju level 'Bottom' yang ditandai di bawah
-> berpotensi hingga ke zona '1'.
Saya memposting hasil analisis sebagai Komentar setiap hari.
Terima kasih.
(Anda bisa menemukan tautannya di profil saya.)
- Klik Follow untuk menerima informasi lebih cepat setiap hari.
- Cek hasilnya menggunakan tombol replay di TradingView.
#Analisis Harga BTC# #Altcoin Season# #Crypto# $USDT $BTC $ETH
[Analisis chart Bitcoin 10 September]
Grafik BTCUSD 30Menit
*Analisis saya dioptimalkan untuk TradingView.
Jika Anda menekan tombol replay, Anda bisa memeriksa pergerakan secara real-time.
-Strategi posisi long-
*Jika harga mengikuti jalur yang ditunjukkan oleh panah merah:
Strategi posisi long
1) Zona entry long: $76,999.4 / Stop-loss: Jika harga menembus di bawah garis support hijau
2) Target pertama posisi long: $78,912.2 -> Target berikutnya: 'Top' lalu 'Good'
- Jika strategi berhasil, level $78.5K (ditandai dengan panah merah) bisa digunakan sebagai zona re-entry untuk posisi long.
- Jika harga menembus di bawah garis support hijau,
channel yang sedang naik akan dinyatakan tidak valid, dan mungkin memerlukan waktu lama agar harga kembali naik.
- Saat ini, Nasdaq menunjukkan "death cross" MACD pada chart 12 jam,
sehingga ada kemungkinan tinggi terjadinya pergerakan menyamping.
Jika harga bertahan di atas garis support ungu, pasar bisa menutup dengan tren menyamping yang cenderung naik.
Jika menembus di bawah garis support hijau, harga bisa turun menuju level 'Bottom' yang ditandai di bawah
-> berpotensi hingga ke zona '1'.
Saya memposting hasil analisis sebagai Komentar setiap hari.
Terima kasih.
(Anda bisa menemukan tautannya di profil saya.)
- Klik Follow untuk menerima informasi lebih cepat setiap hari.
- Cek hasilnya menggunakan tombol replay di TradingView.
#Analisis Harga BTC# #Altcoin Season# #Crypto# $USDT $BTC $ETH
Grafik BTCUSD 30Menit
*Analisis saya dioptimalkan untuk TradingView.
Jika Anda menekan tombol replay, Anda bisa memeriksa pergerakan secara real-time.
-Strategi posisi long-
*Jika harga mengikuti jalur yang ditunjukkan oleh panah merah:
Strategi posisi long
1) Zona entry long: $76,999.4 / Stop-loss: Jika harga menembus di bawah garis support hijau
2) Target pertama posisi long: $78,912.2 -> Target berikutnya: 'Top' lalu 'Good'
- Jika strategi berhasil, level $78.5K (ditandai dengan panah merah) bisa digunakan sebagai zona re-entry untuk posisi long.
- Jika harga menembus di bawah garis support hijau,
channel yang sedang naik akan dinyatakan tidak valid, dan mungkin memerlukan waktu lama agar harga kembali naik.
- Saat ini, Nasdaq menunjukkan "death cross" MACD pada chart 12 jam,
sehingga ada kemungkinan tinggi terjadinya pergerakan menyamping.
Jika harga bertahan di atas garis support ungu, pasar bisa menutup dengan tren menyamping yang cenderung naik.
Jika menembus di bawah garis support hijau, harga bisa turun menuju level 'Bottom' yang ditandai di bawah
-> berpotensi hingga ke zona '1'.
Saya memposting hasil analisis sebagai Komentar setiap hari.
Terima kasih.
(Anda bisa menemukan tautannya di profil saya.)
- Klik Follow untuk menerima informasi lebih cepat setiap hari.
- Cek hasilnya menggunakan tombol replay di TradingView.
#Analisis Harga BTC# #Altcoin Season# #Crypto# $USDT $BTC $ETH
69
·
--
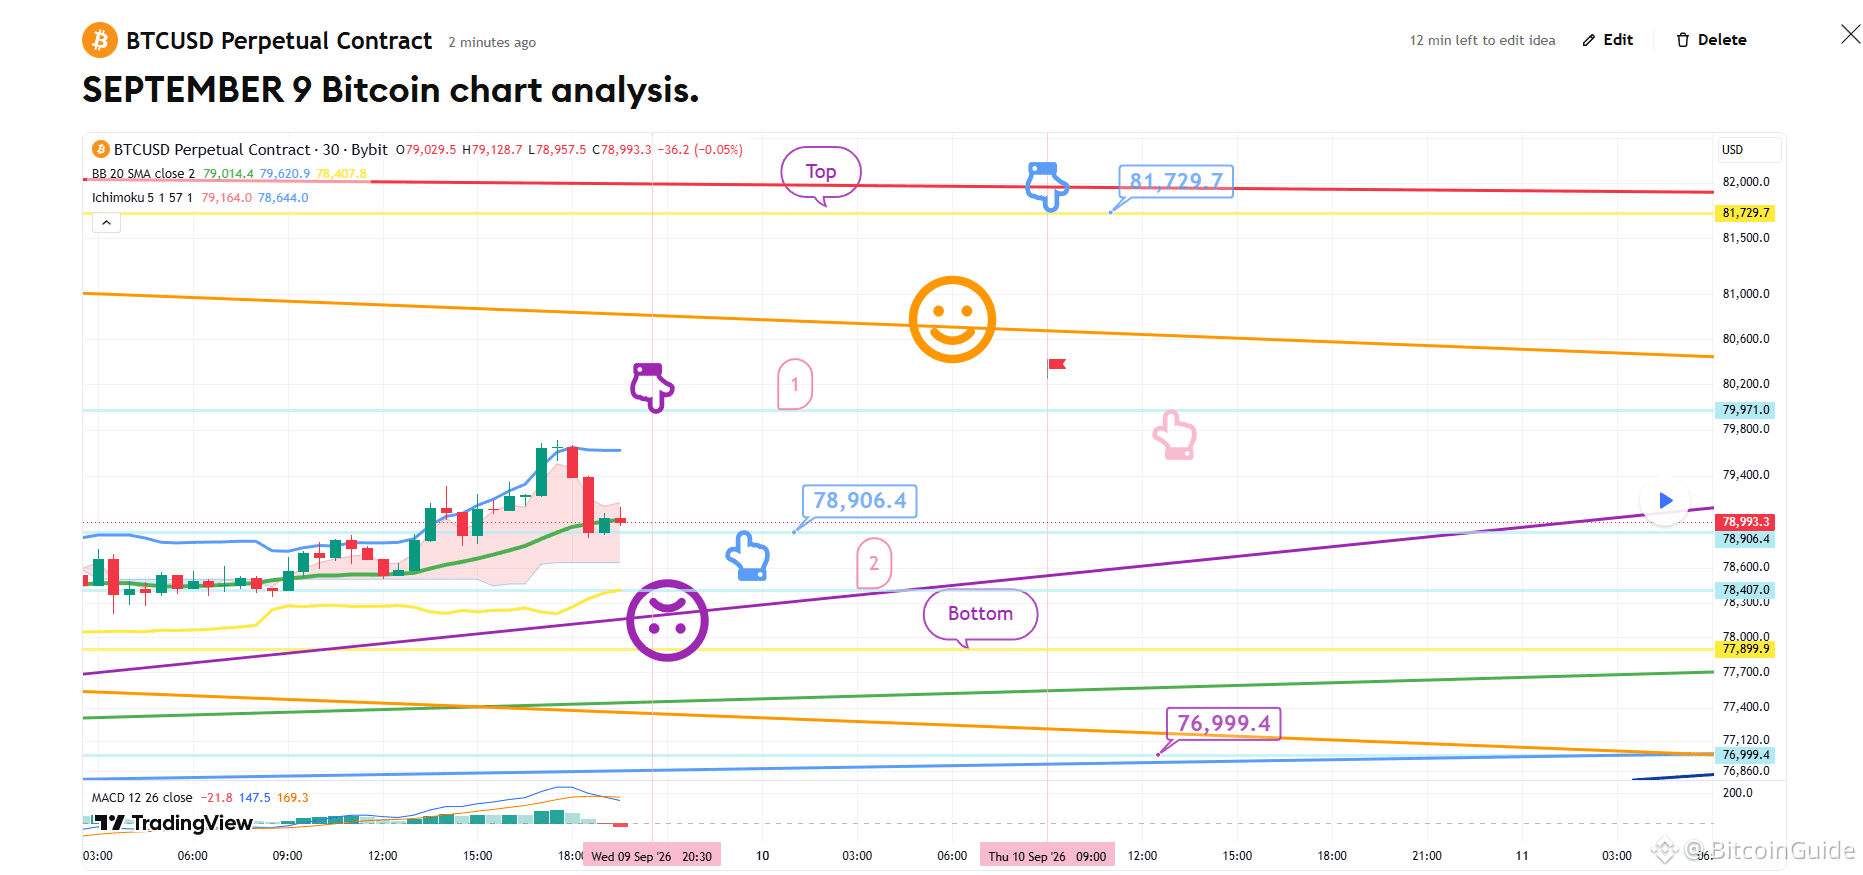
[Analisis chart Bitcoin 9 September]
*Analisis saya dioptimalkan untuk TradingView.
Jika Anda menekan tombol replay, Anda dapat memeriksa pergerakan secara real-time.
Ini adalah chart Bitcoin time-frame 30 menit.
Karena pola jangka menengah secara keseluruhan telah menurun,
kita mungkin melihat volatilitas yang signifikan ke kedua arah.
*Strategi netral (trading dua arah)
diterapkan di sekitar zona "Purple Finger 1" di bagian atas:
1) Setelah mengonfirmasi sentuhan pada zona Purple Finger 1 di $79,791 (pertimbangkan posisi short),
carilah peluang untuk masuk posisi long pada level bawah yang ditandai oleh jari berwarna biru muda ($78,906.4).
/ Stop-loss jika garis support ungu ditembus.
2) Beralih ke posisi short di $81,729.7 / Stop-loss jika garis resistance merah ditembus.
Ini juga berfungsi sebagai zona terakhir untuk masuk kembali ke posisi long.
3) Jika harga langsung turun tanpa menyentuh zona 1 di bagian atas,
level "Zone 2" di $78.4K adalah titik menunggu terakhir untuk posisi long.
Kondisi stop-loss (jika garis support ungu ditembus) tetap sama.
Setelah garis support ungu ditembus,
harga bisa turun ke level "Bottom" yang ditandai di bawah—potensial serendah $76.9K—
jadi mohon berhati-hati.
Jika garis support biru muda di $76.9K ditembus,
channel bullish jangka menengah akan menjadi tidak valid, yang kurang menguntungkan untuk posisi long.
Saya memposting hasil analisis sebagai Komentar setiap hari.
Terima kasih.
(Anda dapat menemukan tautannya di profil saya.)
- Klik Follow untuk mendapatkan informasi lebih cepat setiap hari.
- Cek hasilnya menggunakan tombol replay di TradingView.
#Crypto# #Analisis Harga BTC# #Altcoin Season# #BNBChain# #ㅠㅆ
[Analisis chart Bitcoin 9 September]
*Analisis saya dioptimalkan untuk TradingView.
Jika Anda menekan tombol replay, Anda dapat memeriksa pergerakan secara real-time.
Ini adalah chart Bitcoin time-frame 30 menit.
Karena pola jangka menengah secara keseluruhan telah menurun,
kita mungkin melihat volatilitas yang signifikan ke kedua arah.
*Strategi netral (trading dua arah)
diterapkan di sekitar zona "Purple Finger 1" di bagian atas:
1) Setelah mengonfirmasi sentuhan pada zona Purple Finger 1 di $79,791 (pertimbangkan posisi short),
carilah peluang untuk masuk posisi long pada level bawah yang ditandai oleh jari berwarna biru muda ($78,906.4).
/ Stop-loss jika garis support ungu ditembus.
2) Beralih ke posisi short di $81,729.7 / Stop-loss jika garis resistance merah ditembus.
Ini juga berfungsi sebagai zona terakhir untuk masuk kembali ke posisi long.
3) Jika harga langsung turun tanpa menyentuh zona 1 di bagian atas,
level "Zone 2" di $78.4K adalah titik menunggu terakhir untuk posisi long.
Kondisi stop-loss (jika garis support ungu ditembus) tetap sama.
Setelah garis support ungu ditembus,
harga bisa turun ke level "Bottom" yang ditandai di bawah—potensial serendah $76.9K—
jadi mohon berhati-hati.
Jika garis support biru muda di $76.9K ditembus,
channel bullish jangka menengah akan menjadi tidak valid, yang kurang menguntungkan untuk posisi long.
Saya memposting hasil analisis sebagai Komentar setiap hari.
Terima kasih.
(Anda dapat menemukan tautannya di profil saya.)
- Klik Follow untuk mendapatkan informasi lebih cepat setiap hari.
- Cek hasilnya menggunakan tombol replay di TradingView.
#Crypto# #Analisis Harga BTC# #Altcoin Season# #BNBChain# #ㅠㅆ
*Analisis saya dioptimalkan untuk TradingView.
Jika Anda menekan tombol replay, Anda dapat memeriksa pergerakan secara real-time.
Ini adalah chart Bitcoin time-frame 30 menit.
Karena pola jangka menengah secara keseluruhan telah menurun,
kita mungkin melihat volatilitas yang signifikan ke kedua arah.
*Strategi netral (trading dua arah)
diterapkan di sekitar zona "Purple Finger 1" di bagian atas:
1) Setelah mengonfirmasi sentuhan pada zona Purple Finger 1 di $79,791 (pertimbangkan posisi short),
carilah peluang untuk masuk posisi long pada level bawah yang ditandai oleh jari berwarna biru muda ($78,906.4).
/ Stop-loss jika garis support ungu ditembus.
2) Beralih ke posisi short di $81,729.7 / Stop-loss jika garis resistance merah ditembus.
Ini juga berfungsi sebagai zona terakhir untuk masuk kembali ke posisi long.
3) Jika harga langsung turun tanpa menyentuh zona 1 di bagian atas,
level "Zone 2" di $78.4K adalah titik menunggu terakhir untuk posisi long.
Kondisi stop-loss (jika garis support ungu ditembus) tetap sama.
Setelah garis support ungu ditembus,
harga bisa turun ke level "Bottom" yang ditandai di bawah—potensial serendah $76.9K—
jadi mohon berhati-hati.
Jika garis support biru muda di $76.9K ditembus,
channel bullish jangka menengah akan menjadi tidak valid, yang kurang menguntungkan untuk posisi long.
Saya memposting hasil analisis sebagai Komentar setiap hari.
Terima kasih.
(Anda dapat menemukan tautannya di profil saya.)
- Klik Follow untuk mendapatkan informasi lebih cepat setiap hari.
- Cek hasilnya menggunakan tombol replay di TradingView.
#Crypto# #Analisis Harga BTC# #Altcoin Season# #BNBChain# #ㅠㅆ
56
·
--
Lihat terjemahan
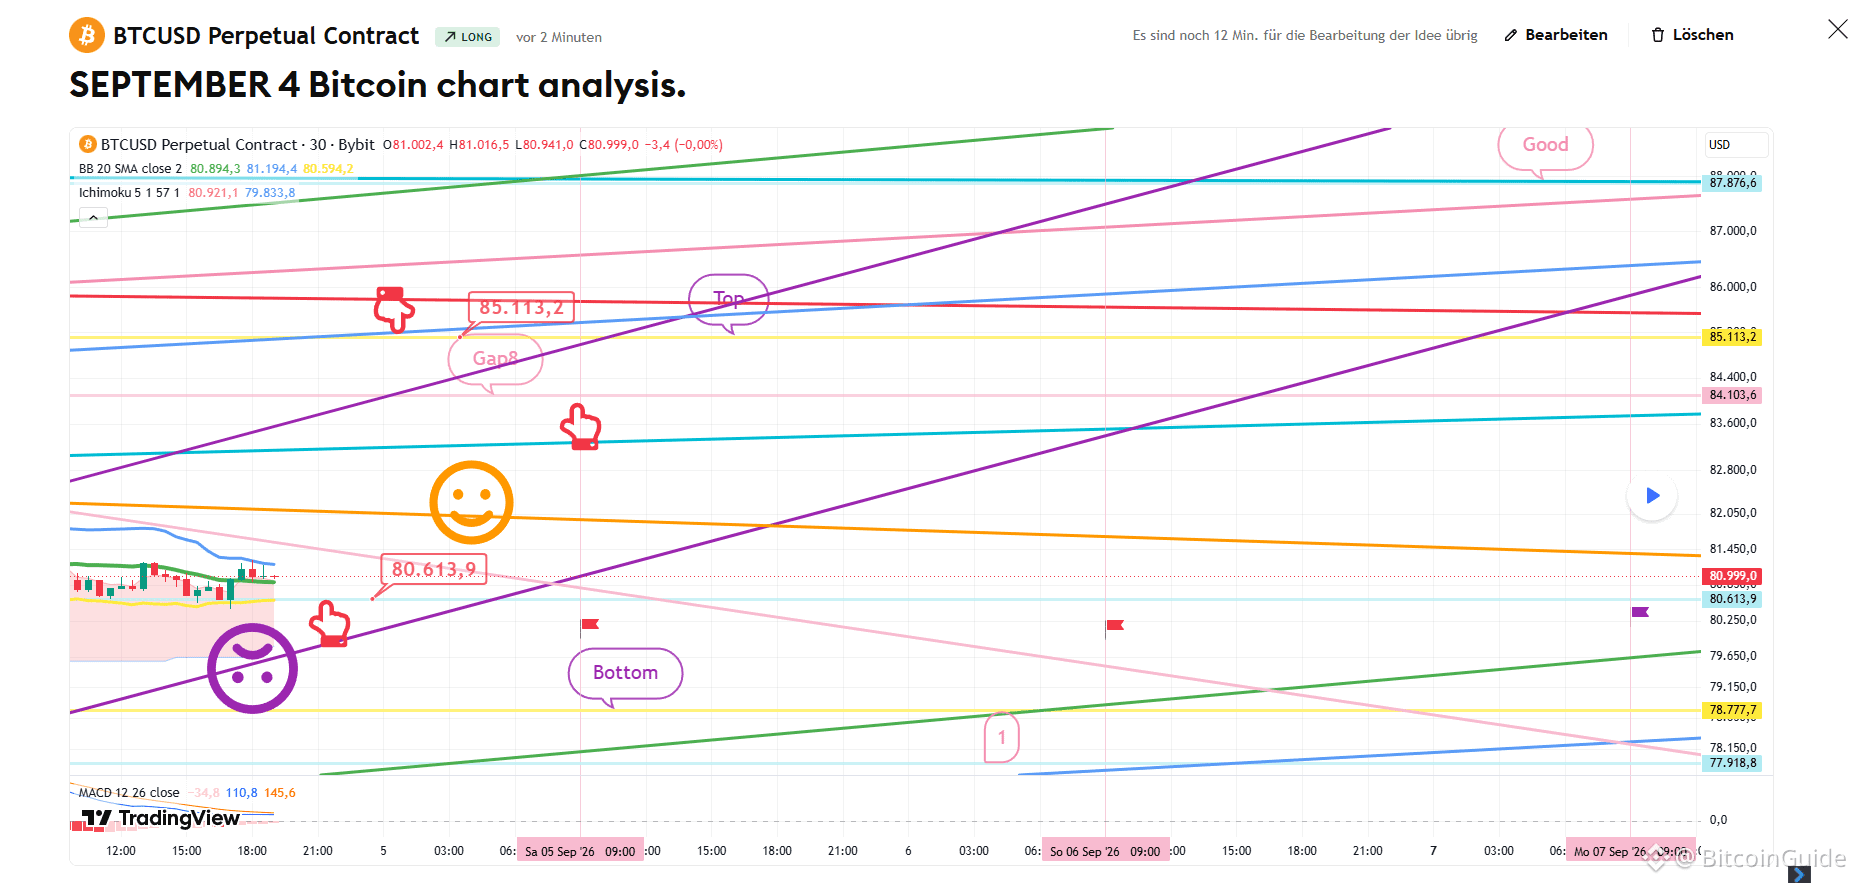
[September 4 Bitcoin chart analysis]
BTCUSD 30Min Chart
*My analysis is optimized for TradingView.
If you press the replay button, you can check real-time movements.
-Long position strategy-
*If the price follows the path indicated by the red arrow:
Long position strategy
1) Long entry zone: $80,613.9 / Stop-loss: If the purple support line is breached
2) 1st target: $85,113.2 -> 2nd target: The "Good" zone (valid through the weekend)
If the strategy succeeds, the "Gap 8" zone can be used for re-entering a long position.
- The "Good" zone is the most critical resistance level this month.
A strong breakout above this zone could lead to a powerful continuation of the uptrend.
If the purple support line is breached,
please be aware that the price could drop to the "Bottom" level
or as low as "Zone 1" (marked at the bottom).
The MACD on the 2-hour chart is currently showing a "dead cross,"
so please keep in mind that the price might move sideways today when managing your trades.
Please treat this analysis as a reference only.
I post the analysis results as a Comment every day.
Thank you.
(You can find the link on my profile.)
- Click Follow to receive faster information every day.
- Check the results using the replay button on TradingView.
#BTC100K #Macro Insights# #Altcoin Season# #BTCCharts# $USDT $TRX $BTC $ETH
[September 4 Bitcoin chart analysis]
BTCUSD 30Min Chart
*My analysis is optimized for TradingView.
If you press the replay button, you can check real-time movements.
-Long position strategy-
*If the price follows the path indicated by the red arrow:
Long position strategy
1) Long entry zone: $80,613.9 / Stop-loss: If the purple support line is breached
2) 1st target: $85,113.2 -> 2nd target: The "Good" zone (valid through the weekend)
If the strategy succeeds, the "Gap 8" zone can be used for re-entering a long position.
- The "Good" zone is the most critical resistance level this month.
A strong breakout above this zone could lead to a powerful continuation of the uptrend.
If the purple support line is breached,
please be aware that the price could drop to the "Bottom" level
or as low as "Zone 1" (marked at the bottom).
The MACD on the 2-hour chart is currently showing a "dead cross,"
so please keep in mind that the price might move sideways today when managing your trades.
Please treat this analysis as a reference only.
I post the analysis results as a Comment every day.
Thank you.
(You can find the link on my profile.)
- Click Follow to receive faster information every day.
- Check the results using the replay button on TradingView.
#BTC100K #Macro Insights# #Altcoin Season# #BTCCharts# $USDT $TRX $BTC $ETH
BTCUSD 30Min Chart
*My analysis is optimized for TradingView.
If you press the replay button, you can check real-time movements.
-Long position strategy-
*If the price follows the path indicated by the red arrow:
Long position strategy
1) Long entry zone: $80,613.9 / Stop-loss: If the purple support line is breached
2) 1st target: $85,113.2 -> 2nd target: The "Good" zone (valid through the weekend)
If the strategy succeeds, the "Gap 8" zone can be used for re-entering a long position.
- The "Good" zone is the most critical resistance level this month.
A strong breakout above this zone could lead to a powerful continuation of the uptrend.
If the purple support line is breached,
please be aware that the price could drop to the "Bottom" level
or as low as "Zone 1" (marked at the bottom).
The MACD on the 2-hour chart is currently showing a "dead cross,"
so please keep in mind that the price might move sideways today when managing your trades.
Please treat this analysis as a reference only.
I post the analysis results as a Comment every day.
Thank you.
(You can find the link on my profile.)
- Click Follow to receive faster information every day.
- Check the results using the replay button on TradingView.
#BTC100K #Macro Insights# #Altcoin Season# #BTCCharts# $USDT $TRX $BTC $ETH
70
·
--
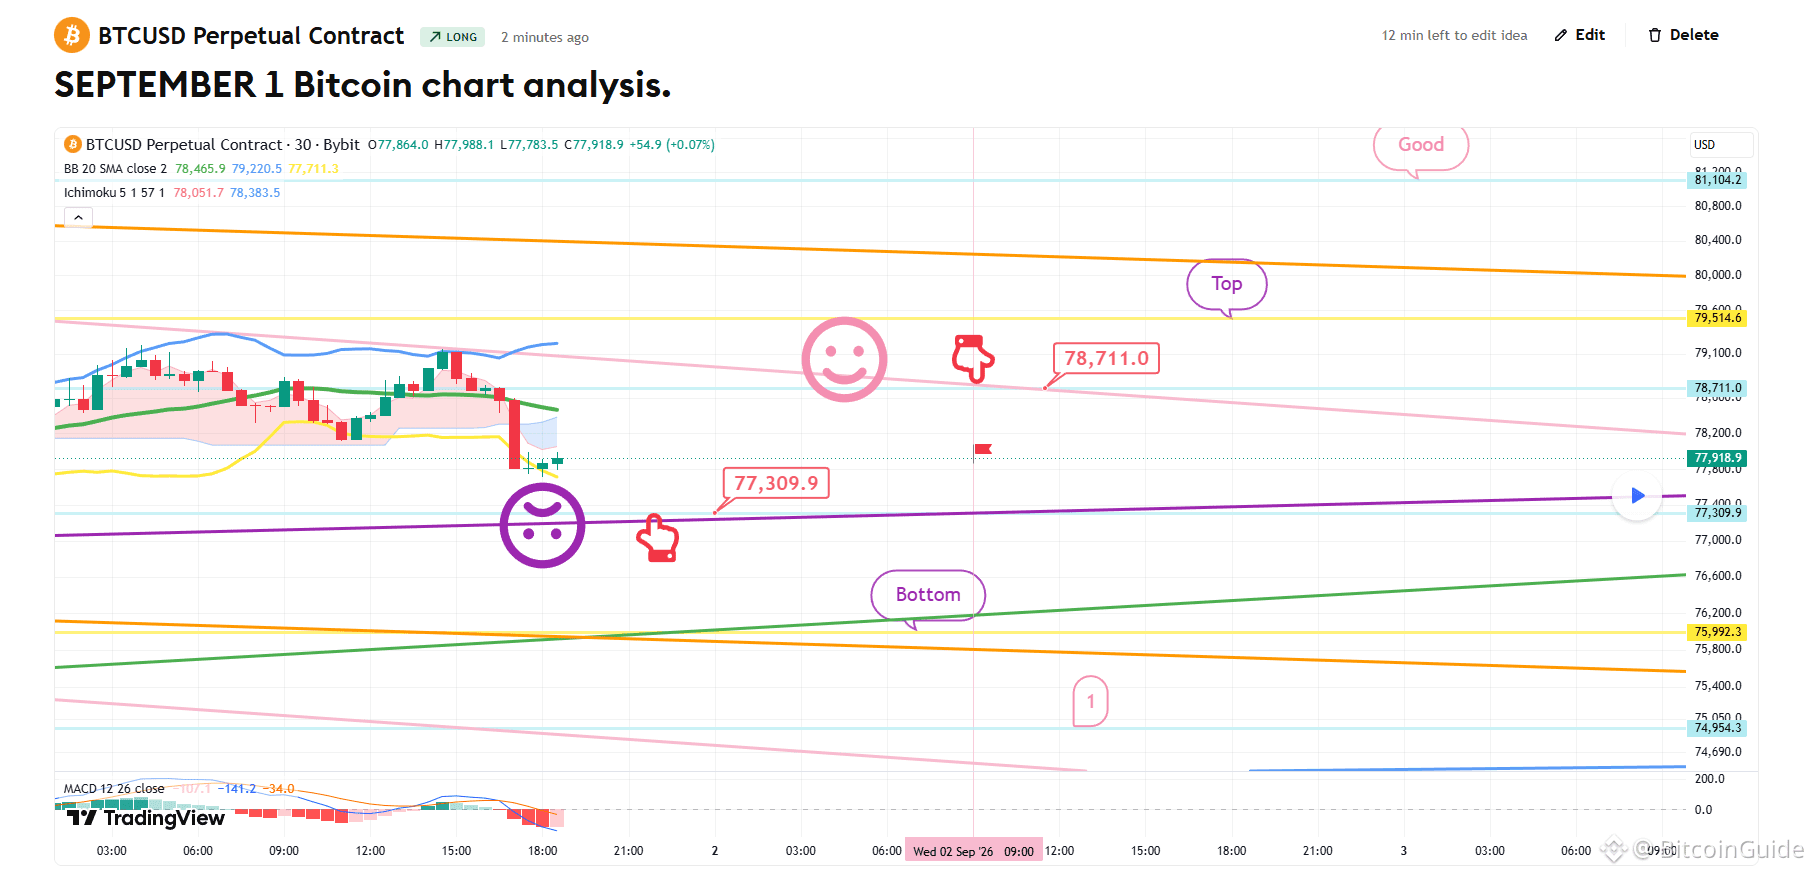
[ANALISIS GRAFIK Bitcoin 1 September]
Grafik BTCUSD 30 Menit
*Analisis saya dioptimalkan untuk TradingView.
Jika Anda menekan tombol replay, Anda dapat memeriksa pergerakan secara real-time.
-Strategi posisi long-
Ini adalah grafik Bitcoin 30 menit.
Saat ini, MACD Dead Cross sedang berlangsung pada grafik harian.
Perlu kehati-hatian karena posisi ini berpotensi mengalami penurunan tajam.
Saya telah mengembangkan strategi berdasarkan pasar yang bergerak sideways yang mempertahankan channel.
*Strategi Posisi Long berdasarkan jalur pergerakan jari merah
1) Titik entry untuk posisi long di $77.309,9 / Stop loss jika garis dukungan ungu terputus
2) Target pertama untuk posisi long di $78.711 -> Harga target berdasarkan urutan Top, Good
Sementara tren keseluruhan menunjukkan zona Bottom kemungkinan besar,
saya melanjutkan strategi berdasarkan pergerakan Nasdaq.
Jika Bottom terpecahkan, peluang untuk mencapai Zone 1 tetap terbuka.
Saya memposting hasil analisis sebagai Komentar setiap hari.
Terima kasih.
(Anda bisa menemukan tautannya di profil saya.)
- Klik Follow untuk menerima informasi lebih cepat setiap hari.
- Cek hasilnya menggunakan tombol replay di TradingView.
#Analisis Harga BTC# #Musim Altcoin# #BTC100K #XRP $ETH $USDT $BTC $GOLD
[ANALISIS GRAFIK Bitcoin 1 September]
Grafik BTCUSD 30 Menit
*Analisis saya dioptimalkan untuk TradingView.
Jika Anda menekan tombol replay, Anda dapat memeriksa pergerakan secara real-time.
-Strategi posisi long-
Ini adalah grafik Bitcoin 30 menit.
Saat ini, MACD Dead Cross sedang berlangsung pada grafik harian.
Perlu kehati-hatian karena posisi ini berpotensi mengalami penurunan tajam.
Saya telah mengembangkan strategi berdasarkan pasar yang bergerak sideways yang mempertahankan channel.
*Strategi Posisi Long berdasarkan jalur pergerakan jari merah
1) Titik entry untuk posisi long di $77.309,9 / Stop loss jika garis dukungan ungu terputus
2) Target pertama untuk posisi long di $78.711 -> Harga target berdasarkan urutan Top, Good
Sementara tren keseluruhan menunjukkan zona Bottom kemungkinan besar,
saya melanjutkan strategi berdasarkan pergerakan Nasdaq.
Jika Bottom terpecahkan, peluang untuk mencapai Zone 1 tetap terbuka.
Saya memposting hasil analisis sebagai Komentar setiap hari.
Terima kasih.
(Anda bisa menemukan tautannya di profil saya.)
- Klik Follow untuk menerima informasi lebih cepat setiap hari.
- Cek hasilnya menggunakan tombol replay di TradingView.
#Analisis Harga BTC# #Musim Altcoin# #BTC100K #XRP $ETH $USDT $BTC $GOLD
Grafik BTCUSD 30 Menit
*Analisis saya dioptimalkan untuk TradingView.
Jika Anda menekan tombol replay, Anda dapat memeriksa pergerakan secara real-time.
-Strategi posisi long-
Ini adalah grafik Bitcoin 30 menit.
Saat ini, MACD Dead Cross sedang berlangsung pada grafik harian.
Perlu kehati-hatian karena posisi ini berpotensi mengalami penurunan tajam.
Saya telah mengembangkan strategi berdasarkan pasar yang bergerak sideways yang mempertahankan channel.
*Strategi Posisi Long berdasarkan jalur pergerakan jari merah
1) Titik entry untuk posisi long di $77.309,9 / Stop loss jika garis dukungan ungu terputus
2) Target pertama untuk posisi long di $78.711 -> Harga target berdasarkan urutan Top, Good
Sementara tren keseluruhan menunjukkan zona Bottom kemungkinan besar,
saya melanjutkan strategi berdasarkan pergerakan Nasdaq.
Jika Bottom terpecahkan, peluang untuk mencapai Zone 1 tetap terbuka.
Saya memposting hasil analisis sebagai Komentar setiap hari.
Terima kasih.
(Anda bisa menemukan tautannya di profil saya.)
- Klik Follow untuk menerima informasi lebih cepat setiap hari.
- Cek hasilnya menggunakan tombol replay di TradingView.
#Analisis Harga BTC# #Musim Altcoin# #BTC100K #XRP $ETH $USDT $BTC $GOLD
79
·
--
Lihat terjemahan
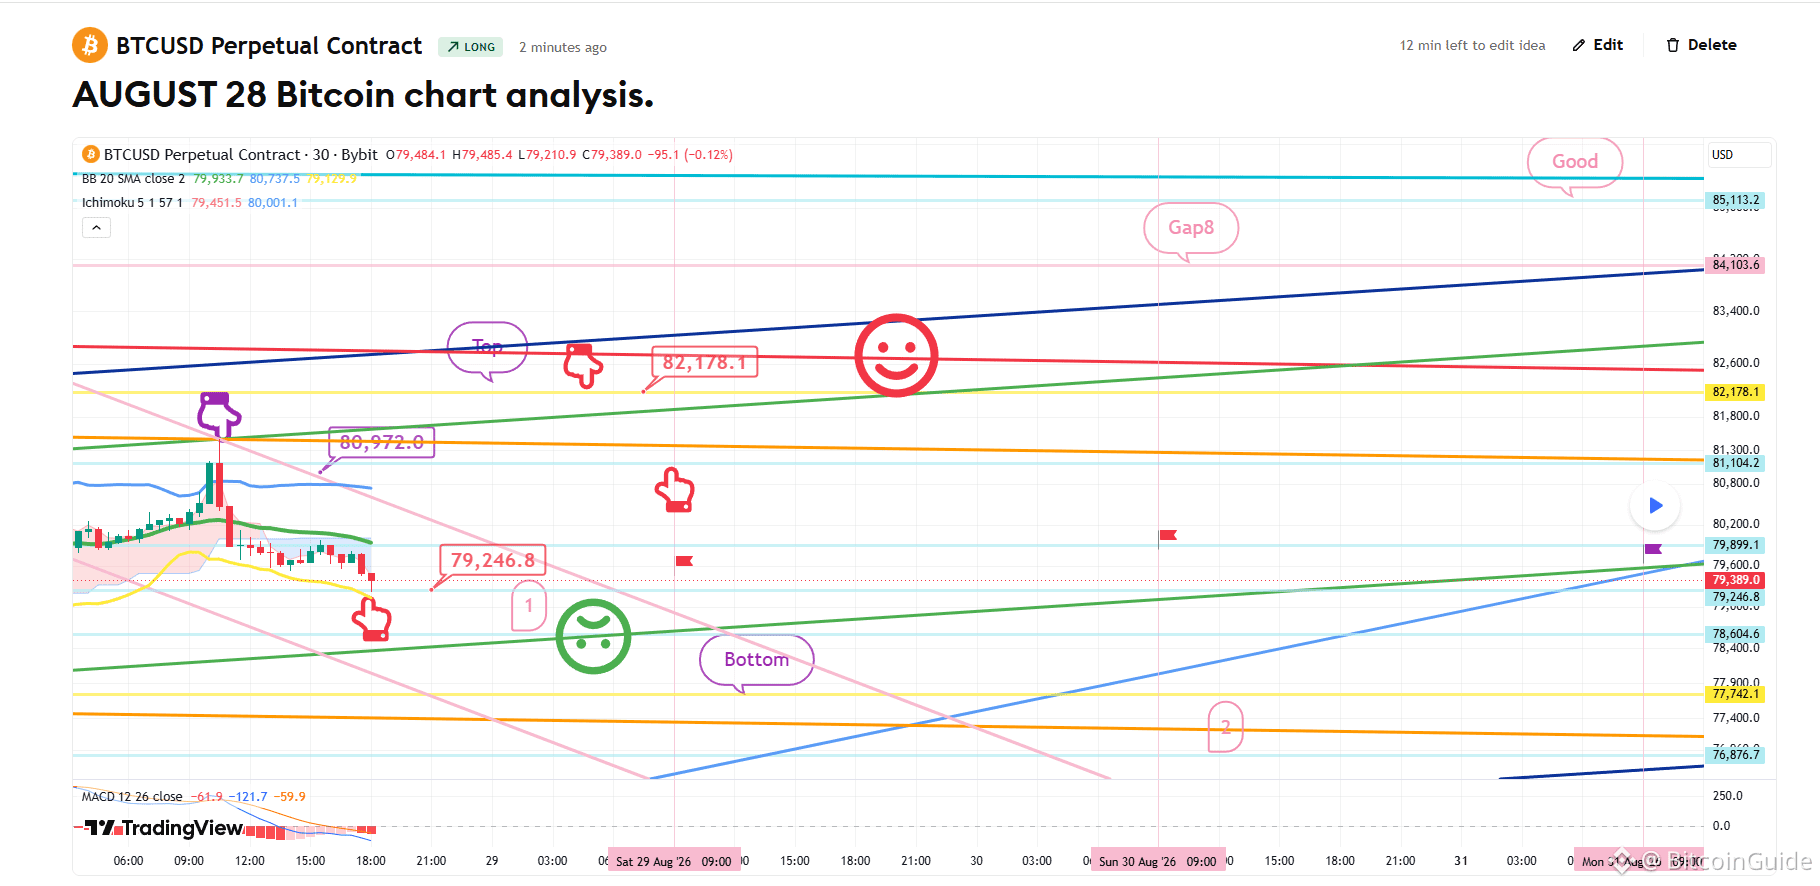
[August 28 Bitcoin chart analysis]
BTCUSD 30Min Chart
*My analysis is optimized for TradingView.
If you press the replay button, you can check real-time movements.
-Long position strategy-
This is the Bitcoin 30-minute chart.
In the top left corner, I connected the last short position entry point at $80,792 with the purple finger.
The reason the correction is stronger than expected following the previous high renewal is that the mid-term pattern was broken as it touched the center line of the 6-hour Bollinger Bands on the 26th, which I explained last time.
Since the correction is strong, I assumed some of you may have quickly switched to long positions, so I operated aggressively.
*Chase buy and long position strategy when following the red finger's movement path.
1) $79,246.8 Long position entry point / Stop loss if the green support line is broken.
It could fall to zone 1 below, which I consider the safest entry point for a long position. 2) $82,178.1 Long Position 1st Target -> Target price in the maximum "Good" zone during the weekend
If the strategy is successful, the red finger at $80.9K is the zone to utilize for re-entry into the long position.
Please be cautious, as the bottom line (Bottom) opens up to zone 2 once it breaks below the green support line.
I post the analysis results as a Comment every day.
Thank you.
(You can find the link on my profile.)
- Click Follow to receive faster information every day.
- Check the results using the replay button on TradingView.
#BTC100K #Altcoin Season# #BTC Price Analysis# #Crypto $USDT $BTC $ETH $XRP
[August 28 Bitcoin chart analysis]
BTCUSD 30Min Chart
*My analysis is optimized for TradingView.
If you press the replay button, you can check real-time movements.
-Long position strategy-
This is the Bitcoin 30-minute chart.
In the top left corner, I connected the last short position entry point at $80,792 with the purple finger.
The reason the correction is stronger than expected following the previous high renewal is that the mid-term pattern was broken as it touched the center line of the 6-hour Bollinger Bands on the 26th, which I explained last time.
Since the correction is strong, I assumed some of you may have quickly switched to long positions, so I operated aggressively.
*Chase buy and long position strategy when following the red finger's movement path.
1) $79,246.8 Long position entry point / Stop loss if the green support line is broken.
It could fall to zone 1 below, which I consider the safest entry point for a long position. 2) $82,178.1 Long Position 1st Target -> Target price in the maximum "Good" zone during the weekend
If the strategy is successful, the red finger at $80.9K is the zone to utilize for re-entry into the long position.
Please be cautious, as the bottom line (Bottom) opens up to zone 2 once it breaks below the green support line.
I post the analysis results as a Comment every day.
Thank you.
(You can find the link on my profile.)
- Click Follow to receive faster information every day.
- Check the results using the replay button on TradingView.
#BTC100K #Altcoin Season# #BTC Price Analysis# #Crypto $USDT $BTC $ETH $XRP
BTCUSD 30Min Chart
*My analysis is optimized for TradingView.
If you press the replay button, you can check real-time movements.
-Long position strategy-
This is the Bitcoin 30-minute chart.
In the top left corner, I connected the last short position entry point at $80,792 with the purple finger.
The reason the correction is stronger than expected following the previous high renewal is that the mid-term pattern was broken as it touched the center line of the 6-hour Bollinger Bands on the 26th, which I explained last time.
Since the correction is strong, I assumed some of you may have quickly switched to long positions, so I operated aggressively.
*Chase buy and long position strategy when following the red finger's movement path.
1) $79,246.8 Long position entry point / Stop loss if the green support line is broken.
It could fall to zone 1 below, which I consider the safest entry point for a long position. 2) $82,178.1 Long Position 1st Target -> Target price in the maximum "Good" zone during the weekend
If the strategy is successful, the red finger at $80.9K is the zone to utilize for re-entry into the long position.
Please be cautious, as the bottom line (Bottom) opens up to zone 2 once it breaks below the green support line.
I post the analysis results as a Comment every day.
Thank you.
(You can find the link on my profile.)
- Click Follow to receive faster information every day.
- Check the results using the replay button on TradingView.
#BTC100K #Altcoin Season# #BTC Price Analysis# #Crypto $USDT $BTC $ETH $XRP
64
·
--
Lihat terjemahan
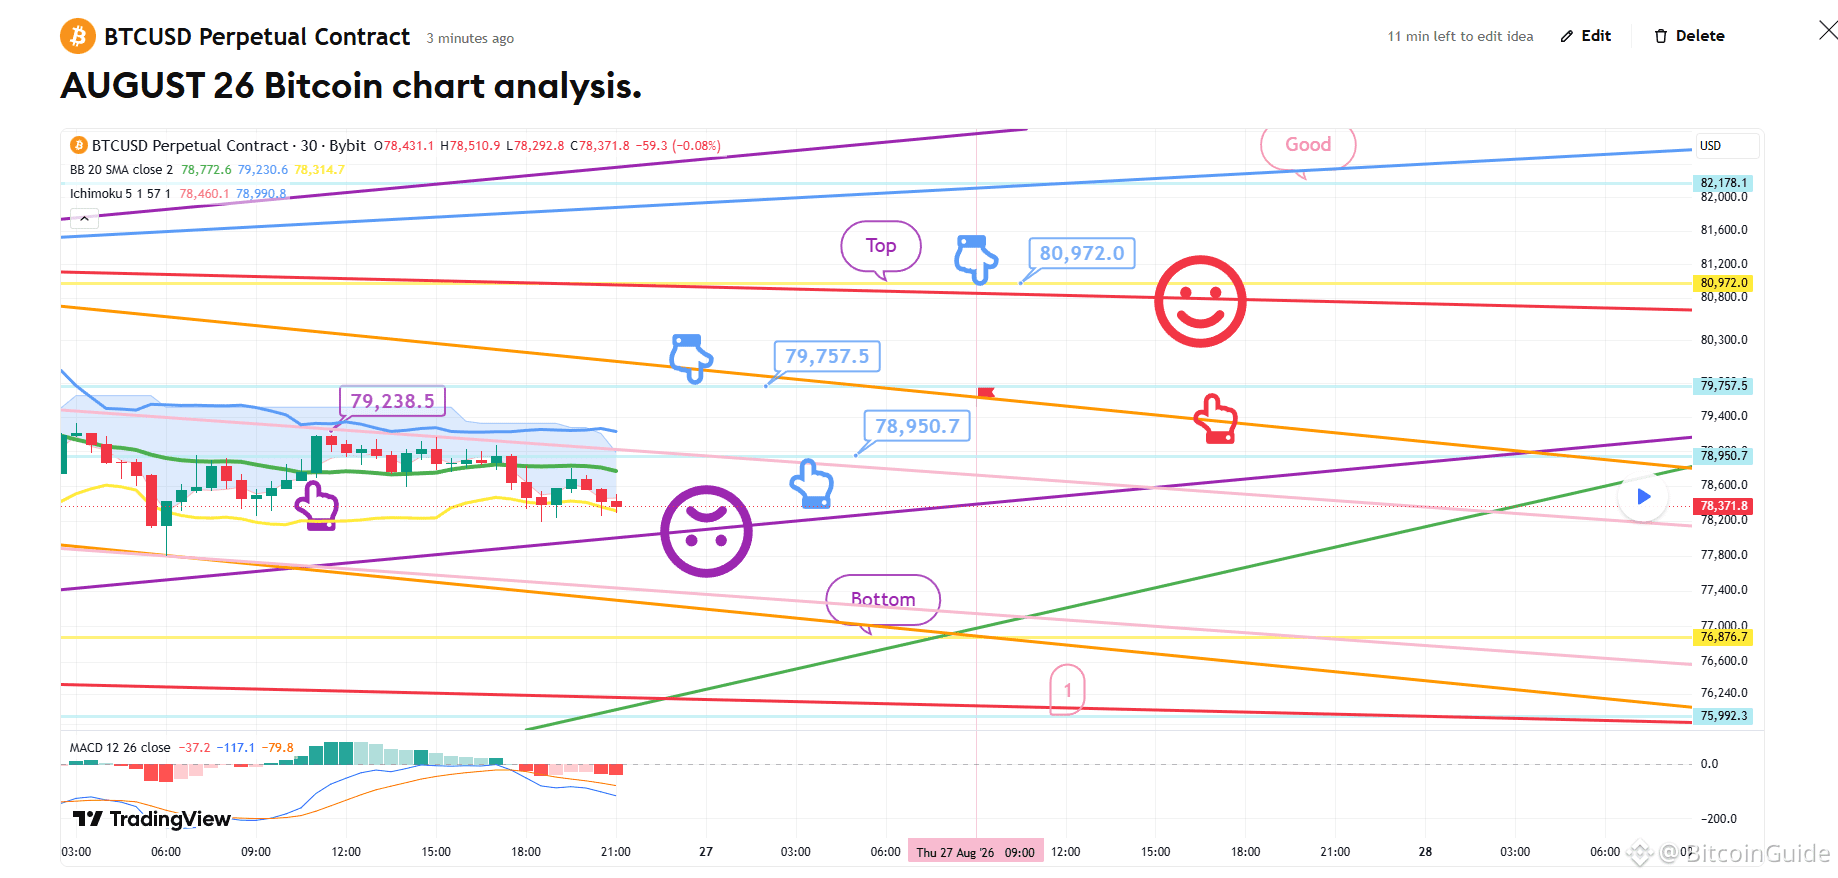
[August 26 Bitcoin chart analysis]
BTCUSD 30Min Chart
*My analysis is optimized for TradingView.
If you press the replay button, you can check real-time movements.
-On the left, marked by the purple finger, I have connected the strategy exactly as it was at the entry point of the long position entered on the 25th, 79.2K.
A MACD Dead Cross is currently in progress on the 12-hour chart.
*Based on the movement path of the light blue finger:
Short -> Long -> Short Two-way Neutral Strategy
1) Short position entry point at $79,757.5 / Stop loss upon breakout of the orange resistance line
2) Switch to long position at $78,950.7 / Stop loss upon breakout of the purple support line
(Same stop loss applies to those maintaining the long position at 79.2K)
3) Switch to short position at $80,972 / Stop loss upon breakout of the red resistance line
This is the zone to utilize for re-entering the long position at 79.7K from tomorrow onwards.
- If the price reaches the "Good" zone today,
you do not need to operate a short position,
and there is a very high possibility of sideways movement today.
Please exercise caution, as a break below the purple support line could lead to a decline to the bottom -> up to Zone 1.
I post the analysis results as a Comment every day.
Thank you.
(You can find the link on my profile.)
- Click Follow to receive faster information every day.
- Check the results using the replay button on TradingView.
#BTC100K #Altcoin Season# #ETH #BTC Price Analysis# $CRYPTO $GOLD $XRP $BTC
[August 26 Bitcoin chart analysis]
BTCUSD 30Min Chart
*My analysis is optimized for TradingView.
If you press the replay button, you can check real-time movements.
-On the left, marked by the purple finger, I have connected the strategy exactly as it was at the entry point of the long position entered on the 25th, 79.2K.
A MACD Dead Cross is currently in progress on the 12-hour chart.
*Based on the movement path of the light blue finger:
Short -> Long -> Short Two-way Neutral Strategy
1) Short position entry point at $79,757.5 / Stop loss upon breakout of the orange resistance line
2) Switch to long position at $78,950.7 / Stop loss upon breakout of the purple support line
(Same stop loss applies to those maintaining the long position at 79.2K)
3) Switch to short position at $80,972 / Stop loss upon breakout of the red resistance line
This is the zone to utilize for re-entering the long position at 79.7K from tomorrow onwards.
- If the price reaches the "Good" zone today,
you do not need to operate a short position,
and there is a very high possibility of sideways movement today.
Please exercise caution, as a break below the purple support line could lead to a decline to the bottom -> up to Zone 1.
I post the analysis results as a Comment every day.
Thank you.
(You can find the link on my profile.)
- Click Follow to receive faster information every day.
- Check the results using the replay button on TradingView.
#BTC100K #Altcoin Season# #ETH #BTC Price Analysis# $CRYPTO $GOLD $XRP $BTC
BTCUSD 30Min Chart
*My analysis is optimized for TradingView.
If you press the replay button, you can check real-time movements.
-On the left, marked by the purple finger, I have connected the strategy exactly as it was at the entry point of the long position entered on the 25th, 79.2K.
A MACD Dead Cross is currently in progress on the 12-hour chart.
*Based on the movement path of the light blue finger:
Short -> Long -> Short Two-way Neutral Strategy
1) Short position entry point at $79,757.5 / Stop loss upon breakout of the orange resistance line
2) Switch to long position at $78,950.7 / Stop loss upon breakout of the purple support line
(Same stop loss applies to those maintaining the long position at 79.2K)
3) Switch to short position at $80,972 / Stop loss upon breakout of the red resistance line
This is the zone to utilize for re-entering the long position at 79.7K from tomorrow onwards.
- If the price reaches the "Good" zone today,
you do not need to operate a short position,
and there is a very high possibility of sideways movement today.
Please exercise caution, as a break below the purple support line could lead to a decline to the bottom -> up to Zone 1.
I post the analysis results as a Comment every day.
Thank you.
(You can find the link on my profile.)
- Click Follow to receive faster information every day.
- Check the results using the replay button on TradingView.
#BTC100K #Altcoin Season# #ETH #BTC Price Analysis# $CRYPTO $GOLD $XRP $BTC
71
·
--
Lihat terjemahan
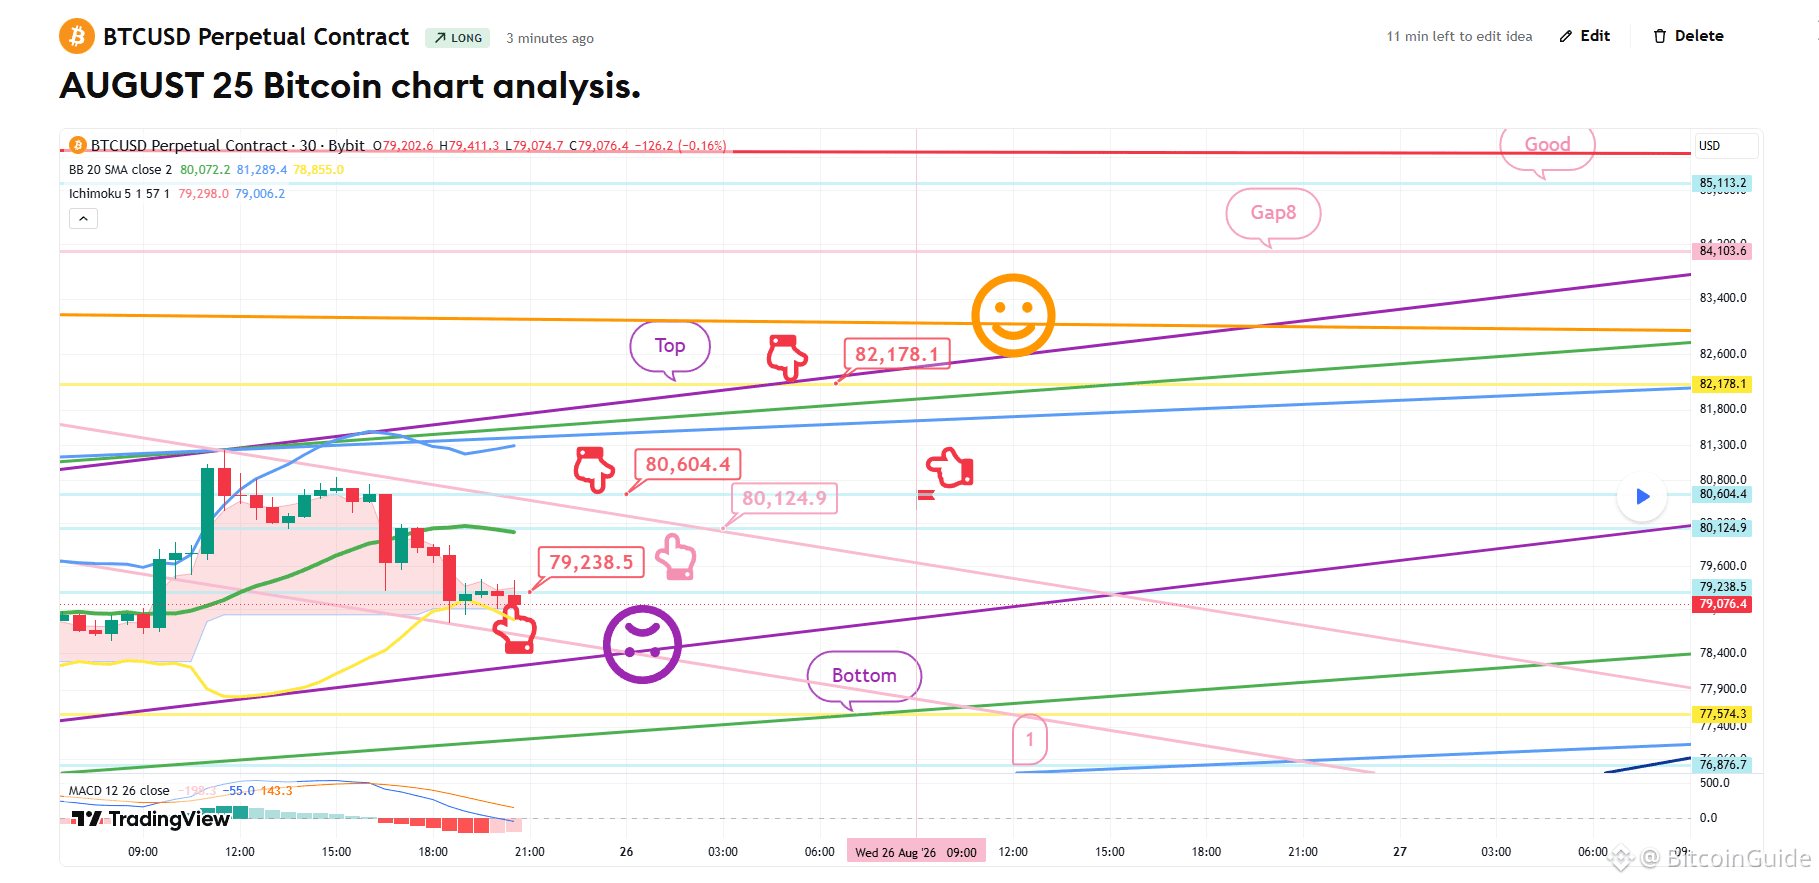
[August 25 Bitcoin chart analysis]
BTCUSD 30Min Chart
*My analysis is optimized for TradingView.
If you press the replay button, you can check real-time movements.
-Long position strategy-
This is the Bitcoin 30-minute chart.
There is a Nasdaq indicator release at 11:00.
*Long Position Strategy based on the movement path of the red finger
1) Buy at $79,238.5 / Stop loss if broken below the purple support line
2) 1st target for the long position at the $82,178.1 Top zone -> Target prices in order of Gap 8 and Good
- If broken below the purple support line
Please be careful as the price could fall to the Bottom zone indicated at the bottom -> up to zone 1.
I post the analysis results as a Comment every day.
Thank you.
(You can find the link on my profile.)
- Click Follow to receive faster information every day.
- Check the results using the replay button on TradingView.
#BTC Price Analysis# #Altcoin Season# #Bitcoin #Crypto# $XRP $ETH $BTC $USDT
[August 25 Bitcoin chart analysis]
BTCUSD 30Min Chart
*My analysis is optimized for TradingView.
If you press the replay button, you can check real-time movements.
-Long position strategy-
This is the Bitcoin 30-minute chart.
There is a Nasdaq indicator release at 11:00.
*Long Position Strategy based on the movement path of the red finger
1) Buy at $79,238.5 / Stop loss if broken below the purple support line
2) 1st target for the long position at the $82,178.1 Top zone -> Target prices in order of Gap 8 and Good
- If broken below the purple support line
Please be careful as the price could fall to the Bottom zone indicated at the bottom -> up to zone 1.
I post the analysis results as a Comment every day.
Thank you.
(You can find the link on my profile.)
- Click Follow to receive faster information every day.
- Check the results using the replay button on TradingView.
#BTC Price Analysis# #Altcoin Season# #Bitcoin #Crypto# $XRP $ETH $BTC $USDT
BTCUSD 30Min Chart
*My analysis is optimized for TradingView.
If you press the replay button, you can check real-time movements.
-Long position strategy-
This is the Bitcoin 30-minute chart.
There is a Nasdaq indicator release at 11:00.
*Long Position Strategy based on the movement path of the red finger
1) Buy at $79,238.5 / Stop loss if broken below the purple support line
2) 1st target for the long position at the $82,178.1 Top zone -> Target prices in order of Gap 8 and Good
- If broken below the purple support line
Please be careful as the price could fall to the Bottom zone indicated at the bottom -> up to zone 1.
I post the analysis results as a Comment every day.
Thank you.
(You can find the link on my profile.)
- Click Follow to receive faster information every day.
- Check the results using the replay button on TradingView.
#BTC Price Analysis# #Altcoin Season# #Bitcoin #Crypto# $XRP $ETH $BTC $USDT
93
·
--
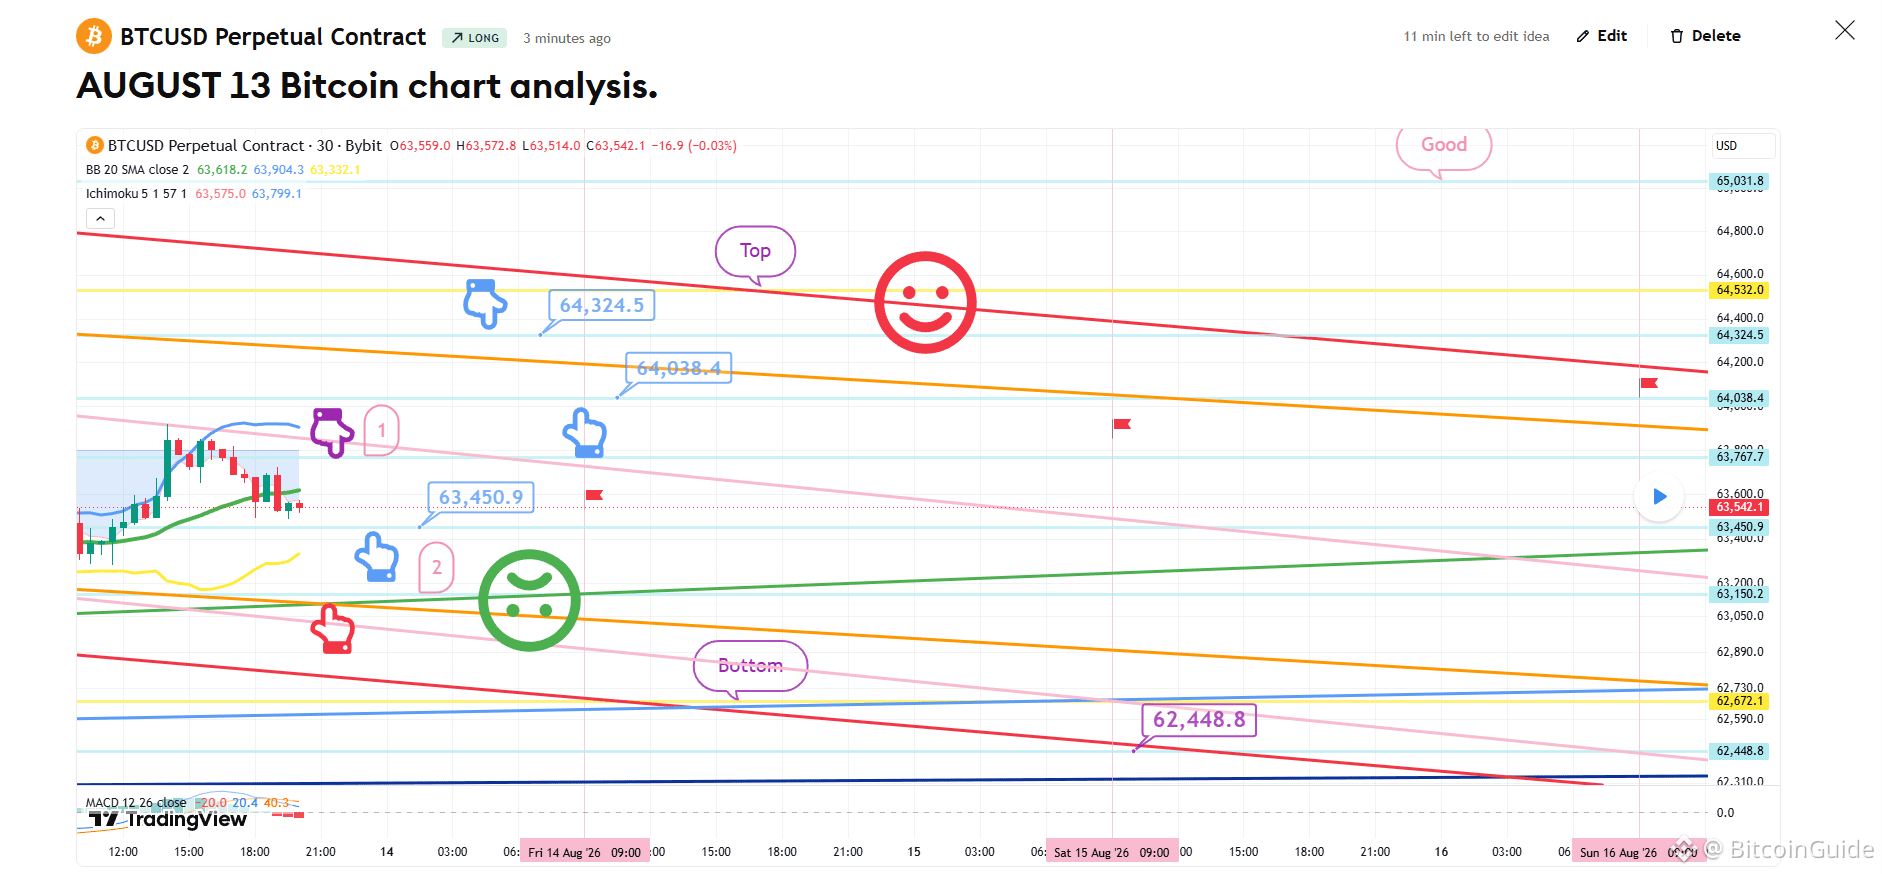
[Analisis chart Bitcoin 13 Agustus]
Grafik BTCUSD 30Menit
*Analisis saya dioptimalkan untuk TradingView.
Jika Anda menekan tombol replay, Anda bisa memeriksa pergerakan secara real-time.
-Strategi posisi Long-
Mengenai Nasdaq, karena terjadi dead cross MACD pada chart 12 jam,
tampaknya sangat mungkin bahwa pergerakan akan sideways hingga besok.
*Strategi Posisi Long (Sekitar waktu sentuhan jari ungu ke-1 di bagian atas)
1) Setelah mengonfirmasi sentuhan $63,7K di zona jari ungu 1,
titik entry untuk posisi long adalah $63.450,9 (jari biru muda) / Stop loss jika garis support hijau terputus.
2) $64.324,5 adalah target pertama untuk posisi long -> Harga target dalam urutan Atas, Bagus.
- Jika harga target $64,3K tercapai, gunakan rentang $64.038,4 untuk re-entry posisi long.
3) Jika harga gagal menyentuh zona 1 dan langsung turun:
titik entry untuk posisi long adalah $63.150,2 di zona jari merah 2 bagian bawah / Stop loss jika garis support hijau terputus -> Harga target yang tersisa tetap sama.
- Zona Bawah di bagian bawah adalah garis tren naik jangka menengah, jadi
tidak disarankan jika garis itu terputus, karena penurunan lanjutan bisa terjadi.
Batasnya terbuka hingga maksimum $62.448,8.
Mohon gunakan postingan analisis saya hanya sebagai referensi dan untuk tujuan praktis.
Saya berharap Anda beroperasi dengan aman dengan mematuhi prinsip trading dan perintah stop-loss secara ketat.
Saya memposting hasil analisis sebagai Komentar setiap hari.
Terima kasih.
(Anda bisa menemukan tautannya di profil saya.)
- Klik Follow untuk menerima informasi lebih cepat setiap hari.
- Cek hasilnya menggunakan tombol replay di TradingView.
#Crypto #BTC100K #Altcoin Season# #Analisis Harga BTC# $ETH $USDT $BTC $USDT
[Analisis chart Bitcoin 13 Agustus]
Grafik BTCUSD 30Menit
*Analisis saya dioptimalkan untuk TradingView.
Jika Anda menekan tombol replay, Anda bisa memeriksa pergerakan secara real-time.
-Strategi posisi Long-
Mengenai Nasdaq, karena terjadi dead cross MACD pada chart 12 jam,
tampaknya sangat mungkin bahwa pergerakan akan sideways hingga besok.
*Strategi Posisi Long (Sekitar waktu sentuhan jari ungu ke-1 di bagian atas)
1) Setelah mengonfirmasi sentuhan $63,7K di zona jari ungu 1,
titik entry untuk posisi long adalah $63.450,9 (jari biru muda) / Stop loss jika garis support hijau terputus.
2) $64.324,5 adalah target pertama untuk posisi long -> Harga target dalam urutan Atas, Bagus.
- Jika harga target $64,3K tercapai, gunakan rentang $64.038,4 untuk re-entry posisi long.
3) Jika harga gagal menyentuh zona 1 dan langsung turun:
titik entry untuk posisi long adalah $63.150,2 di zona jari merah 2 bagian bawah / Stop loss jika garis support hijau terputus -> Harga target yang tersisa tetap sama.
- Zona Bawah di bagian bawah adalah garis tren naik jangka menengah, jadi
tidak disarankan jika garis itu terputus, karena penurunan lanjutan bisa terjadi.
Batasnya terbuka hingga maksimum $62.448,8.
Mohon gunakan postingan analisis saya hanya sebagai referensi dan untuk tujuan praktis.
Saya berharap Anda beroperasi dengan aman dengan mematuhi prinsip trading dan perintah stop-loss secara ketat.
Saya memposting hasil analisis sebagai Komentar setiap hari.
Terima kasih.
(Anda bisa menemukan tautannya di profil saya.)
- Klik Follow untuk menerima informasi lebih cepat setiap hari.
- Cek hasilnya menggunakan tombol replay di TradingView.
#Crypto #BTC100K #Altcoin Season# #Analisis Harga BTC# $ETH $USDT $BTC $USDT
Grafik BTCUSD 30Menit
*Analisis saya dioptimalkan untuk TradingView.
Jika Anda menekan tombol replay, Anda bisa memeriksa pergerakan secara real-time.
-Strategi posisi Long-
Mengenai Nasdaq, karena terjadi dead cross MACD pada chart 12 jam,
tampaknya sangat mungkin bahwa pergerakan akan sideways hingga besok.
*Strategi Posisi Long (Sekitar waktu sentuhan jari ungu ke-1 di bagian atas)
1) Setelah mengonfirmasi sentuhan $63,7K di zona jari ungu 1,
titik entry untuk posisi long adalah $63.450,9 (jari biru muda) / Stop loss jika garis support hijau terputus.
2) $64.324,5 adalah target pertama untuk posisi long -> Harga target dalam urutan Atas, Bagus.
- Jika harga target $64,3K tercapai, gunakan rentang $64.038,4 untuk re-entry posisi long.
3) Jika harga gagal menyentuh zona 1 dan langsung turun:
titik entry untuk posisi long adalah $63.150,2 di zona jari merah 2 bagian bawah / Stop loss jika garis support hijau terputus -> Harga target yang tersisa tetap sama.
- Zona Bawah di bagian bawah adalah garis tren naik jangka menengah, jadi
tidak disarankan jika garis itu terputus, karena penurunan lanjutan bisa terjadi.
Batasnya terbuka hingga maksimum $62.448,8.
Mohon gunakan postingan analisis saya hanya sebagai referensi dan untuk tujuan praktis.
Saya berharap Anda beroperasi dengan aman dengan mematuhi prinsip trading dan perintah stop-loss secara ketat.
Saya memposting hasil analisis sebagai Komentar setiap hari.
Terima kasih.
(Anda bisa menemukan tautannya di profil saya.)
- Klik Follow untuk menerima informasi lebih cepat setiap hari.
- Cek hasilnya menggunakan tombol replay di TradingView.
#Crypto #BTC100K #Altcoin Season# #Analisis Harga BTC# $ETH $USDT $BTC $USDT
89
·
--
[Analisis chart Bitcoin 12 Agustus]
Grafik BTCUSD 30Menit
*Analisis saya dioptimalkan untuk TradingView.
Jika Anda menekan tombol replay, Anda dapat memeriksa pergerakan secara real-time.
-Strategi posisi Long-
Indikator CPI akan dirilis sebentar lagi pada pukul 9:30.
*Ini adalah strategi posisi long untuk mengejar harga mengikuti jalur pergerakan jari merah.
1) Titik entry untuk posisi long di $63,891.6 / Stop loss jika garis dukungan hijau terputus.
2) Target pertama untuk posisi long di $64,532 -> Bagus untuk target kedua.
- Jika strategi berhasil, gunakan rentang 64,3K untuk masuk kembali ke posisi long.
- Harga target final untuk rentang besar setelah besok.
Jika garis dukungan hijau terputus,
Harap berhati-hati karena bagian bawah masih terbuka hingga zona pertama.
Dengan tingkat partisipasi terbaru dan cuaca panas, jika terjadi stop loss hari ini, saya akan beristirahat dari memposting artikel analisis minggu ini.
Saya memposting hasil analisis sebagai Komentar setiap hari.
Terima kasih.
(Anda dapat menemukan tautannya di profil saya.)
- Klik Follow untuk menerima informasi lebih cepat setiap hari.
- Cek hasilnya menggunakan tombol replay di TradingView.
#BTC100K #Altcoin Season# #Analisis Harga BTC# #BNBChain# $BTC $ETH $USDT $ALT $XRP
[Analisis chart Bitcoin 12 Agustus]
Grafik BTCUSD 30Menit
*Analisis saya dioptimalkan untuk TradingView.
Jika Anda menekan tombol replay, Anda dapat memeriksa pergerakan secara real-time.
-Strategi posisi Long-
Indikator CPI akan dirilis sebentar lagi pada pukul 9:30.
*Ini adalah strategi posisi long untuk mengejar harga mengikuti jalur pergerakan jari merah.
1) Titik entry untuk posisi long di $63,891.6 / Stop loss jika garis dukungan hijau terputus.
2) Target pertama untuk posisi long di $64,532 -> Bagus untuk target kedua.
- Jika strategi berhasil, gunakan rentang 64,3K untuk masuk kembali ke posisi long.
- Harga target final untuk rentang besar setelah besok.
Jika garis dukungan hijau terputus,
Harap berhati-hati karena bagian bawah masih terbuka hingga zona pertama.
Dengan tingkat partisipasi terbaru dan cuaca panas, jika terjadi stop loss hari ini, saya akan beristirahat dari memposting artikel analisis minggu ini.
Saya memposting hasil analisis sebagai Komentar setiap hari.
Terima kasih.
(Anda dapat menemukan tautannya di profil saya.)
- Klik Follow untuk menerima informasi lebih cepat setiap hari.
- Cek hasilnya menggunakan tombol replay di TradingView.
#BTC100K #Altcoin Season# #Analisis Harga BTC# #BNBChain# $BTC $ETH $USDT $ALT $XRP
Grafik BTCUSD 30Menit
*Analisis saya dioptimalkan untuk TradingView.
Jika Anda menekan tombol replay, Anda dapat memeriksa pergerakan secara real-time.
-Strategi posisi Long-
Indikator CPI akan dirilis sebentar lagi pada pukul 9:30.
*Ini adalah strategi posisi long untuk mengejar harga mengikuti jalur pergerakan jari merah.
1) Titik entry untuk posisi long di $63,891.6 / Stop loss jika garis dukungan hijau terputus.
2) Target pertama untuk posisi long di $64,532 -> Bagus untuk target kedua.
- Jika strategi berhasil, gunakan rentang 64,3K untuk masuk kembali ke posisi long.
- Harga target final untuk rentang besar setelah besok.
Jika garis dukungan hijau terputus,
Harap berhati-hati karena bagian bawah masih terbuka hingga zona pertama.
Dengan tingkat partisipasi terbaru dan cuaca panas, jika terjadi stop loss hari ini, saya akan beristirahat dari memposting artikel analisis minggu ini.
Saya memposting hasil analisis sebagai Komentar setiap hari.
Terima kasih.
(Anda dapat menemukan tautannya di profil saya.)
- Klik Follow untuk menerima informasi lebih cepat setiap hari.
- Cek hasilnya menggunakan tombol replay di TradingView.
#BTC100K #Altcoin Season# #Analisis Harga BTC# #BNBChain# $BTC $ETH $USDT $ALT $XRP
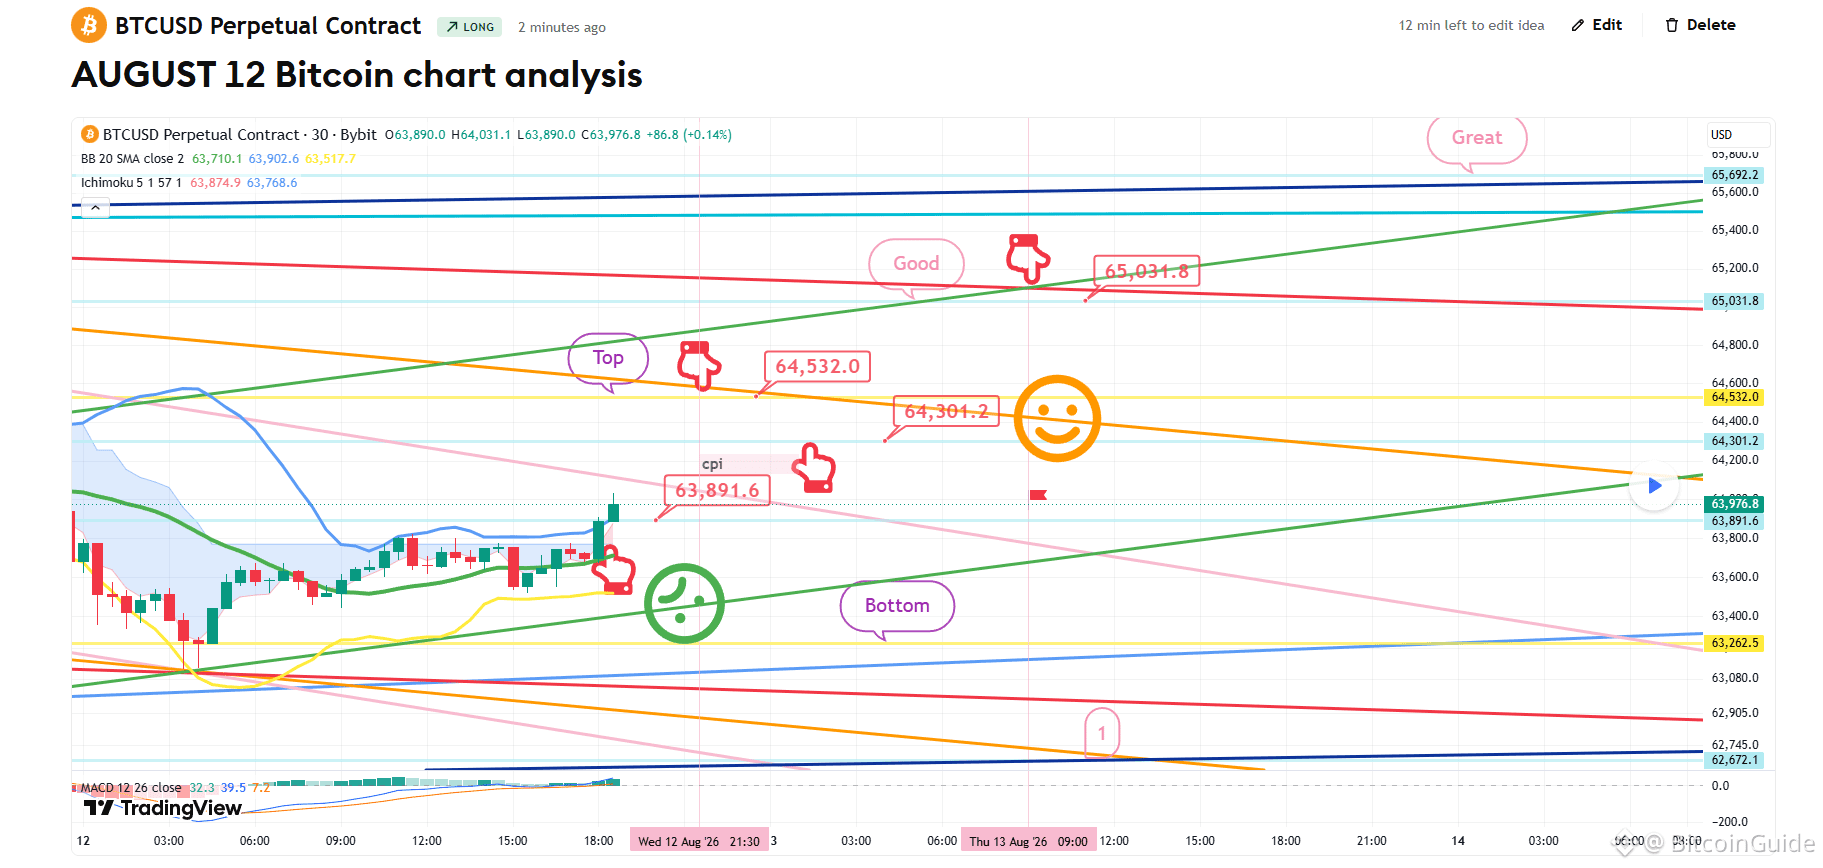
75
·
--
[Analisis chart Bitcoin 11 Agustus]
Grafik BTCUSD 30 Menit
*Analisis saya dioptimalkan untuk TradingView.
Jika Anda menekan tombol replay, Anda dapat memeriksa pergerakan secara real-time.
-Strategi posisi Long-
Saat ini, MACD Dead Cross sedang berlangsung pada chart 12 jam dan harian.
Mulai dari titik ini, ini adalah zona entry yang optimal untuk posisi short.
*Ini adalah strategi posisi long ketika mengikuti jalur pergerakan yang ditunjukkan oleh jari merah.
1) Zona entry posisi Long $63,963.8 / Stop loss jika tembus di bawah garis support hijau
2) Target 1 posisi Long $64,845 -> Bagus target ke-2
- Jika strategi berhasil, $64.5K berfungsi sebagai zona re-entry untuk posisi long.
- Setelah zona "Bagus" disentuh, MACD Dead Cross pada chart harian diabaikan.
Harap berhati-hati, karena area di bawah garis support hijau terbuka menuju Bawah -> hingga Zone 1.
Saya memposting hasil analisis sebagai Komentar setiap hari.
Terima kasih.
(Anda bisa menemukan tautannya di profil saya.)
- Klik Follow untuk menerima informasi lebih cepat setiap hari.
- Cek hasilnya menggunakan tombol replay di TradingView.
#Analisis Harga BTC# #Crypto #Altcoin Season# #BTC100K $USDT $BTC $GOLD $XRP $ETH
[Analisis chart Bitcoin 11 Agustus]
Grafik BTCUSD 30 Menit
*Analisis saya dioptimalkan untuk TradingView.
Jika Anda menekan tombol replay, Anda dapat memeriksa pergerakan secara real-time.
-Strategi posisi Long-
Saat ini, MACD Dead Cross sedang berlangsung pada chart 12 jam dan harian.
Mulai dari titik ini, ini adalah zona entry yang optimal untuk posisi short.
*Ini adalah strategi posisi long ketika mengikuti jalur pergerakan yang ditunjukkan oleh jari merah.
1) Zona entry posisi Long $63,963.8 / Stop loss jika tembus di bawah garis support hijau
2) Target 1 posisi Long $64,845 -> Bagus target ke-2
- Jika strategi berhasil, $64.5K berfungsi sebagai zona re-entry untuk posisi long.
- Setelah zona "Bagus" disentuh, MACD Dead Cross pada chart harian diabaikan.
Harap berhati-hati, karena area di bawah garis support hijau terbuka menuju Bawah -> hingga Zone 1.
Saya memposting hasil analisis sebagai Komentar setiap hari.
Terima kasih.
(Anda bisa menemukan tautannya di profil saya.)
- Klik Follow untuk menerima informasi lebih cepat setiap hari.
- Cek hasilnya menggunakan tombol replay di TradingView.
#Analisis Harga BTC# #Crypto #Altcoin Season# #BTC100K $USDT $BTC $GOLD $XRP $ETH
Grafik BTCUSD 30 Menit
*Analisis saya dioptimalkan untuk TradingView.
Jika Anda menekan tombol replay, Anda dapat memeriksa pergerakan secara real-time.
-Strategi posisi Long-
Saat ini, MACD Dead Cross sedang berlangsung pada chart 12 jam dan harian.
Mulai dari titik ini, ini adalah zona entry yang optimal untuk posisi short.
*Ini adalah strategi posisi long ketika mengikuti jalur pergerakan yang ditunjukkan oleh jari merah.
1) Zona entry posisi Long $63,963.8 / Stop loss jika tembus di bawah garis support hijau
2) Target 1 posisi Long $64,845 -> Bagus target ke-2
- Jika strategi berhasil, $64.5K berfungsi sebagai zona re-entry untuk posisi long.
- Setelah zona "Bagus" disentuh, MACD Dead Cross pada chart harian diabaikan.
Harap berhati-hati, karena area di bawah garis support hijau terbuka menuju Bawah -> hingga Zone 1.
Saya memposting hasil analisis sebagai Komentar setiap hari.
Terima kasih.
(Anda bisa menemukan tautannya di profil saya.)
- Klik Follow untuk menerima informasi lebih cepat setiap hari.
- Cek hasilnya menggunakan tombol replay di TradingView.
#Analisis Harga BTC# #Crypto #Altcoin Season# #BTC100K $USDT $BTC $GOLD $XRP $ETH
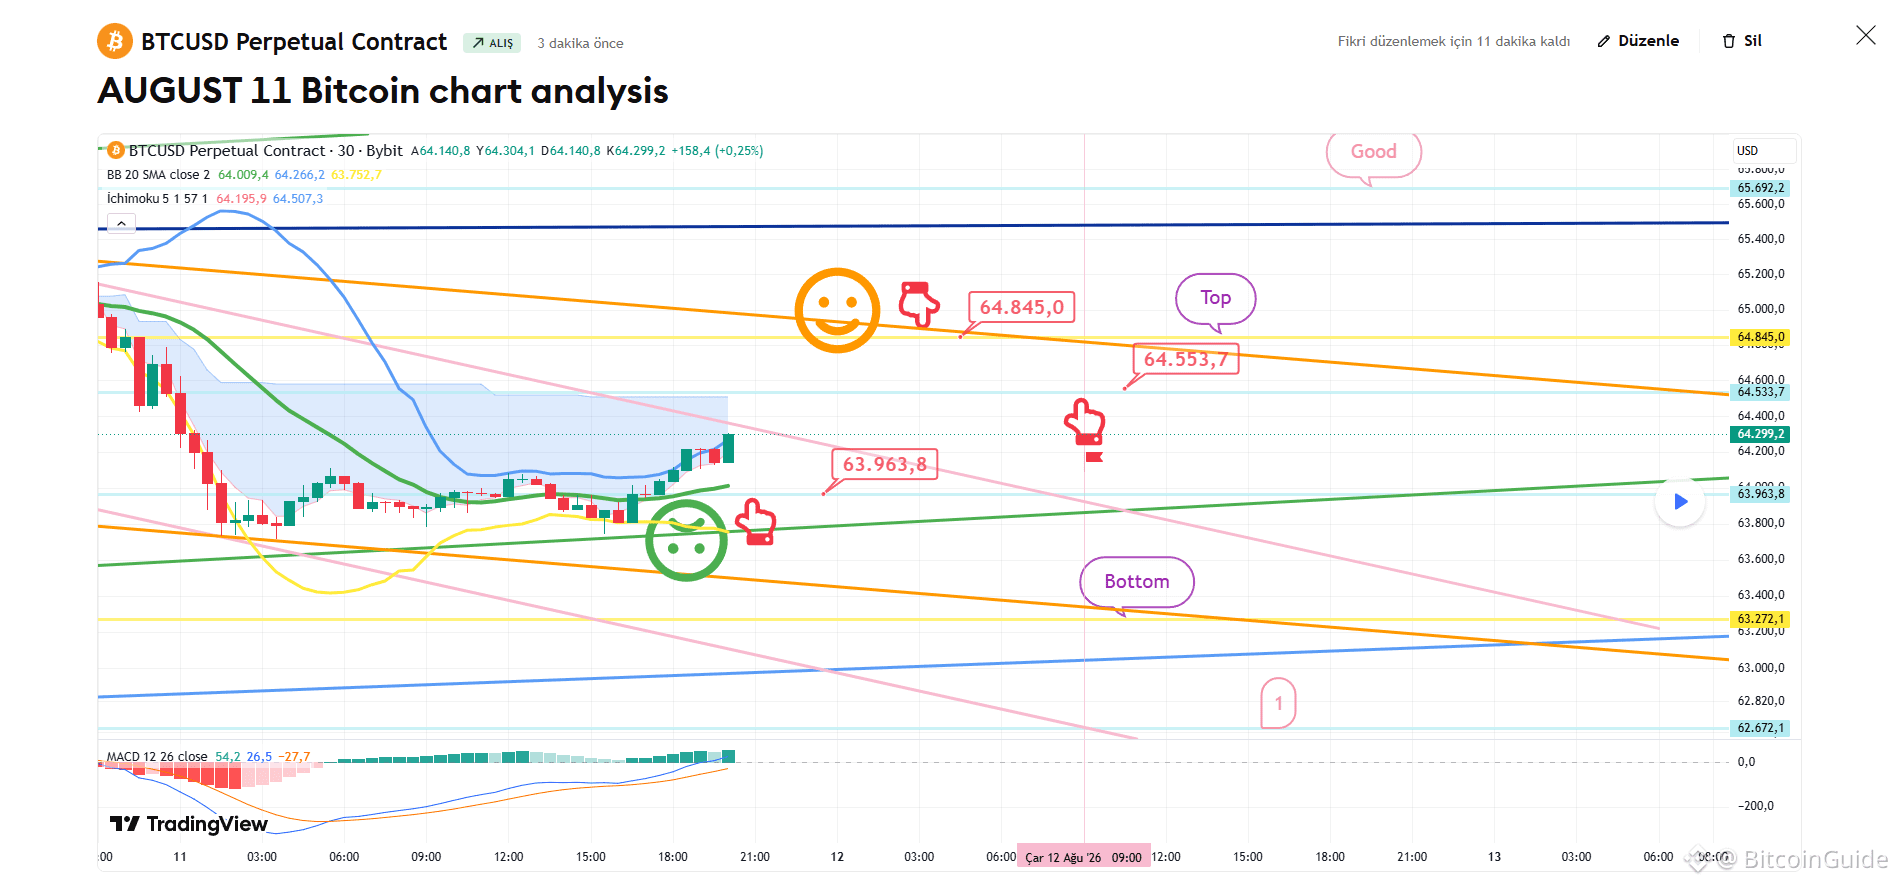
72
·
--
[Analisis bagan Bitcoin 10 Agustus]
Bagan BTCUSD 30Menit
*Analisis saya dioptimalkan untuk TradingView.
Jika Anda menekan tombol replay, Anda dapat memeriksa pergerakan secara real-time.
-Strategi posisi long-
Di kiri bawah, saya telah menghubungkan strategi tersebut tepat ke titik entry posisi long di 64,7K yang dimasuki pada 7 Agustus, ditunjukkan oleh jari ungu.
*Strategi posisi long ditampilkan sebelum dan sesudah menyentuh zona teal nomor 1 di bagian atas.
1) Setelah mengonfirmasi sentuhan Zona 1 (Jari Teal), masukkan posisi short.
/ Beralih ke posisi long di $64.890,3 (Jari Merah) / Stop loss jika garis support hijau terputus.
2) $65.995,7 Long Position Target 1 -> Harga Target 2 yang Baik.
- Jika strategi berhasil, gunakan range 65,6K untuk masuk kembali ke posisi long.
3) Jika langsung turun tanpa menyentuh Zona 1 di bagian atas,
masukkan posisi long di Zona 2 ($64.705,8) di bagian bawah.
/ Stop loss jika garis support hijau terputus.
- Harap berhati-hati, karena jika garis support hijau terputus, bisa jatuh ke zona Bawah di bagian bawah.
- Berdasarkan pola, harus segera naik tanpa menyentuh Zona 2 agar tren naik tetap aman.
Saya memposting hasil analisis sebagai Komentar setiap hari.
Terima kasih.
(Anda dapat menemukan tautannya di profil saya.)
- Klik Follow untuk menerima informasi lebih cepat setiap hari.
- Cek hasilnya menggunakan tombol replay di TradingView.
#Bitcoin #BTC100K #Crypto #Altcoin Season# $USDT $GOLD $QQQX $BTC
[Analisis bagan Bitcoin 10 Agustus]
Bagan BTCUSD 30Menit
*Analisis saya dioptimalkan untuk TradingView.
Jika Anda menekan tombol replay, Anda dapat memeriksa pergerakan secara real-time.
-Strategi posisi long-
Di kiri bawah, saya telah menghubungkan strategi tersebut tepat ke titik entry posisi long di 64,7K yang dimasuki pada 7 Agustus, ditunjukkan oleh jari ungu.
*Strategi posisi long ditampilkan sebelum dan sesudah menyentuh zona teal nomor 1 di bagian atas.
1) Setelah mengonfirmasi sentuhan Zona 1 (Jari Teal), masukkan posisi short.
/ Beralih ke posisi long di $64.890,3 (Jari Merah) / Stop loss jika garis support hijau terputus.
2) $65.995,7 Long Position Target 1 -> Harga Target 2 yang Baik.
- Jika strategi berhasil, gunakan range 65,6K untuk masuk kembali ke posisi long.
3) Jika langsung turun tanpa menyentuh Zona 1 di bagian atas,
masukkan posisi long di Zona 2 ($64.705,8) di bagian bawah.
/ Stop loss jika garis support hijau terputus.
- Harap berhati-hati, karena jika garis support hijau terputus, bisa jatuh ke zona Bawah di bagian bawah.
- Berdasarkan pola, harus segera naik tanpa menyentuh Zona 2 agar tren naik tetap aman.
Saya memposting hasil analisis sebagai Komentar setiap hari.
Terima kasih.
(Anda dapat menemukan tautannya di profil saya.)
- Klik Follow untuk menerima informasi lebih cepat setiap hari.
- Cek hasilnya menggunakan tombol replay di TradingView.
#Bitcoin #BTC100K #Crypto #Altcoin Season# $USDT $GOLD $QQQX $BTC
Bagan BTCUSD 30Menit
*Analisis saya dioptimalkan untuk TradingView.
Jika Anda menekan tombol replay, Anda dapat memeriksa pergerakan secara real-time.
-Strategi posisi long-
Di kiri bawah, saya telah menghubungkan strategi tersebut tepat ke titik entry posisi long di 64,7K yang dimasuki pada 7 Agustus, ditunjukkan oleh jari ungu.
*Strategi posisi long ditampilkan sebelum dan sesudah menyentuh zona teal nomor 1 di bagian atas.
1) Setelah mengonfirmasi sentuhan Zona 1 (Jari Teal), masukkan posisi short.
/ Beralih ke posisi long di $64.890,3 (Jari Merah) / Stop loss jika garis support hijau terputus.
2) $65.995,7 Long Position Target 1 -> Harga Target 2 yang Baik.
- Jika strategi berhasil, gunakan range 65,6K untuk masuk kembali ke posisi long.
3) Jika langsung turun tanpa menyentuh Zona 1 di bagian atas,
masukkan posisi long di Zona 2 ($64.705,8) di bagian bawah.
/ Stop loss jika garis support hijau terputus.
- Harap berhati-hati, karena jika garis support hijau terputus, bisa jatuh ke zona Bawah di bagian bawah.
- Berdasarkan pola, harus segera naik tanpa menyentuh Zona 2 agar tren naik tetap aman.
Saya memposting hasil analisis sebagai Komentar setiap hari.
Terima kasih.
(Anda dapat menemukan tautannya di profil saya.)
- Klik Follow untuk menerima informasi lebih cepat setiap hari.
- Cek hasilnya menggunakan tombol replay di TradingView.
#Bitcoin #BTC100K #Crypto #Altcoin Season# $USDT $GOLD $QQQX $BTC
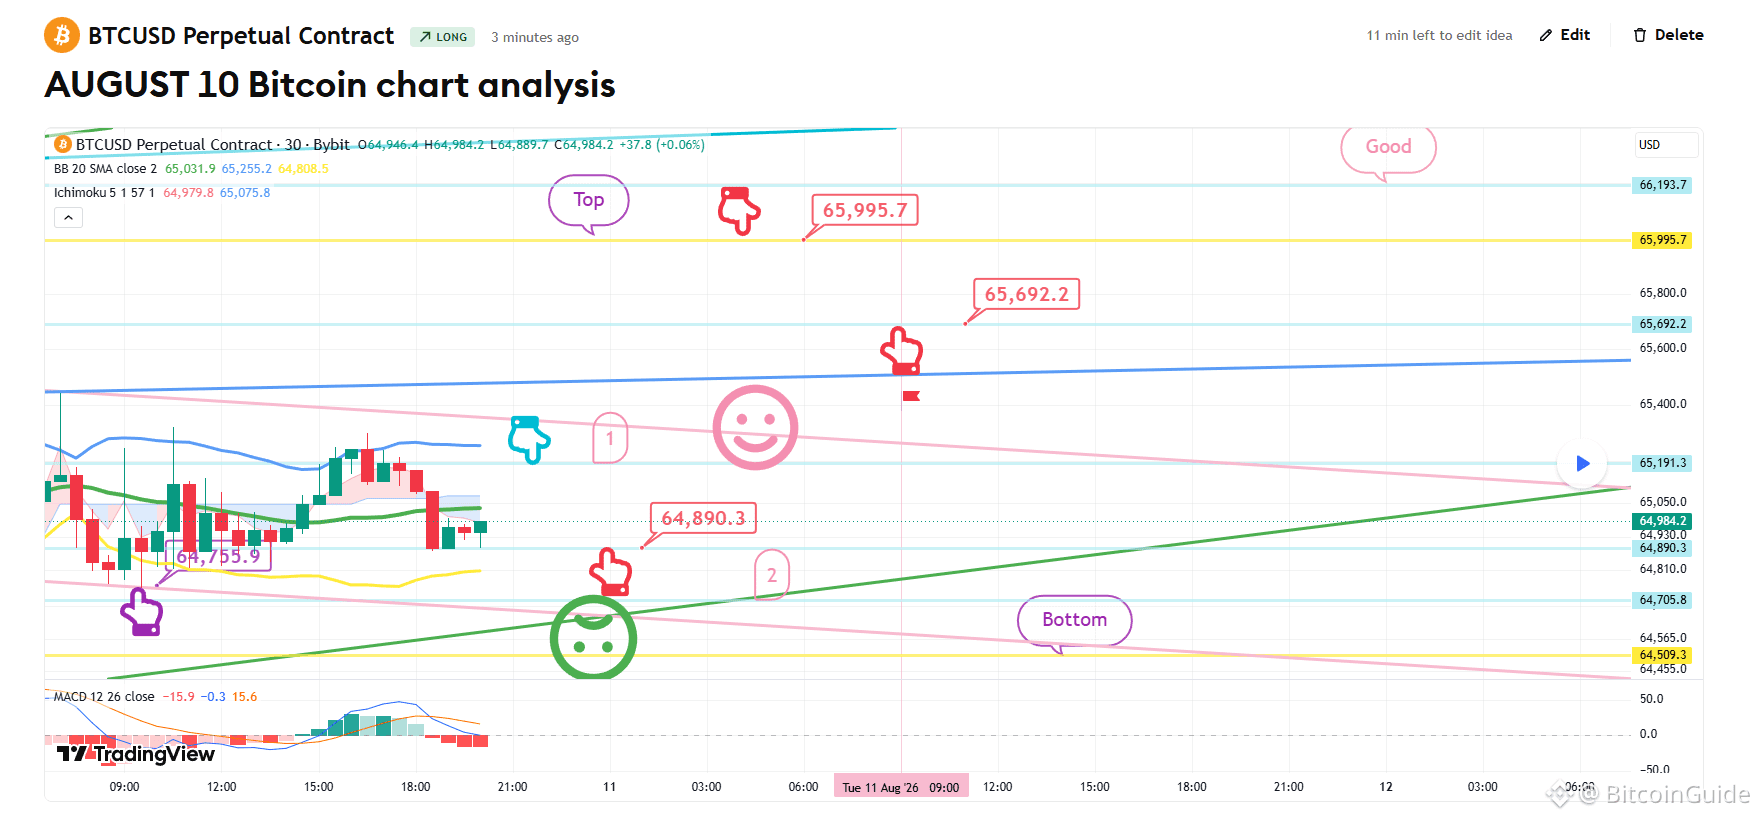
77
·
--
[Analisis chart Bitcoin 7 Agustus]
BTCUSD Grafik 30 Menit
*Analisis saya dioptimalkan untuk TradingView.
Jika Anda menekan tombol replay, Anda dapat memeriksa pergerakan secara real-time.
-Strategi posisi long-
*Strategi chase buy untuk posisi long mengikuti jalur pergerakan jari merah
1) Chase buy di $64.755,9 / Stop loss jika tembus di bawah garis support hijau
2) Posisi long $66.193,7 target pertama -> Harga target akhir yang ajaib pada akhir pekan
- Jika menembus level Ajaib tersebut, tren naik akan dimulai mulai minggu depan.
- Bagi yang mempertahankan posisi long di 64,4K, stop loss garis support hijau tetap sama.
- 65,9K adalah zona untuk memanfaatkan peluang masuk kembali posisi long.
Dari titik penembusan di bawah garis support hijau, harga dapat turun ke Bottom -> Zona 1 yang ditunjukkan di bagian bawah.
Saya memposting hasil analisis sebagai Komentar setiap hari.
Terima kasih.
(Anda bisa menemukan tautannya di profil saya.)
- Klik Follow untuk menerima informasi lebih cepat setiap hari.
- Cek hasilnya menggunakan tombol replay di TradingView.
#Bitcoin #BTC100K #Analisis Harga BTC# #Crypto $ALT $USDT $BTC $XRP $ETH
[Analisis chart Bitcoin 7 Agustus]
BTCUSD Grafik 30 Menit
*Analisis saya dioptimalkan untuk TradingView.
Jika Anda menekan tombol replay, Anda dapat memeriksa pergerakan secara real-time.
-Strategi posisi long-
*Strategi chase buy untuk posisi long mengikuti jalur pergerakan jari merah
1) Chase buy di $64.755,9 / Stop loss jika tembus di bawah garis support hijau
2) Posisi long $66.193,7 target pertama -> Harga target akhir yang ajaib pada akhir pekan
- Jika menembus level Ajaib tersebut, tren naik akan dimulai mulai minggu depan.
- Bagi yang mempertahankan posisi long di 64,4K, stop loss garis support hijau tetap sama.
- 65,9K adalah zona untuk memanfaatkan peluang masuk kembali posisi long.
Dari titik penembusan di bawah garis support hijau, harga dapat turun ke Bottom -> Zona 1 yang ditunjukkan di bagian bawah.
Saya memposting hasil analisis sebagai Komentar setiap hari.
Terima kasih.
(Anda bisa menemukan tautannya di profil saya.)
- Klik Follow untuk menerima informasi lebih cepat setiap hari.
- Cek hasilnya menggunakan tombol replay di TradingView.
#Bitcoin #BTC100K #Analisis Harga BTC# #Crypto $ALT $USDT $BTC $XRP $ETH
BTCUSD Grafik 30 Menit
*Analisis saya dioptimalkan untuk TradingView.
Jika Anda menekan tombol replay, Anda dapat memeriksa pergerakan secara real-time.
-Strategi posisi long-
*Strategi chase buy untuk posisi long mengikuti jalur pergerakan jari merah
1) Chase buy di $64.755,9 / Stop loss jika tembus di bawah garis support hijau
2) Posisi long $66.193,7 target pertama -> Harga target akhir yang ajaib pada akhir pekan
- Jika menembus level Ajaib tersebut, tren naik akan dimulai mulai minggu depan.
- Bagi yang mempertahankan posisi long di 64,4K, stop loss garis support hijau tetap sama.
- 65,9K adalah zona untuk memanfaatkan peluang masuk kembali posisi long.
Dari titik penembusan di bawah garis support hijau, harga dapat turun ke Bottom -> Zona 1 yang ditunjukkan di bagian bawah.
Saya memposting hasil analisis sebagai Komentar setiap hari.
Terima kasih.
(Anda bisa menemukan tautannya di profil saya.)
- Klik Follow untuk menerima informasi lebih cepat setiap hari.
- Cek hasilnya menggunakan tombol replay di TradingView.
#Bitcoin #BTC100K #Analisis Harga BTC# #Crypto $ALT $USDT $BTC $XRP $ETH
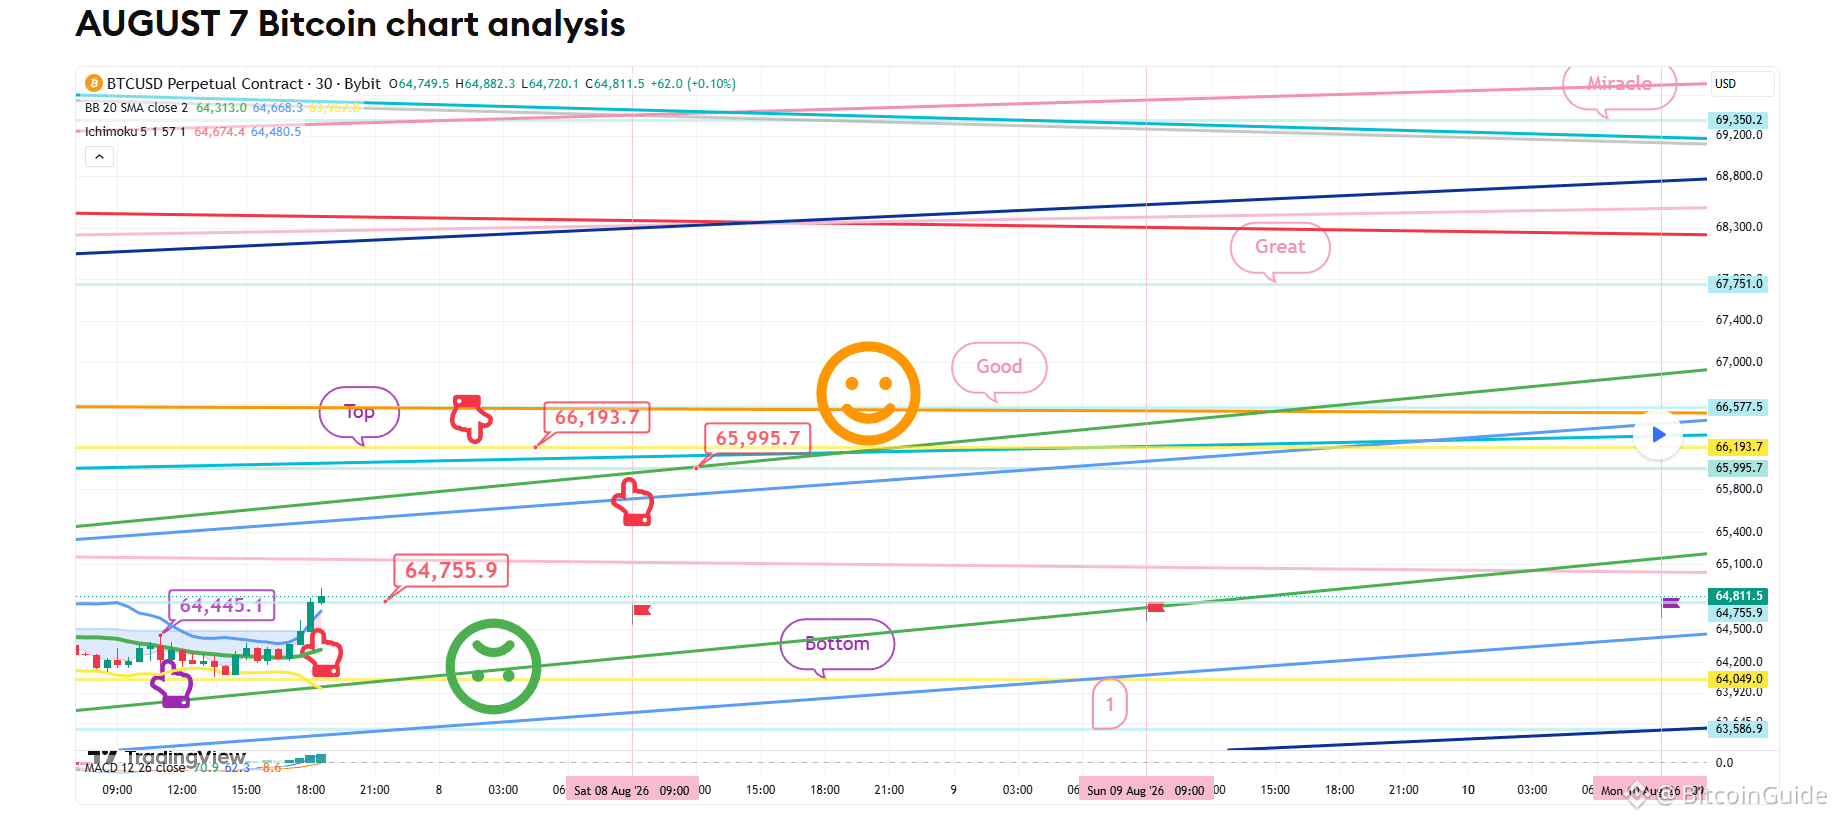
70
Masuk untuk menjelajahi konten lainnya
Bergabunglah dengan pengguna kripto global di Binance Square
⚡️ Dapatkan informasi terbaru dan berguna tentang kripto.
💬 Dipercayai oleh bursa kripto terbesar di dunia.
👍 Temukan wawasan nyata dari kreator terverifikasi.
Email/Nomor Ponsel
Topik Sedang Tren
US10YearYieldNears5.3%
1,054 penayangan
63 Berdiskusi
#US10YearYieldNears5.3%
📊 HASIL OBLIGASI MENCAPAI PUNCAK DALAM BEBERAPA TAHUN!
Imbal hasil US Treasury 10 tahun yang mendekati 5,3% sedang menjadi topik utama di pasar keuangan global. Kenaikan imbal hasil mencerminkan perubahan ekspektasi terkait inflasi, pertumbuhan ekonomi, dan kebutuhan pinjaman pemerintah.
🌍 Yang membuat situasi ini semakin menarik adalah dampaknya terhadap sentimen kripto. Imbal hasil obligasi yang lebih tinggi dapat menurunkan permintaan untuk aset yang lebih berisiko, sementara minat institusional yang berkelanjutan bisa memberikan dukungan bagi pasar kripto.
₿ Pertanyaannya: Apakah Bitcoin bisa mempertahankan kekuatannya ketika pasar keuangan tradisional menghadapi biaya pinjaman yang terus meningkat?
💡 Terkadang, sinyal pasar terbesar justru datang dari luar pasar kripto.
#Bitcoin #CryptoMarket #US10YearYield #TreasuryYields #BTC $BTC
PALASH5
·Disukai 0 Kali
·706 penayangan
BitcoinETFsTake$6.34BillionInQ3
210 penayangan
14 Berdiskusi
KoreaProposesTokenizingStocksAndBonds
23,126 penayangan
341 Berdiskusi