[September 29 Bitcoin chart analysis]
BTCUSD 30Min Chart
*My analysis is optimized for TradingView.
If you press the replay button, you can check real-time movements.
- Neutral strategy-
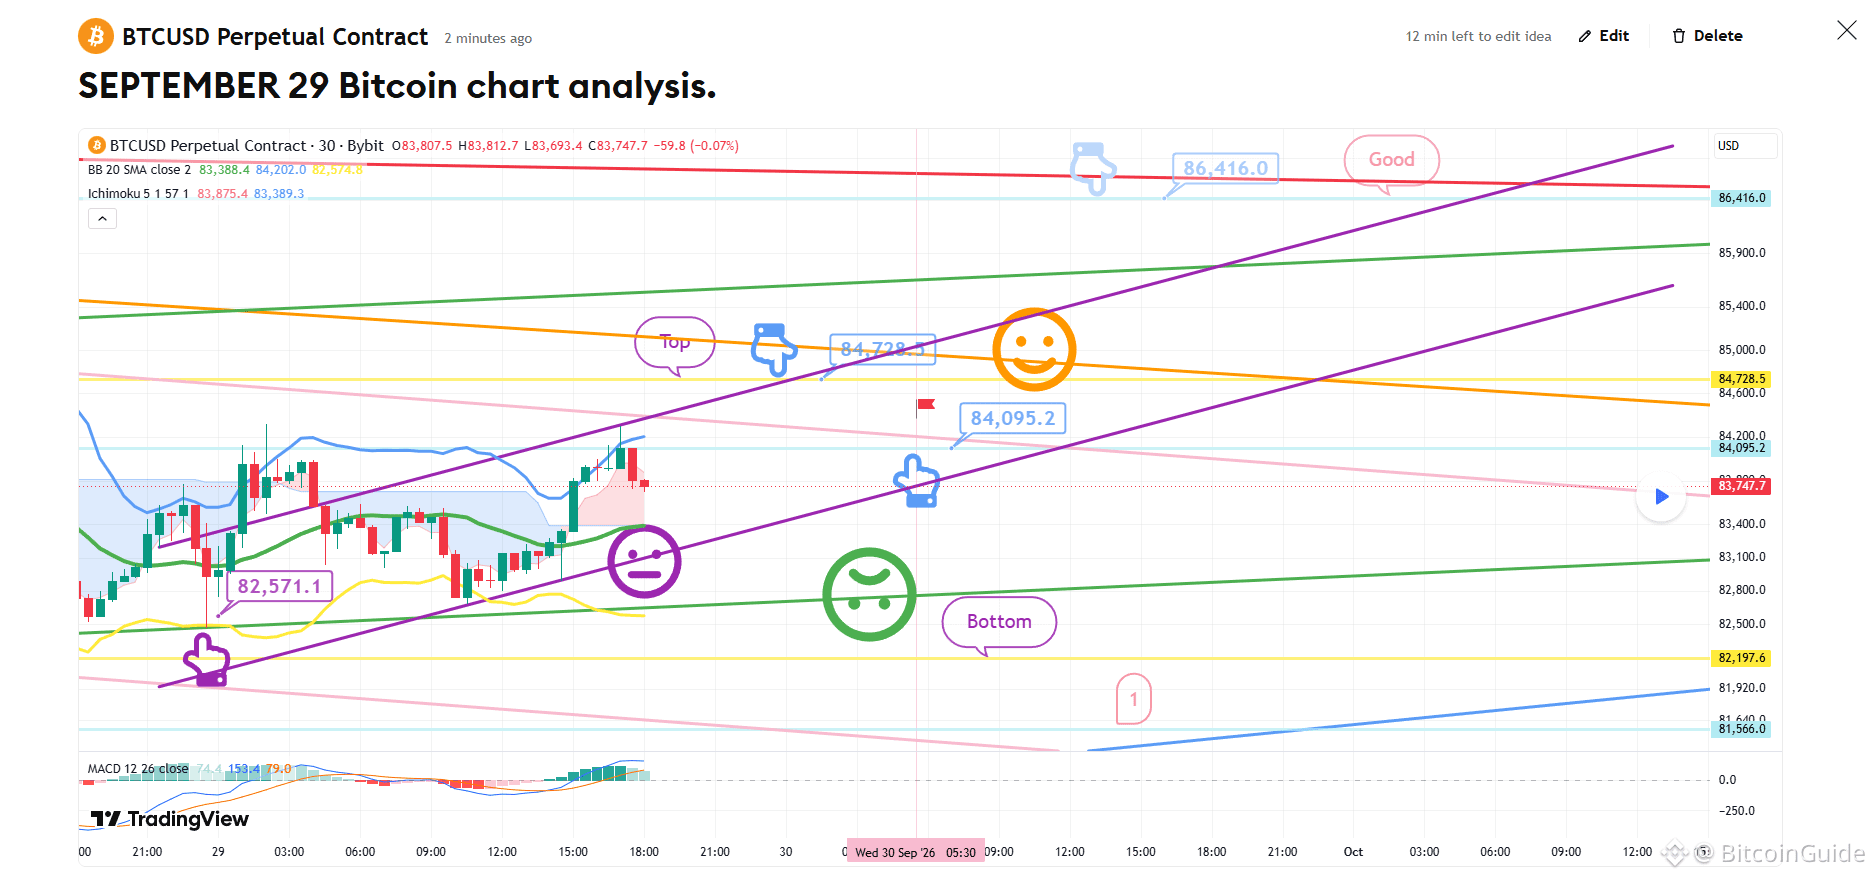
This is the 30-minute Bitcoin chart.
At the bottom left, indicated by a purple finger,
I have maintained the strategy for the long position entered on the 28th at $82,571.1.
*If the price follows the path of the light blue finger:
A two-way neutral strategy
1) Top zone (light blue finger):
Short position entry at $84,728.5 / Stop-loss if the orange resistance line is broken.
2) Re-entry zone for long position at $84,095.2 / Stop-loss if the purple support line is broken.
3) Final target zone (post-tomorrow): $86,416
/ Watch for a confirmed MACD "death cross" on the daily chart.
4) If the purple support line is broken,
there is a possibility of sideways movement or further decline.
For those currently holding positions above $82.5K,
it is advisable to set a stop-loss based on a break of the final green support line.
If the green support line is broken,
the price could drop to the "Bottom" zone marked at the lower end (down to Zone 1),
so please exercise caution.
As there is currently a strong correlation ("forced coupling") with the Nasdaq,
please keep a close eye on Nasdaq movements.
I post the analysis results as a Comment every day.
Thank you.
(You can find the link on my profile.)
- Click Follow to receive faster information every day.
- Check the results using the replay button on TradingView.
#BTC Price Analysis# #Crypto #Gold #Altcoin Season# $XRP $USDC $USDT $BTC
BTCUSD 30Min Chart
*My analysis is optimized for TradingView.
If you press the replay button, you can check real-time movements.
- Neutral strategy-
This is the 30-minute Bitcoin chart.
At the bottom left, indicated by a purple finger,
I have maintained the strategy for the long position entered on the 28th at $82,571.1.
*If the price follows the path of the light blue finger:
A two-way neutral strategy
1) Top zone (light blue finger):
Short position entry at $84,728.5 / Stop-loss if the orange resistance line is broken.
2) Re-entry zone for long position at $84,095.2 / Stop-loss if the purple support line is broken.
3) Final target zone (post-tomorrow): $86,416
/ Watch for a confirmed MACD "death cross" on the daily chart.
4) If the purple support line is broken,
there is a possibility of sideways movement or further decline.
For those currently holding positions above $82.5K,
it is advisable to set a stop-loss based on a break of the final green support line.
If the green support line is broken,
the price could drop to the "Bottom" zone marked at the lower end (down to Zone 1),
so please exercise caution.
As there is currently a strong correlation ("forced coupling") with the Nasdaq,
please keep a close eye on Nasdaq movements.
I post the analysis results as a Comment every day.
Thank you.
(You can find the link on my profile.)
- Click Follow to receive faster information every day.
- Check the results using the replay button on TradingView.
#BTC Price Analysis# #Crypto #Gold #Altcoin Season# $XRP $USDC $USDT $BTC