
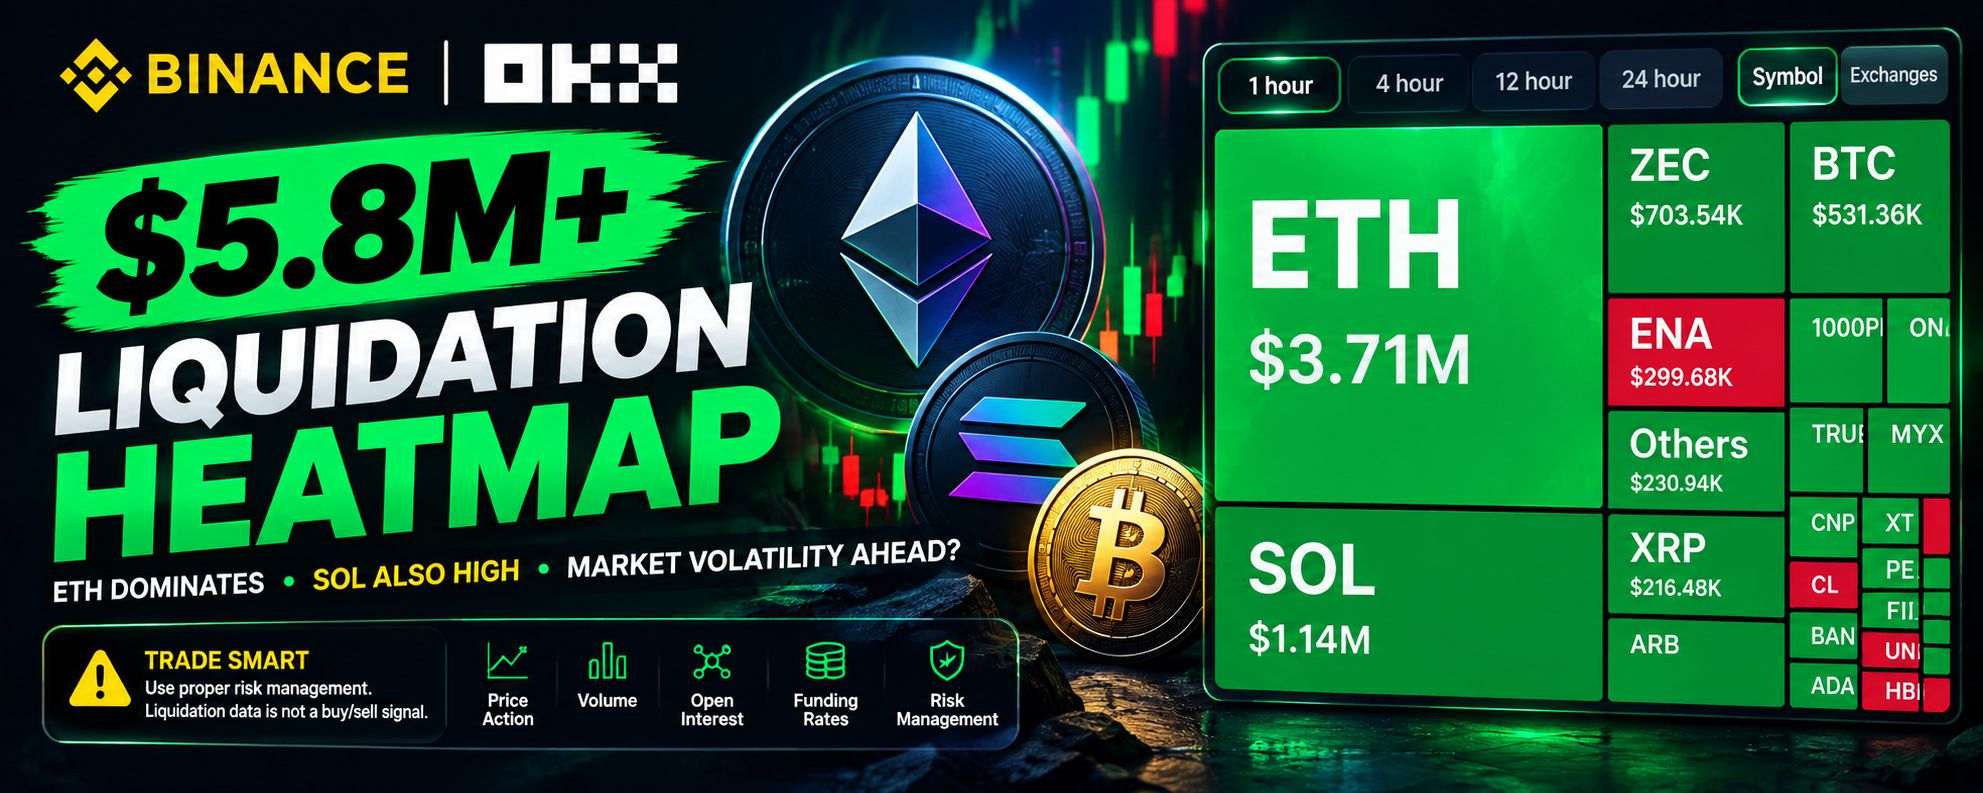

The latest 1-hour liquidation heatmap shows significant liquidation activity across the crypto market, with Ethereum standing out as the largest concentration.
🔹 $ETH : $3.71M
🔹 $SOL : $1.14M
🔹 $ZEC : $703.54K
🔹 BTC: $531.36K
🔹 ENA: $299.68K
🔹 XRP: $216.48K
🔹 Others: $230.94K
ETH alone represents the biggest liquidation cluster on this heatmap, while SOL is also showing more than $1 million in liquidation activity.
This kind of data can be useful for traders because large liquidation zones may highlight areas where volatility and rapid price movements could occur. However, a liquidation heatmap does not predict direction by itself.
Traders should combine liquidation data with price action, volume, market structure, open interest and funding rates before entering a position.
⚠️ Risk Reminder: Liquidation data can change quickly. Always use proper risk management and avoid entering a trade based on a single indicator.
What do you think — will ETH see another volatility spike? 👇